Article

On-Demand Phase Control of a 7-Fiber Amplifiers Array with Neural Network and Quasi-Reinforcement Learning

by
Maksym Shpakovych
1,
Geoffrey Maulion
1,
Alexandre Boju
1,2,
Paul Armand
1,
Alain Barthélémy
1,
Agnès Desfarges-Berthelemot
1 and
Vincent Kermene
1,*
1
XLIM, Faculté des Sciences et Techniques, Université de Limoges-CNRS UMR n°7252 123 Ave. A. Thomas, F-87060 Limoges, France
2
CILAS Ariane Group, 8 Avenue Buffon, CS16319, CEDEX 2, F-45063 Orléans, France
*
Author to whom correspondence should be addressed.
Photonics 2022, 9(4), 243; https://doi.org/10.3390/photonics9040243
Submission received: 14 March 2022 / Revised: 31 March 2022 / Accepted: 1 April 2022 / Published: 6 April 2022
(This article belongs to the Special Issue Various Applications of Methods and Elements of Adaptive Optics)

Abstract

:
We report a coherent beam combining technique using a specific quasi-reinforcement learning scheme. A neural network learned by this method enables the tailoring and locking of a tiled beam array on any phase map. We present the experimental implementation of on-demand phase control by a neural network in a seven-fiber laser array. This servo loop needs only six phase corrections to converge to the desired phase set at any profile, with a bandwidth higher than 1 kHz. Moreover, we demonstrate the dynamical feature of adaptive phase control, performing sequences of controlled phase sets. It is the first time, to the best of our knowledge, that an actual array of seven-fiber amplifiers has been successfully phase-locked and controlled by machine learning.

1. Introduction

Coherent beam combining (CBC) of multiple emitters represents a key versatile technique in providing high average power or high-energy short pulses while maintaining beam quality [1]. The CBC architectures are designed to handle the laser power distributed over a set of amplification channels arranged in parallel. Due to thermal effects and mechanical instabilities, each channel phase of the piston type must be adjusted over time to maintain the combining efficiency and wavefront quality of the combined beam. There are two methods of performing the combining step, such as the tiled-aperture and filled-aperture techniques. In the first configuration, the amplified beams are placed side by side to form a kind of large synthetic pupil and are then coherently overlapped in the far field. In the second configuration, they are superimposed by splitters or by a diffractive optical element (DOE) in the near field to obtain a single high-power beam. The tiled-aperture arrangement offers the opportunity to dynamically shape the synthetic wavefront by tuning the piston phase of each element of the array to a desired value. This dynamic shaping could be useful particularly for compensation of phase aberration due to atmospheric perturbations in the context of directed energy production [2,3]. CBC was also recently investigated to shape the far field pattern of a high-power beam array. In particular, T. Hou et al. numerically validated the generation of orbital angular momentum (OAM) laser beams in a tiled-aperture architecture [4]. In 2021, M. Veinhard et al. demonstrated OAM beam shaping by tailoring the phase of 61 beams in the femtosecond regime [5]. These specific modes, which preserve their ring intensity profile during propagation, are of interest in many areas such as particle manipulation and free-space propagation. Moreover, real-time control of intensity shape at focus by CBC at a high-power level can optimize the performance of material processing.
An active coherent combining device with fiber amplifiers is based on a master oscillator power amplifier (MOPA) configuration with multiple parallel fiber amplifiers that undergo internal and environmental perturbations. The phase fluctuation compensation at the output of the fiber array is realized by electro-optic modulators which command comes from direct measurements of the current output phase state [6,7], or by correcting the phase in an iterative way to optimize a given parameter [8,9,10,11]. In the latter case, the loop performing the phase correction includes an optimization algorithm such as the popular stochastic parallel gradient-descent (SPGD) method or the alternating projection (AP) method [12,13,14]. With the SPGD method, as the beams count increases, the correction bandwidth drops significantly. The AP method, on the contrary, is well suited to the phase-lock of a wide beam array at the expense of a large number of detectors. A third method, based on neural network and deep learning, was recently investigated.
Among the many applications of neural networks (NN) in optics, few of them recently published dealt with CBC [15,16,17,18,19,20,21,22]. In most cases, the papers reported numerical studies. Some contributions investigated NN for direct, one-step, phase recovery of the beam array from scattered patterns through a diffuser [17] or through a diffractive optical element DOE [20]. In the latter case, an NN with only two layers provided accurate phase recovery but in a limited phase error range. Despite it being trained in a limited range, once applied in a feedback system for phase correction, the technique was able to compensate for a full range π ,   π of random initial phase errors and to reach phase-locking. It required approximately 40 iterations on average to lock a 9 × 9 array, which was demonstrated to be ten times faster than SPGD optimization. A reinforcement learning method was also considered as a second option for beam combining with NN [15,19,21]. In a first experiment with a two-fiber interferometer [15], the authors demonstrated the technique could be as efficient as a standard PID (proportional integrator differentiator) controller or as SPGD. Previous simulations on deep reinforcement learning with a deep deterministic policy gradient have used the far field pattern as input to the NN. Locking of the phase was shown to require 6 to 12 iterations for a 7-beam array [19]. However, they raised issues regarding scalability for large arrays in particular due to the dimensionality of the training data set, a loss in accuracy and the duration of the training. The approach offers the additional capability of tailoring the array far field, such as, for the generation of orbital angular momentum beams (OAM) [18]. In a recent publication [22], we proposed a third option, called quasi-reinforcement learning (QRL). Training of the NN for phase-locking was carried out specifically for operation in a loop with a given number of iterations. Simulations and a proof of principle experiment demonstrated efficient and fast (six iterations) phase-locking of a 100-beam array.
In this paper, we report first a new version of this machine-learning scheme that provides access to instantaneous tailoring and locking of a tiled beam array on any phase map. Then, we present experiments of its implementation in a seven-fiber laser array. It is the first time, to the best of our best knowledge, that an actual array of fiber amplifiers has been successfully phase-locked and controlled by an NN.
In the following paragraph, we first briefly remind the reader of the principle of the approach, as detailed in [22]. Then, we describe the improved version of the NN implemented in the QRL process, which allows real-time adaptive changes of the desired phase map for the laser beam array. Finally, we present an experimental phase control from the QRL approach in the dynamic environment of a fiber laser array. This shows that the iterative phase-locking process converges to any static or dynamic desired phase relationship with a correction loop bandwidth over 1 kHz.

2. Neural Network in a Phase Reduction Loop with Quasi-Reinforcement Learning

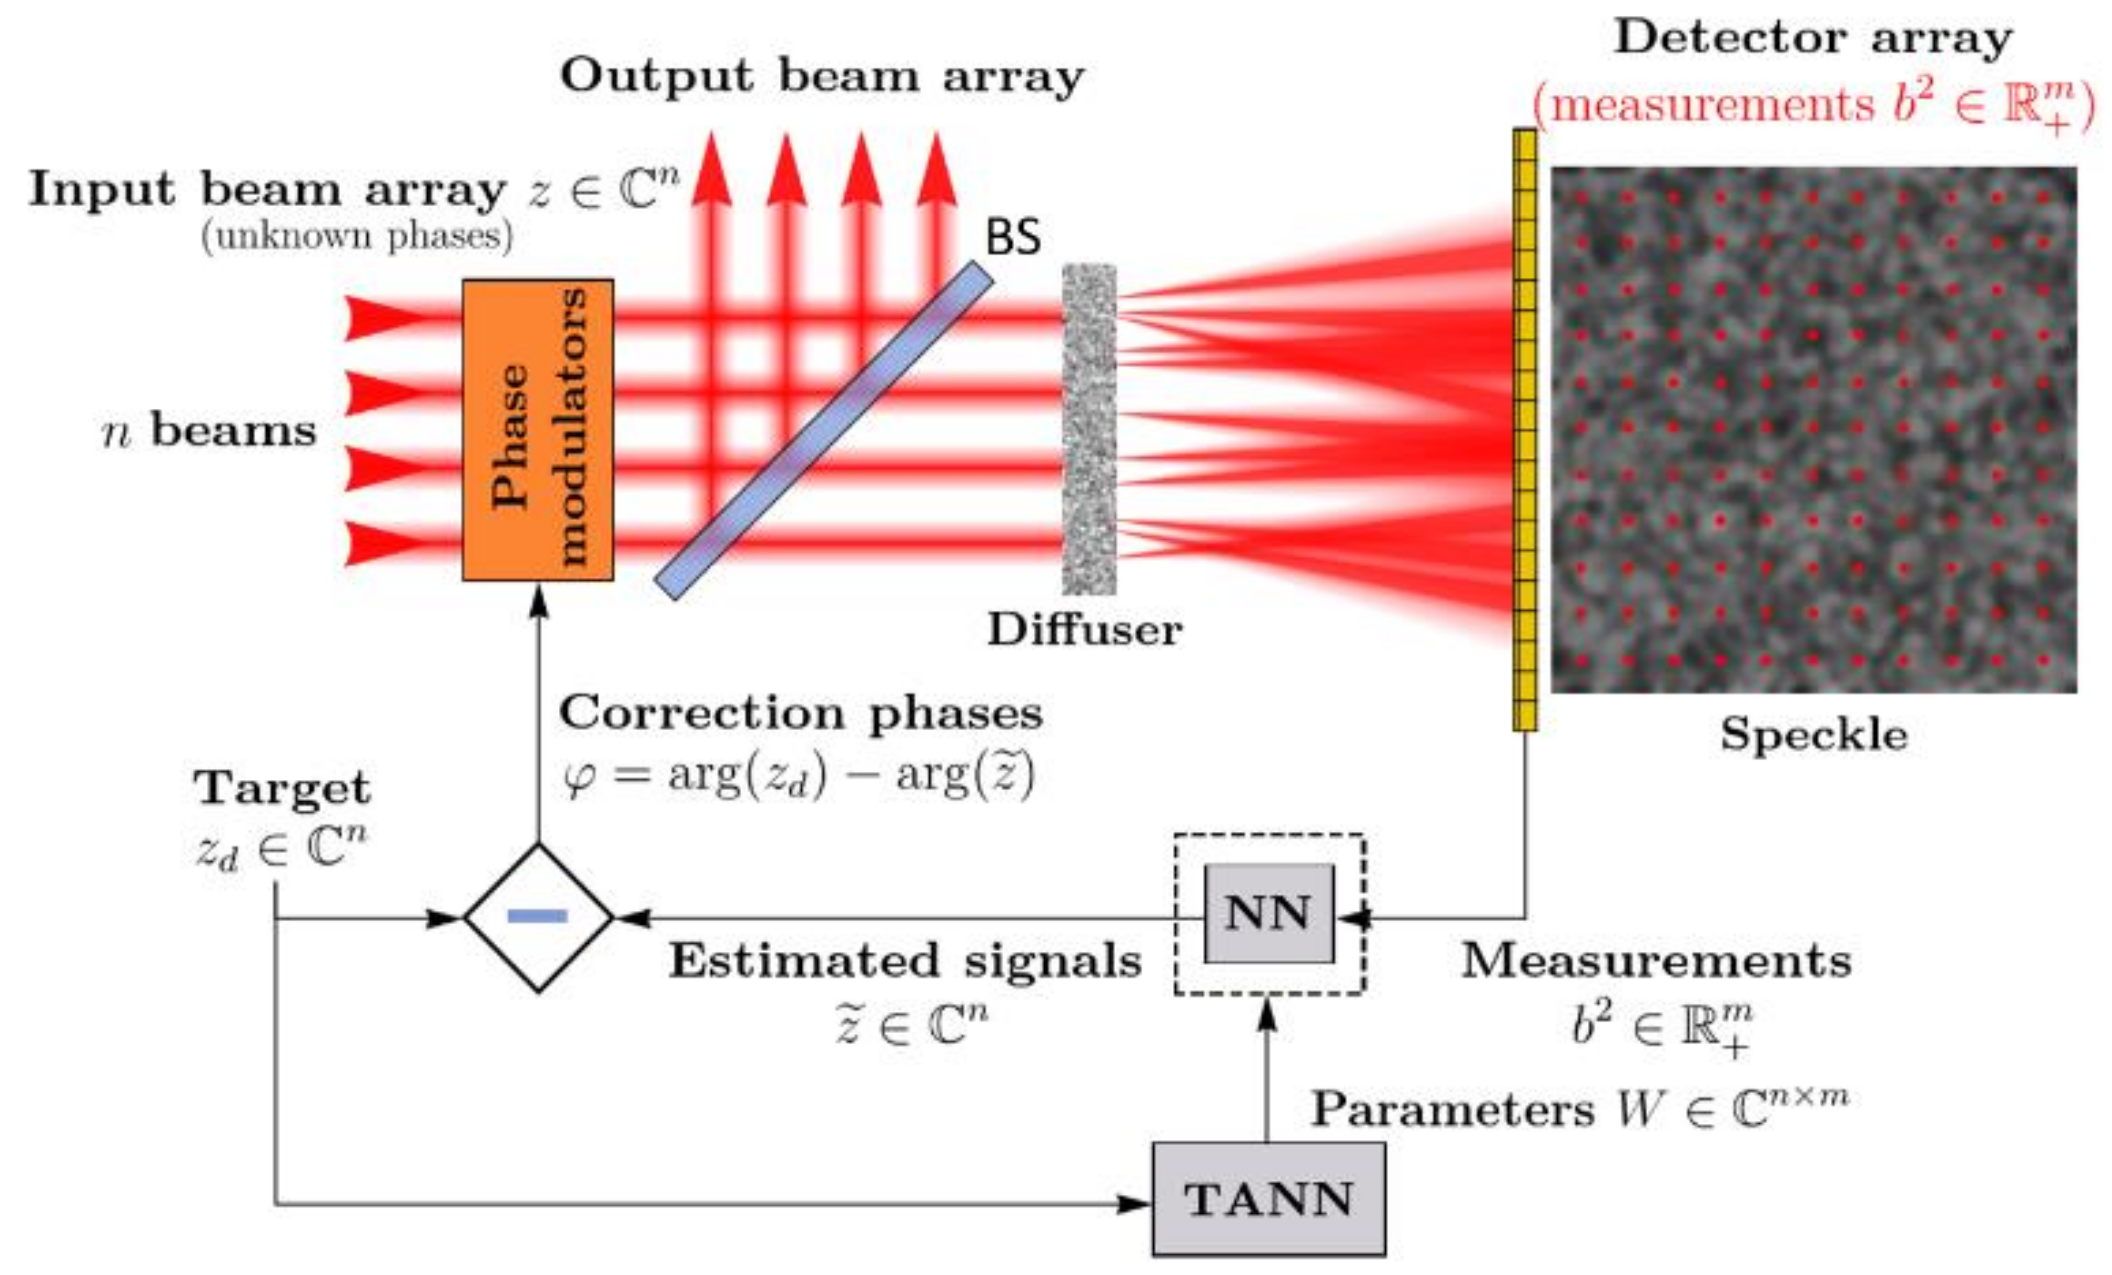
The system we have previously proposed to control the phase of a laser beam array [22] (laser fields of complex amplitude z with unknown phases) is described on Figure 1. It is composed of (i) a diffuser for mapping individual phases into intensity through scattering, (ii) a photo-detector array, which converts optical intensity into voltage, (iii) an NN, which processes the electrical signal and provides correction commands to an array of phase modulators. The NN serves to perform the inverse of the transformation achieved by the diffuser. From sparse samples (measurements b ² ) of the scattered intensity pattern, it predicts a value z ˜ of the individual laser fields in the array. Knowledge of the presumed phase set arg z ˜ and of the desired phase set arg z d then permits computation of the correction = arg z d arg z ˜ , which serves as a command to the phase modulators. The high performance of the scheme, as demonstrated numerically and in a proof of principle experiment, relies on its specific QRL training. It consists in an optimization of the NN parameters, considering the looped operation of the system for a fixed given number of iterations T . For each round in the loop, an optimization is achieved in order to obtain the highest reward, i.e., the lowest difference between the phases after correction and the desired phases. QRL also bears a role in the learning of a recurrent neural network, although with some peculiarities. First experiments [22] showed that, unlike NN learned for direct (one-step) phase retrieval [18,20], the NN, specifically trained for phase correction in an error reduction loop, remains efficient and accurate for an array with a large number of beams (100), and for correction of phase angle on the full circle [−π,+π]. To preserve accuracy, the total number of iterations in the loop during training must be empirically determined, as it evolves slightly owing to the array size and to the number of intensity samples in the diffraction pattern. Most of the time it was close to T = 6. Once in operation, the trained NN adjusts the initial distorted phase front onto the desired one after a number of corrections less than, or equal to maximum of six.

3. Target Adaptive NN with QRL Process

With the previous NN version [22], the laser beam array could be locked onto the in-phase state or any other arbitrary target phase set. However, the NN must be trained with the desired target phase set which makes a fast change of target unlikely due to the duration of the training. This explains the reason behind our proposal of implementing a target adaptive neural network (TANN) in the QRL scheme to circumvent this drawback. With this new version, the target phase set can be changed on-demand during laser system operation.
The idea is to build the network TANN that will compute the set of parameters of the NN for use in the phase-lock loop. TANN takes the vector of target phases as an input and returns the weights of the NN. Each time one modifies the desired phase profile, the NN parameters are computed again. The calculation is extremely fast (matrix vector product) and thus offers almost real-time adaptive wavefront shaping. The new adaptive phase-locking and phase-profiling system can be schematically described as shown in Figure 2.
TANN takes as an input, a vector z d n of laser fields with target phases and returns the set of parameters that is used to define the correction model for the given target. We recall that in [22] we used NN b = W 2 W 1 b + β 1 + β 2 as a correction model fed by the square root of the measurements b ² , where the set of parameters were W 1 4 n × m , W 2 2 n × 4 n , β 1 4 n , β 2 2 n for n beams and m > n measurements. In this context, TANN should return a real vector of dimension 4 n m + 8 n 2 + 6 n , which is then split into several parts to define W 1 , 2 , β 1 , 2 .
This means that TANN itself has a minimum of O n 3 parameters to train. This fact requires a reduction in the number of parameters in a correction NN as much as possible. Note, that the NN in [22] is a simple affine transform Wb + β , where W = W 2 W 1 and β = W 2 β 1 + β 2 . This smaller form decreases the number of parameters in the NN model to 2 n m + 2 n . It was also observed empirically that bias β did not have a great impact on the NN’s correction capability. Let us consider a new correction model of the form NN b = W b . However, instead of using the real matrix W 2 n × m , which computes real and imaginary parts separately, we change it to a fully complex form W n × m . The reason behind why this smaller model was not used in [22], but had similar numerical properties, was that it required more time to train the parameters, which represents an important factor when working with 100 beams. The architecture of TANN is a simple linear map U from the vector of desired laser fields set z d n to the vector of NN parameters, the output of which is reshaped into a matrix T A N N z d = Reshape U z d , where Reshape : m n n × m and trainable parameters U n m × n . The learning process is similar to [22] and is presented in Algorithm 1, where the reward function is a resemblance parameter between the actual array phase a r g z and the computed recovered array phase a r g z ˜ . It is defined as:
R z , z ˜ = z , z ˜ 2 z , z ˜ 2
In which the maximum equals 1, if and only if a r g z = a r g z ˜ reaches up to a constant. In the framework of laser phase-locking, R z , z ˜ is equal to the phasing quality Q , also called combining efficiency, which measures how close the controlled array wavefront is to uniformity. It is usually assumed that in practice an RMS deviation of λ / 30 is a very good value, which corresponds to Q = 0.96 [23]. Therefore, this value fixes the minimum reward to reach during the training of the TANN.
As with the same concept seen in [22], the NN, which now depends on the target, computes a correction as a complex vector instead of a vector of phases. To accelerate the learning, we use a batch of targets z d N × n and signals z N × P × n , where N and P denote positive natural numbers. The batch of the form z N × P × n means that we generate P initial signals to correct for each of the N targets during training. Note, that N and P are set to 1 in the Algorithm 1 to simplify the notation.
Algorithm 1: Quasi-reinforcement learning algorithm for TANN
 Input: Measurement model: n + m , reward function R : n × n 0 , 1
Output:Trained target adaptive neural network TANN: m n × n × n n × m
  • Initialize network T A N N with random initial weights U m n × n
  • Set reward r = 0 ;
  • While reward r < 0.96 do
  • Generate a vector z n of random signals
  • Generate a vector z d n of target signals
  • Repeat T times
    • Measure intensities square root b + m of z by M.
    • Compute matrix W n × m for z d by TANN to define NN.
    • Compute recovered field z ˜ n from amplitudes b by NN.
    • Compute reward r = R z , z ˜ .
    • Update parameters of TANN to maximize r.
    • Perform a phase correction z = z e i arg z d arg z ˜ .
  • Return trained TANN

4. Simulations

Simulations were performed for N = 1024 , P = 256 , T = 8 with a maximum of 5000 learning epochs. Signals z and targets z d were generated as complex vectors with uniformly distributed phases on π , π and unit amplitudes. The initial values in U m n × n were distributed by standard normal law. The step 6a of Algorithm 1 was performed by means of a mathematical model, instead of a direct usage of the experimental setup, which accelerated the learning process significantly. The mathematical model could be either a transmission matrix model T M or another neural network, which was referred to as NN-G in [22]. Computations were conducted on a computer using Windows 10 OS with GPU—NVIDIA GTX 1660 Ti, CPU—AMD Ryzen 5 3600 X 6-Core Processor and RAM—32 GB. To implement and train the TANN model, TensorFlow 2.5.0 library was used together with Python 3.7 language. TensorFlow encapsulates the interaction with GPU, thus we made no additional effort for parallelization. No multicore parallelization was required. Moreover, MATLAB graphical program was created to interact with the experimental setup. This program used one process for this goal.
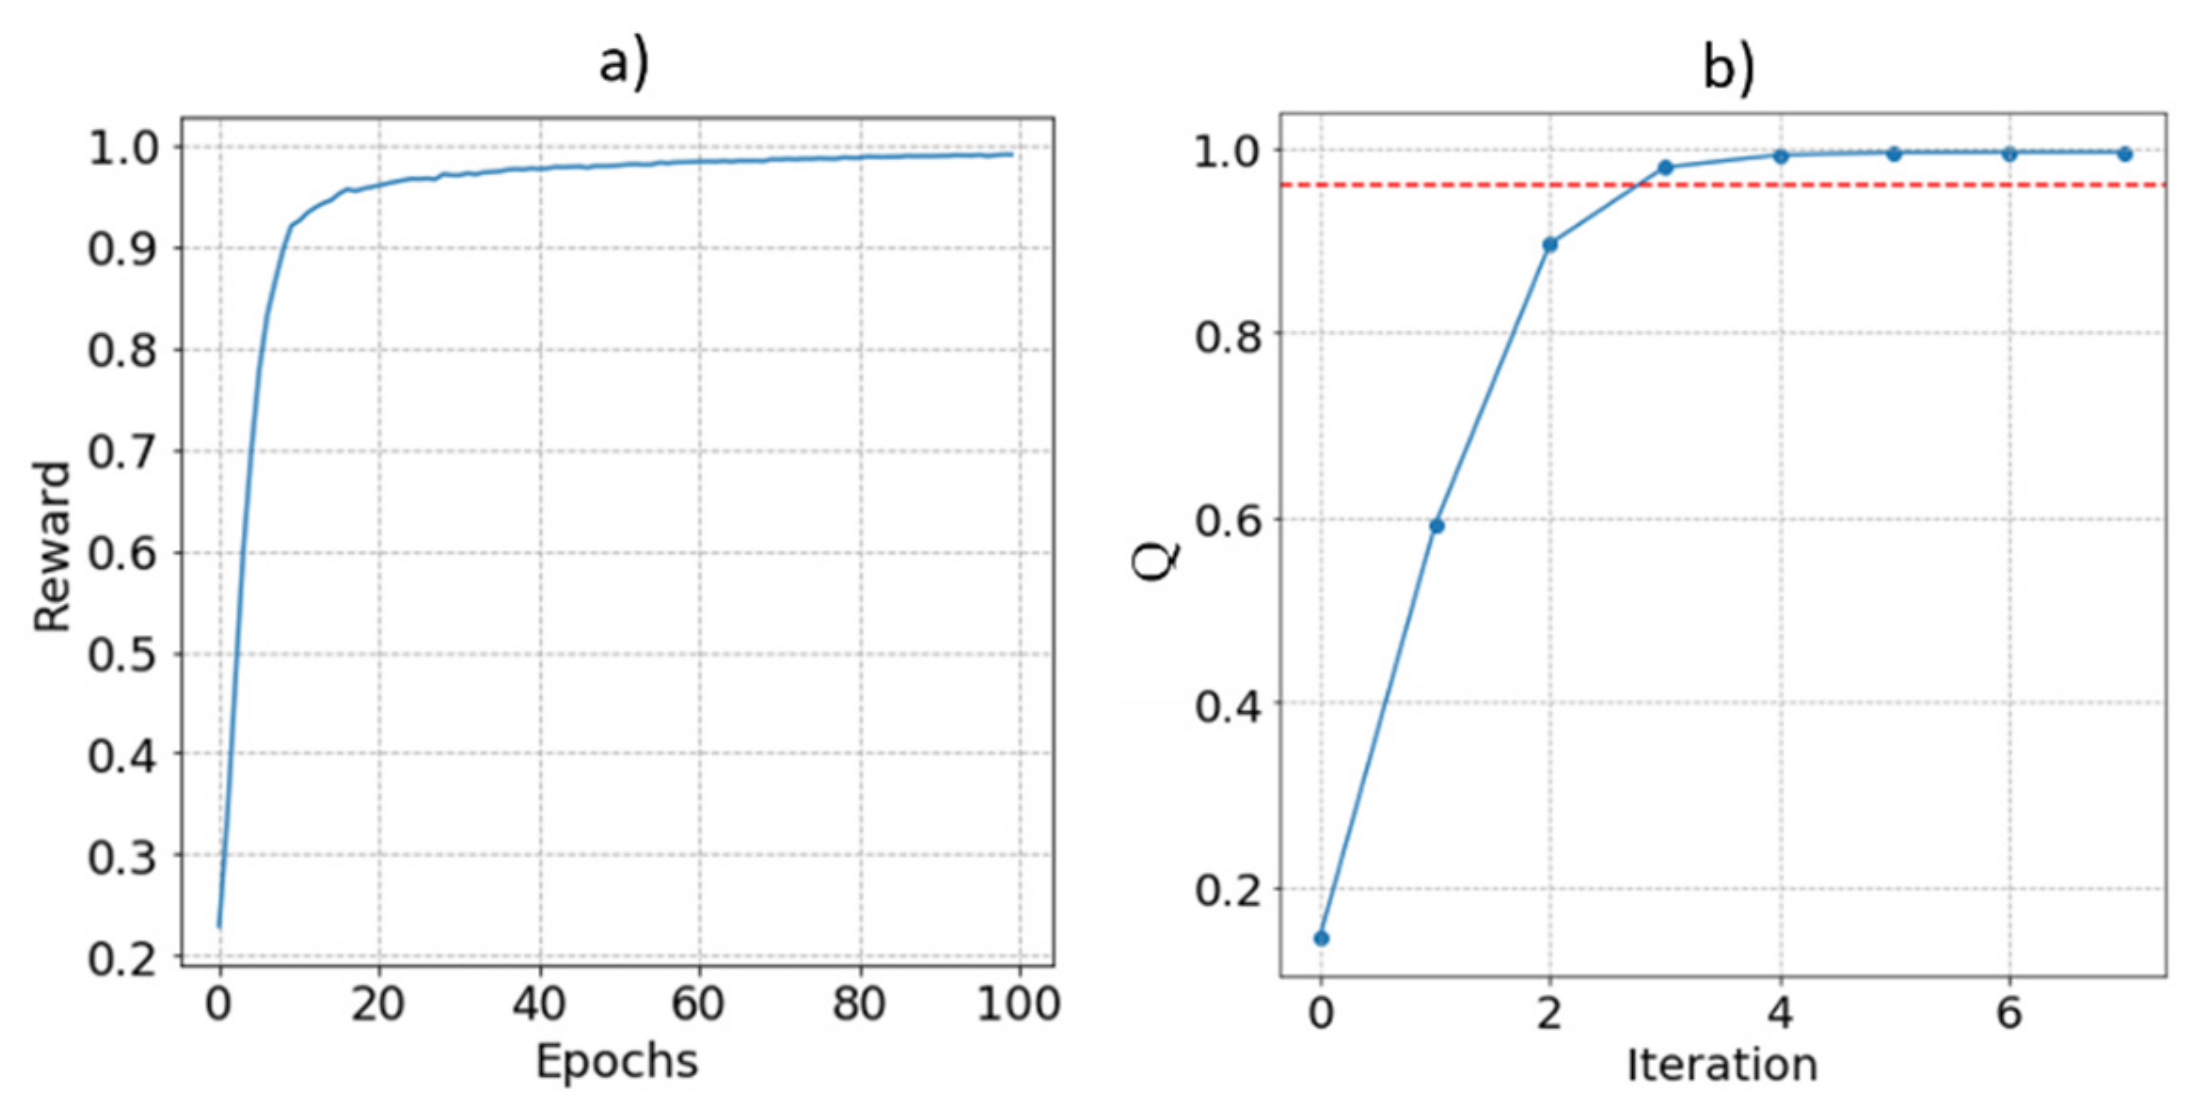
As a particular example similar to the experiments reported below, we show in Figure 3a the evolution of the reward during training in the case of a 7-beam array with 70 measurements in the scattered pattern. The reward evolves quickly and continuously toward its maximum value in about 100 epochs. This means that the phasing quality reaches its maximum at any desired phase profile. The training required about 13 s. The phase correction process using this trained TANN shows (Figure 3b) that an average of only three iterations was enough to reach the 0.96 reward limit in a noiseless numerical study.
To obtain a full picture regarding the capabilities of TANN, several additional information slices are presented in Figure 4. It was numerically observed that in order to achieve a sufficiently high reward, say r > 0.96 , there is a minimal required ratio m / n for different n . When the beam count varies from 4–20, the required m / n ratio increases from 4–12. Thus, it is important to show a minimal required ratio m / n for different n to achieve a sufficiently high reward. Different TANNs were trained for the various number of beams n 4 , 6 , 8 , 10 , 12 , 14 , 16 , 20 and the different ratios between the number of measurements and the number of beams m / n 2 , 4 , 6 , 8 , 10 , 12 , 14 , 16 , 18 , 20 . The maximal achievable reward was recorded and visualized as a heat map in Figure 4a, with the corresponding relative training time shown in Figure 4b. The maximal achievable reward is obtained by solving 1000 phase correction problems with different targets for each combination of n and m / n , and computing 95% quantile of the rewards at the last correction. This statistic reveals the minimal reward, which was obtained during the solving of 95% of test problems.
The red line in Figure 4a reveals the dependency between n and m / n to obtain r = 0.96 and is defined as f n = n 2 + 1 . This gave us information about the minimal number of measurements needed to obtain r 0.96 , which was m = n 2 2 + n .

5. Experiments

We applied TANN associated with quasi-reinforcement learning to the phase-locking of a seven-amplifier laser system. As a conventional CBC configuration, the setup (Figure 5) comprised a master oscillator (MO/ CW semiconductor laser @1064nm) seeding seven parallel polarization maintaining (PM) fiber amplifiers. Their inputs were equipped with fiber-coupled LiNbO3 electro-optic phase modulators (ΕOΜ) and their outputs, once collimated by microlenses (µlens), formed a compact 1D array of laser beams (250 µm beam waist and 500 µm pitch) in a tiled-aperture arrangement (Figure 5). We used a master diode laser delivering 1064 nm radiation because most of the components used to split and modulate the light feeding the amplifier array were already in our stock and designed to operate at this popular wavelength. The wavelength choice does not impact the working principle of the investigated technique. The master laser delivered about 80 mw of polarized light. Each individual output of the double-stage polarization maintaining the fiber amplifier array was limited to about 1 W of collimated polarized laser light by the available pump power. A beam splitter (BS) split the laser array output into a power fraction and a control fraction for the phase-locking loop. The adaptive phase correction loop contains a phase sensing module made of a ground glass diffuser [14,17] which achieved interferences between the individual beams on a 1D-photodetector array. Only sparse samples of the interference pattern were collected and served as a phase to intensity encoding. We used here only 70 intensity measurements from non-adjacent and periodically spaced pixels of the photodetector array. These data fed the digitizing and processing unit. It comprised the AD/DA converters, and the QRL-learned TANN that first computed the NN to be used in the loop. The TANN received the target phase chart, which could be changed on-demand, from a computer or any other external device. The processing unit delivered the phase corrections to apply to the seven electro-optic modulators. The far field of the BS main output was displayed on a camera with a positive lens for observation and performance analysis (not shown in Figure 5).
The learning step of the TANN requires a large amount of training data. Because the experimental generation of suitable data requires a long period of time, we attained the training data by computation, using the measured transmission matrix (TM) of the scattering device that maps phase into intensity [14,24,25]. Based on the TM knowledge, we further generated a large number of training data for the TANN quasi-reinforcement learning. We set T = 8 as the number of correction loops in the QRL process. That number results from a previous numerical study and appears to offer a good trade-off between speed and accuracy. Optimization of the TANN parameters typically required a minimum of 100 Epochs of 256 couples of phase/intensity and 1024 target phase batches to reach a reward R of 99%. Figure 6 shows a typical evolution of the reward R versus the number of epochs during the TANN learning process with the data from the experimental TM.
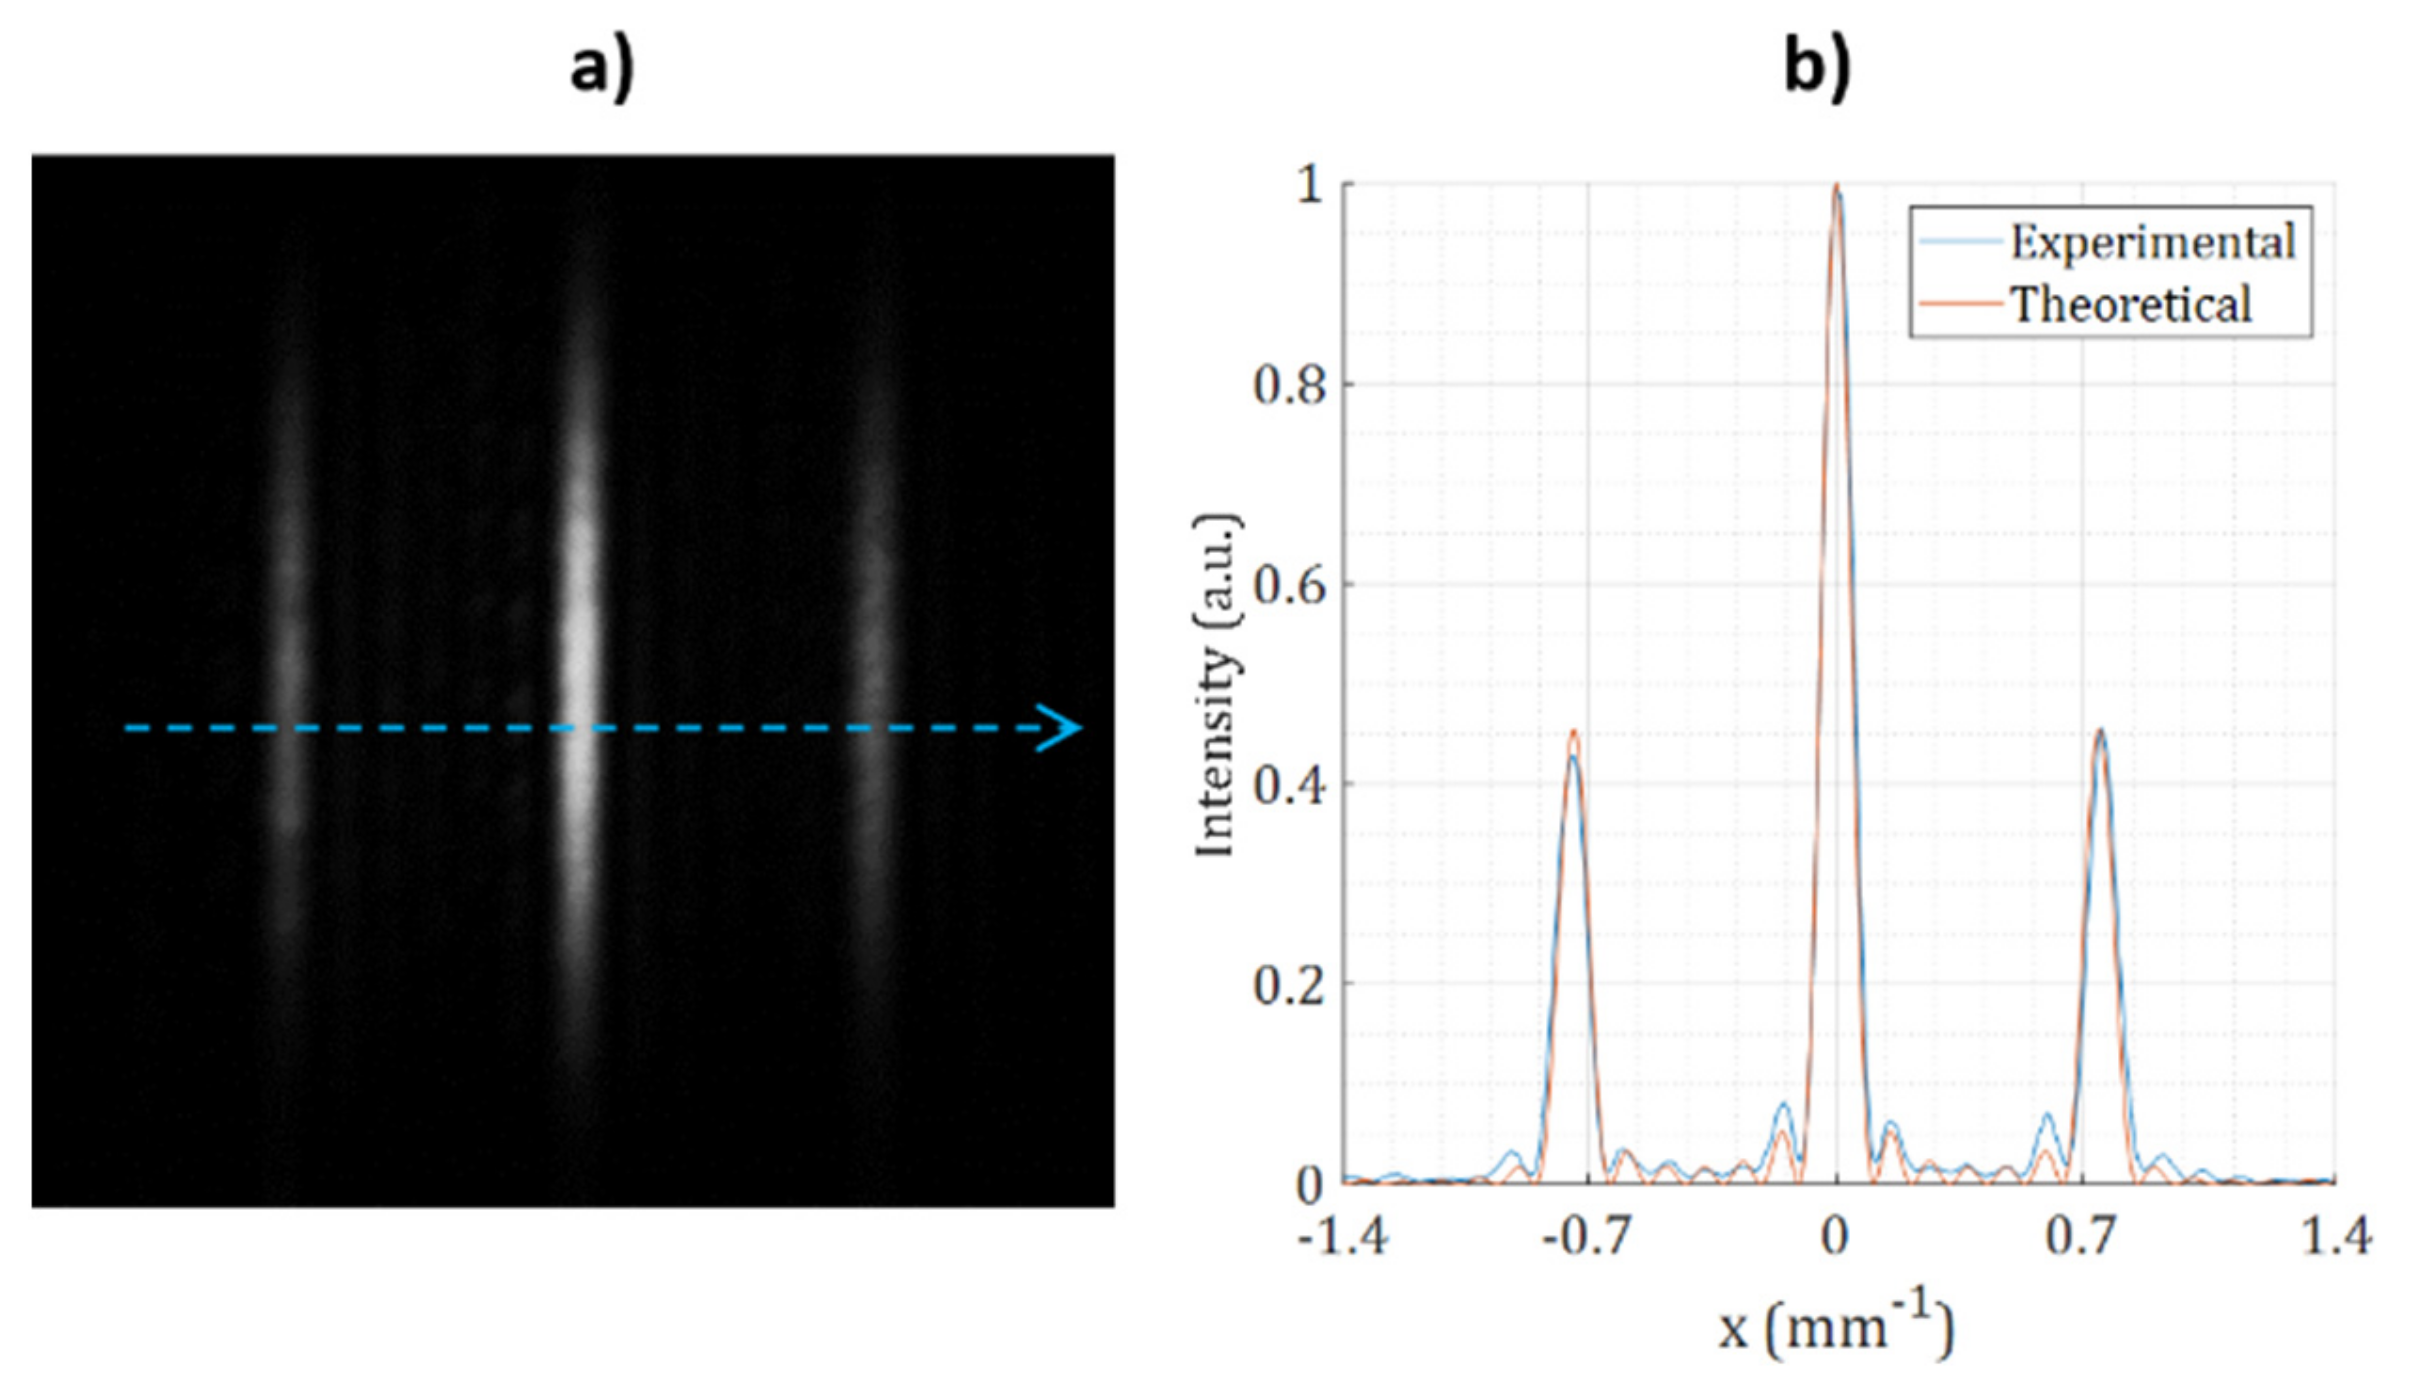
Once TANN was trained, we used it to compute the NN embedded in the feedback loop for phase-locking the laser array. The NN quickly and efficiently locked the laser system to the in-phase state as shown in Figure 7, despite the standing phase fluctuations in the various amplifier arms. The laser exhibited the expected far field pattern (Figure 7a), very similar in shape and magnitude to the theoretical one for an in-phase beam array (Figure 7b).
The NN phase correction process locked the laser system with a measured coherent combining efficiency of ~93%, derived from the signal of a photodiode located in the center of far field. This corresponds to less than λ/20 RMS residual deviation from a perfectly uniform discrete wavefront in the beam array.
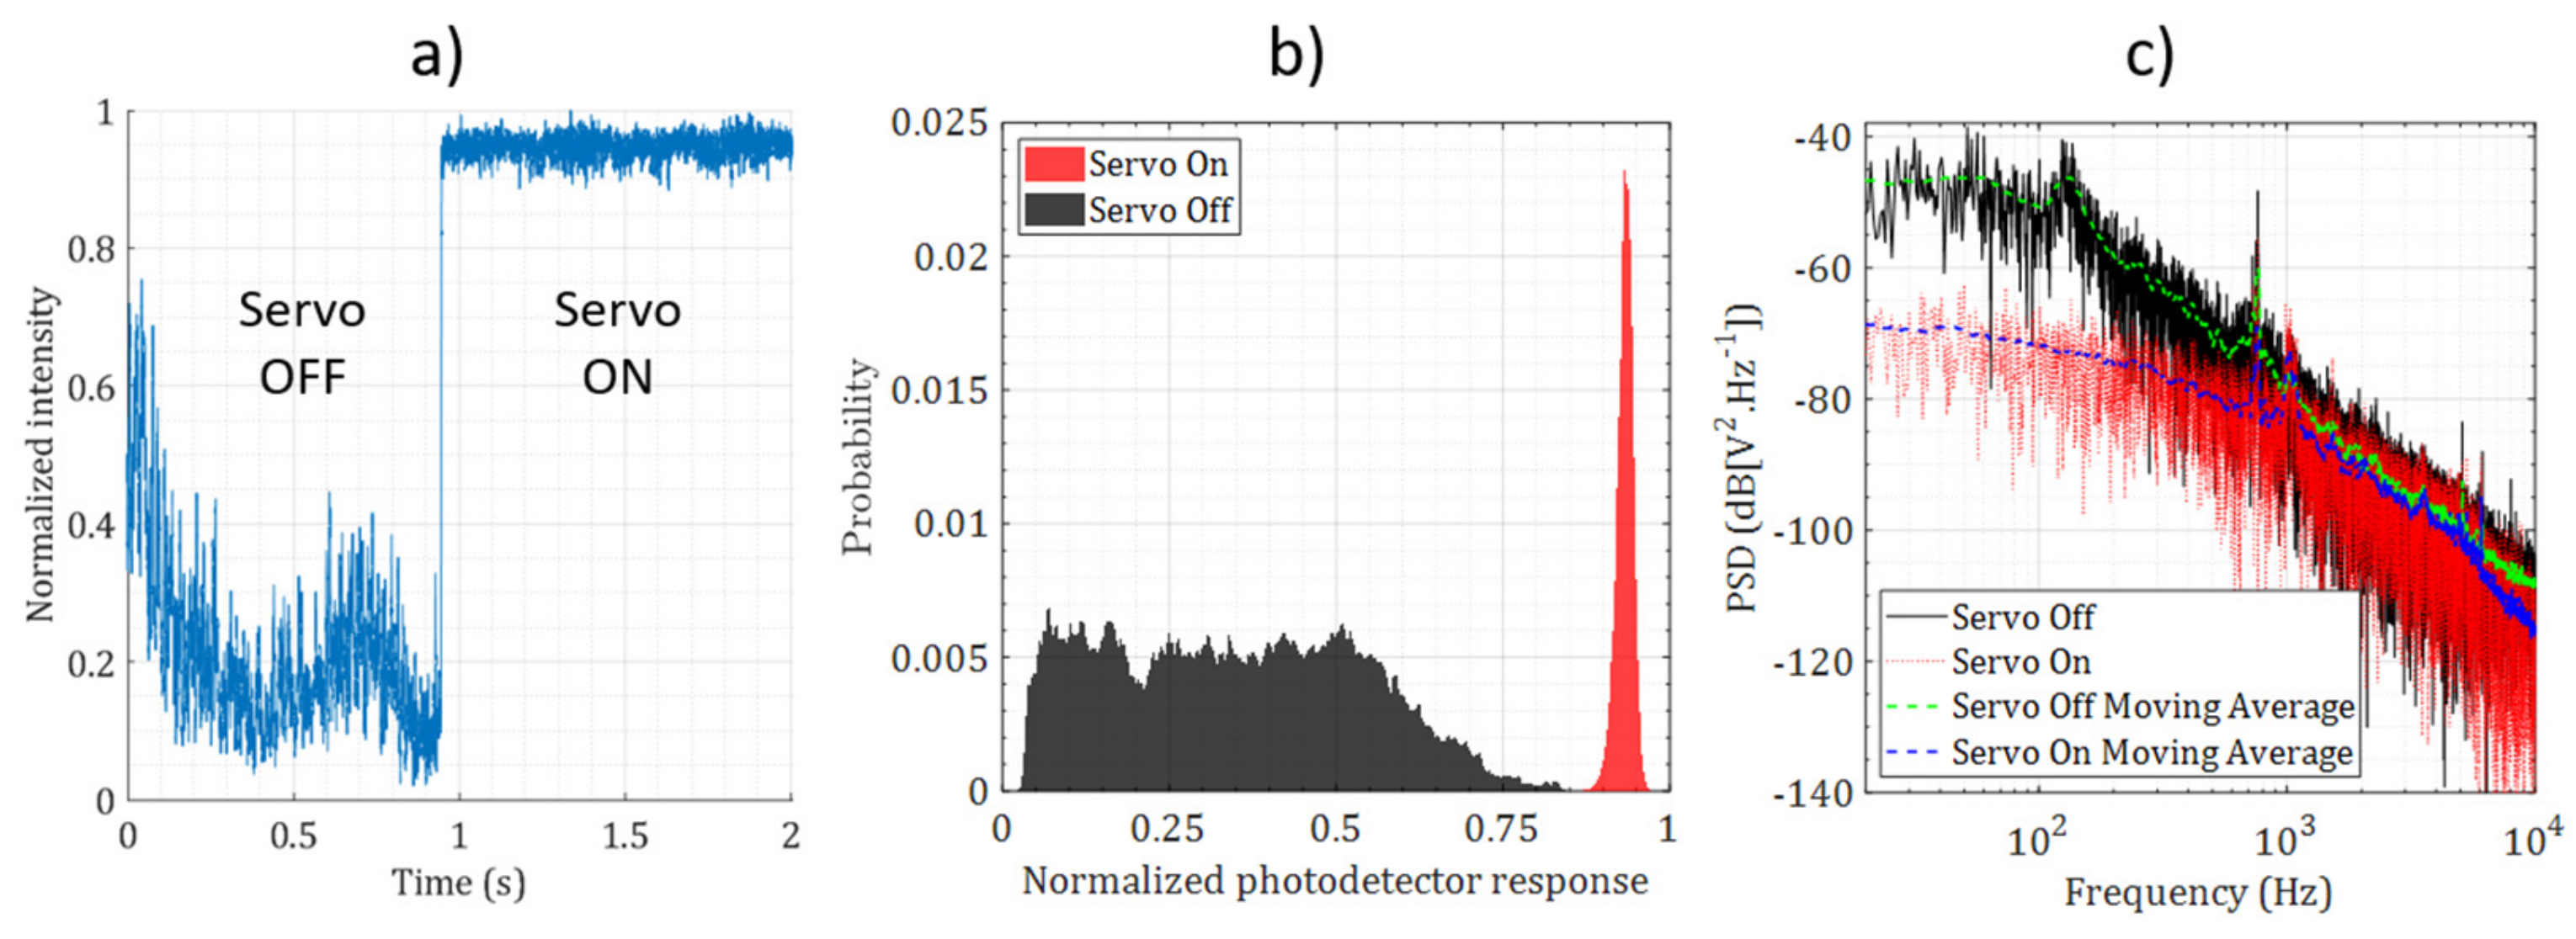
A photodiode measured the on-axis peak intensity in the array far field. To quantify the phase-locking stability of the laser system, we recorded 10 million samples of its signal during 2.8 s, (Figure 8 in-phase locking case). The samples were further analyzed to plot their probability density for the OFF (open) and ON (closed) state, respectively. When the feedback loop was open, the signal probability density (black curve in Figure 8b) covered a medium and widely spread voltage range. On the contrary, when the servo is ON (red trace), the histogram shows a sharp peak at a higher voltage (0.93) which corresponds to the average combining efficiency, associated with a 1.2% standard deviation. This demonstrates that the NN-based phase control system offers an efficient and stable locking of the fiber laser array output. The power spectral density (PSD) related to the same photodiode signal is given in Figure 8c. It shows that the servo loop corrected the phase fluctuations of the combined beam array up to 1.5 kHz, while the servo loop operated at 11 kHz frequency, limited by the speed of the loop controller (Ni PXIe-1071). The analysis of numerous on/off servo transitions shows that the average number of phase corrections to reach an efficient phase-locking level is about 6, which is quite low although slightly larger than the number derived from noiseless numerical simulations.
When TANN computed the NN in the phase correction loop for setting a non-uniform phase map, the excellent operation of the system was preserved. Few examples of some specific phase charts, most of which can be easily recognized by the naked eye, are given in Figure 9. The desired phase map for the beam array can be any arbitrary phase state. It could be changed on-demand in real-time during the laser system operation. Figure 10a reports a sequence of repeated variation in the desired target. The vertical scale denotes the errors in the individual beams’ phase with respect to their steady state values corresponding to the desired state. The parameter presents an intensity correlation between the scattered pattern at the time considered and the one at the end of each cycle. Periodically the demanded phase chart was changed, and there was a sudden drop of this parameter. Each time, the system quickly restored a value close to the maximum achievable. This means the system repeatedly achieved a fast and stable setting to the new requested phase relationships. Figure 10b presents the statistical data of experimental convergence to 1000 arbitrary target phase maps, on a very short time scale. This graph shows that, regardless of the target phases, the TANN phase control system set the fiber laser output of the desired phases within about six rounds of correction, i.e., here within 550 µs.

6. Conclusions

We have reported an improved version of a phase-locking technique for a laser beam array based on neural network and quasi reinforcement learning that offers a quick on-demand change of the transverse phase distribution in the array. The NN is included in a feedback loop and computes the phase correction from data measured in a scattered pattern of the output. Instead of learning the NN for a given target, as previously studied, the original idea presented here is in the learning of a preliminary network TANN that will compute the NN parameters suited to the desired phase map. The calculation by TANN is on an order of magnitude faster than the NN training duration. Thus, the NN quickly accommodates any change of the desired phase set, so that the new architecture forms an actual adaptive phase-locking system. We first analyzed the proposed approach by simulation of an array of 2 to 20 beams. The training time of TANN was short, requiring approximately 5 min for 20 beams. The phasing accuracy was high with the NN computed by TANN, and the dynamics for phase-locking were fast, needing only a few (three iterations on average for a seven-beam array) phase error correction steps, regardless of the target phase set. The impact on the performances concerning sparsity in the sampling of the scattered pattern which was employed in the phase-sensing module was analyzed. A rule of thumb was derived for the lowest number of measurements in order to obtain a sufficiently high phasing accuracy. The technique can be applied to any form of geometry of the near field array including 1D, 2D, triangular or square lattices, rings, etc.
In the second step, we implemented the technique on a 7-channel fiber laser delivering multi-watt linearly polarized laser radiation at 1064 nm in a 1D-beam array. This experiment, with double-stage fiber amplifiers, demonstrated the efficiency of the quasi-reinforcement learning approach to set and lock the array output on a requested target phase set. This represents, to the best of our knowledge, the first time that a real laser beam array, with many independent and long amplifying arms, was phase-locked using an NN approach. The phase-lock loop featured a phasing accuracy close to λ/20 RMS and a measured bandwidth above 1 kHz. We presented the adaptive behavior of the system with respect to the target choice and analyzed its dynamics. The time response to a new request was measured at approximately 550µs, in the non-optimized configuration. It is sufficiently fast, for example, to compensate for first order perturbations of the atmosphere in cases where the device would be connected to an appropriate sensor.

Author Contributions

Formal analysis: M.S., G.M. and P.A.; Investigation: M.S.; Project administration: V.K.; Software: G.M.; Supervision: P.A. and A.D.-B.; Validation: A.B. (Alexandre Boju).; Visualization: A.B. (Alexandre Boju) and A.B. (Alain Barthelemy).; Writing—original draft: A.B. (Alain Barthelemy) and V.K.; Writing—review and editing.: A.D.-B. All authors have read and agreed to the published version of the manuscript.

Funding

This research was funded by the Agence Nationale de la Recherche (ANR-10-LABX-0074-01) and CILAS Company (Ariane Group) under grant n °2016/0425.

Data Availability Statement

Not applicable.

Conflicts of Interest

The authors declare no conflict of interest. The funders had no role in the design of the study; in the collection, analyses, or interpretation of data; in the writing of the manuscript, nor in the decision to publish the results.

References

  1. Ma, P.; Chang, H.; Ma, Y.; Su, R.; Qi, Y.; Wu, J.; Li, C.; Long, J.; Lai, W.; Chang, Q.; et al. 27.1 kW coherent beam combining system based on a seven-channel fiber amplifier array. Opt. Laser Tech. 2021, 140, 107016. [Google Scholar] [CrossRef]
  2. Weyrauch, T.; Vorontsov, M.; Mangano, J.; Ovchinnikov, V.; Bricker, D.; Polnau, E.; Rostov, A. Deep turbulence effects mitigation with coherent combining of 21 laser beams over 7 km. Opt. Lett. 2016, 41, 840–842. [Google Scholar] [CrossRef]
  3. Yang, X.; Huang, G.; Li, F.; Li, X.; Li, B.; Geng, C.; Li, X. Continuous Tracking and Pointing of Coherent Beam Combining System via Target-in-the-Loop Concept. IEEE Phot. Tech. Lett. 2021, 33, 1119–1122. [Google Scholar] [CrossRef]
  4. Hou, T.; Dong, Z.; Tao, R.; Ma, Y.; Zhou, P.; Liu, Z. Spatially-distributed orbital angular momentum beam array generation based on greedy algorithms and coherent combining technology. Opt. Express 2018, 26, 14945–14958. [Google Scholar] [CrossRef] [PubMed]
  5. Veinhard, M.; Bellanger, S.; Daniault, L.; Fsaifes, I.; Bourderionnet, J.; Larat, C.; Lallier, E.; Brignon, A.; Chanteloup, J.C. Orbital angular momentum beams generation from 61 channels coherent beam combining femtosecond digital laser. Opt. Lett. 2021, 46, 25–28. [Google Scholar] [CrossRef] [PubMed]
  6. Bourderionnet, J.; Bellanger, C.; Primot, J.; Brignon, A. Collective coherent phase combining of 64 fibers. Opt. Express 2011, 19, 17053–17058. [Google Scholar] [CrossRef]
  7. Shay, T.M.; Benham, V.; Baker, J.T.; Ward, B.; Sanchez, A.D.; Culpepper, M.A.; Pilkington, D.; Spring, J.; Nelson, D.J.; Lu, C.A. First experimental demonstration of self-synchronous phase locking of an optical array. Opt. Express 2006, 14, 12015–12021. [Google Scholar] [CrossRef] [PubMed]
  8. Vorontsov, M.A.; Carhart, G.W.; Ricklin, J.C. Adaptive phase-distortion correction based on parallel gradient-descent optimization. Opt. Lett. 1997, 22, 907–909. [Google Scholar]
  9. Vorontsov, M.A.; Sivokon, V. Stochastic parallel-gradient-descent technique for high-resolution wave-front phase-distortion correction. J. Opt. Soc. Am. A. 1998, 15, 2745–2758. [Google Scholar] [CrossRef]
  10. Yu, C.; Augst, S.; Redmond, S.; Goldizen, K.C.; Murphy, D.; Sanchez, A.; Fan, T. Coherent combining of a 4 kw, eight-element fiber amplifier array. Opt. Lett. 2011, 36, 2686–2688. [Google Scholar] [CrossRef] [PubMed]
  11. Zhou, P.; Liu, Z.; Wang, X.; Ma, Y.; Ma, H.; Xu, X.; Guo, S. Coherent beam combining of fiber amplifiers using stochastic parallel gradient descent algorithm and its application. IEEE J. Sel. Top. Quantum Electron 2009, 15, 248–256. [Google Scholar] [CrossRef]
  12. Kabeya, D.; Kermene, V.; Fabert, M.; Benoist, J.; Saucourt, J.; Desfarges-Berthelemot, A.; Barthélémy, A. Efficient phase-locking of 37 fiber amplifiers by phase-intensity mapping in an optimization loop. Opt. Express 2017, 25, 13816–13821. [Google Scholar] [CrossRef]
  13. Boju, A.; Maulion, G.; Saucourt, J.; Leval, J.; Ledortz, J.; Koudoro, A.; Berthomier, J.-M.; Naiim-Habib, M.; Armand, P.; Kermene, V.; et al. Small footprint phase locking system for a large tiled aperture laser array. Opt. Express 2021, 29, 11445–11452. [Google Scholar] [CrossRef] [PubMed]
  14. Saucourt, J.; Armand, P.; Kermène, V.; Desfarges-Berthelemot, A.; Barthélémy, A. Random Scattering and Alternating Projection Optimization for Active Phase Control of a Laser Beam Array. IEEE Photonics J. 2019, 11, 1503909. [Google Scholar] [CrossRef]
  15. Tunnermann, H.; Shirakawa, A. Deep reinforcement learning for coherent beam combining applications. Opt. Express 2019, 27, 24223–24230. [Google Scholar] [CrossRef] [PubMed]
  16. Hou, T.; An, Y.; Chang, Q.; Ma, P.; Li, J.; Zhi, D.; Huang, L.; Su, R.; Wu, J.; Ma, Y.; et al. Deep Learning-based phase control method for coherent beam combining systems. High Power Laser Sci. Eng. 2019, 7, e59. [Google Scholar] [CrossRef] [Green Version]
  17. Chang, Q.; An, Y.; Hou, T.; Su, R.; Ma, P.; Zhou, P. Phase-locking System in Fiber Laser Array through Deep Learning with Diffusers, Paper M4A.96. In Proceedings of the Asia Communications and Photonics Conference, Beijing, China, 24–27 October 2020. [Google Scholar]
  18. Hou, T.; An, Y.; Chang, Q.; Ma, P.; Li, J.; Huang, L.; Zhi, D.; Wu, J.; Su, R.; Ma, Y.; et al. Deep-learning-assisted, two-stage phase control method for high-power mode-programmable orbital angular momentum beam generation. Photonics Res. 2020, 8, 715–722. [Google Scholar] [CrossRef]
  19. Tünnermann, H.; Shirakawa, A. Deep reinforcement learning for tiled aperture beam combining in a simulated environment. JPhys Photonics 2021, 3, 015004. [Google Scholar] [CrossRef]
  20. Wang, D.; Du, Q.; Zhou, T.; Li, D.; Wilcox, R. Stabilization of the 81-channel coherent beam combination using machine learning. Opt. Express 2021, 29, 5694–5709. [Google Scholar] [CrossRef] [PubMed]
  21. Zhang, X.; Li, P.; Zhu, Y.; Li, C.; Yao, C.; Wang, L.; Dong, X.; Li, S. Coherent beam combination based on Q-learning algorithm. Opt. Comm. 2021, 490, 126930. [Google Scholar] [CrossRef]
  22. Shpakovych, M.; Maulion, G.; Kermene, V.; Boju, A.; Armand, P.; Desfarges-Berthelemot, A.; Barthélemy, A. Experimental phase control of a 100 laser beam array with quasi-reinforcement learning of a neural network in an error reduction loop. Opt. Express 2021, 29, 12307–12318. [Google Scholar] [CrossRef]
  23. Nabors, C. Effects of phase errors on coherent emitter arrays. Appl. Optics. 1994, 33, 2284–2289. [Google Scholar] [CrossRef]
  24. PPopoff, S.; Lerosey, M.G.; Carminati, R.; Fink, M.; Boccara, C.; Gigan, S. Measuring the transmission matrix in optics: An approach to the study and control of light propagation in disordered media. Phys. Rev. Lett. 2010, 104, 100601. [Google Scholar] [CrossRef]
  25. Drémeau, A.; Liutkus, A.; Martina, D.; Katz, O.; Schülke, C.; Krzakala, F.; Gigan, S.; Daudet, L. Reference-less measurement of the transmission matrix of a highly scattering material using a DMD and phase retrieval techniques. Opt. Express 2015, 23, 11898–11911. [Google Scholar] [CrossRef] [Green Version]
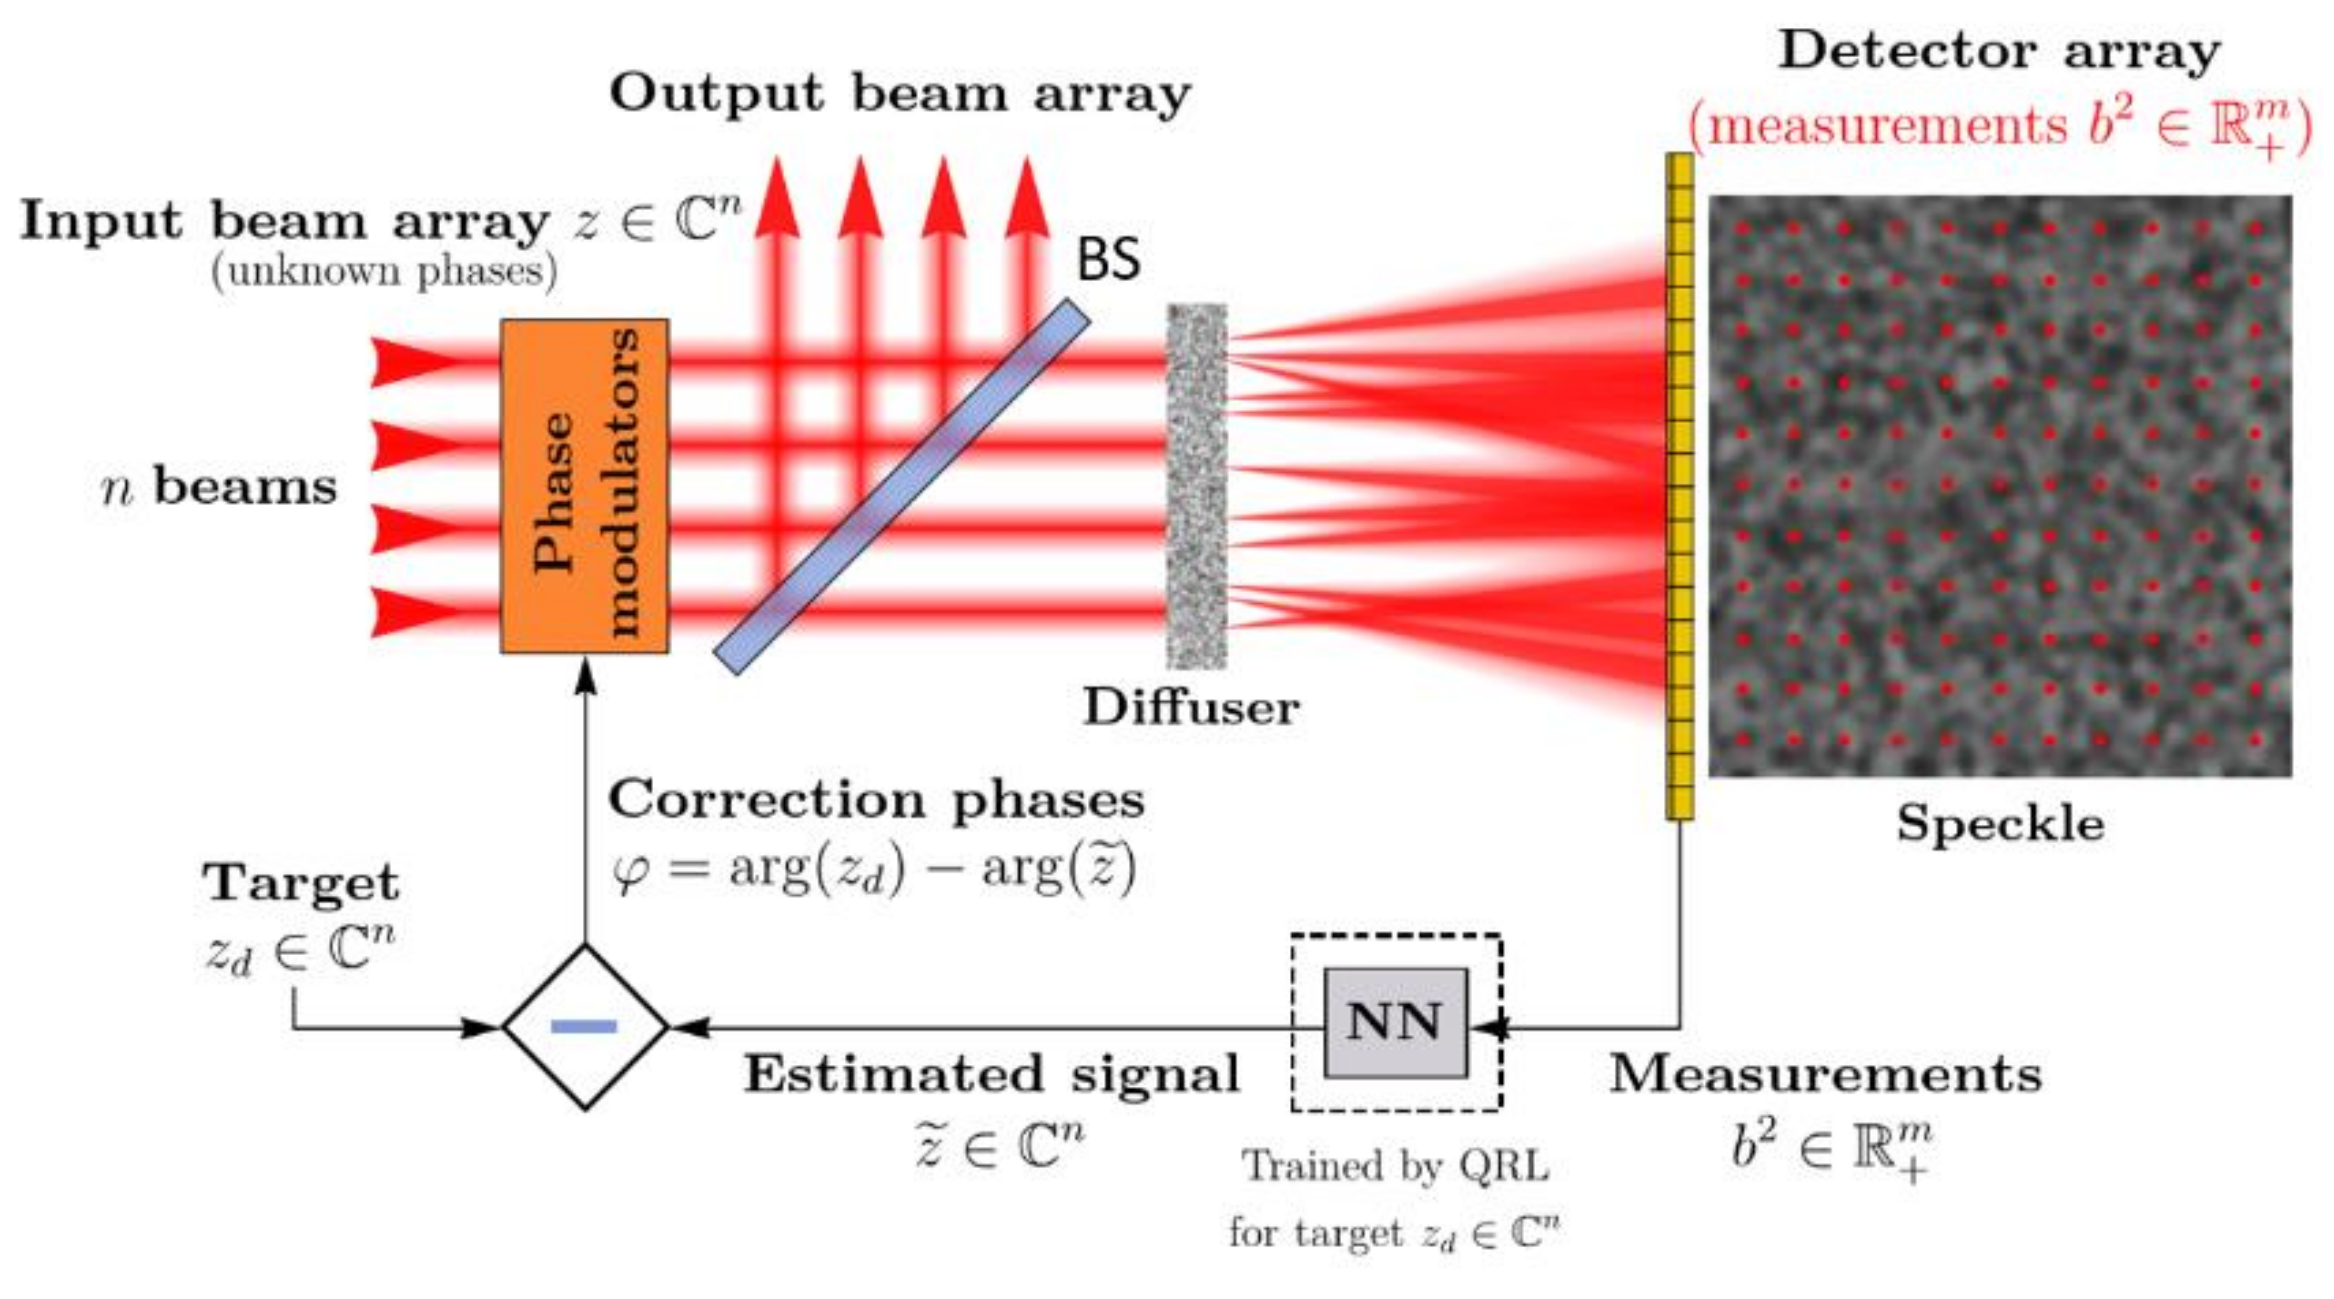
Figure 1. Principle of the system for phase-locking a coherent beam array with a neural network. In a preliminary step, quasi-reinforcement learning (QRL) trains the NN specifically for working in a feedback loop and for setting the array output to a given target phase chart. BS denotes beam splitter.
Photonics 09 00243 g001
Figure 2. Feedback loop with target adaptive neural network TANN that computes the weights of the NN embedded in the loop, at each change of the target.
Photonics 09 00243 g002
Figure 3. (a) Reward evolution during TANN training for 7 beams and 70 detectors with 8 corrections steps T . (b) Average evolution of the quality factor Q according to the phase correction iterations of the trained system (100 random initial phase sets, 7 beams, 70 detectors). The red dotted line shows the 96% threshold. On average, only 3 steps of correction are required to reach the threshold phasing quality.
Photonics 09 00243 g003
Figure 4. (a) Heat maps of the maximal achievable mean reward in grey scale and (b) its required relative training time. The red line in (a) approximates the separation line for which r = 0.96 . The relative time on (b) is computed by dividing a learning time in seconds for each n and m / n by the minimal time to obtain GPU invariant information. The minimal time required by the GPU used in this paper was 13 s.
Photonics 09 00243 g004
Figure 5. Left, setup of the 7-fiber amplifier array used in the reported experiments on-demand phase control using NN. The master oscillator was a semiconductor laser. EOM denotes LiNbO3 electro-optic modulator and the double-stage Ytterbium-doped fiber amplifiers were polarization maintained with 1W output power, µlens stands for microlens array, BS for beam splitter, D for diffuser. Right, photograph of the 1D-array output and of the phase analysis module.
Photonics 09 00243 g005
Figure 6. Reward evolution during the TANN learning process for the 7-fiber laser array with 8 correction steps T .
Photonics 09 00243 g006
Figure 7. (a) Experimental far field of the 7-fiber laser array locked in-phase. (b) Experimental and theoretical profiles of the phase-locked fiber laser array.
Photonics 09 00243 g007
Figure 8. (a) Normalized evolution of the combined beam power detected by a photodiode located on the far field center when the NN servo is OFF then ON, (b) Normalized histogram of the combined laser power evolution according to time when the servo is OFF (black) then ON (red). (c) Power spectral density of the 7-fiber laser array when the NN servo is OFF (black) and ON (red) and their moving average (green and blue traces, respectively).
Photonics 09 00243 g008
Figure 9. Examples of experimental far field patterns of phase-locked fiber laser output and their associated target phase sets.
Photonics 09 00243 g009
Figure 10. Experimental sequence of periodic target phase changes showing the evolution of the speckle pattern intensity correlation. Vertical scale denotes errors in the individual beams’ phase with respect to their steady state values corresponding to the desired state. (a) Red dotted lines mark the times of target phase changes, (b) same experimental sequence of data folded in a single cycle, highlighting the dynamics toward a steady state phase profile for 1000 abrupt phase changes. One iteration of the phase correction loop took 92 µs.
Photonics 09 00243 g010
Publisher’s Note: MDPI stays neutral with regard to jurisdictional claims in published maps and institutional affiliations.