1. Introduction
Chromatic dispersion (CD) is an important optical characteristic of optical fiber, which is caused by the different propagation speed of light with different frequencies in optical fiber. With the increase of the speed and distance of the optical transmission system, CD has become a huge obstacle to the development of optical transmission systems to ultra-high speed and ultra-long distance [
1]. In analog transmission, CD causes harmonic distortion, which reduces the optical signal-to-noise ratio (OSNR) of the system; In digital transmission, CD causes the broadening of optical pulses, resulting in the superposition of front and rear pulses, aggravating inter-symbol crosstalk, increasing the system bit error rate, and limiting the transmission rate and communication capacity. Although optical amplification technology can effectively compensate the loss of optical power in optical fiber transmission, after long-distance transmission, the optical fiber communication system will accumulate a large amount of CD, which will lead to serious pulse broadening, signal distortion, and loss of information. Therefore, CD has become the main factor restricting the transmission distance of the high-speed optical fiber communication system. In Addition, CD and fiber nonlinearity are the main destructive phenomena in high-speed data rate fiber optic communication systems. In order to realize high-speed optical communication systems and networks, the pulse spread caused by group velocity dispersion (GVD) and optical Kerr effects must be compensated. With the further improvement of transmission baud rate, the system CD tolerance decreases rapidly, which greatly limits the growth of the transmission distance and the transmission rate of the system [
2,
3,
4].
In a coherent optical communication system, CD compensation in a fixed optical fiber link can be realized by digital equalization in the receiver, but the premise is to know the final accurate cumulative dispersion value. Although this reduces the need for CD compensation in the optical domain, the CD range that needs to be monitored increases significantly in an uncompensated link. On the other hand, in dynamic reconfigurable optical networks, the CD exhibits dynamic time-varying characteristics with the dynamic switching of paths. Therefore, in order to compensate the CD by digital signal processing, it is necessary to obtain the accurate cumulative CD value in advance by CD estimation. With the improvement of the optical fiber communication rate, the increase of transmission capacity and the continuous growth of transmission distance, the accumulation of CD can easily exceed the CD tolerance of the system. Coupled with the random fluctuation of CD amount, CD compensation and real-time CD monitoring must be carried out for the system. In the signal processing flow of the coherent communication receiver, since the CD estimation is in the first step, at this time, other impairments in the link have not been compensated and equalized, so the CD estimation method needs to be able to resist the impact of all other link impairments, which puts forward higher requirements for the CD estimation method. Therefore, how to effectively monitor the CD of the system in real time has recently become a hot research topic of scholars at home and abroad [
5].
The existing CD monitoring methods can be divided into two categories: one is for incoherent detection system and the other is based on a coherent detection system. Methods based on an incoherent detection system mainly include methods based on RF clock power detection [
6,
7], methods based on relative group delay between vestigial side-bands (VSB) [
8,
9], methods based on asynchronous delay tap sampling [
8,
10], and methods of full spectrum analysis based on nonlinear optics [
11]. The RF clock power detection scheme utilizes the principle that the optical link CD effect causes the phase difference between the upper and lower side-band phases of the optical signal spectrum. The link CD value is accurately calculated by analyzing the relationship between the RF power spectrum and the residual CD. The principle of the relative group delay scheme between VSB is to use the clock component technology for detection, by extracting the two side-bands of the base-band signal, recovering the clock signal from the two received VSB components, and then analyzing the phase difference between the upper and lower side-band components to realize the monitoring of CD. The principle based on asynchronous delay tap sampling is to extract the characteristic value corresponding to CD from the statistical chart according to the statistical characteristics of the amplitude histogram obtained by asynchronous delay sampling, so as to realize the monitoring of CD. The principle of full spectrum analysis based on nonlinear optics is to map the influence of CD on the signal peak power to the output signal spectrum through nonlinear effects such as cross-phase modulation (XPM), self-phase modulation (SPM), and four-wave mixing (FWM). The corresponding CD information of the system can be obtained only by monitoring the change of the output signal spectrum. These methods often have the disadvantages of a small monitoring range, low accuracy, the need to change the transmitter structure, or the vulnerability to interference by other effects, such as polarization mode dispersion, which cause the cost of the monitoring system to increase, so they are not suitable for high-speed coherent optical communication systems and dynamically reconfigurable optical networks.
With the emergence of a modern coherent receiving technology, the complex electric field of optical signals can be accurately measured at a sufficiently high sampling rate, so that numerical algorithms can be developed to monitor and mitigate the impairments caused by transmission. The most common method of performance monitoring using a coherent receiver is the digital signal processing technology developed by a wireless communication system. [
12] explained how to use adaptive linear equalizers to mitigate the time-varying damage caused by CD and polarization effects. In order to avoid the additional overhead caused by transmitting known training signals, blind estimation methods such as the constant modulus algorithm (CMA) are adopted. [
13,
14,
15,
16] avoided gradient-based optimization on a large number of filter taps by scanning the dispersion value in increments of 200 ps/nm in the range of 15,000 ps/nm and detecting the minimum depth in the CMA cost function. [
17] proposed a fast CD estimation method using the auto-correlation of the signal power waveform (ACSPW) algorithm. The method obtains the dispersion monitoring curve by performing an autocorrelation on the received signal waveform sampling sequence. A spike will be generated, and the position of the spike represents the magnitude of the dispersion. A CD monitoring method based on CD scanning was proposed by [
18]. The peak power-to-average power ratio (PAPR) of the received signal sampling sequence is related to the size of the CD, and the PAPR will reach a minimum value when the CD is zero. By scanning the CD value in a specific range, and then performing CD compensation and calculating the size of PAPR, the size of excellent dispersion can be estimated by finding the minimum value of PAPR [
19,
20]. A CD monitoring method based on signal spectrum superposition was proposed. By superimposing the spectrum of the upper and lower side-bands of the signal and performing autocorrelation, the obtained autocorrelation curve will generate two symmetrical peaks, and the position of the peaks indicates the size of the CD. Traditional CD monitoring methods mostly rely on temporary CD compensation or temporary cost function calculation by scanning the CD within a specific range. Estimating the accumulated CD usually takes quite a long time, and the tentative CD compensation scheme needs to consume a lot of processing power in the DSP equalization unit. The search algorithm can be used to scan the prefabricated dispersion range to estimate the dispersion, but this kind of method has the problems of high complexity and slow convergence speed [
14,
21]. Therefore, a fast and effective CD estimation method must be proposed to compensate the accumulated CD in the digital coherent receiver with less power consumption.
In this paper, we propose a fast and blind method to estimate CD with a lower computation complexity, with the fractional Fourier transform (FrFT) theory. The energy concentration characteristic of the chirped signal is used, and the optimal transform order is obtained according to the peak point. According to the similarity between the chirped signal and CD, the relationship between the estimated dispersion value and the transform order is obtained from the point of view of the fractional domain by taking advantage of the unique advantages of the time-frequency domain joint analysis. Moreover, the estimation accuracy can be improved by increasing the number of samples. On this basis, we propose a stepwise optimal order search method. For this method, the search process is divided into two parts, including a coarse search and a fine search for multi-step adjustment, which greatly reduces the computational complexity.
The rest of this paper is structured as follows.
Section 2 introduces the basic principle of FrFT and how to compare the energy concentration characteristics of the chirped signal to CD estimation.
Section 3 describes the structure of the CD monitoring experimental configuration of PM-QPSK and PM-16QAM signals. Some simulation results and the discussion are presented in
Section 4. Finally,
Section 5 sums up the conclusions.
2. Principles of the Proposed Method
2.1. The Theory of FrFT
Fourier transform can well analyze the deterministic signals or stationary random signals. However, for non-stationary signals, the local performance needs to be accurately described by using the two-dimensional joint representation of time domain and frequency domain [
22,
23]. FrFT associates relatively independent time-domain and frequency-domain information. It can map a one-dimensional time-domain signal into a two-dimensional time-frequency plane, reflecting the time-frequency distribution characteristics of the signal over time.
For signal
, whose domain of definition is
, the expression of FrFT whose transform order is
p can be expressed as:
which also has the inverse transformation:
The kernel function of the FrFT is:
where
represents the rotation angle introduced by FrFT in the time-frequency domain distribution, and
is the order of FrFT and is
. From Equations (1) and (3), it can be seen that FrFT has periodicity and a period of 4.
When
(i.e.,
), FrFT becomes a traditional Fourier transform:
When
(i.e.,
), FrFT becomes the traditional inverse Fourier transform:
When
, the FrFT of the signal is itself:
When
, the FrFT of the signal is
:
Since only appears at the parameter positions of the trigonometric functions and FrFT is periodic in transform order 4, only the interval is considered. When the order changes from 0 to 1, its FrFT smoothly changes from the original function to the traditional Fourier transform, which further proves that the FrFT is correct.
When defined by the rotation of the time-frequency plane, the
p-order FrFT can be defined as a linear regular transform, which is described by the transformation matrix:
where
, Equation (8) is the two-dimensional rotation matrix on the time-frequency plane, and the transformation of order
is equivalent to the rotation
of the Winger distribution of the original signal on the time-frequency plane, that is:
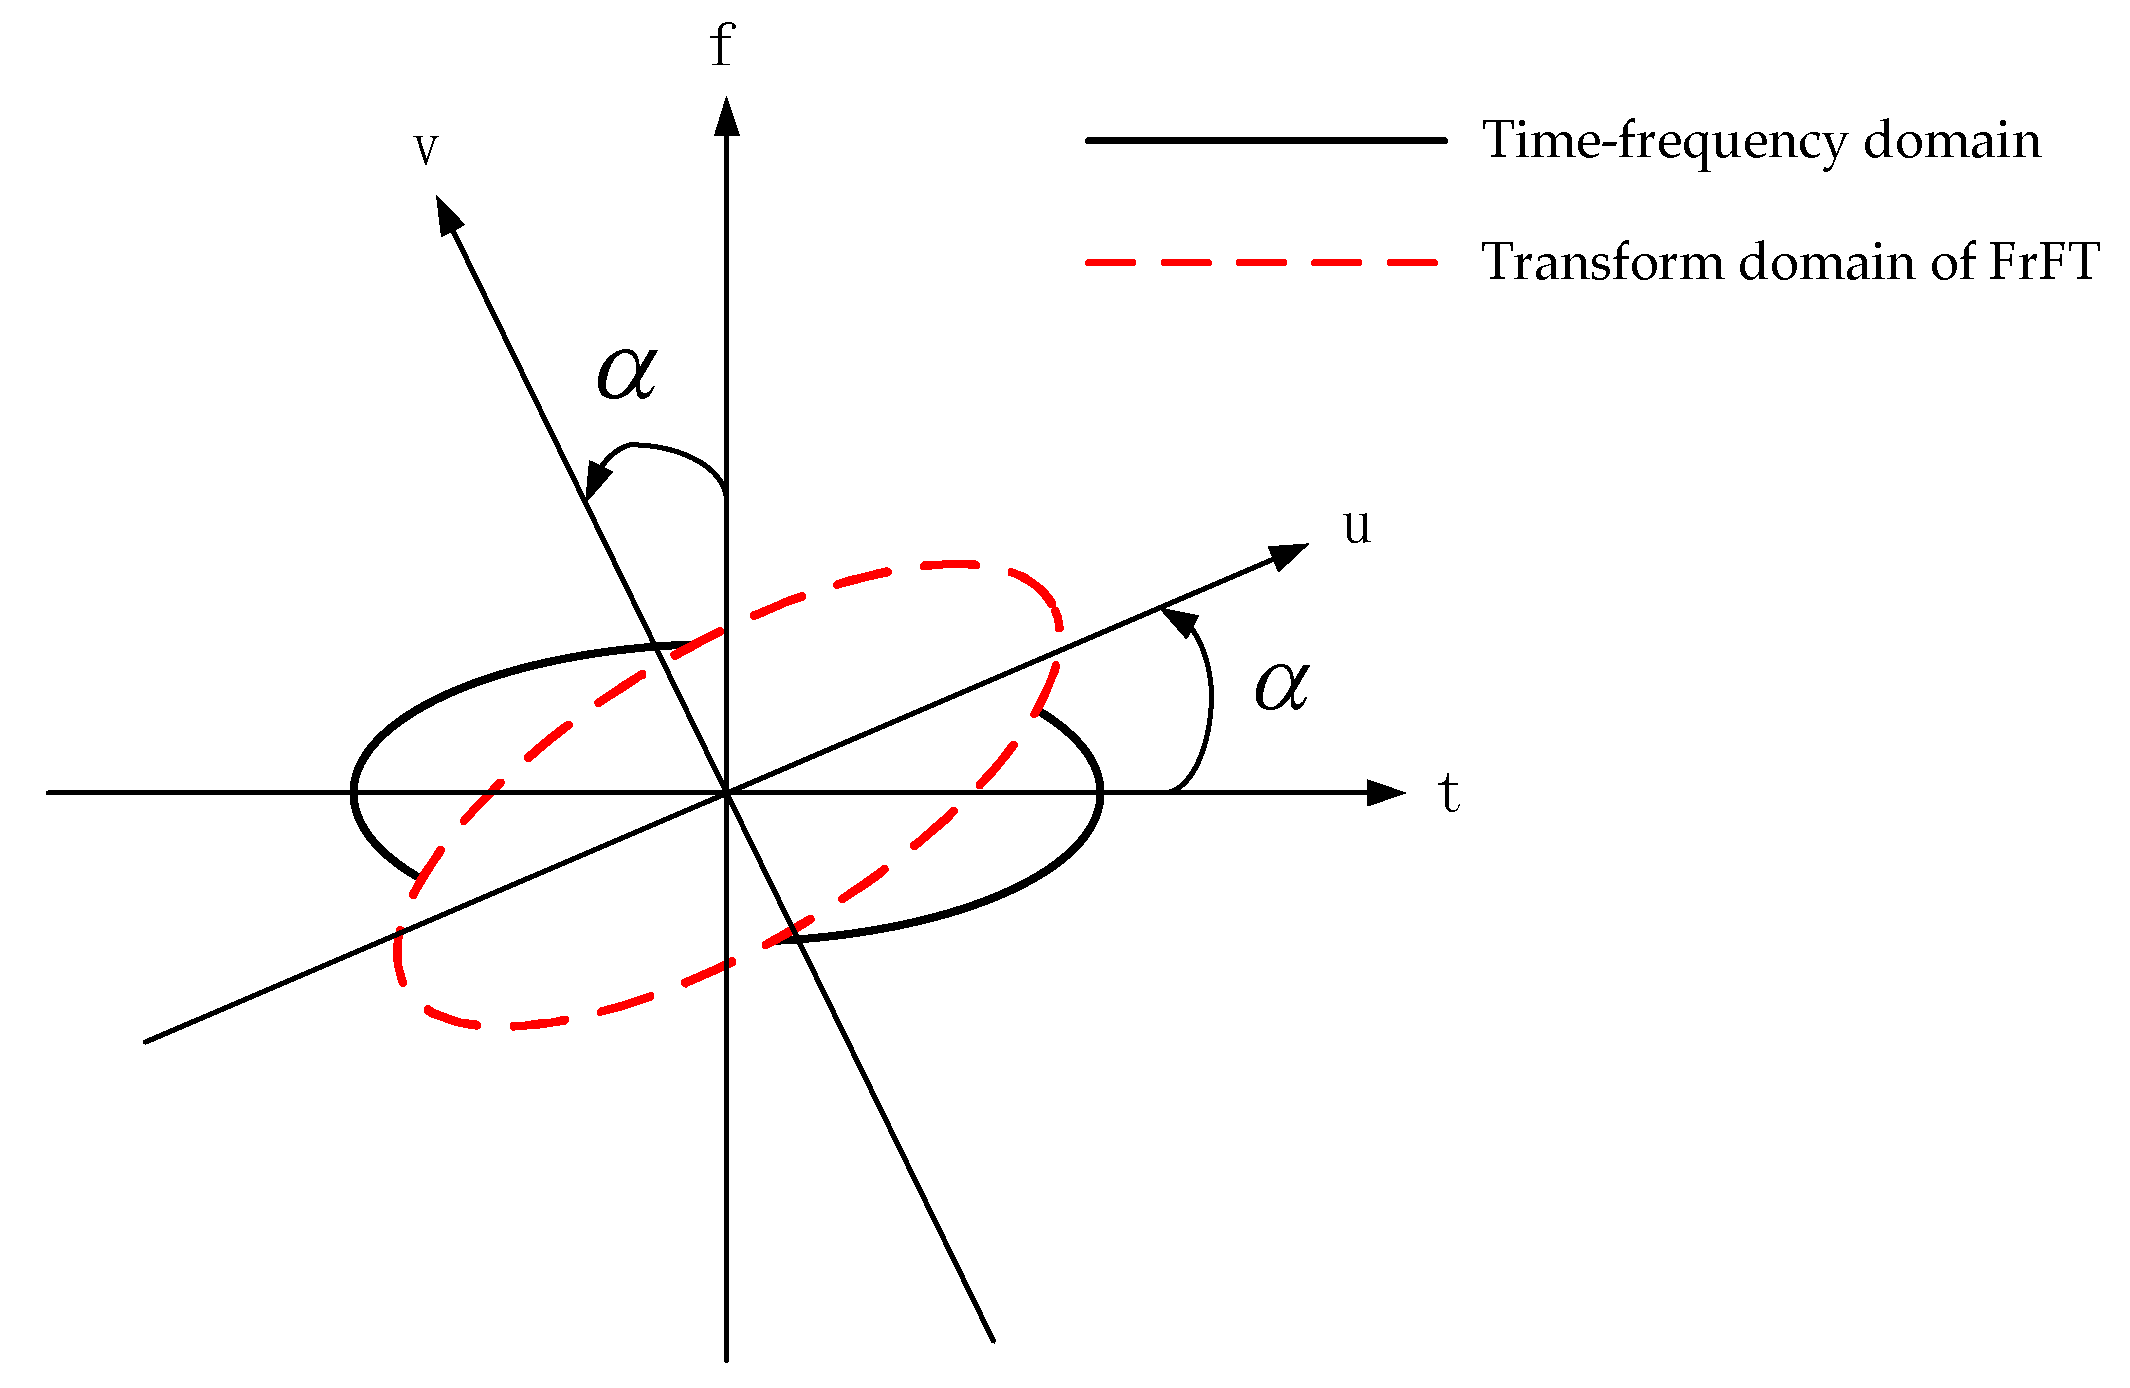
As shown in
Figure 1,
represents the transformation result of rotating the original function
by an angle of
and transforming it from the time axis to the frequency axis, that is, the Fourier transform of the function;
represents that the time axis is rotated twice by the angle
;
indicates that the time axis is rotated 4 times by the
angle, and the result obtained after the rotation is the original function. In the same way, operator
means to rotate the function by angle
, and operator
means to rotate the function by angle
. If the two operators work at the same time, the original function is continuously rotated by an
angle, which is equivalent to
in the original function.
From a physical point of view, the traditional Fourier transform is equivalent to a 90° rotation in the time-frequency domain, while FrFT can rotate at any angle, and the angle of rotation is related to the order of the FrFT transform. Therefore, it can transform the signal into the fractional domain between time domain and the frequency domain for analysis and processing, which further increases the dimension of the signal. Compared with the definition method of the mathematical model, this definition in the physical sense can better reflect the changes and characteristics brought by FrFT to the time-frequency domain distribution of the signal. The research covered in this paper is mainly based on this physical definition.
2.2. CD Estimation Principle Based on FrFT
According to the inverse transform of the FrFT, the FrFT of the signal can be regarded as its expansion on the function space based on the inverse transform kernel. Meanwhile, the inverse transform kernel function is a set of orthogonal chirp basis on the fractional order domain. Therefore, an input chirp signal is an impulse function after FrFT, that is, it has a good energy concentration characteristic for a given chirp signal. Therefore, FrFT can be used to extract the information contained in the chirp signal.
The chirp signal and CD have certain similarities. The frequency of the chirp signal changes linearly with time, and the CD indicates that signals with different frequency components have different propagation speeds. Therefore, it can also be understood that the transmission delay of the signal changes linearly with the frequency of the signal. Then, if the chirp signal is a linear frequency modulation in the time domain, the CD is a linear time modulation in the frequency domain, so the chirp and CD have a certain analogy. In the following, FrFT will be used to analyze the chirp signal and the CD, respectively, to obtain the relationship between the three, and then the method of CD estimation will be proposed through the idea of chirp signal parameter estimation based on FrFT.
The FrFT method is applied to the CD monitoring of optical fiber communication systems. Using the unique advantages of joint analysis in the time-frequency domain, it can better analyze the impact of CD on optical communication signals. On the one hand, it can better estimate the CD and improve the efficiency and accuracy of the overall optical performance monitoring; on the other hand, it can contribute to the efficient compensation of these impairments, improve the overall performance of the communication system, and reduce artificial costs, improve flexibility, and optimize resource utilization in the optical network.
2.2.1. Chirp Signal and FrFT
The frequency of the chirp signal changes linearly with time, and its mathematical expression in the time domain is as follows:
where
is the envelope of the signal,
is the chirp parameter,
is the initial frequency, and
is the original phase value.
If the chirp signal is transformed by FrFT, it is equivalent to rotating the time-frequency plane according to the characteristics of FrFT. The rotation angle is related to the order of transformation. At this time, a special order or rotation angle will be found. After transformation, it will be found that the energy of the signal can be concentrated to the greatest extent to form the energy peak, and its performance is such that the signal will not occupy a large range, as in the time domain or frequency domain, but only a small range in the transformed fractional domain.
When performing FrFT, the set chirp signal (plus white Gaussian noise) is “rotated at any angle”, which gathers most of the energy in a specific FrFT domain and appears in a form similar to the spike of the impulse function. Compared with the signal containing effective information, the energy of additional Gaussian white noise spreads evenly in the whole time-frequency plane and will never produce a spike similar to the impulse function. This property can be used to complete the detection and parameter estimation of the chirp signal.
For the convenience of derivation, it is assumed that the initial frequency and initial phase of chirp signal are zero. According to the simple geometric transform analysis, the relationship between the chirp parameter of the chirp signal and the transform order is as follows:
where
and
represent the sampling interval of the chirp signal in the frequency domain and the time domain, respectively. Therefore, as long as the order
is found, the chirp parameter of the chirp signal can be calculated by the formula. In order to find the order
, it is necessary to define an energy concentration (EC) function as follows, and the extreme value of the EC function can be used to search for the best order.
To sum up, the basic idea of using FrFT to estimate the chirp parameter is as follows:
- 3.
By substituting the obtained optimal order into Equation (11), the estimated value of the chirp parameter is calculated.
2.2.2. Simulation Analysis of Chirp Parameter Estimation
The FrFT is used to simulate the chirp parameter estimation of the chirp signal. The chirp signal with an amplitude of 1, initial phase of
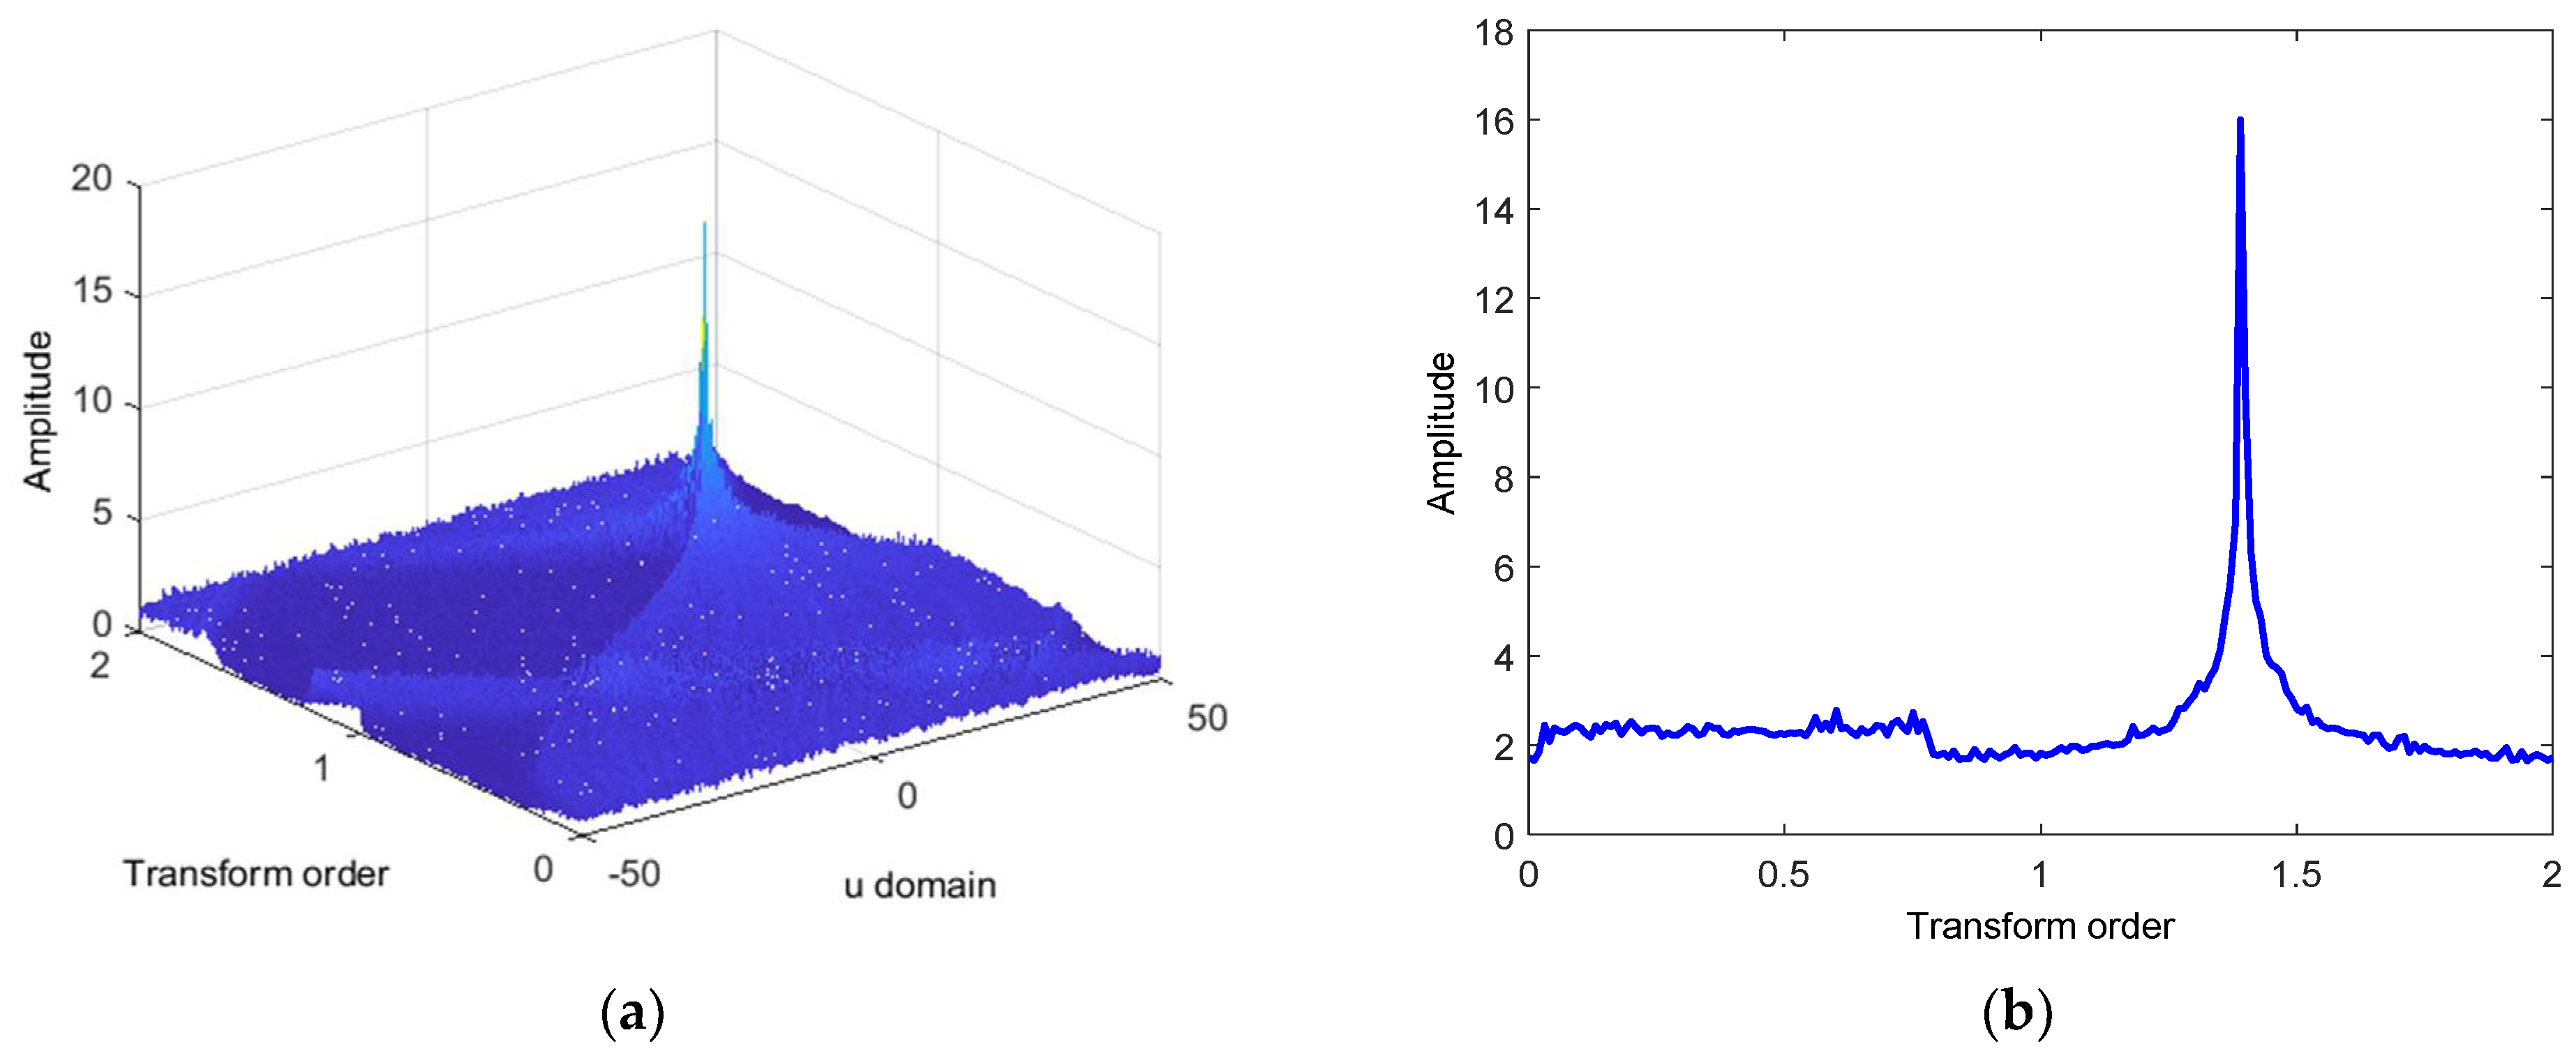
, initial frequency of 30 Hz, sampling frequency of 100 Hz, and frequency modulation slope of 10 Hz/s is generated in the Matlab environment. Set the transform order from 0 to 2 in steps of 0.01, and calculate the corresponding FrFT spectrum and the curve projected in the fractional domain through discrete sampling FrFT, as shown in
Figure 2.
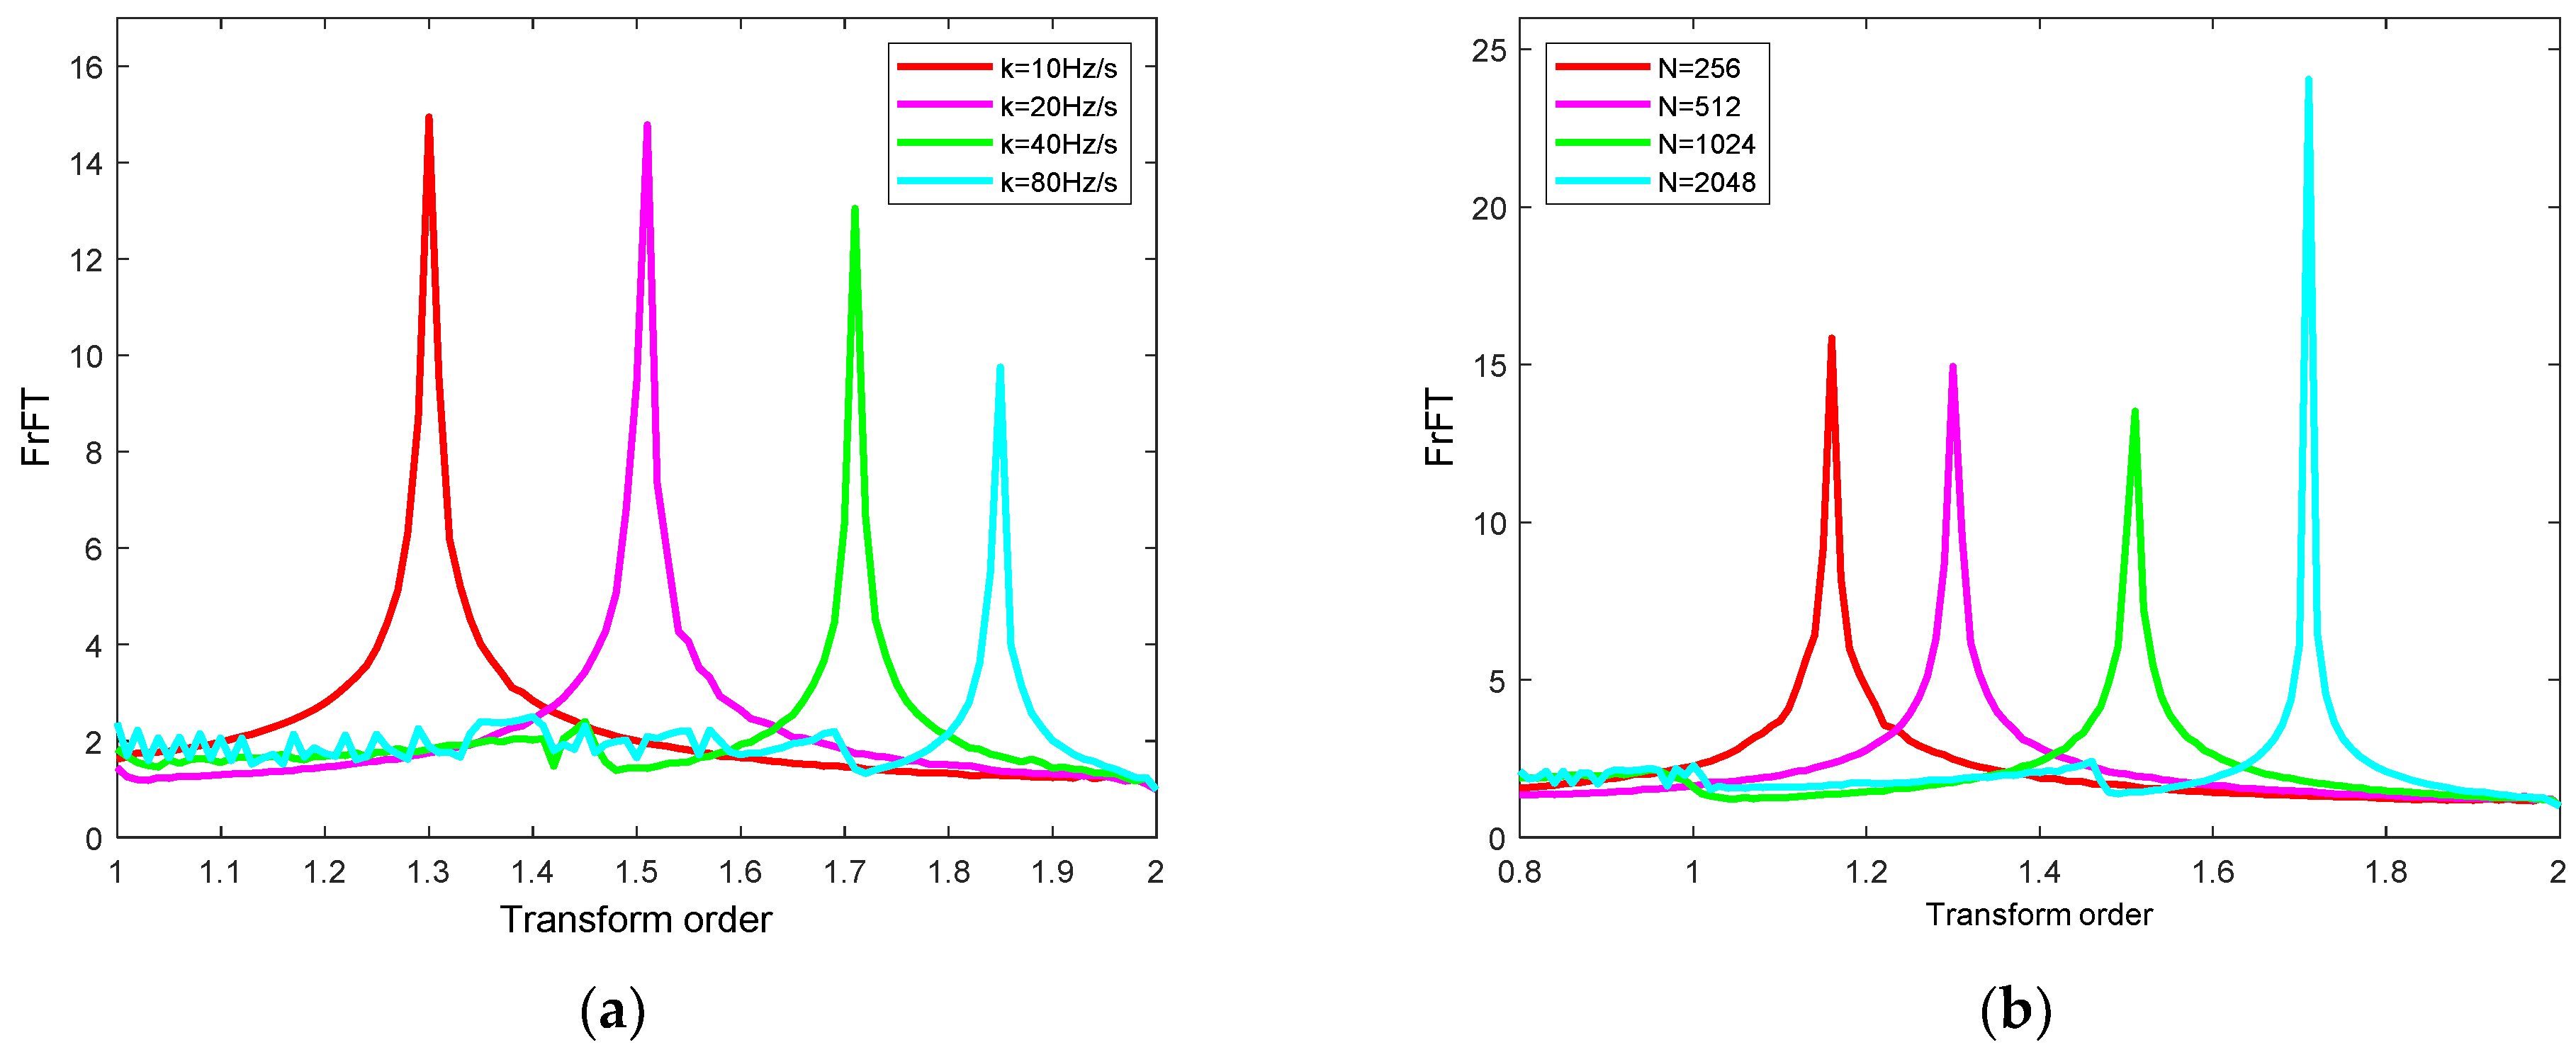
In order to verify the influence of the chirp parameter and sampling points on the optimal order in FrFT, we first set the different chirp parameter as 10 Hz/s, 20 Hz/s, 40 Hz/s, and 80 Hz/s to simulate the FrFT of the chirp signal. The results are shown in
Figure 3a. It can be seen from the figure that the peak position of the chirp signal is closely related to the magnitude of the chirp parameter. The estimated value of the chirp parameter can be calculated according to Equation (11), which verifies the effectiveness of FrFT in the parameter estimation of the chirp signal. Secondly, the FrFT of the chirp signal is simulated with different sampling points of 256, 512, 1024, and 2048, respectively. The results are shown in
Figure 3b. When the number of sampling points changes, the optimal order will change, and the smaller the number of samples, the wider the peak, so it is easier to search the optimal order, which greatly reduces the computational complexity.
From the analysis of the above simulation results for the chirp signal, it can be seen that in the process of parameter estimation, in addition to the change of sampling points affecting the optimal order, the setting of a transform order search interval will also affect the selection of the optimal order until it further affects the parameter estimation accuracy. In this regard, we conduct a parameter estimation simulation for different sampling points (256, 512, 1024, and 2048, respectively) and a transform order search interval of 0.01 and 0.001, respectively, when the chirp parameter is 40 Hz/s. We thereby obtain the corresponding optimal transform order value, estimation error, and average error rate under each simulation environment. The detailed simulation results are shown in
Table 1.
It can be seen from
Table 1 that under the same number of sampling points and with the reduction of the search interval, the estimated error value of the chirp parameter and the average error rate show a decreasing trend, but it will bring about the disadvantage of increasing computational complexity, and the value of sampling points will also have a great impact on the estimation accuracy and computational complexity.
2.2.3. CD and Fractional Fourier Transform
It is well known that CD in the optical fiber link will cause the optical signal to become a chirp signal, that is to say, the CD is understood as a chirp signal in the frequency domain, so the parameter estimation method introduced above can be analogous to the CD estimation.
According to the EC effect of the chirp signal in the fractional domain, we can calculate the CD value of the optical fiber communication system under different working conditions. For the effect of CD, there is also a specific transform order Q, which can be expressed as follows, by analogy with the chirp parameter estimation formula:
where
is the optical fiber transmission length, and
is the optical signal length.
Combined with the CD coefficient expression, Equation (14) can be transformed into:
where
is the cumulative CD of the fiber link at different operating wavelengths.
Table 2 lists the comparison between the chirp signal in the time domain and the CD signal in the frequency domain, including expression, specific FrFT transform order and the relationship between order and parameters to be estimated.
After the FrFT with order is performed on the signal, the inter symbol interference (ISI) originally caused by CD can be minimized in the transformed fractional domain. This shows that the group velocity delay introduced by CD does not exist in the specific fractional transform domain, so the signal characteristics in the fractional domain are similar to those in the time domain without CD. In order to find a specific fractional domain transform order suitable for CD monitoring, the EC function mentioned above is still used in this section.
For optical fiber signals with different modulation formats, their EC may be slightly different. For example,
Figure 4 shows the EC performance of PM-QPSK and PM-16QAM signals under different CD. It can be seen from the Figure that the PM-QPSK and PM-16QAM signals have downward spikes under the action of FrFT, and different CD values in the optical fiber link correspond to different transform orders. Therefore, the CD values of different optical fiber signals can be monitored according to this characteristic.
2.3. Optimization of Computational Complexity of the CD Estimation Method Based on FrFT
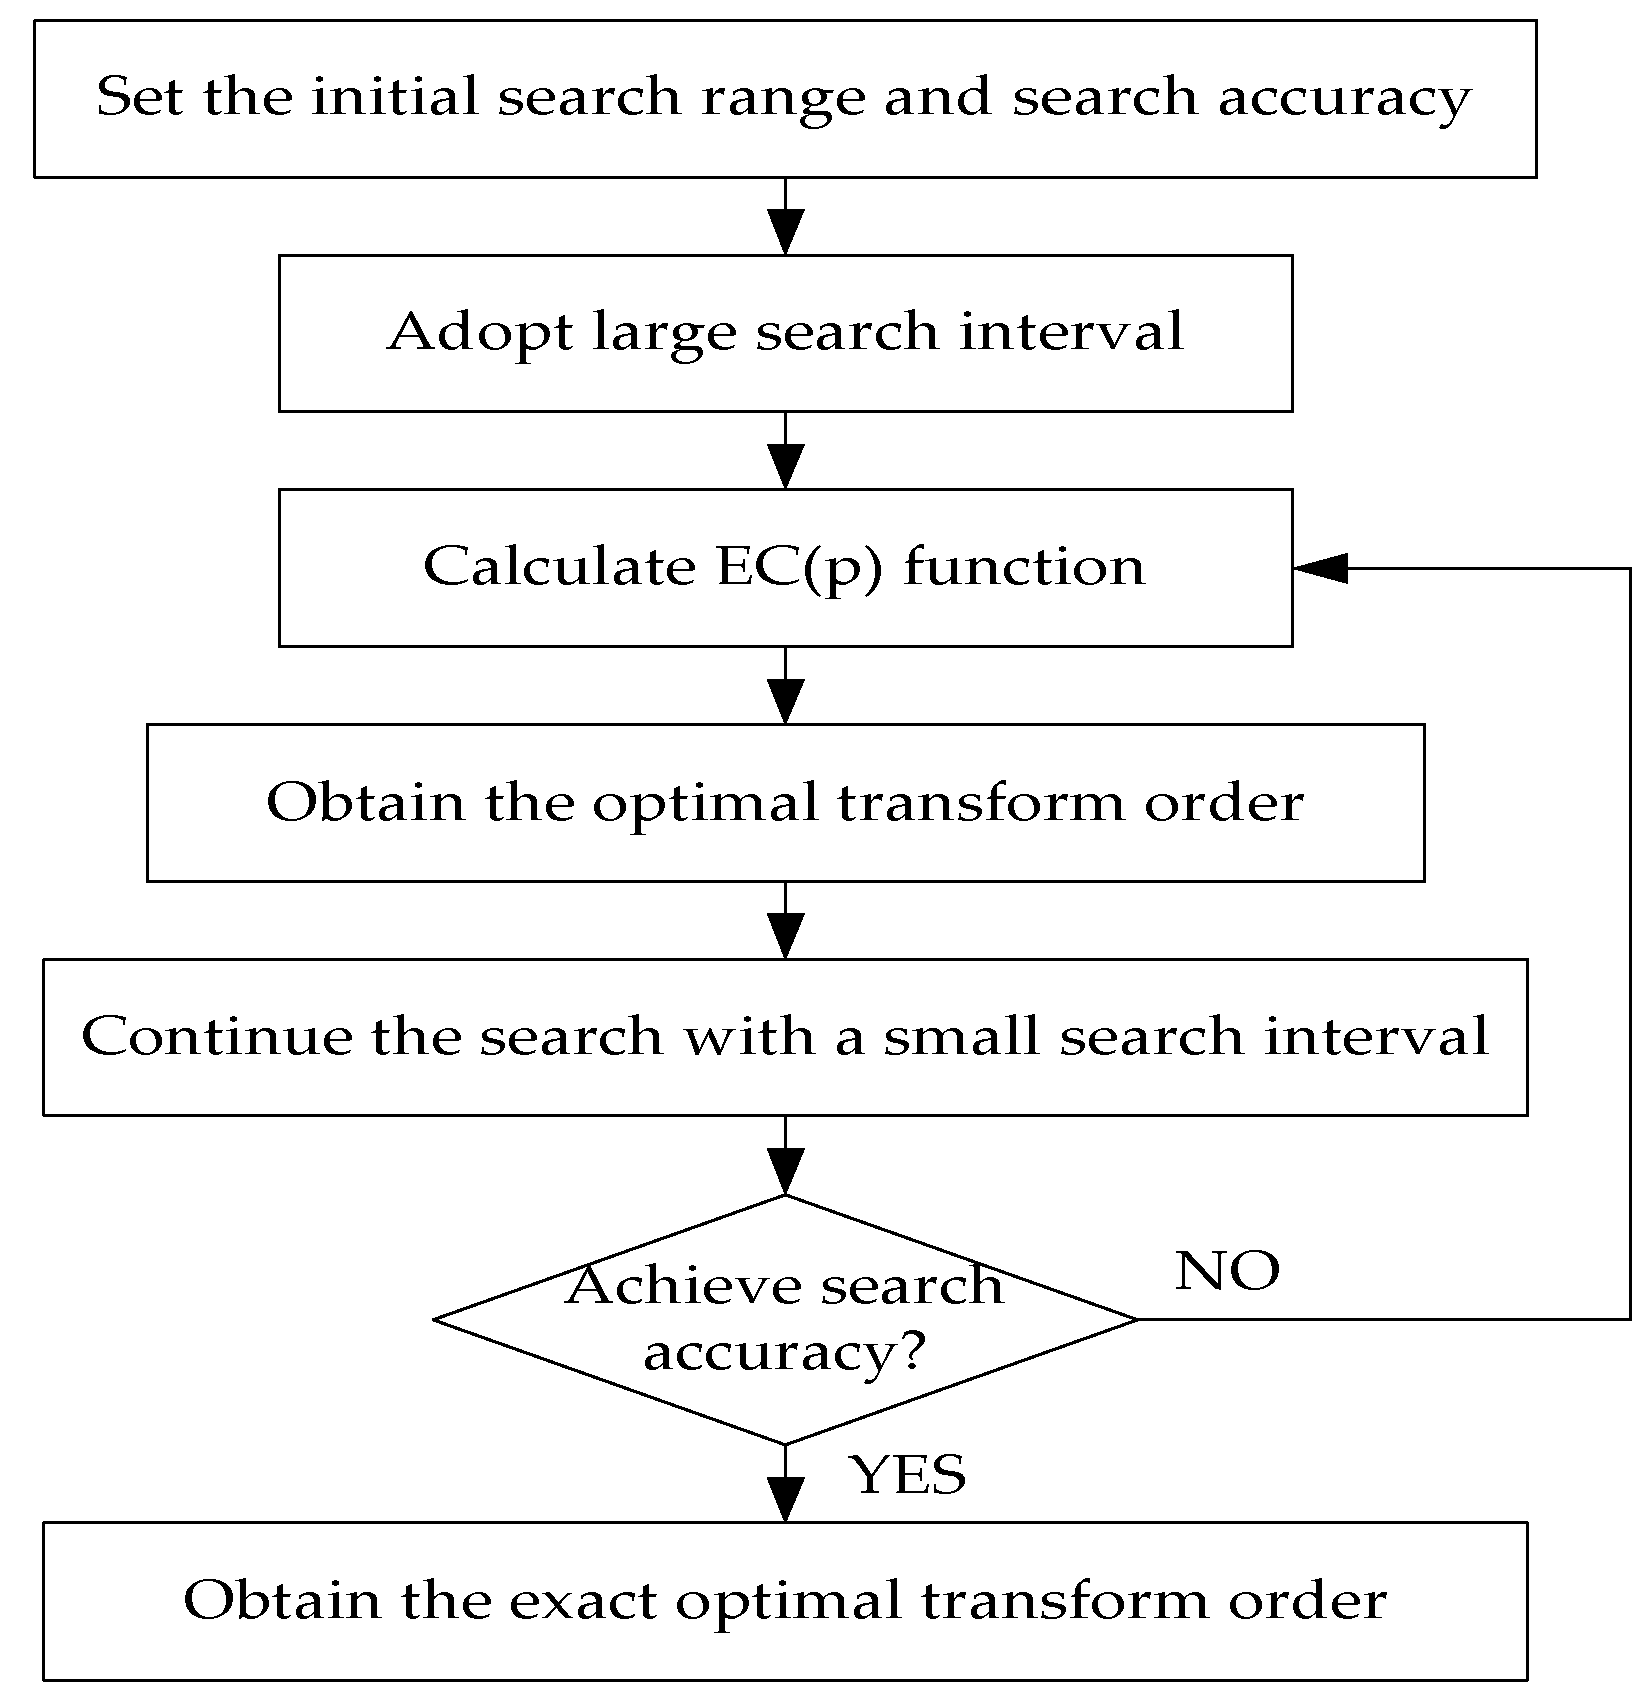
In order to obtain the optimal order of the FrFT, the traditional two-dimensional search method uses the transform order as a variable to perform a grid search within a set range. In order to improve the measurement accuracy, more samples and a smaller search interval are required, resulting in a higher computational complexity. For example, when the search accuracy reaches 0.00001 and the optimal order is searched in the range of (−1,1), 200,000 searches are required in principle. In order to reduce the complexity under the premise of the accuracy of CD estimation, and when the number of samples is a certain value, an optimal order search method based on a stepwise process is proposed. For the new search method, the search process is divided into two parts: coarse search and fine search for multi-step adjustment. Therefore, the search range is gradually reduced.
Figure 5 shows a flowchart of a new search method for the optimal transform order based on the stepwise approach.
First, use a larger order search interval to perform a coarse search in the initial search range to obtain a coarse result, then a small range search is carried out near the rough value, and so on until the initial set search precision is searched and a more accurate optimal order is obtained. For example: first, perform a coarse search in the interval (−1,1) with a step of 0.01, and the number of searches is 200 to obtain a coarse transform order. Then, carry out the second step search in the range of plus or minus 0.5 near the order with a step of 0.001. The number of searches is 1000 to obtain a more accurate and optimal change order, and finally step in the range of plus or minus 0.05 with a step of 0.0001. A fine search is performed, and the number of searches is 1000 to obtain the optimal transform order at this precision. It can be seen that, under the condition of the same search precision, the number of searches for the optimal stepwise search method is 2200, compared with 20,000 for the one-step search method, which greatly reduces the computational complexity.
3. Simulation Setup
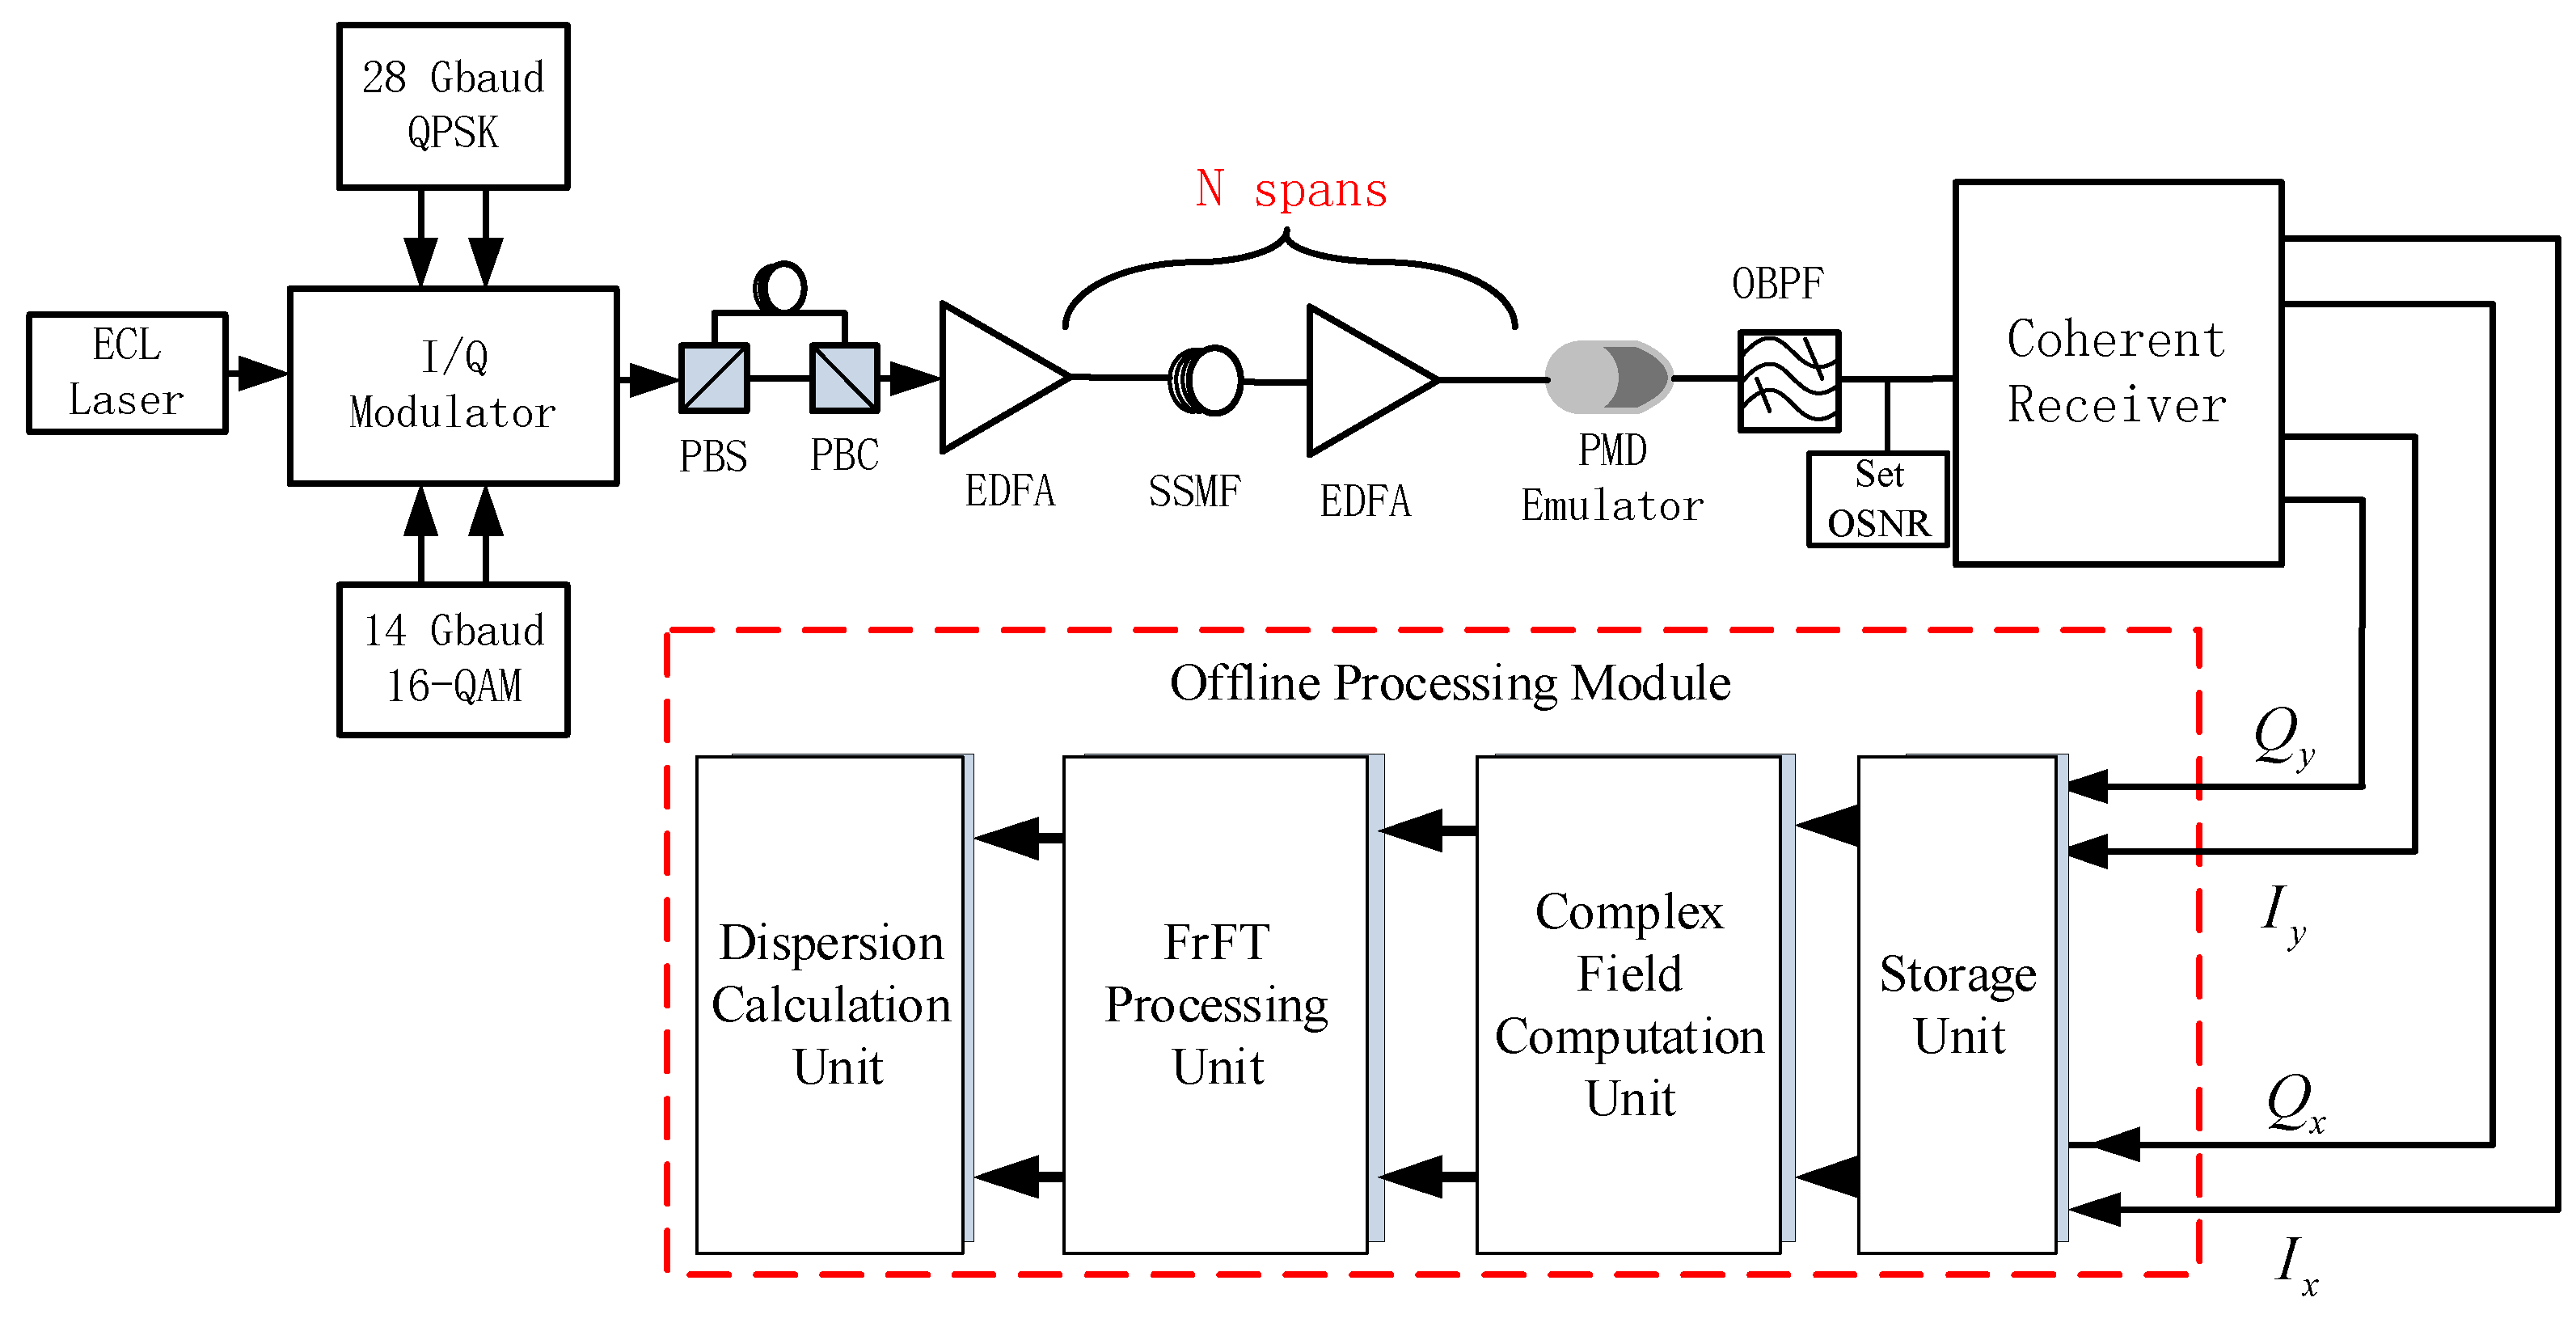
In order to verify the feasibility of the CD estimation method based on FrFT, we use Matlab and Optisystem to jointly simulate and build optical fiber signal transmission systems with single carriers of 28GBaud PM-QPSK and 14GBaud PM-16QAM, respectively, as shown in
Figure 6. At the system transmitter, the IQ modulator is driven by an uncorrelated pseudo-random sequence to generate signals with different rates and modulation formats. The signal is input into the optical fiber link for transmission after passing through the polarization multiplexing module and preamplifier. The optical fiber link is composed of the set standard single-mode fiber (SSMF) through the loop. After each section of optical fiber transmission, the power loss of optical signal will be compensated by an erbium-doped fiber amplifier (EDFA). The noise index of EDFA module is set to 0 dB, that is, it is assumed that EDFA will not introduce amplified spontaneous emission (AES) noise to reduce OSNR, so we add a SetOSNR module at the end of the whole optical fiber link to change the OSNR of the received signal by directly adding AES noise. The incident optical power of the optical fiber link is 0 dBm, the single span length of SSMF is initially set as 100 km, the CD coefficient is 16 ps/nm/km, the CD slope is 0.075 ps/(nm
2·km), the polarization mode dispersion (PMD) coefficient is 0.1 ps/km
1/2, and the nonlinear coefficient is 2.6 W
−1·km
−1. We change the final cumulative CD by changing the length of each transmission fiber, and control the CD range from 1600 ps/nm to 32,000 ps/nm. Set the OSNR in the range of 12 dB to 30 dB (in steps of 3 dB) by setting the SetOSNR module, and set the PMD in the system in the range of 0 ps to 40 ps (in steps of 5 ps) by adding a PMD simulator. After link transmission and coherent detection, the output signal is saved and input to Matlab for offline processing. Phase noise (a kind of nonlinear effect) will be introduced in the simulation process. The existence of CD suppresses the nonlinear phase noise, and the larger the CD value, the smaller the nonlinear noise of the system.
In the off-line processing module, the data output by the receiver are sampled and extracted with appropriate length, firstly, and the extracted data are input to the storage unit to provide a data source for subsequent CD estimation. Secondly, the extracted four channels of data are combined into two channels of polarization data through the complex field calculation unit. Then, the FrFT processing unit is used to calculate the EC function after FrFT of different orders. Through the preset CD and the search range of transform order, and using the mathematical relationship between transform order and CD in the formula, the order in is replaced by the CD value . Finally, the CD value corresponding to the peak position is found through the distribution characteristics analyzed by the CD calculation unit, which is the estimated value. In order to measure the effect of CD estimation, the average dispersion estimation error , standard deviation and the range of dispersion estimation error are used to evaluate.
4. Results and Discussion
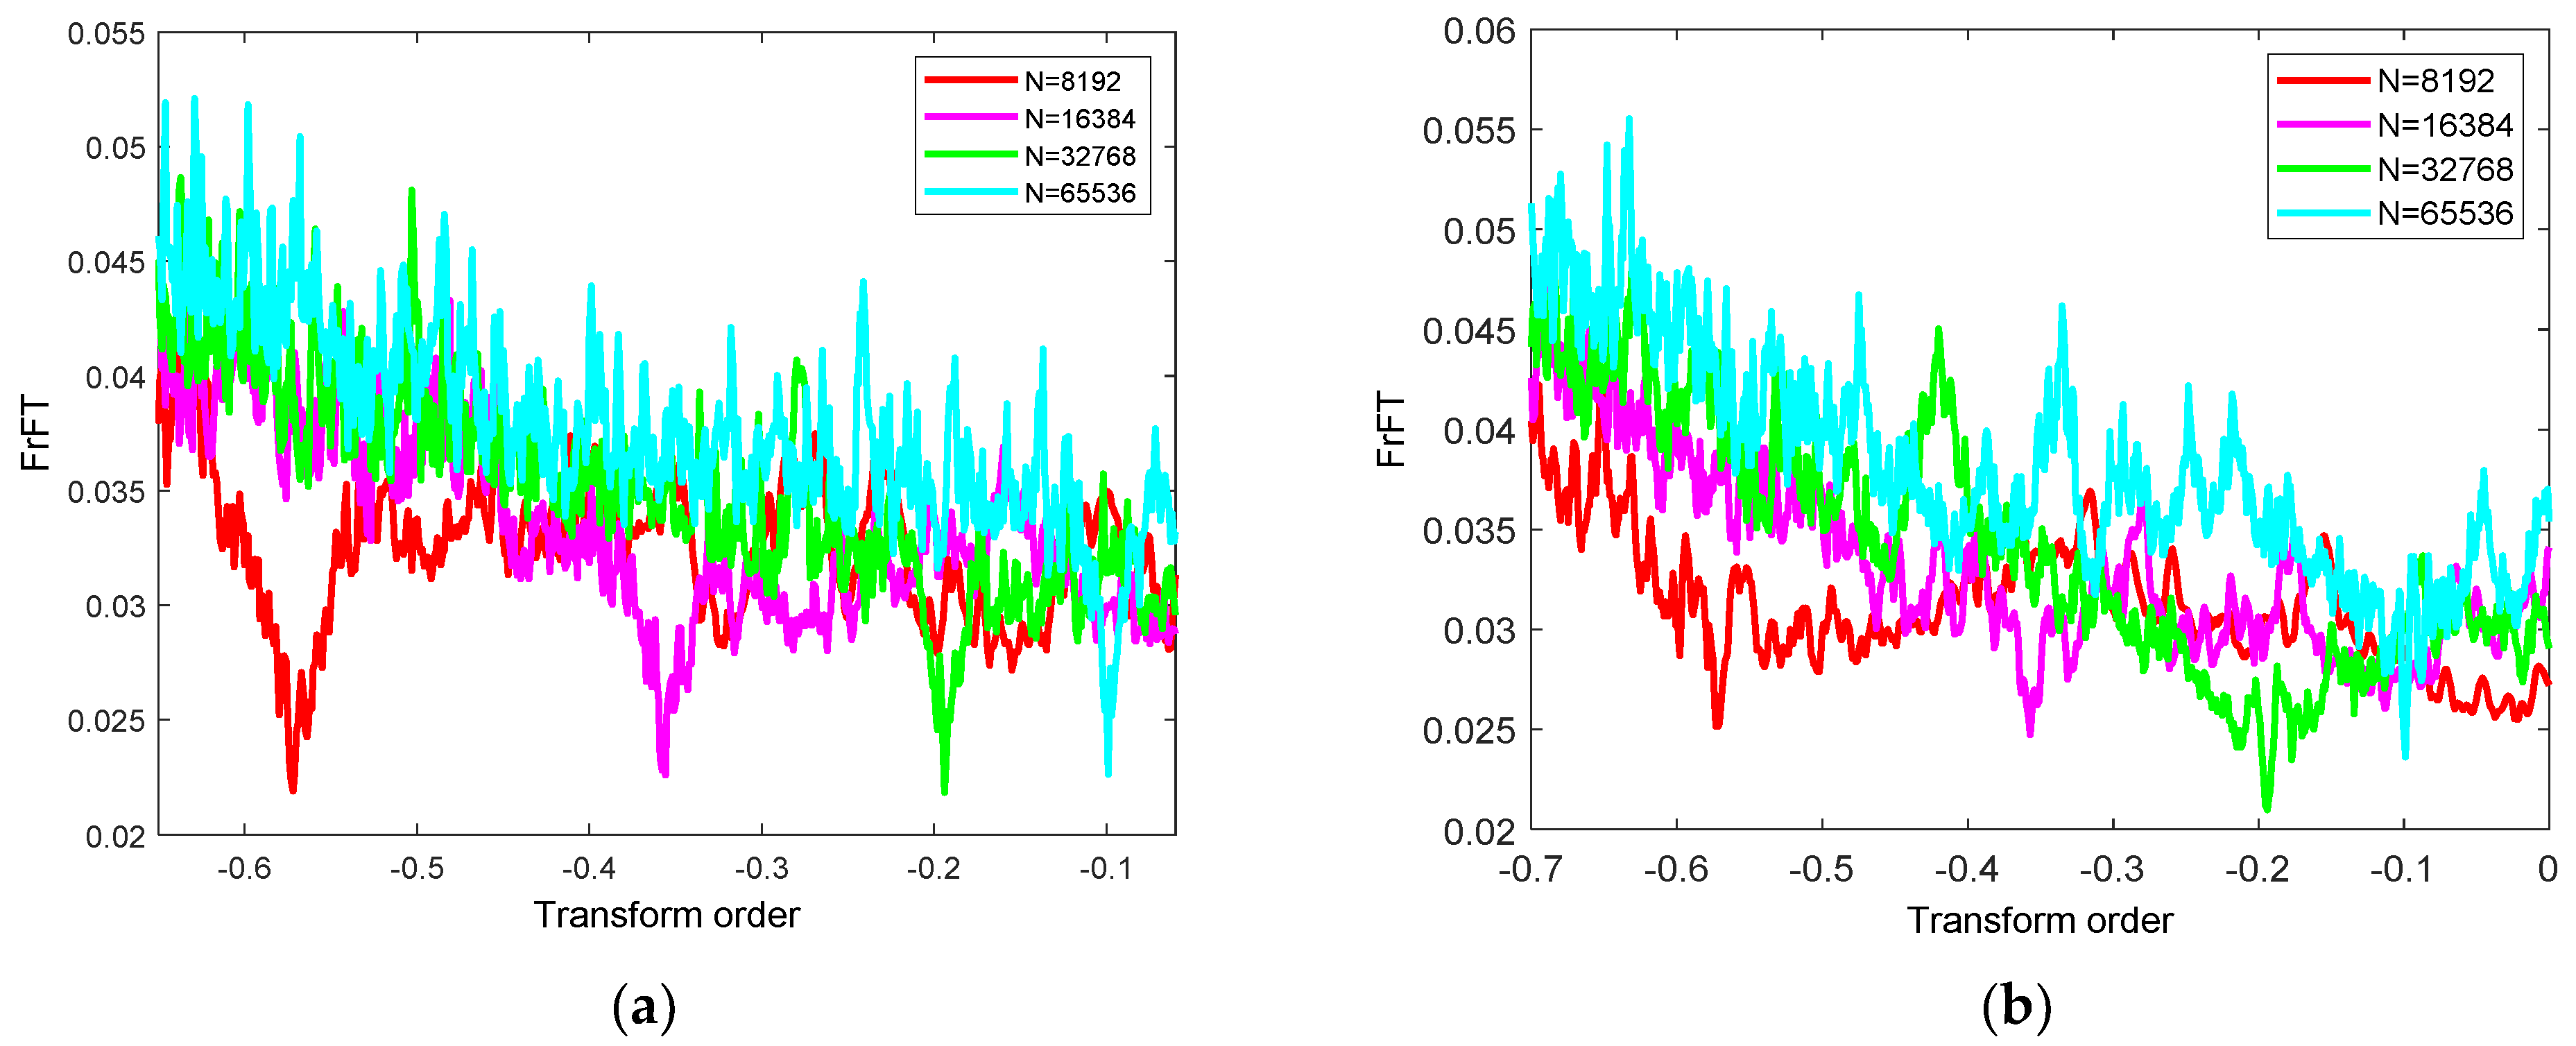
According to the above analysis of chirp signal parameter estimation, using different sampling points and transform order search intervals will bring different parameter estimation effects. By changing different sampling points, we perform FrFT on PM-QPSK and PM-16QAM signals to obtain the EC distribution diagram, as shown in
Figure 7.
It can be seen from the figure that the two types of signals have downward peaks under different sampling points, and their extreme points correspond to different transform orders. Therefore, different sampling points combined with a different transform order and search interval will have different effects on the estimation accuracy of CD. However, more sampling points and a smaller search interval will lead to a higher computational complexity. It is worth mentioning that the reason why
Figure 3 is smooth compared with
Figure 4 and
Figure 7 is that
Figure 3 is only for chirped signals, and Gaussian white noise has little effect on FrFT.
Figure 4 and
Figure 7 show the performance of specific signals in complex optical fiber links, and the corresponding results will be affected by complex factors such as cumulative CD, link noise, nonlinearity, and so on.
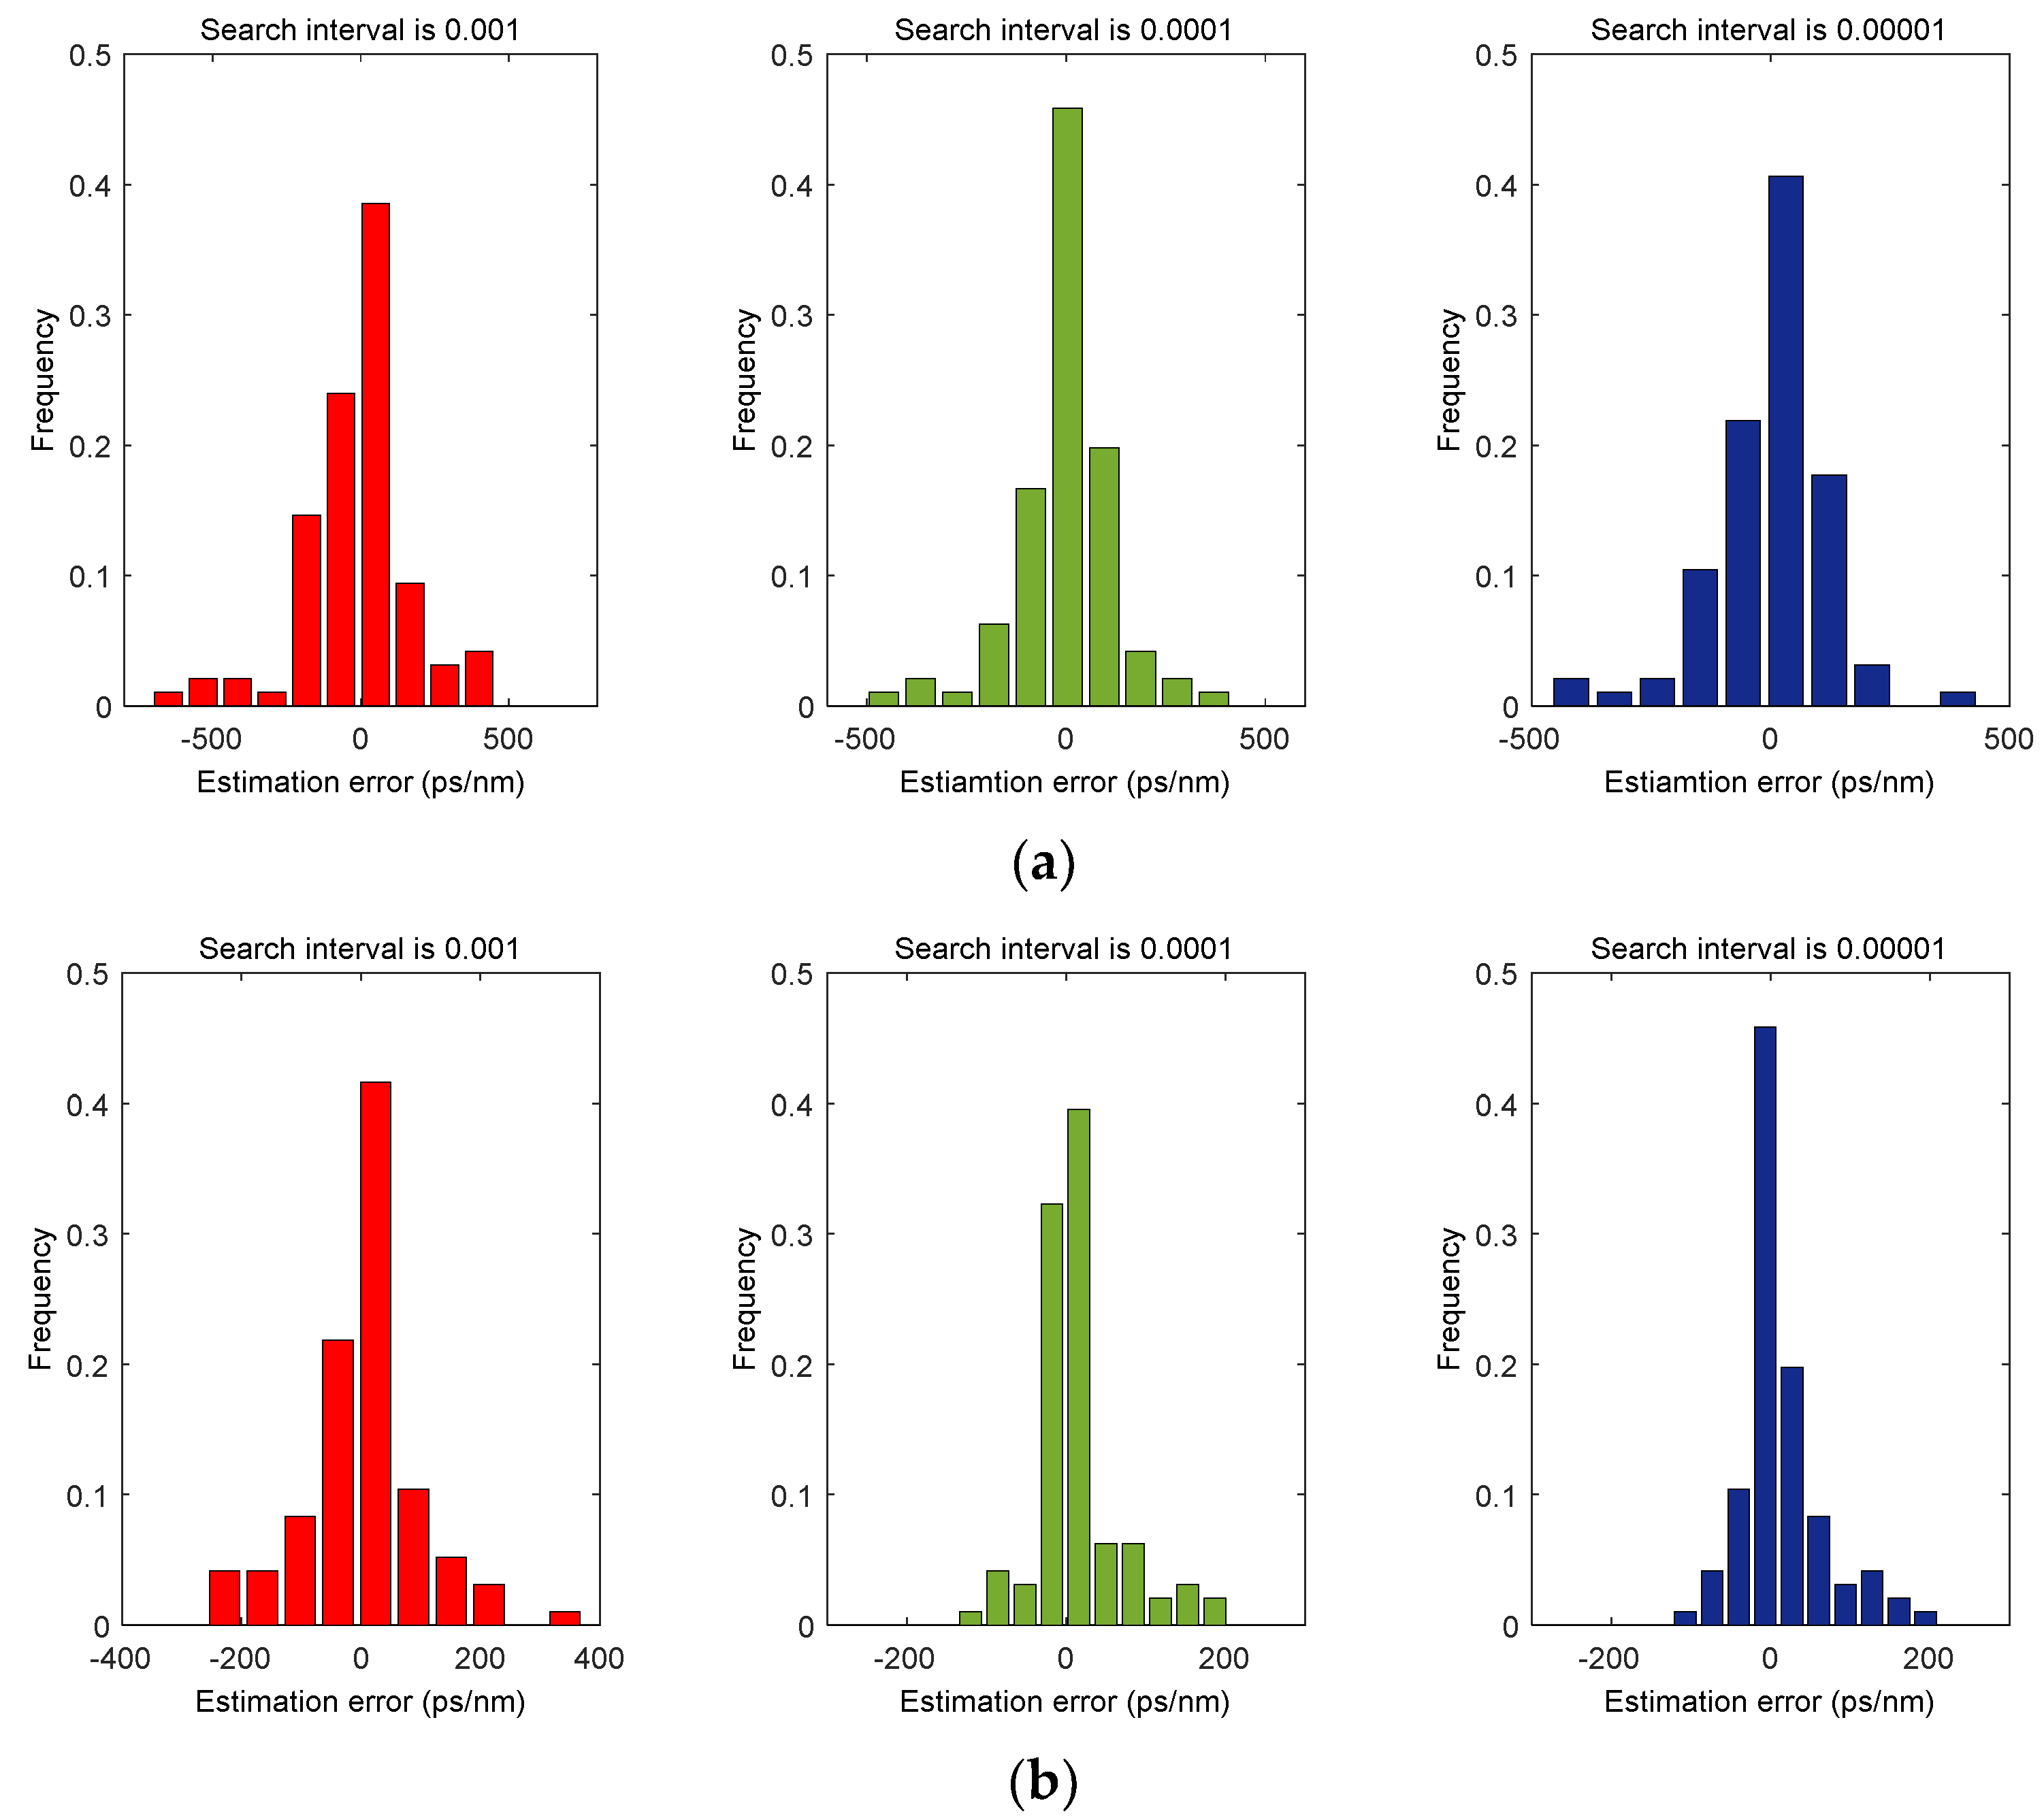
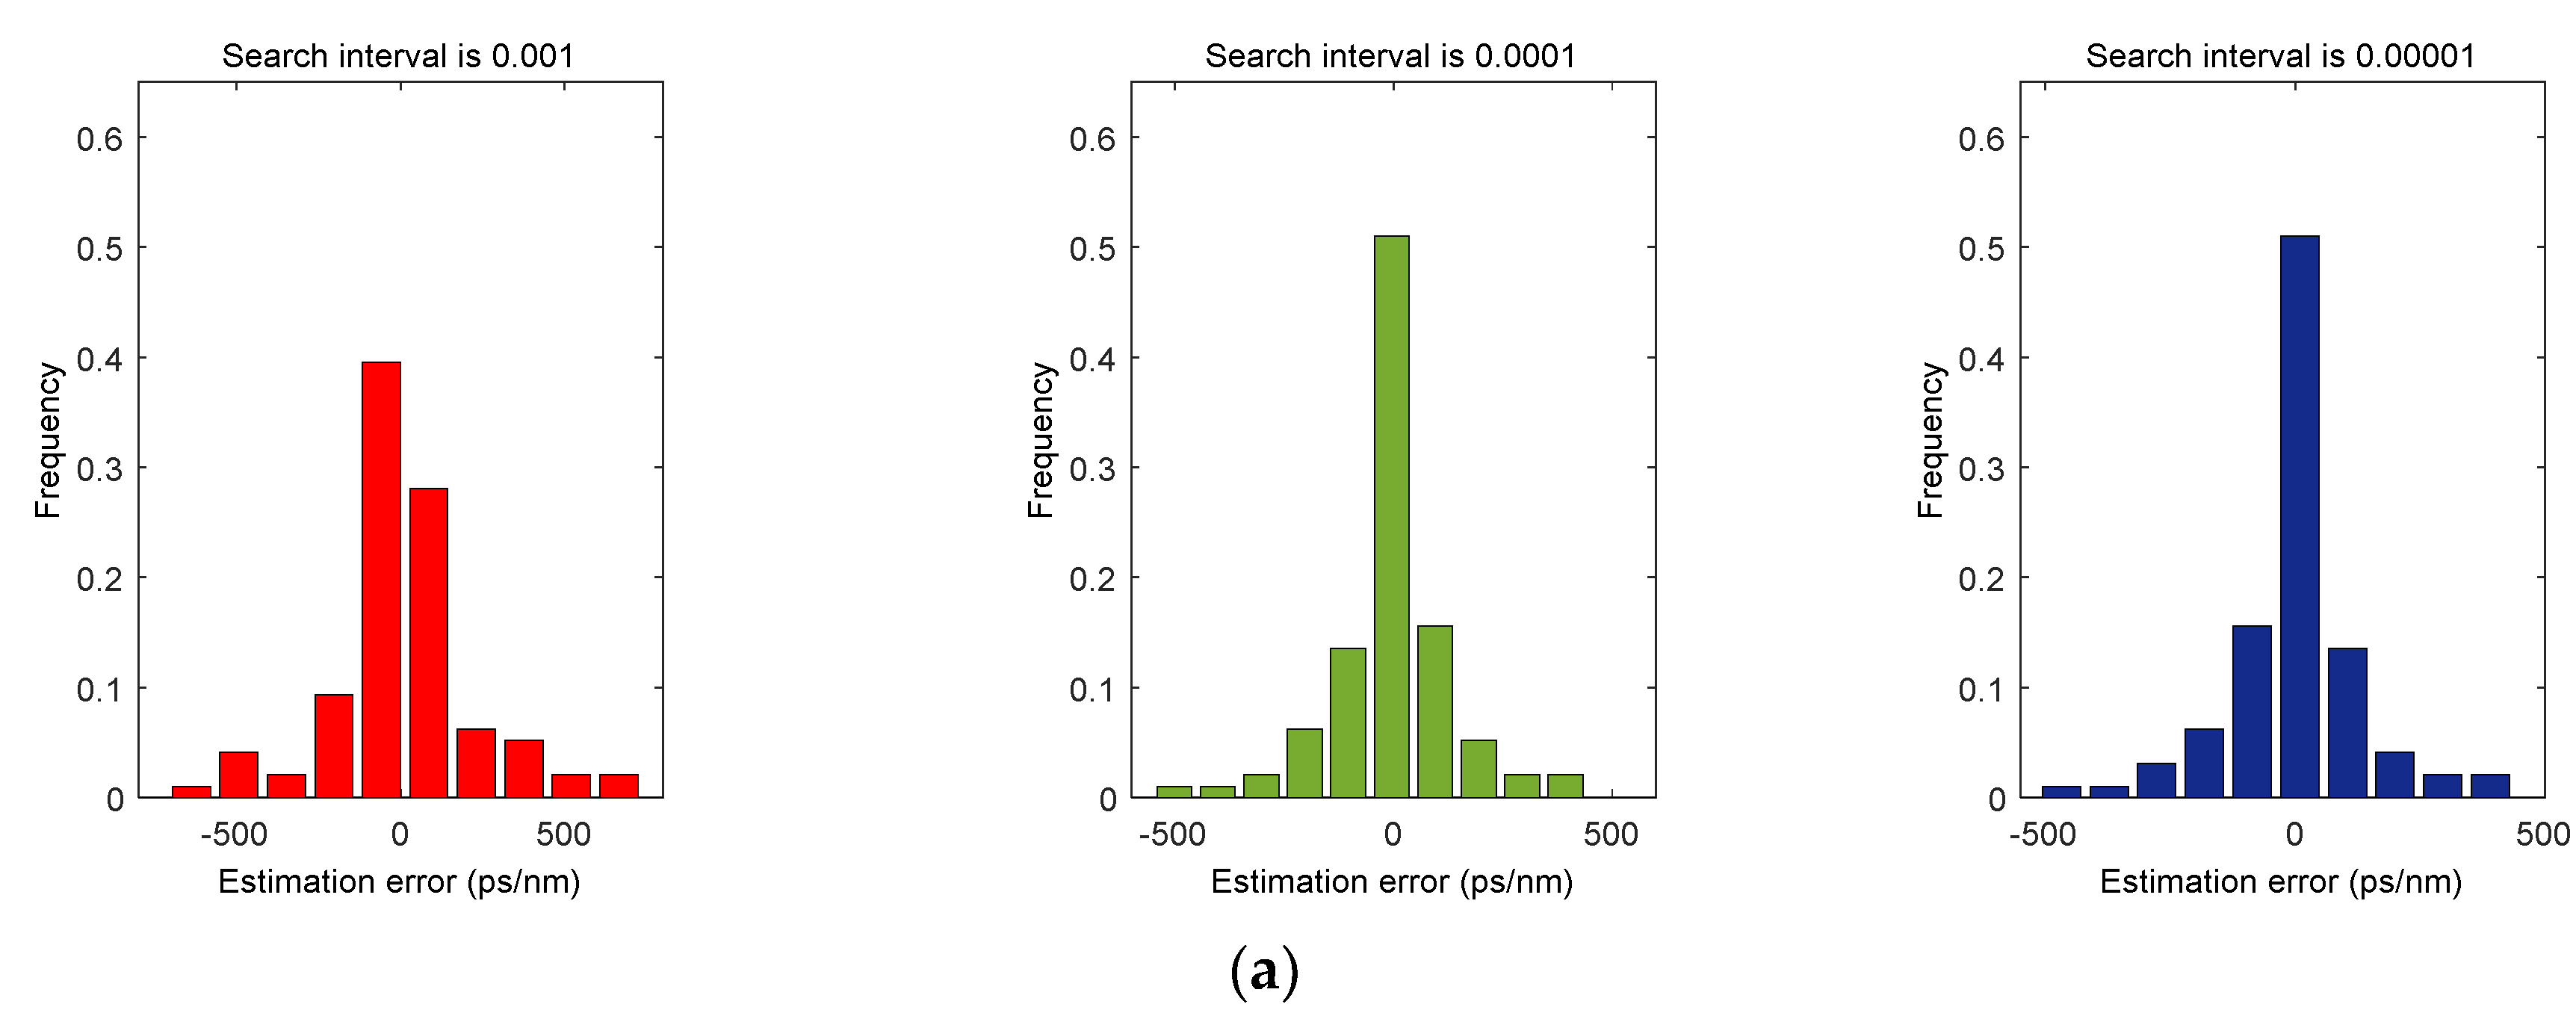
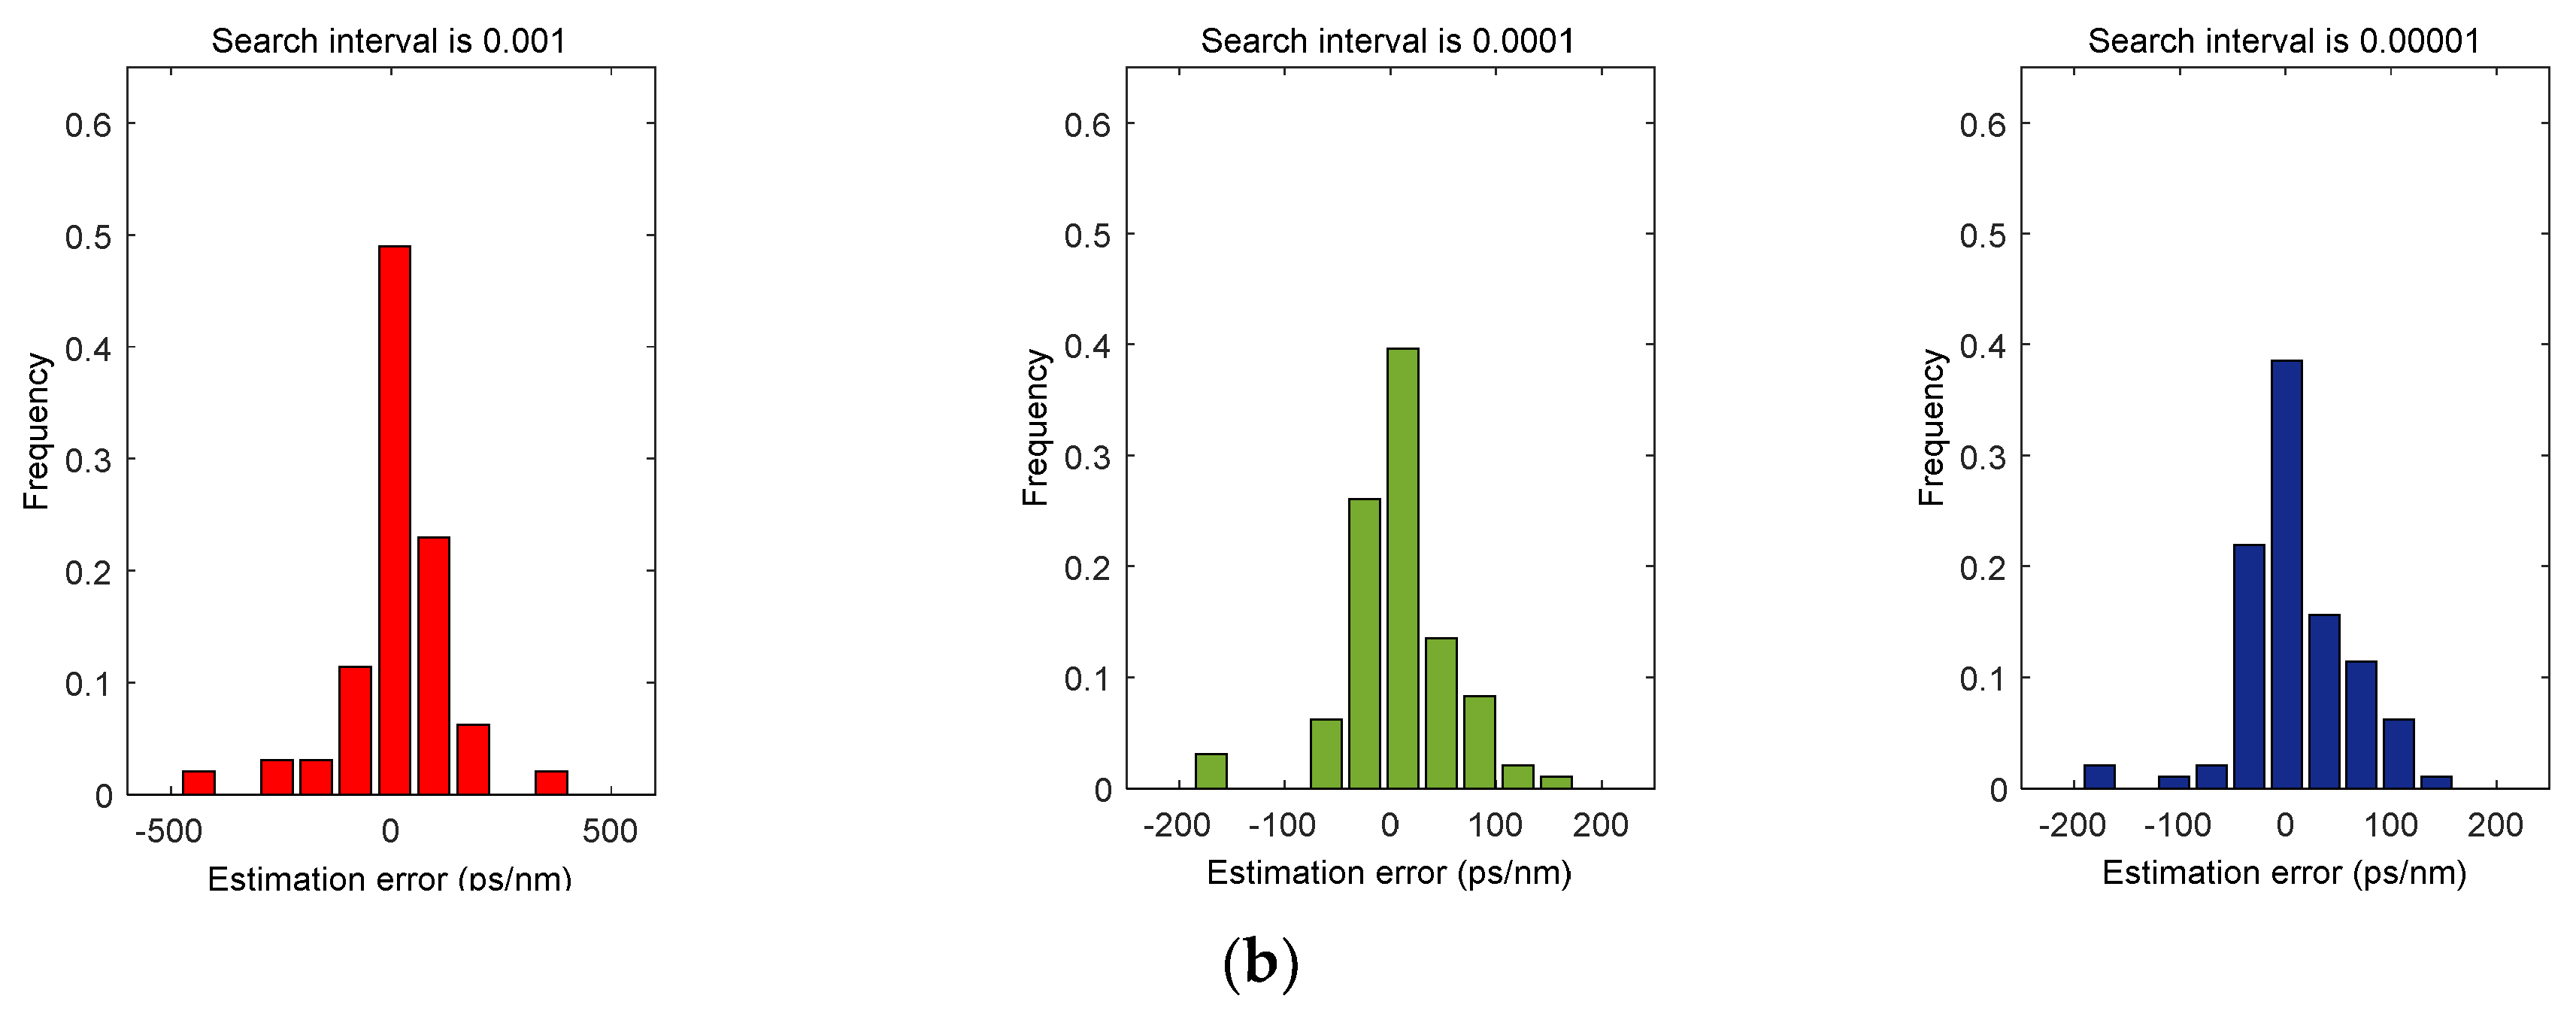
Next, we use different sampling points (2048, 4096) and different order search intervals (0.001, 0.0001, 0.00001) for the two modulation format signals to simulate and compare the dispersion estimation of optical fiber links with an optical fiber length of 100 km to 2000 km (step length of 20 km). For each combination of different sampling points and search intervals, we can obtain the CD estimation error distribution histogram under different fiber lengths, as shown in
Figure 8 and
Figure 9.
Table 3 shows the mean value, standard deviation, and error range of CD estimation error of two types of signals under different sampling points and search intervals.
From the above distribution histogram and the results in
Table 3, it can be intuitively analyzed that under the same search interval, the more sampling points, the higher the accuracy of the CD estimation error and the gradual reduction of error range. Under the same sampling number, the smaller the search interval, the more the CD estimation error will gradually increase. It can be seen that using more sampling points and a smaller search interval can get more accurate CD estimation results, but it will increase the computational complexity of the whole system to some extent. Therefore, in a practical application, the number of sampling points and the search interval can be set according to the demand, that is, if the limitation on the computational complexity is relatively strong, it is necessary to reduce the number of sampling points or increase the search interval, and if it is only necessary to improve the estimation accuracy as much as possible without considering the computational complexity, we can use as many sampling points as possible or as small a search interval as possible. Through the above analysis and considering the specific estimation accuracy, this paper only needs 4096 sampling points and a 0.0001 search interval to meet most of the actual needs.
4.1. Influence of PMD, OSNR, and Nonlinear Effect on the CD Estimation Method
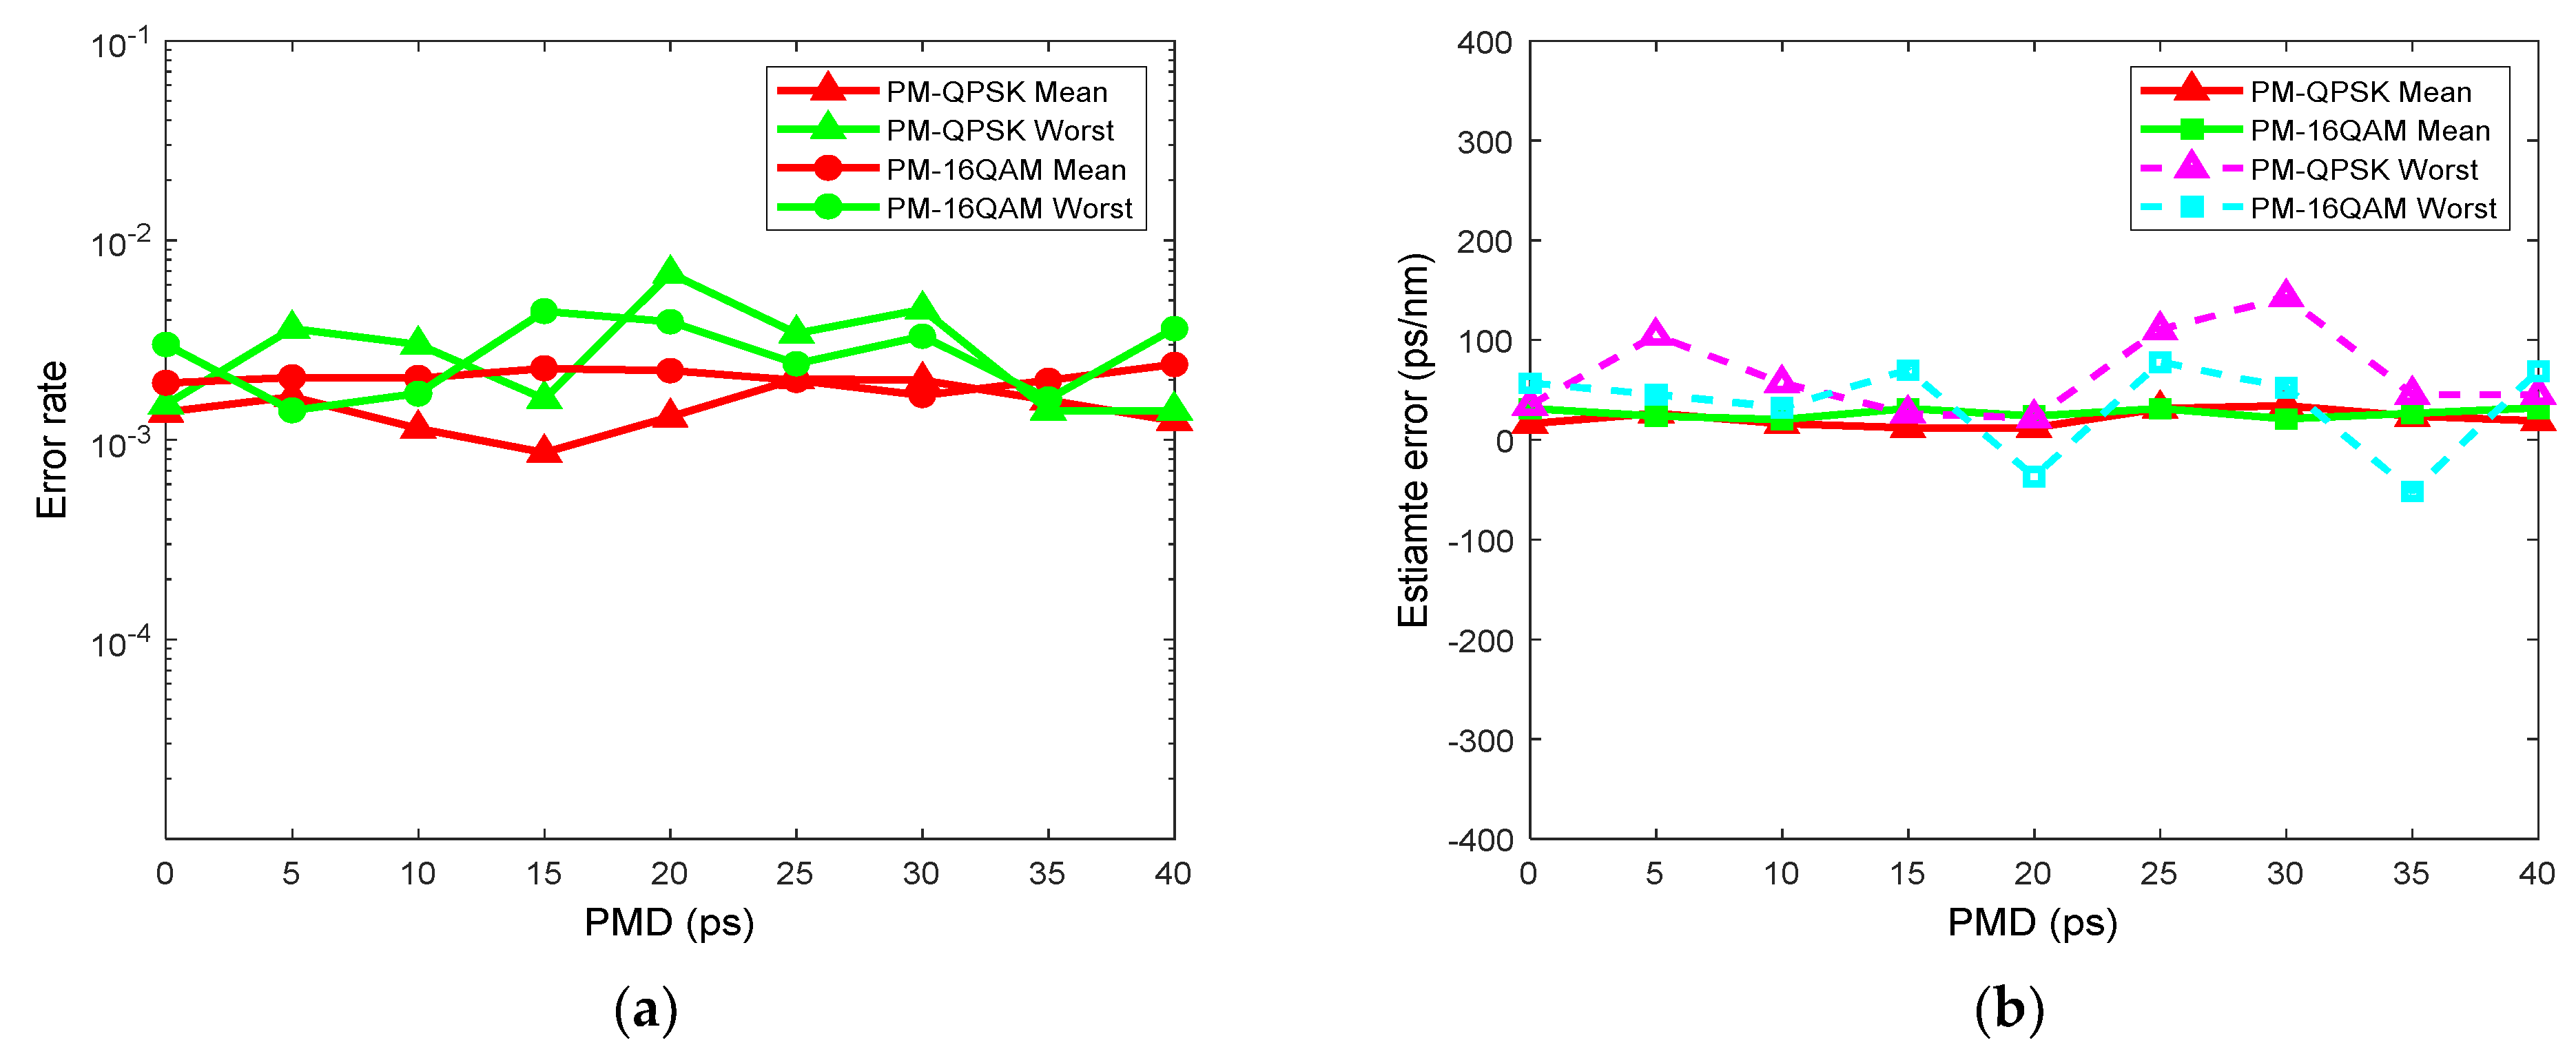
In order to explore the influence of PMD on the proposed CD estimation method, the range of PMD is changed from 0 to 40 ps by setting the PMD simulator, and the step size of each change is 5 ps. We estimate the CD of the PM-QPSK and PM-16QAM signals in the range of fiber length from 200 km to 2000 km (step length of 200 km), and their working OSNRs are 20 dB and 25 dB, respectively. Through simulation calculation, the error results of CD estimation of the two types of signals are shown in
Figure 10. It can be seen from the figure that in the case of PMD change, although the error rate of the mean and maximum of the estimation error fluctuates, it will not be significantly affected, and the average error value of the two types of signals maintains a stable trend, while the maximum error value is within the range of (−100, 150) ps/nm, which proves that the proposed CD estimation method has a good tolerance to PMD.
In order to measure the resistance of the CD estimation method to OSNR, we calculate the CD estimation results of the PM-QPSK and PM-16QAM signals while keeping other parameters unchanged and only changing OSNR (12 dB to 30 dB, step size 3 dB), as shown in
Figure 11. As shown in the figure, when the OSNR is reduced, that is, the ASE noise is increased, the variation trend of the average and maximum error rate of the two types of signals is not obvious and fluctuates in a limited range. The variation trend of the average error value is also flat, and the maximum error value fluctuates in the range of (−150, 100) ps/nm. It is proved that the proposed CD estimation method can effectively resist the ASE noise generated in the optical fiber link.
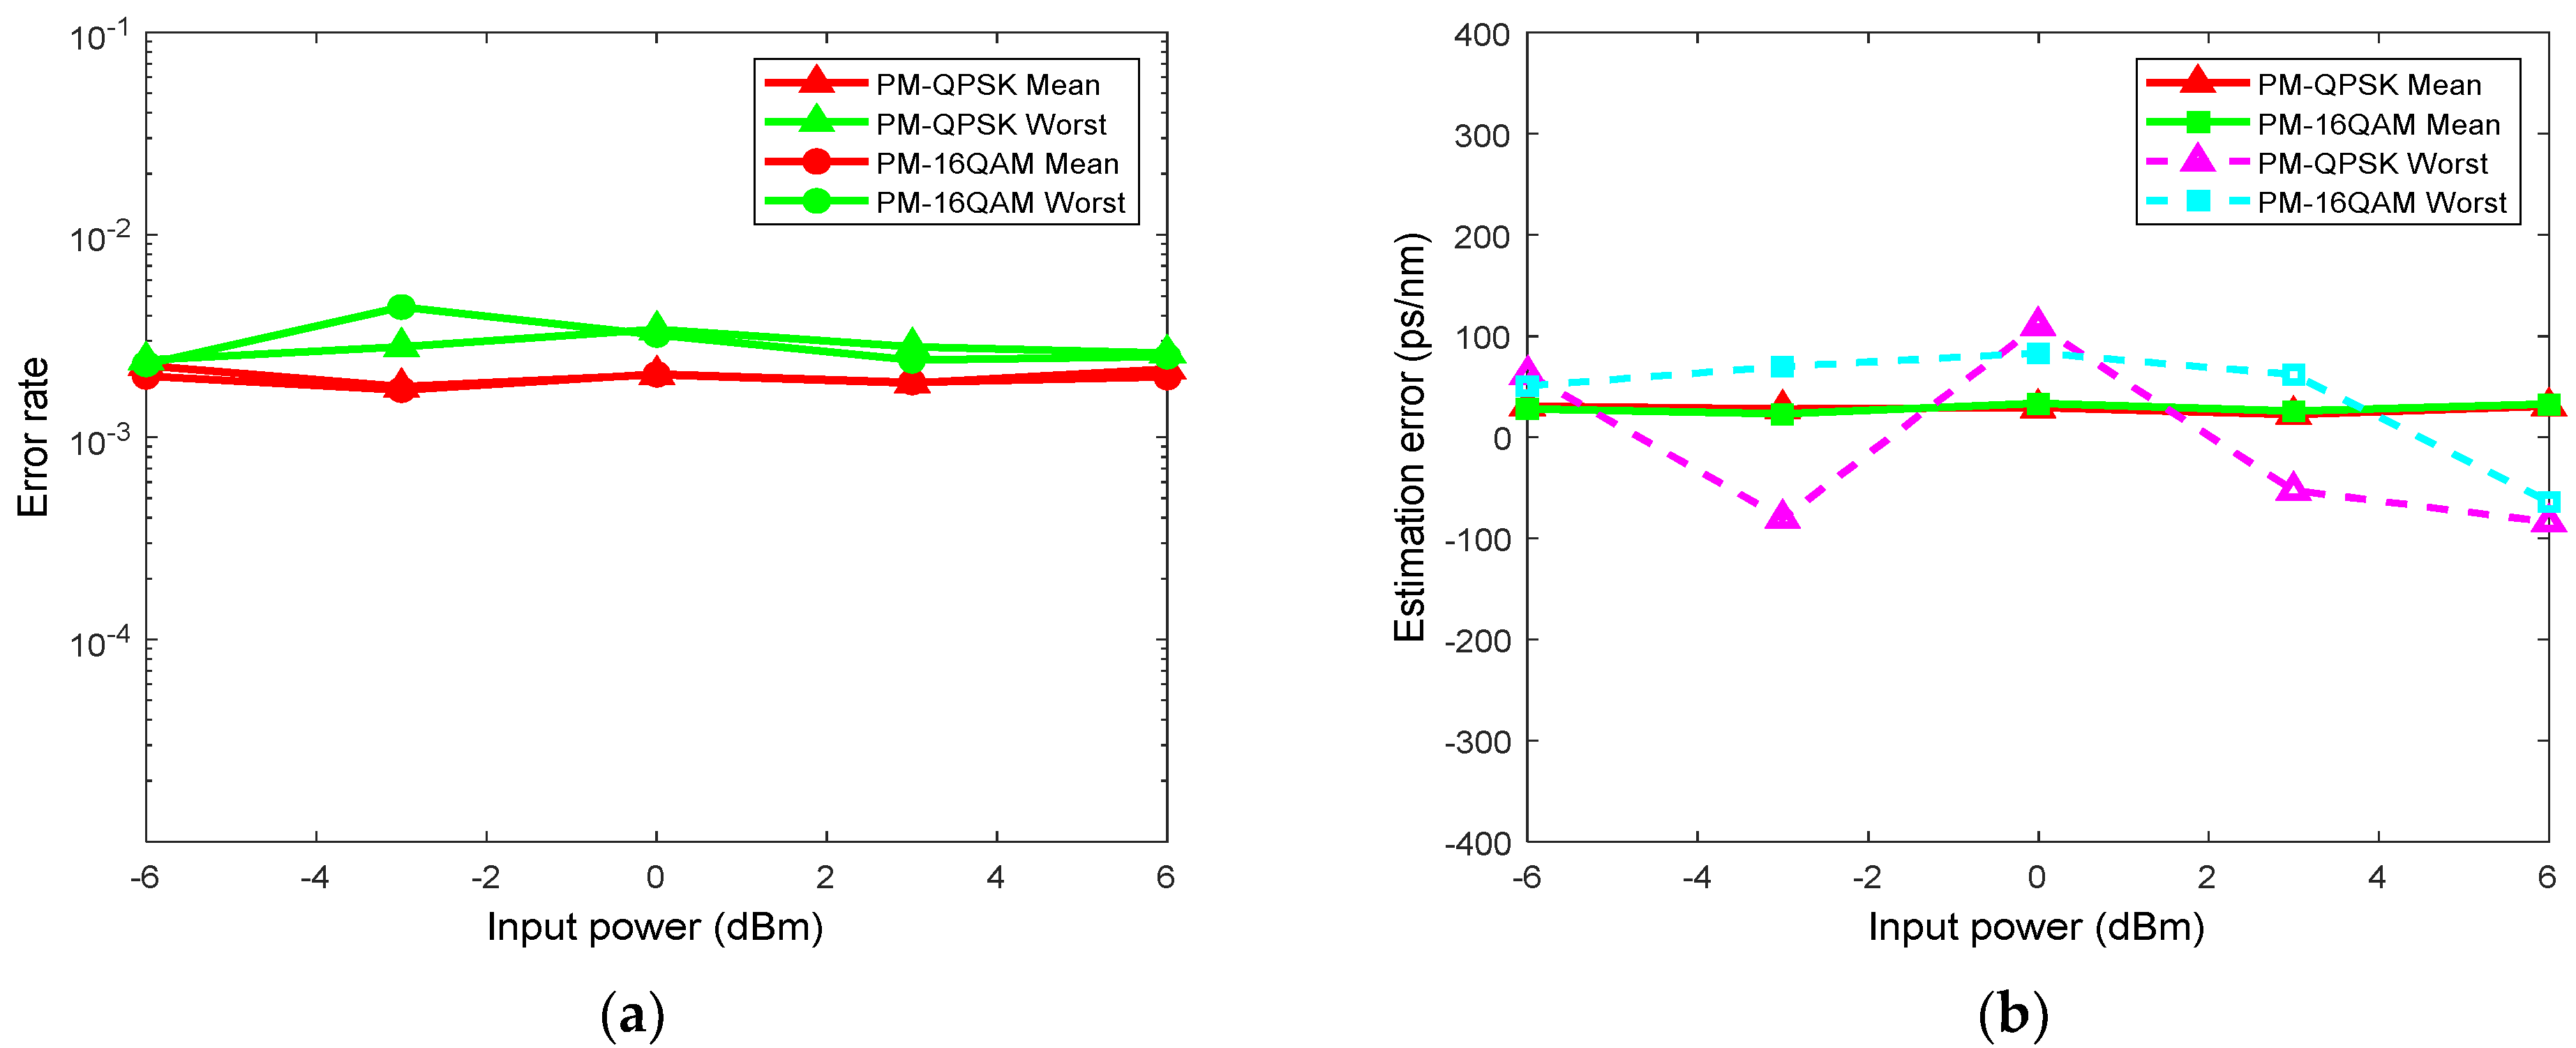
Similarly, we also study the influence of nonlinear effects in optical fiber links on the proposed CD estimation method. In order to fully show the nonlinear effect, we built two wavelength division multiplexing systems, including 5 × 112 Gbps PM-QPSK and PM-16QAM, with an interval of 50 GHz. The total distance of the optical fiber transmission link is 2000 km, and the cumulative CD is 32,000 ps/nm. Different nonlinear effects are generated by changing the input power of each wavelength channel, and the CD is estimated by using the channel signal of the middle wavelength. According to the characteristics of the wavelength division multiplexing (WDM) system, there is a large channel crosstalk in the middle wavelength, so the result of this channel is more representative. Similarly, the OSNR in the PM-QPSK and PM-16QAM links are set to 20 dB and 25 dB, respectively, the number of sampling points used is 4096, and the search interval is 0.0001. The CD estimation results of these two types of WDM systems are shown in
Figure 12.
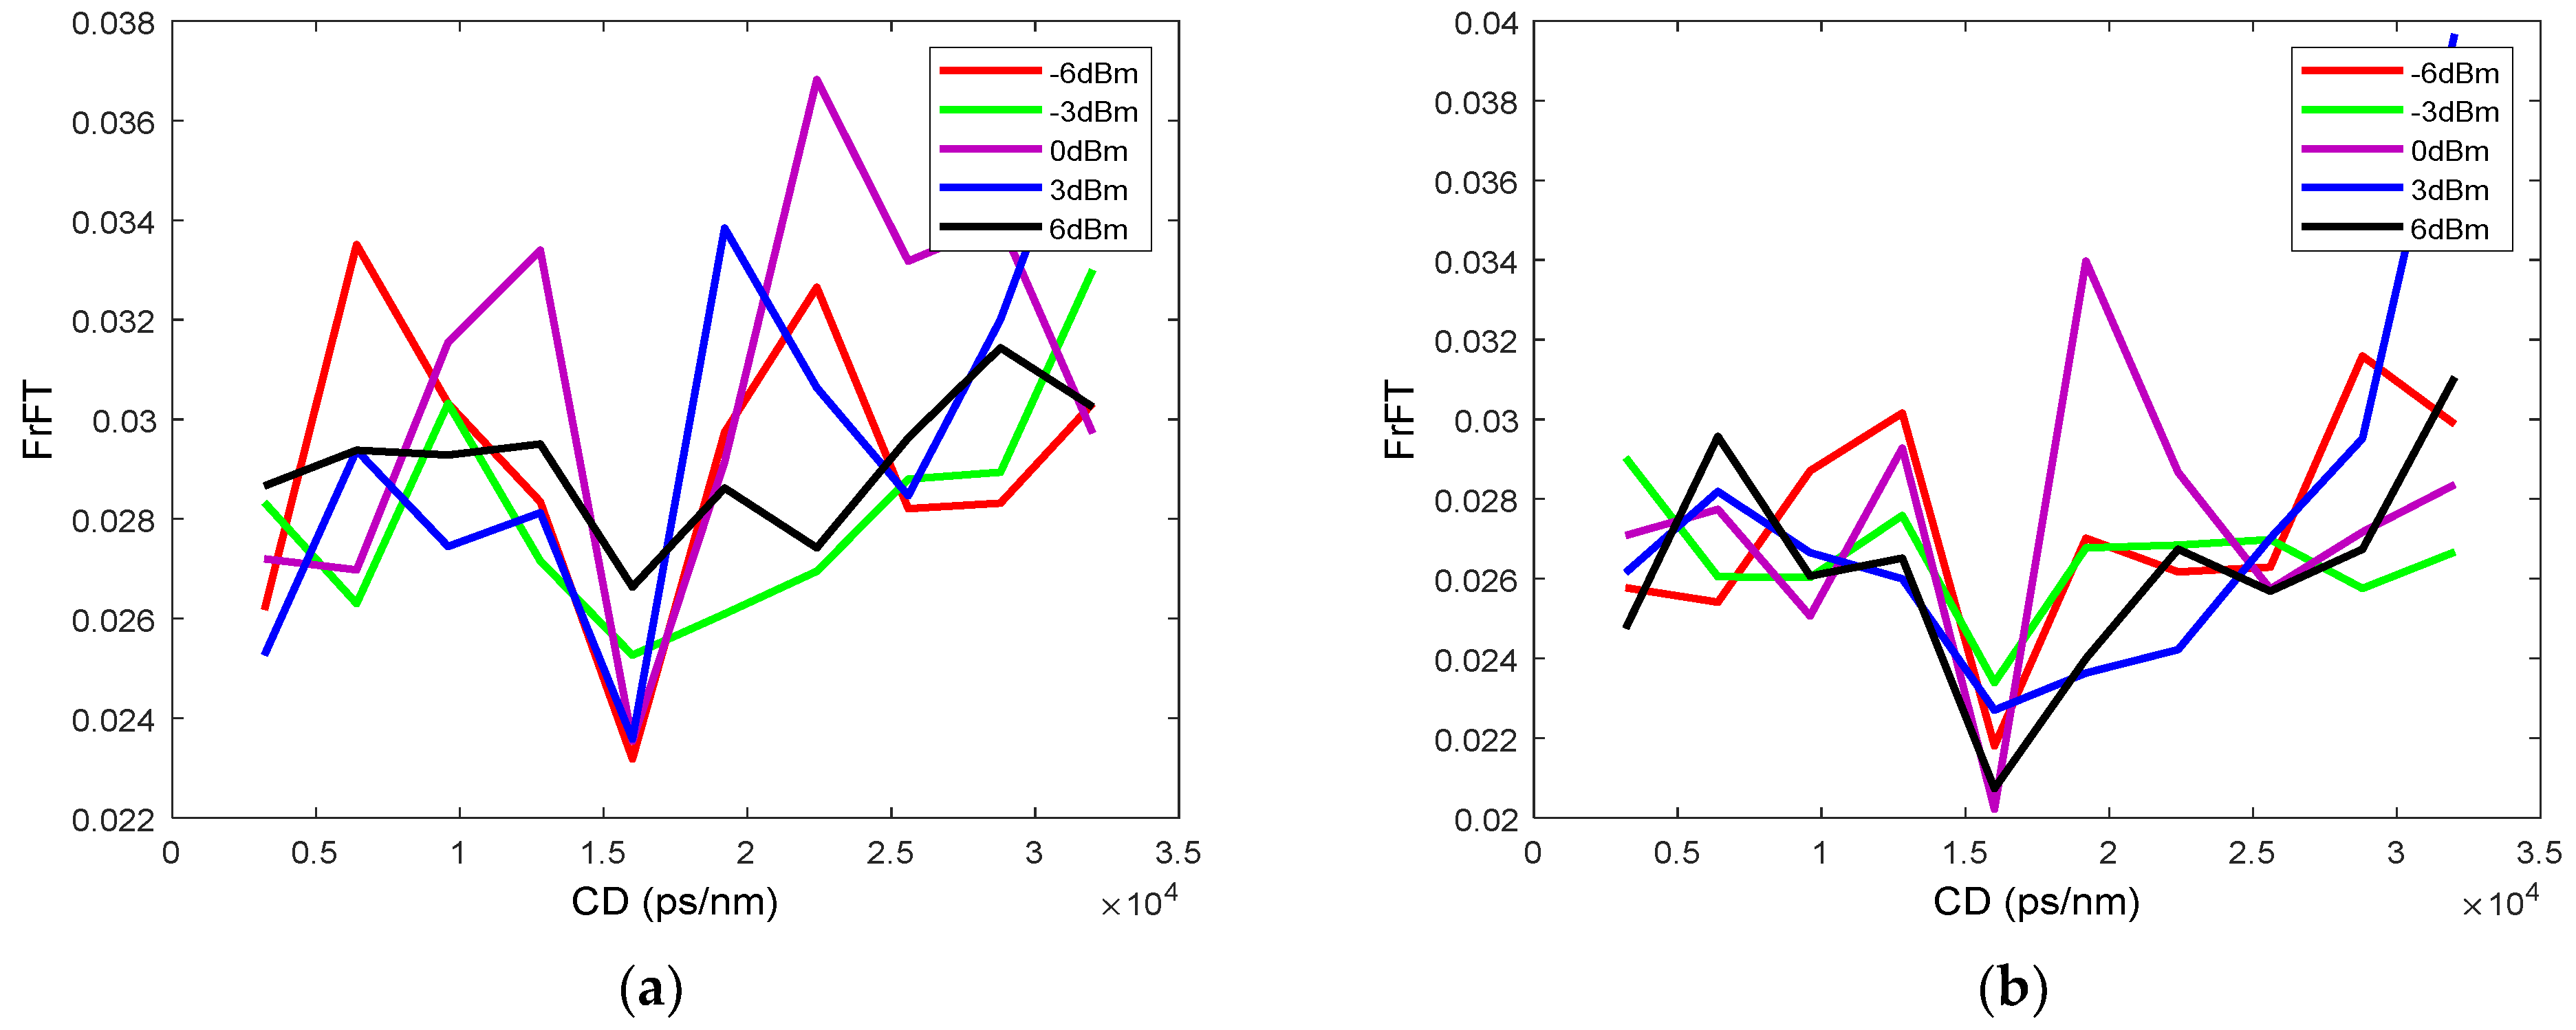
It can be seen from the figure that for the two types of signals, the larger input power (great nonlinear effect) in the optical fiber link will not have a great impact on the CD estimation results, and the corresponding maximum error varies within the range of (−100, 100) ps/nm. In order to further study the influence of the nonlinear effect on CD estimation, we calculate the FrFT value under the condition of different input fiber power at 1000 km, as shown in
Figure 13. Whether for PM-QPSK or PM-16QAM signals, a different input power will have different effects on the results of FrFT, and the CD value 16,000 ps/nm corresponding to the downward peak can still be clearly found in the figure. Therefore, it can be proved that the nonlinear effect will not affect the proposed CD estimation method.
4.2. Comparison of Different Search Methods Based on the CD Estimation Principle
The proposed CD estimation method based on FrFT can make full use of the advantages of time-frequency domain combination to better analyze the impact of CD on the optical fiber communication system. It can not only estimate the CD quickly and accurately, but also improve the compensation effect for other damages, reduce the cost, and optimize the utilization of optical network resources. To sum up, in order to reflect the comparison between the proposed CD estimation method and other scanning search CD estimation methods, the advantages and disadvantages of the corresponding methods are given in
Table 4.
Through the analysis of
Table 4, for the scanning search method, the overall complexity of the estimation process depends on the scanning search interval, the number of sampling points and the complexity of the calculation process. The CD estimation method based on FrFT has advantages over the other two methods in terms of sampling points and computational complexity at the same search interval, and can obtain smaller CD estimation error. In addition, in terms of the resistance to OSNR and PMD damage, the CD estimation method based on FrFT has good robustness, while the other two methods only discuss the CD estimation effect under the condition of fixed OSNR and PMD, which has certain limitations. In general, the proposed method has certain advantages over other methods in terms of CD estimation accuracy and resistance to other damage.
5. Experimental Setup
Based on the theoretical research and simulation environment, an adjustable CD estimation system based on FrFT is established. Limited to the experimental environment and conditions, this section only carries out the estimation experiment of the OOK signal at a 10 Gbit/s transmission rate.
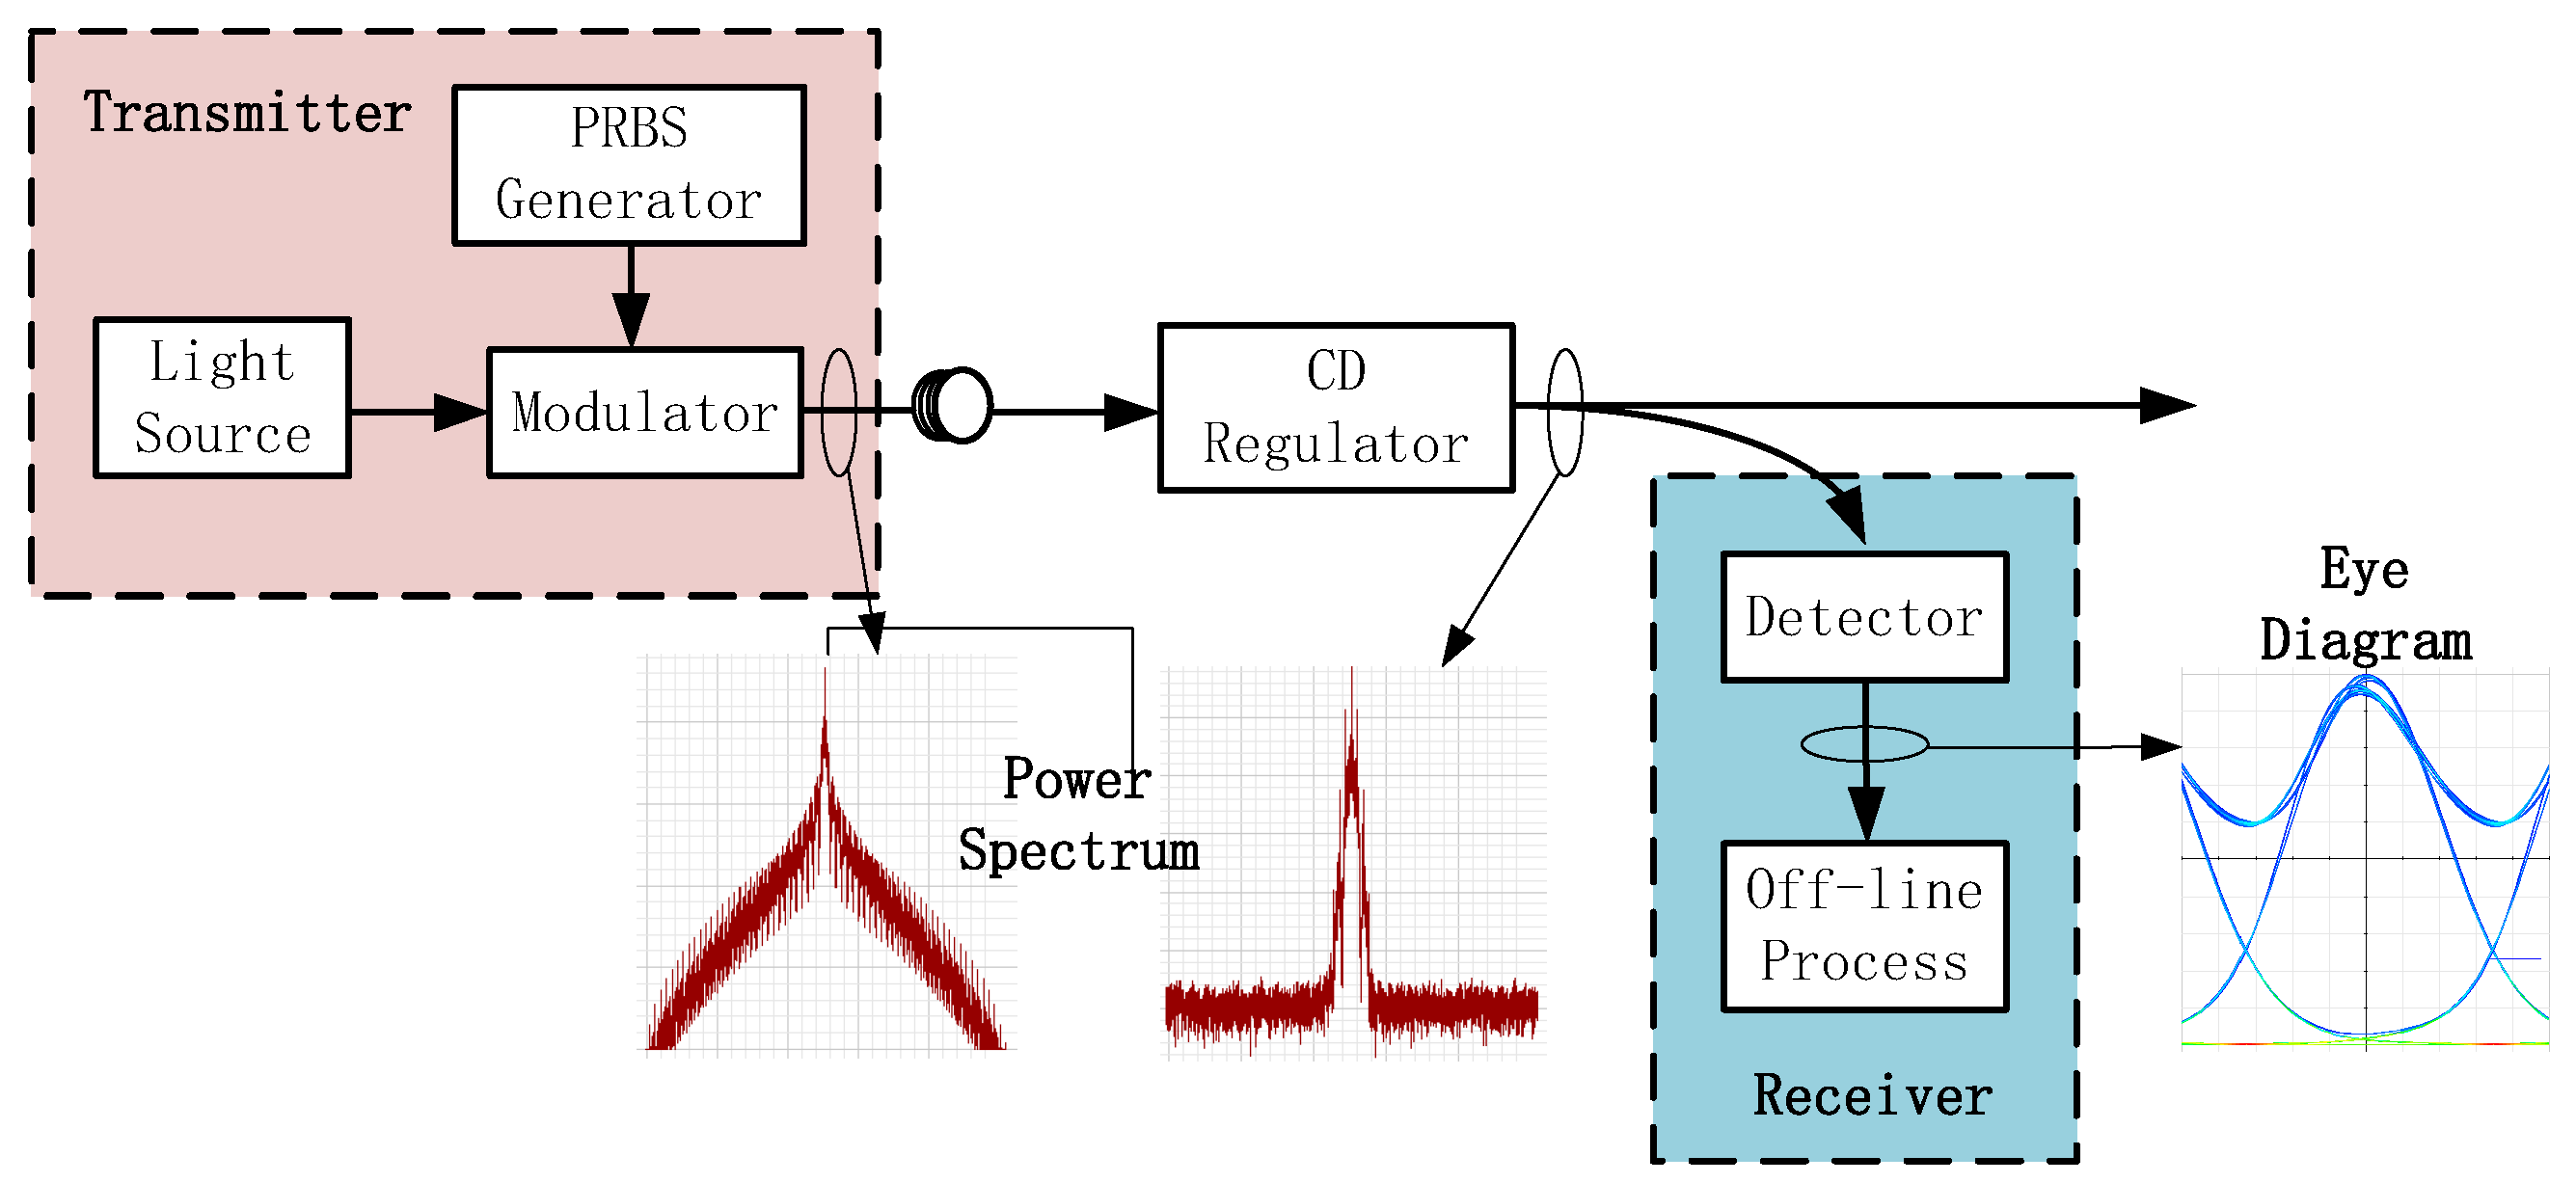
Figure 14 shows the schematic diagram of the OOK optical signal transmission. As shown in the figure, the experimental platform is composed of a continuous light source, modulator, PRBS generator, transmission fiber, CD regulator, detector, and off-line processing module. At the transmitting end, the central wavelength of the light source is 1550 nm, the optical signal symbol rate is 10 Gbit/s, the emission power of the light source is −2 dBm, and the linewidth is set to 100 kHz. The power spectrum diagram of the transmitted signal is shown on the left side of the figure. Then, the optical signal passes through the optical fiber transmission link and the CD regulator to control the CD range from −1200 ps/nm to 1200 ps/nm. The schematic diagram of the optical signal power spectrum affected by the transmission link is shown on the right side of the figure. It can be found that after the influence of the transmission link and CD, the power spectrum effect of the optical signal becomes worse, obviously. Finally, we receive the optical signal through a detector and input the data into the off-line processing module for a CD estimation based on FrFT. It is worth noting that it is obvious from the eye diagram that the transmission link and CD will affect the quality of the optical signal. Accordingly, it can be shown that the experimental platform can fully prove the correctness of the CD estimation method based on FrFT.
According to the OOK signal dispersion monitoring scheme in
Figure 14, the experimental environment and platform are constructed, and the corresponding physical objects of the main experimental system are shown in
Figure 15.
Figure 15a shows the optical transceiver monitoring module used in the experiment. The optical transceiver module is equipped with an optical module. The optical fiber is connected to the optical module through the interface, and when the light passes through the dispersion adjustment module, it is connected back to the receiving end of the optical transceiver module. The optical module carried in this experiment is a small form-factor pluggable (SFP) optical module with a digital diagnosis function. Its structure mainly includes a transmitter, a controller, and a receiver. The function of the optical module is to realize the photoelectric conversion of the signal. The transmitting end carries the bit information on the optical pulse to generate the optical signal, and then, after passing through a section of optical fiber link, the receiving end converts the optical signal to be measured into an electrical signal and restores the electrical signal into the required digital signal. The optical receiving module mainly includes a photoelectric detector, a transimpedance amplifier, and a limiting amplifier. The control end of SFP is also called a digital diagnosis module. Its main function is to monitor the working voltage, temperature, bias current, receiving and emitting power, and other parameters of the optical module in real time. The maximum speed of the SFP optical module can reach 10.3 G, so the OOK signal rate designed in this paper is 10 G, and the wavelength is 1550 nm.
Figure 15b shows the SSMF used in the experiment, which realizes the transmission function of the optical fiber link near 1550 nm.
Figure 15c shows the CD regulator, which can be connected to the upper computer to change the CD value in the range of −1200 ps/nm to 1200 ps/nm.
Figure 15d shows the analog photodetector. Its main function is to realize the acquisition and storage of docking receiving signals, input the obtained data to the offline processing module, and complete the verification of the CD estimation of the experimental signals based on FrFT.
In the CD estimation stage of the off-line digital signal processing, according to the above content, the estimation effect will be measured by the estimation results after changing different CD sizes in the optical fiber link.
Figure 16 shows the calculated FrFT value of the OOK signal after transmission with different CD sizes. In order to simplify the calculation, the signal sampling point in this estimation process is 4096, and the search interval of FrFT order is 0.001. It can be seen from the figure that the OOK signal generated by the experiment can see that each datum has an obvious downward peak after different CD transmission and FrFT operations. In this way, the corresponding CD value can be calculated according to the transformation order of the peak position. Similarly, the correctness of the above method based on FrFT is verified, and it is also proved that this method can work well in the actual transmission system.
For the OOK signal, we estimate the CD within the range of −1200 ps/nm to 1200 ps/nm set in the experiment and obtain the estimation error value and error rate results within this range, as shown in
Figure 17. It can be seen from the figure that for the OOK signal, the estimated CD error value changes with the set real cumulative range. It can be seen from the figure that both fluctuate within a fixed range, and the average value of CD error is 80 ps/nm, the maximum value is 103 ps/nm, and the average value of error rate is only 0.17. It is worth noting that the estimation error is still within the tolerance range of the estimation error mentioned above and will not affect the BER performance of the final transmission system. It is proved that the estimation method based on FrFT has a good estimation effect in the actual transmission link.
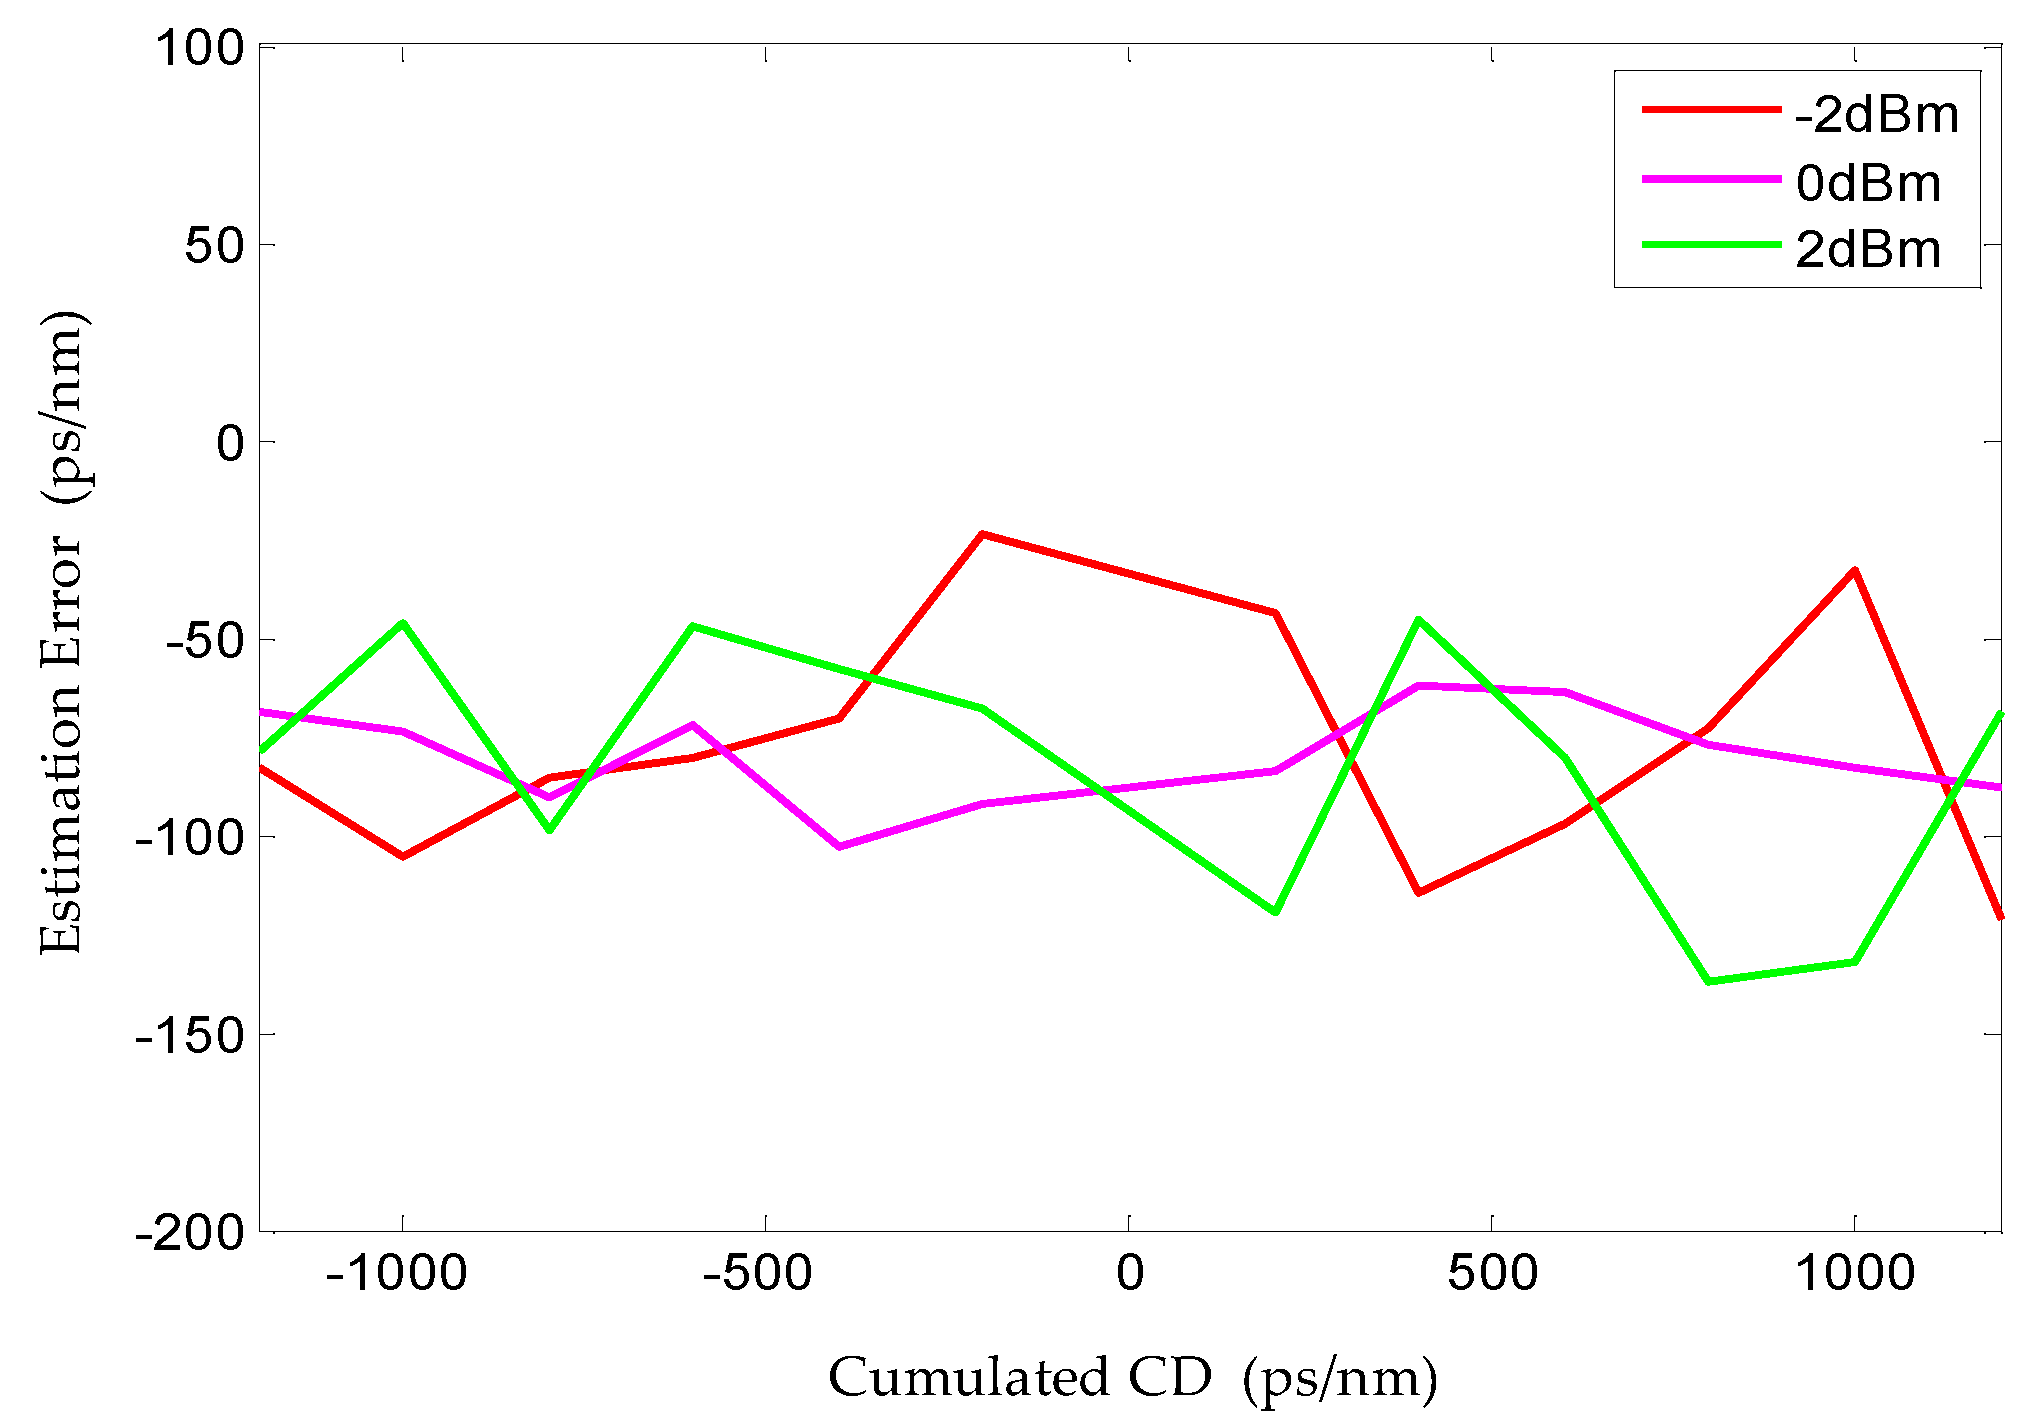
In order to evaluate the influence of different input powers on the CD estimation performance in the experimental environment, we choose to estimate the CD of the OOK signal under different input powers (respectively, −2 dBm, 0 dBm, 2 dBm). The estimation error results are shown in
Figure 18. It can be seen from the figure that within the real set cumulative CD range, the estimation errors under different input powers fluctuate within the fixed error range, and all estimation errors are within (−150 ps/nm, 0 ps/nm). It can be seen from the above that the change of the input power will not have a great impact on the estimation effect. It also proves that the estimation of this method in the actual transmission system has great robustness to the input power. In conclusion, we believe that the proposed CD estimation method based on FrFT can have a good estimation effect on the actual transmission system under different cumulative CD ranges.
6. Conclusions
An improved stepwise and FrFT has been proposed to monitor CD for optical performance monitoring in next-generation optical networks. Before using the FrFT to estimate the CD, the chirp signal is first analyzed in the fractional domain. It is found that the signal has the effect of energy concentration in the fractional domain, and different chirp parameters and sampling points affect the transform order. On this basis, the FrFT method is introduced into the field of CD estimation, and the estimation equation of CD value is obtained through parameter transformation, which verifies the effectiveness of the FrFT method. Then, a stepwise search method is proposed to obtain the optimal order and reduce the computational complexity. Through the comparative simulation of PM-QPSK and PM-16QAM signals in different sampling points and search intervals, the sampling points and search interval of the simulation system are determined, and the average estimation accuracy is within 50 ps/nm. The effects of PMD, OSNR, and nonlinearity on their performance are discussed. Finally, the CD estimation method based on FrFT is experimentally verified in the OOK experimental environment, and it is proved to have strong resistance to input power.
