Article

Pulse Shape Estimation in a DSR Fiber Laser Using the Genetic Algorithm

1
SERCOM Laboratory, Tunisia Polytechnic School, University of Carthage, EPT, B.P. 743, Carthage 2078, Tunisia
2
National Engineering School of Tunis, University of Tunis El Manar, B.P. 37, Tunis 1002, Tunisia
3
College of Engineering and Technology, American University of the Middle East, Kuwait
4
Univ Angers, LPHIA, SFR MATRIX, F-49000 Angers, France
*
Author to whom correspondence should be addressed.
Photonics 2022, 9(4), 212; https://doi.org/10.3390/photonics9040212
Submission received: 27 December 2021 / Revised: 12 March 2022 / Accepted: 15 March 2022 / Published: 23 March 2022
(This article belongs to the Special Issue Mode Locked Fiber Laser)

Abstract

:
Exploiting the computing power of the genetic algorithm, a numerical study of dissipative soliton resonance (DSR) in a ring laser mode-locked by a real saturable absorber (SA) is conducted. A section of photonic crystal fiber (PCF) is inserted into the laser cavity design to facilitate accurate control of both dispersion and nonlinearity. The influence of the cavity parameters on the evolution of the DSR pulses is systematically analyzed. The genetic algorithm demonstrates that the generation of DSR square pulses depends directly on the PCF dispersion, the PCF nonlinearity, the PCF length, and the modulation depth of the SA. Finally, the sensitivity of the DSR pulse width, peak power and energy to perturbations in a few key design parameters are highlighted.

1. Introduction

Fiber lasers consist of a gain medium located inside a cavity designed to provide optical feedback. The discovery and subsequent use of rare-earth ions, such as erbium, neodymium, and ytterbium, in the manufacturing of optical fiber amplifiers enabled the construction of fiber lasers where an optical amplifier acts as a gain medium. In comparison to solid state bulk lasers, fiber lasers were found to produce higher energy and shorter pulses at a lower cost. Consequently, fiber lasers found numerous applications in industry, medicine, research, defense, and security [1], due in part to their ability to generate ultra-short pulses at high repetition rates.
The mode-locking of fiber lasers is a very efficient technique, which can produce ultra-short optical pulses in the femtosecond range [2]. Fiber lasers could be actively or passively mode-locked [3,4]. There are a variety of approaches for passive mode-locking, including nonlinear polarization evolution, saturable absorption, and nonlinear amplifier loop mirrors (NALM) [4,5,6]. Regardless of mode-locking technique, fiber lasers can generate stable optical pulses formed by the balances between gain and loss on the one hand, and dispersion and nonlinearity on the other. These pulses are called dissipative solitons, which were predicted theoretically [7,8], and observed experimentally [9,10].
Ultrafast fiber lasers are inherently a highly nonlinear feedback system producing a rich set of dynamics and are an excellent platform for investigating numerous pulsing phenomena including harmonic mode-locking [9,11], soliton rain [12], breathing dissipative solitons [13], composite-state soliton regime [14], and multiple-period soliton pulsation [15]. These regimes have been obtained in cavities such as figure-of-8, figure-of-9 and the simple ring cavity. The generation of self-starting passively mode-locked optical pulses using a figure-of-8 fiber laser has been demonstrated theoretically and observed experimentally [10,16,17]. The figure-of-9 fiber laser is a novel configuration employing a new-type of NALM mode-locking technique [18]. The ring cavity was also widely studied [2,4], and is the configuration used for the laser modelled in this work.
The characteristics of the output pulse in passive mode-locking are dependent on both the design of the laser cavity and the pump power. The precise control of the cavity dispersion and nonlinearity could be achieved through photonic crystal fibers (PCFs), in part due to their specialized geometric structures and versatile photonic guiding mechanisms. In fact, the great flexibility offered by photonic crystal fibers has paved the way to the development of high-energy pulse lasers arising from their pulse shaping mechanisms [19]. Increasing the pump power in passively mode-locked fiber lasers results in wave-breaking phenomena, in which multiple soliton pulsation arise, due to energy quantization. This transition from the single-pulse regime into a multi-pulse regime has limited the output pulse energies to below 20 nJ [20]. In order to overcome this limitation, the concept of dissipative soliton resonance (DSR) was introduced [21]. Such a regime was proved theoretically using the master equation that considers complex dispersion, nonlinear refractive index, and nonlinear losses [7]. It is obtained for particular parameters of the parameter space of the system where it is characterized by temporal coherence, clamped peak power, finite bandwidth, and energy scalability. A significant body of work has been published on the subject [22,23]. More recently, the DSR regime has been demonstrated in a bismuth doped fiber laser (BiDFL) with a figure-of-9 configuration producing high energy output pulses [24]. The reported regime is a rectangular wave-breaking free pulses, which widened considerably in the time domain with an increase in pump power while maintaining an almost constant peak power [21].
The primary objective of this work is the estimation of the pulse shape in a ring fiber laser operating in the DSR regime by using machine learning approaches, namely the genetic algorithm (GA). The GA method is a global optimization algorithm, which borrows from the laws of natural selection. A recent review of the latest advance in genetic algorithm implementation within a verity of research domains can be found in [25]. The GA has been employed in the optimization of photonic components. In [26], the authors utilize the GA to investigate the square pulses formed in the figure-of-8 fiber laser; by properly adjusting the parameters of the cavity, a square profile pulse having high energy and picosecond width could be obtained. Moreover, the concept of GA has been previously adapted in various optical contexts, including pulse shaping [27,28] and the optimization of super-continuum generation [29]. A recent study [30], compared three different search methods, namely brute force Monte Carlo, simulated annealing, and genetic algorithm, with respect to convergence speed, computational complexity, and accuracy in the context of binary phase-only time-domain optical pulse shaping. The GA was found to outperform the other methods [30].
In this paper, the numerical model of the ring fiber laser cavity containing the photonic crystal fiber based on a real saturable absorber is presented in Section 2. Subsequently, the genetic algorithm is tasked with exploring and optimizing the cavity parameters to obtain a high energy rectangular pulse operating in the DSR regime as presented in Section 3. Finally, in Section 4, results are shown for the effect of the principal cavity parameters on the characteristics of the generated pulses. The work is concluded in Section 5.

2. Ring Fiber Laser Numerical Model

The proposed photonic crystal based mode-locked fiber ring laser is shown in Figure 1. The laser cavity consists of two sections of standard single mode fiber (SMF), denoted SMF 1 and SMF 2 , a section of erbium doped fiber amplifier (EDFA), a section of photonic crystal fiber (PCF), a saturable absorber (SA) and a 30% output coupler. The PCF section facilitates an improved control of the cavity dispersion and nonlinearity. The total cavity length is 16 m, which corresponds to a fundamental repetition rate of f R = 12.5 MHz. The fiber laser is modelled numerically and is designed to operate in the normal dispersion regime with a net cavity dispersion of β 2 × L = 0.0427 ps 2 .
The laser cavity is simulated under the assumption of linearly polarized light propagating through an isotropic fiber exhibiting no birefringence, optical Kerr nonlinearity, group velocity dispersion (GVD), attenuation and saturable gain for the EDFA section. Consequently, the use of the following scalar modified nonlinear Schrödinger equation (NLSE) to describe the optical field evolution inside the fiber laser cavity is justified [17,31]:
U z + j 2 j g ω g 2 + β 2 2 U τ 2 ( g α ) 2 U = j γ U 2 U
where U denotes the slowly varying envelop approximation of the electric field, z is the propagation coordinates, τ is the local time within the rest frame of the mode-locked pulse, γ represents the fiber nonlinearity ( γ = 2 π n 2 / λ A e f f ), β 2 is the GVD coefficient, α is the loss coefficient of the fiber and ω g is the bandwidth of the laser gain (taken as ω g = 15.7 ps 1 ). Moreover, g describes the gain function of EDFA and is given by [17,26,31]:
g = g 0 1 + E p E s a t
where g 0 is the small signal gain, which characterizes the pumping level, E s a t is the saturation energy and E P is the pulse energy given by [31]:
E p = T R 2 T R 2 U 2 d t
where T R is the cavity round trip time. The simulation of pulse propagation through the optical fiber sections, employed the symmetric split step Fourier method to numerically solve the modified NLSE. The transmission function T of the real SA is power dependent and modelled according to [32]:
T = q 0 + q 1 sin 0.5 π P P s a t
where q 0 = 0.58 is the initial transmission, q 1 = 0.215 is the initial SA modulation depth, P is the instantaneous power proportional to | U ( z , τ ) | 2 and P s a t = 30 W is the minimum power at which saturable absorption switches to reverse saturable absorption. The simulation properties of the EDFA and SMF sections of the laser cavity are fixed and detailed in Table 1. The EDFA small signal gain used in the numerical modelling was g 0 = 2.1 m 1 and the saturation energy E s a t = 100 pJ [31]. All numerical simulations employed N = 2 13 time samples at a temporal resolution of 0.02 ps. The laser output pulse is examined after 500 round trips, which is sufficient for reaching a steady state solution.

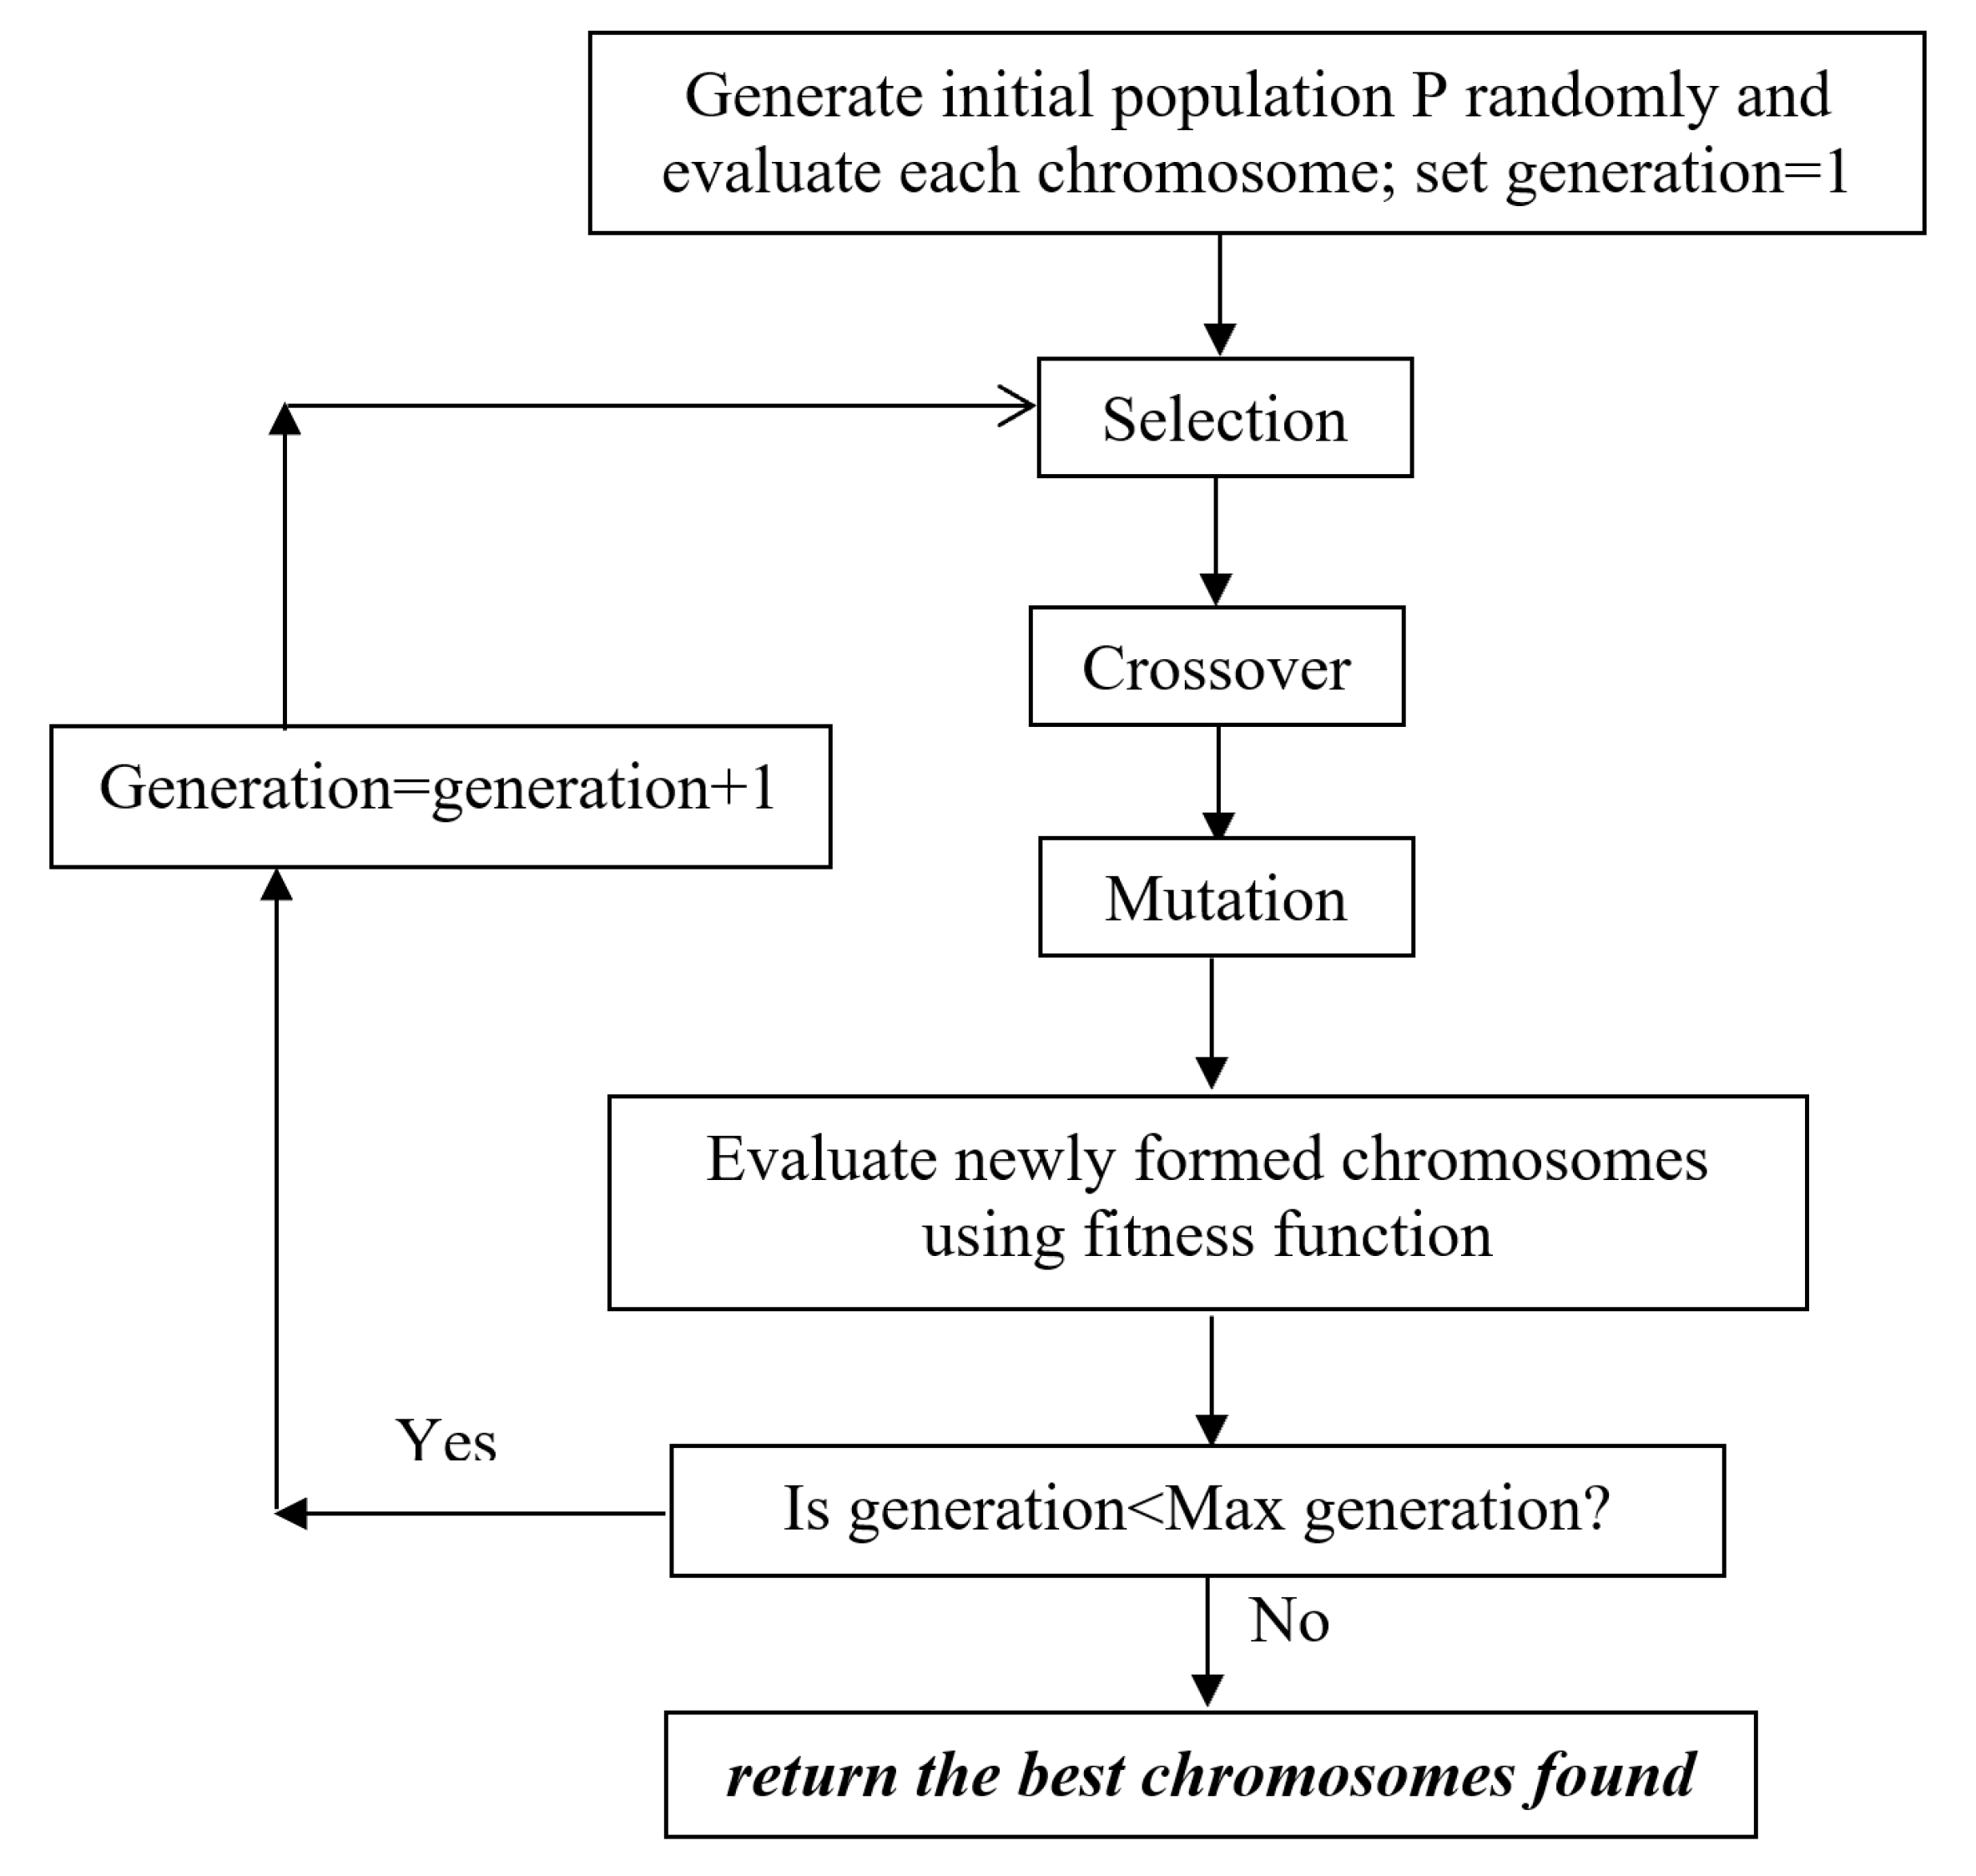
3. Genetic Algorithm Optimization

The Genetic Algorithm (GA) describes a class of global optimization methods which borrow from biological evolution and use the principle of natural selection for fitness function optimization. Through environmental pressures, random mutations and the process of natural selection, fairly primitive systems can evolve into a plethora of complexity and diversity. In this work, the objective of the GA is to optimize the PCF and SA parameters in the laser cavity for the purpose of obtaining a mode-locked pulse with a predefined flat-top temporal intensity profile within the DSR regime. In particular, the GA will find the optimum PCF length L P C F , PCF chromatic dispersion coefficient D P C F , PCF effective area A e f f , P C F and the modulation depth of the SA q 1 , S A . These selected parameters directly perturb the balance between dispersion and nonlinearity, on one hand, and gain and loss on the other. In this work, a single individual chromosome within a population is defined as an array recording the values of four elements, namely, the three PCF parameters and the SA modulation depth: [ L P C F , D P C F , A e f f , P C F , q 1 , S A ] . The flowchart illustrating the steps involved in the GA optimization is shown in Figure 2. At each generational step, the GA enacts the process of selection, crossover, mutation and the evaluation of the fitness function for each individual chromosome within the population. The GA terminates once the number of generations reaches a maximum set value.
The GA attempts to minimize the misfit between the (normalized) output pulse intensity profile I o u t and the target pulse intensity profile I t a r g e t . Consequently, the following objective function J is minimized over the N time samples [33]:
J = k = 1 N I o u t I t a r g e t 2 k = 1 N I t a r g e t 2
The hallmark of the DSR regime is the generation of wave-breaking-free flat-top pulses [21]. As a consequence, setting the target intensity profile I t a r g e t to a rectangular pulse shape allows the GA to guide the cavity parameter towards operating in the DSR regime. The objective function J is evaluated over the entire simulation window with N = 2 13 samples. The typical parameters employed in GA simulations are presented in Table 2.
The values of each element in the chromosome are restricted to a predefined range. The particulars of the minimum and maximum values for each element are outlined in Table 3. In this work, the effectiveness of the GA optimization hinges on its ability to simultaneously optimize parameters of different optical components, while maintaining an impartial and agnostic view of each element within the individual chromosome. To fully realize the benefits of this ability, the elements of each chromosome must be scaled appropriately to fall within proximity of each other. In this current GA implementation, beyond the trivial step of removing the standard units, the L P C F is scaled by a factor of 10 and q 1 , S A is scaled by a factor of 100. The details of the GA operations, outlined in the block diagram of Figure 2, are described in the items listed below:
  • Initial population: Each individual chromosome in the initial population is generated randomly. This is achieved through initializing each element in the individual chromosome using a uniform distribution from within the range restrictions outlined in Table 3.
  • Selection operator: In this operation the GA selects the best two individual chromosomes from the generation at hand with the smallest objective function value. These individuals are deemed “fittest” and are denoted ( P 1 and P 2 ) and act as parents for generating offspring in the next combination operation. The applied selection rule is deterministic.
  • Crossover operator: This operation is executed if a generated uniform random number is less than the assigned value for the crossover probability parameter. In such case, the elements of the two parents ( P 1 and P 2 ) are combined in a certain way to produce two new individual children. In multi-point crossover a binary mask with four values corresponding to each element in the individual chromosome is generated using a uniform random number generator. The elements of the two individual children ( C 1 and C 2 ) are selected from the elements of either parents ( P 1 or P 2 ) based on the if a “0” or “1” appears at the corresponding binary mask index, respectively [34].
  • Mutation operator: This operation is executed if a generated uniform random number is less than the assigned value for the mutation probability parameter. In such case, a random element from within the individual chromosome is re-initialized with a random value using a uniform distribution from within the range restrictions outlined in Table 3.
  • Elitism operator: This function reduces genetic drift by adopting the fittest individuals from previous and new populations after a predefined number of selection, crossover and mutation.
Table 3. Boundary conditions imposed on the available range for each element in a chromosome.
ElementDescriptionMinimum ValueMaximum Value
L P C F Length of the PCF1 m10 m
D P C F Dispersion of the PCF−30 ps/nm·km0 ps/nm·km
A e f f , P C F Effective area of the PCF10 μ m 2 30 μ m 2
q 1 , S A SA modulation depth0.10.4
A representative example of the GA optimized output pulse shape in the DSR regime is shown in Figure 3. The target pulse was set to a rectangular intensity profile with a width of 40 ps and a maximum peak power P m a x = 10 W. The minimized error reported from the objective function J calculation was 1.9%. The optimized cavity parameters required to generate the 40 ps DSR pulse are outlined in Table 4. The total pulse energy was 0.45 nJ, which is naturally higher than the theoretical target of 0.4 nJ due to the rise and fall time of the output optical pulse. The evolution of the DSR pulse intensity profile and energy E p per number of round trips and with the optimized PCF and SA parameters in Table 4 are shown in Figure 4a,b, respectively. The corresponding spectrum is depicted in Figure 5, which exhibits a bell-shaped profile centred at 1550 nm with 4 nm spectral bandwidth at −3 dB.
In Figure 4a, In the first few loops, both the pulse rising and falling edges are rapidly suppressed while the pulse center is amplified. The pulse profile is gradually shaped to be close to a square waveform. This can be attributed to the shaping effect of the saturable absorber. Fluctuations in the square signal disappear depending on the number of round trips. After 300 rounds, the pulse becomes stable and maintains its rectangular shape.

4. Results and Discussion

In the previous section, the genetic algorithm’s ability to guide the cavity parameters towards the generation of DSR square pulses with a target pulse-width of 40 ps and a target peak-power of 10 W was demonstrated. In this section, the influence of each of the optimized cavity parameters on the output pulse shape is systematically analyzed. First of all, the PCF length, PCF effective area and SA modulation depth were fixed at the aforementioned optimum value, while the PCF chromatic dispersion was varied. The output pulse evolution versus the PCF’s chromatic dispersion is shown in Figure 6. It is evident that the PCF’s chromatic dispersion has significant influence on the pulse width and the maximum peak power. While the optimum PCF chromatic dispersion is −13 ps/nm·km for the specified target pulse, slight perturbations of this optimum, in particular towards higher negative values, has measurable effect on the pulse width. An increase in the full width at half maximum (FWHM) of approximately ≈ 50% is observed for only an additional −2 ps/nm·km in the PCF chromatic dispersion coefficient. As such, any experimental implementation of the laser requires accurate characterization and control of the PCF dispersion. The spectra illustrated in Figure 7 show an inverse behaviour to those of the temporal profiles. The spectral bandwidth at −3 dB decreases from 6 nm to 3.6 nm when the PCF chromatic dispersion increases from −11 ps/nm·km to −19 ps/nm·km.
In the second stage of this analysis, the PCF length, PCF dispersion coefficient and SA modulation depth were fixed at the aforementioned optimum value, while the PCF effective area was varied. The pulse evolution versus the PCF’s effective area is shown in Figure 8. The output pulse that best matches the target pulse was achieved with a PCF effective area of 20 μ m 2 . The results in Figure 8 show that the perturbation of the PCF effective area towards higher or lower values from the optimum has a marginal influence on the output pulse shape and width. When the PCF effective area was increased from 12 μ m 2 to 28 μ m 2 , the spectral bandwidths at −3 dB decrease as in Figure 9.
Subsequently, the PCF effective area, PCF dispersion coefficient and SA modulation depth were fixed at the aforementioned optimum value, while the PCF length was varied. The pulse evolution versus the PCF’s length is shown in Figure 10. The output pulse that best matches the target pulse was achieved with a PCF length of 4.2 m. The results in Figure 10 show that the perturbation of the PCF length has a significant influence on the pulse width and shape. This effect becomes fully pronounced when the length of the PCF fiber is shortened. The results in Figure 10 show that a change of −1 m results in a 50% increase in the FWHM of the output optical pulse. This is expected as changing the PCF length inherently changes the cavity dispersion, resulting in an effect that is quite similar to one reported in Figure 6. The spectra presented in Figure 11 reveal the same dynamics as observed for the PCF chromatic dispersion. Indeed, when the PCF length increases the spectral bandwidth at −3 dB decreases.
Finally, all of the PCF parameters were fixed at the aforementioned optimum values, while the SA modulation depth was varied. The pulse evolution versus the SA modulation depth is shown in Figure 12. The modulation depth of the SA has significant influence on both the DSR pulse width and peak power. Increasing the SA modulation depth results in an increase of both the pulse width and the peak power. Figure 13 illustrates the evolution of the spectrum versus the SA modulation depth. The spectral bandwidth at −3 dB is 4 nm for q 1 equal to 0.25 and 0.35, and is 6 nm for q 1 equal to 0.15.
Another consideration is the effect of changing the saturation power P s a t of the saturable absorber on pulse generation. The change in the output pulse intensity with the change in P s a t , while maintaining all of the cavity parameters at their optimum value, is shown in Figure 14. It is evident, that increasing the saturation power results in a decrease of pulse width and increase in the peak power. The SA imparts a significant influence on the output pulse energy and shape. Consequently, SA parameters should be the target of experimental observation and precise control to produce higher pulse energies. In Figure 15 spectral bandwidths at −3 dB are 4, 5, 4.8 and 6 nm, corresponding, respectively, to 20, 25, 30 and 35 W of saturation power P s a t of saturable absorber.
Our findings provide an excellent design tool for optimizing the mode-locking performance and the enhancement of energy delivered per pulse. The square pulse characteristic could be improved with certain laser parameter selections. Hence, a high non-linearity could be used to improve the pulse energy and to control the pulse width. Our results are in good agreement with the experimental observations reported by Z. Cheng and F. Ben Braham, respectively, in the case of Yb-doped fiber laser and figure-of-eight Er:Yb co-doped fiber laser [35,36].

5. Conclusions

The computing power of the genetic algorithm was utilized in the numerical study of DSR pulse generation in a ring fiber laser, mode-locked by a real SA. The cavity of the laser included a PCF section, which facilitated accurate control of the cavity dispersion and nonlinearity. The genetic algorithm attempted to minimize the difference between the output optical pulse intensity and a flat-top pulse with a width of 40 ps and a peak power of 10 W, while updating the PCF length, the PCF dispersion, the PCF effective area and the modulation depth of the SA. These selected parameters directly perturbed the balance in the laser cavity between dispersion and nonlinearity, on one hand, and gain and loss on the other. The results indicate that the genetic algorithm has demonstrated its ability to guide the cavity parameters towards the generation of flat-top optical pulses in the DSR regime. Furthermore, the influence of the cavity parameters on the evolution of the DSR pulses was systematically analyzed. Simulations indicate that the output pulse width and peak power are both sensitive to perturbations in the SA modulation depth, SA saturation power, PCF length and PCF dispersion coefficient. In practice, several PCFs with different linear and non-linear characteristics must be tested before a stable DSR regime can be obtained, hence the importance of this study which can guide experimenters.

Author Contributions

Conceptualization, F.B. and M.B.; methodology, F.B., M.B. and M.S.; software, F.B., M.B. and A.S.K.; validation, A.S.K. and F.B.; formal analysis, F.B. and M.B.; investigation, M.B. and M.S.; resources, A.S.K. and M.S.; writing—original draft preparation, A.S.K., M.B. and F.B.; writing—review and editing, A.S.K. and M.S.; supervision, F.B. and M.S. All authors have read and agreed to the published version of the manuscript.

Funding

This research received no external funding.

Institutional Review Board Statement

Not applicable.

Informed Consent Statement

Not applicable.

Data Availability Statement

Not applicable.

Conflicts of Interest

The authors declare no conflict of interest.

References

  1. Shi, W.; Fang, Q.; Zhu, X.; Norwood, R.A.; Peyghambarian, N. Fiber lasers and their applications. Appl. Opt. 2014, 53, 6554–6568. [Google Scholar] [CrossRef] [PubMed]
  2. Tamura, K.; Haus, H.A.; Ippen, E.P. Self-starting additive pulse mode-locked erbium fibre ring laser. Electron. Lett. 1992, 28, 2226–2228. [Google Scholar] [CrossRef]
  3. Hübner, P.; Kieleck, C.; Jackson, S.D.; Eichhorn, M. High-power actively mode-locked sub-nanosecond Tm3+-doped silica fiber laser. Opt. Lett. 2011, 36, 2483–2485. [Google Scholar] [CrossRef] [PubMed]
  4. Cautaerts, V.; Richardson, D.J.; Paschotta, R.; Hanna, D.C. Stretched pulse Yb3+:silica fiber laser. Opt. Lett. 1997, 22, 316–318. [Google Scholar] [CrossRef] [Green Version]
  5. Set, S.Y.; Yaguchi, H.; Tanaka, Y.; Jablonski, M. Laser mode locking using a saturable absorber incorporating carbon nanotubes. J. Light. Technol. 2004, 22, 51–56. [Google Scholar] [CrossRef]
  6. Chernysheva, M.A.; Krylov, A.A.; Kryukov, P.G.; Dianov, E.M. Nonlinear amplifying loop-mirror-based mode-locked thulium-doped fiber laser. IEEE Photonic Technol. Lett. 2012, 24, 1254–1256. [Google Scholar] [CrossRef]
  7. Komarov, A.; Komarov, K.; Leblond, H.; Sanchez, F. Spectral-selective management of dissipative solitons in passive mode-locked fibre lasers. J. Opt. A Pure Appl. Opt. 2007, 9, 1149. [Google Scholar] [CrossRef]
  8. Komarov, A.; Amrani, F.; Dmitriev, A.; Komarov, K.; Sanchez, F. Competition and coexistence of ultrashort pulses in passive mode-locked lasers under dissipative-soliton-resonance conditions. Phys. Rev. A 2013, 87, 023838. [Google Scholar] [CrossRef] [Green Version]
  9. Amrani, F.; Haboucha, A.; Salhi, M.; Leblond, H.; Komarov, A.; Grelu, P.; Sanchez, F. Passively mode-locked erbium-doped double-clad fiber laser operating at the 322nd harmonic. Opt. Lett. 2009, 34, 2120–2122. [Google Scholar] [CrossRef] [Green Version]
  10. Amrani, F.; Salhi, M.; Niang, A.; Komarov, A.; Sanchez, F. Soliton pattern formation in figure-of-eight laser. In Proceedings of the SPIE, Nonlinear Optics and Applications VI, Brussels, Belgium, 16 April 2012; Volume 8434, pp. 1–7. [Google Scholar]
  11. Luo, Z.; Liu, M.; Liu, H.; Zheng, X.; Luo, A.; Zhao, C.; Zhang, H.; Wen, S.; Xu, W. 2 GHz passively harmonic mode-locked fiber laser by a microfiber-based topological insulator saturable absorber. Opt. Lett. 2013, 38, 5212–5215. [Google Scholar] [CrossRef]
  12. Bao, C.; Xiao, X.; Yang, C. Soliton rains in a normal dispersion fiber laser with dual-filter. Opt. Lett. 2013, 38, 1875–1877. [Google Scholar] [CrossRef] [PubMed]
  13. Peng, J.; Boscolo, S.; Zhao, Z.; Zeng, H. Breathing dissipative solitons in mode-locked fiber lasers. Sci. Adv. 2019, 5, eaax1110. [Google Scholar] [CrossRef] [PubMed] [Green Version]
  14. Kemel, M.; Nady, A.; Semaan, G.; Salhi, M.; Sanchez, F. Triple-lobe wavelength fiber laser with a composite-state soliton regime. Opt. Laser Technol. 2021, 133, 106519. [Google Scholar] [CrossRef]
  15. Soto-Crespo, J.M.; Grapinet, M.; Grelu, P.; Akhmediev, N. Bifurcation and multiple-period soliton pulsation in a passively mode-locked fiber laser. Phys. Rev. E 2004, 70, 066612. [Google Scholar] [CrossRef] [PubMed] [Green Version]
  16. Tzelepis, V.; Markatos, S.; Kalpogiannis, S.; Sphicopoulos, T.H.; Caroubalos, C. Analysis of a passively mode-locked self-starting all-fiber soliton laser. J. Light. Technol. 1993, 11, 1729–1736. [Google Scholar] [CrossRef]
  17. Salhi, M.; Amrani, F.; Leblond, H.; Sanchez, F. Analytical investigation of a figure-eight single-pulse all-fiber laser based on a nonlinear amplifying loop mirror. Phys. Rev. A 2010, 82, 043834. [Google Scholar] [CrossRef] [Green Version]
  18. Zhou, J.; Pan, W.; Feng, Y. Period multiplication in mode-locked figure-of-9 fiber lasers. Opt. Express 2020, 28, 17424–17433. [Google Scholar] [CrossRef]
  19. Lecaplain, C.; Ortaç, B.; Machinet, G.; Boullet, J.; Baumgartl, M.; Schreiber, T.; Cormier, E.; Hideur, A. High-energy femtosecond photonic crystal fiber laser. Opt. Lett. 2010, 35, 3156–3158. [Google Scholar] [CrossRef]
  20. Chong, A.; Renninger, W.H.; Wise, F.W. All-normal-dispersion femtosecond fiber laser with pulse energy above 20 nJ. Opt. Lett. 2007, 32, 2408–2410. [Google Scholar] [CrossRef]
  21. Akhmediev, N.; Soto-Crespo, J.M.; Grelu, P. Roadmap to ultra-short record high-energy pulses out of laser oscillators. Phys. Lett. A 2008, 372, 3124–3128. [Google Scholar] [CrossRef]
  22. Wu, X.; Tang, D.Y.; Zhang, H.; Zhao, L.M. Dissipative soliton resonance in an all-normal-dispersion erbium-doped fber laser. Opt. Express 2009, 17, 5580–5584. [Google Scholar] [CrossRef] [PubMed]
  23. Krzempek, K.; Sotor, J.; Abramski, K. Compact all-fber fgure-9 dissipative soliton resonance mode-locked double-clad er:yb laser. Opt. Lett. 2016, 41, 4995–4998. [Google Scholar] [CrossRef] [PubMed]
  24. Ahmad, H.; Aidit, S.N.; Ooi, S.I.; Samion, M.Z.; Wang, S.; Wang, Y.; Sahu, J.K.; Zamzuri, A.K. 1.3 µm dissipative soliton resonance generation in Bismuth doped fiber laser. Sci. Rep. 2021, 11, 6356. [Google Scholar] [CrossRef]
  25. Katoch, S.; Chauhan, S.S.; Kumar, V. A review on genetic algorithm: Past, present, and future. Multimed. Tools Appl. 2021, 80, 8091–8126. [Google Scholar] [CrossRef]
  26. Zayani, H.M.; Bahloul, F.M.; Saidani, T.S. Photonics components design optimization using genetic algorithm. Opt. Eng. 2020, 59, 056102. [Google Scholar] [CrossRef]
  27. Toyama, F.; Shoji, K.; Miyamichi, J.A. New Fitness Function for Shape Detection Using Genetic algorithm. Syst. Comput. Jpn. 2001, 32, 54–60. [Google Scholar] [CrossRef]
  28. Karar, A.S.; Ghandour, R.; Mahariq, I.; Alboon, S.A.; Maaz, I.; Neji, B.; Barakat, J.M.H. A Programmable Mode-Locked Fiber Laser Using Phase-Only Pulse Shaping and the Genetic Algorithm. Photonics 2020, 7, 69. [Google Scholar] [CrossRef]
  29. Arteaga-Sierra, F.R.; Milián, C.; Torres-Gómez, I.; Torres-Cisneros, M.; Moltó, G.; Ferrando, A. Supercontinuum optimization for dual-soliton based light sources using genetic algorithms in a grid platform. Opt. Express 2014, 22, 23686–23693. [Google Scholar] [CrossRef] [Green Version]
  30. Karar, A.S.; Ghandour, R.; Boulkaibet, I.; Collaku, D.; Barakat, J.M.H.; Neji, B.; Al Barakeh, Z. A Numerical Study of Optimization Methods for Phase-Only Optical Pulse-Shaping. Photonics 2021, 8, 490. [Google Scholar] [CrossRef]
  31. Bahloul, F.; Salhi, M.; Guesmi, K.; Sanchez, F.; Attia, R. Numerical demonstration of generation of bound solitons in figure of eight microstructured fiber laser in normal dispersion regime. Opt. Commun. 2013, 311, 282–287. [Google Scholar] [CrossRef] [Green Version]
  32. Paul, N.; Gupta, P.K.; Singh, C.P.; Mukhopadhyay, P.K.; Bindra, K.S. Effect of spectral filtering on pulse duration in dissipative soliton resonance (DSR) regime of modelocked fiber laser. Rev. Sci. Instrum. 2019, 90, 106102. [Google Scholar] [CrossRef]
  33. Boscolo, S.; Finot, C. Artificial neural networks for nonlinear pulse shaping in optical fibers. Opt. Laser Technol. 2020, 131, 106439. [Google Scholar] [CrossRef]
  34. Zeidler, D.; Frey, S.; Kompa, K.-L.; Motzkus, M. Evolutionary algorithms and their application to optimal control studies. Phys. Rev. A 2001, 64, 023420. [Google Scholar] [CrossRef] [Green Version]
  35. Cheng, Z.; Li, H.; Shi, H.; Ren, J.; Yang, Q.H.; Wang, P. Dissipative soliton resonance and reverse saturable absorption in graphene oxide modelocked all-normal-dispersion Yb-doped fiber laser. Opt. Express 2015, 23, 7000–7006. [Google Scholar] [CrossRef]
  36. Ben Braham, F.; Semaan, G.; Bahloul, F.; Salhi, M.; Sanchez, F. Experimental optimization of dissipative soliton resonance square pulses in all anomalous passively mode-locked fiber laser. J. Opt. 2017, 19, 105501. [Google Scholar] [CrossRef]
Figure 1. Schematic of the modelled ring photonic crystal fiber laser. EDFA: Erbium doped fiber amplifier; SMF: Single mode fiber; PCF: Photonic crystal fiber; SA: Saturable absorber.
Photonics 09 00212 g001
Figure 2. Block diagram of the Genetic Algorithm.
Photonics 09 00212 g002
Figure 3. Optical pulse shaping with a flat-top target rectangular intensity profile with a width of 40 ps and a maximum peak power of P m a x = 10 W. The error (objective function) = 1.9%.
Photonics 09 00212 g003
Figure 4. The generation of DSR pulses in a ring fiber laser with g 0 = 2.1 m 1 , E s a t = 100 pJ and optimized PCF and SA parameters in Table 4: (a) The evolution of pulse intensity with the number of round trips, (b) the evolution of the pulse energy with the number of round trips.
Photonics 09 00212 g004
Figure 5. Spectral profile of DSR pulses in a ring fiber laser with g 0 = 2.1 m 1 , E s a t = 100 pJ and optimized PCF and SA parameters in Table 4.
Photonics 09 00212 g005
Figure 6. Pulse evolution versus PCF’s chromatic dispersion.
Photonics 09 00212 g006
Figure 7. Spectral intensity evolution versus PCF’s chromatic dispersion.
Photonics 09 00212 g007
Figure 8. Pulse evolution versus PCF’s effective area.
Photonics 09 00212 g008
Figure 9. Spectral intensity evolution versus PCF’s effective area.
Photonics 09 00212 g009
Figure 10. Pulse evolution versus PCF’s length.
Photonics 09 00212 g010
Figure 11. Spectral intensity evolution versus PCF’s length.
Photonics 09 00212 g011
Figure 12. Pulse evolution versus the SA modulation depth q 1 .
Photonics 09 00212 g012
Figure 13. Spectral intensity evolution versus the SA modulation depth q 1 .
Photonics 09 00212 g013
Figure 14. Effect of saturation power P s a t of saturable absorber on pulse generation.
Photonics 09 00212 g014
Figure 15. Effect of saturation power P s a t of saturable absorber on spectral profile.
Photonics 09 00212 g015
Table 1. Fixed simulation properties of the EDFA and SMF sections.
Parameter SMF 1 EDFA SMF 2
L (m)255
α (dB/km)0.20.50.2
γ ( W 1 km 1 )1.24.71.2
β 2 ( ps 2 /km)−21.625.5−21.6
Table 2. Genetic algorithm parameters.
ParameterValue/Method
Population size100
Fitness functionminimize the misfit between the intensity profile of the output pulse and the target pulse
Selection techniqueSelect the best two individuals in the population
Crossover probability95%
Mutation probability10%
Number of generation20
Table 4. The optimized cavity parameters after genetic algorithm optimization.
ParameterValue
L P C F 4.2 m
D P C F −13 ps/nm·km
A e f f , P C F 20 μ m 2
q 1 , S A 0.22
Publisher’s Note: MDPI stays neutral with regard to jurisdictional claims in published maps and institutional affiliations.

