Article

Experimental Demonstration and Simulation of Bandwidth-Limited Underwater Wireless Optical Communication with MLSE

1
State Key Laboratory of Information Photonics and Optical Communications, Beijing University of Posts and Telecommunications, Beijing 100876, China
2
China Mobile Group Zhejiang Co., Ltd., Hangzhou 310012, China
3
State Key Laboratory of Acoustic, The Institute of Acoustics of the Chinese Academy of Sciences, Beijing 100190, China
*
Author to whom correspondence should be addressed.
Photonics 2022, 9(3), 182; https://doi.org/10.3390/photonics9030182
Submission received: 8 February 2022 / Revised: 5 March 2022 / Accepted: 10 March 2022 / Published: 12 March 2022
(This article belongs to the Special Issue Visible Light Communication (VLC))

Abstract

:
Underwater wireless optical communication (UWOC) is able to provide large bandwidth, low latency, and high security. However, there still exist bandwidth limitations in UWOC systems, with a lack of effective compensation methods. In this paper, we systematically study the bandwidth limitation due to the transceiver and underwater channel through experiments and simulations, respectively. Experimental results show that by using the 7-tap maximum likelihood sequence estimation (MLSE) detection, the maximum bitrate of the simple rectangular shape on–off-keying (OOK) signaling is increased from 2.4 Gb/s to 4 Gb/s over 1 GHz transceiver bandwidth, compared to the conventional symbol-by-symbol detection. For the bandwidth limitation caused by the underwater channel, we simulate the temporal dispersion in the UWOC by adopting a Monte Carlo method with a Fournier–Forand phase function. With MLSE adopted at the receiver, the maximum available bitrate is improved from 0.4 to 0.8 Gb/s in 12 m of harbor water at the threshold of hard-decision forward-error-correction (HD-FEC, 3.8 × 10⁻³). Moreover, when the bitrate for 0.4 Gb/s 12 m and 0.8 Gb/s 10 m OOK transmission remains unchanged, the power budget can be reduced from 33.8 dBm to 30 dBm and from 27.8 dBm to 23.6 dBm, respectively. The results of both experiments and simulations indicate that MLSE has great potential for improving the performance of bandwidth-limited communication systems.

1. Introduction

High-bandwidth underwater wireless communication has gained increasing interest recently and is considered to be applicable in many marine engineering fields, such as underwater high-definition video transmission and deep-sea observation. At present, the mature and available technology is based on acoustic communication. However, the capacity of underwater acoustic communication is limited to Kbps because of the low bandwidth, which cannot meet increasing requirements such as those for underwater video communication. Underwater wireless optical communication (UWOC) using blue/green wavelength (400–600 nm) lasers has become a better choice and is capable of offering larger bandwidth, lower latency, and higher security [1,2,3]. Many previous underwater optical transmission experiments have proposed several solutions to increase the channel bandwidth from Megahertz to Gigahertz (GHz). In [4,5,6,7,8,9,10,11], several experiments have demonstrated from hundreds Mbps to more than ten Gbps for meters’ UWOC transmission with on-off-keying (OOK) or high order modulation. X. Liu et al. have experimentally demonstrated a 2.70 Gbps data rate over a 34.5 m underwater transmission distance by using non-return-to-zero on-off keying (NRZ-OOK) modulation scheme [4]. C. Lu et al. have demonstrated a 2.5 Gbps UWOC system over 60 m underwater transmission distance at the BER level of 3.5 × 10⁻³ by using NRZ-OOK modulation and digital nonlinear equalization technology [5]. C. Li et al. have achieved a 25 Gbps UWOC system over a 5 m highly turbid harbor water link [6]. Moreover, spatial multiplexing based on the 2 or 4 parallel orbit momentum multiplexing (OAM) mode is also used to increase the bitrate and have demonstrated a GHz class capacity for UWOC [12,13].
Although there exist many underwater optical transmission experiments which achieve significant results on communication bitrate and distance. Most existing experiments are mainly focusing on the efficient coding, high-order modulation format, and high-bandwidth transceivers to improve the performance [4,5,6,7,8,9,10,11] and there is a lack of studies on bandwidth limitation and methods to solve it for UWOC systems, especially for simple OOK modulations.
In this paper, we systematically analyze bandwidth limitation of UWOC system caused by transceiver and channel temporal dispersion, and its mitigation through experiments and simulation, respectively. Experimental results show that by using the 7-tap maximum likelihood sequence estimation (MLSE) detection, the maximum bitrate of the simple rectangular shape OOK signaling is increased from 2.4 Gb/s to 4 Gb/s over 1 GHz transceiver bandwidth, compared to the conventional symbol-by-symbol detection. For the bandwidth limitation caused by the underwater channel temporal dispersion, Monte Carlo simulation with Fournier–Forand phase function is carried out for turbid harbor water. Simulation results show that the maximum available bitrate is improved from 0.4 to 0.8 Gb/s over 12 m harbor water by using MLSE detection, where the available bandwidth is limited to about 0.12 GHz.

2. Principle and Models
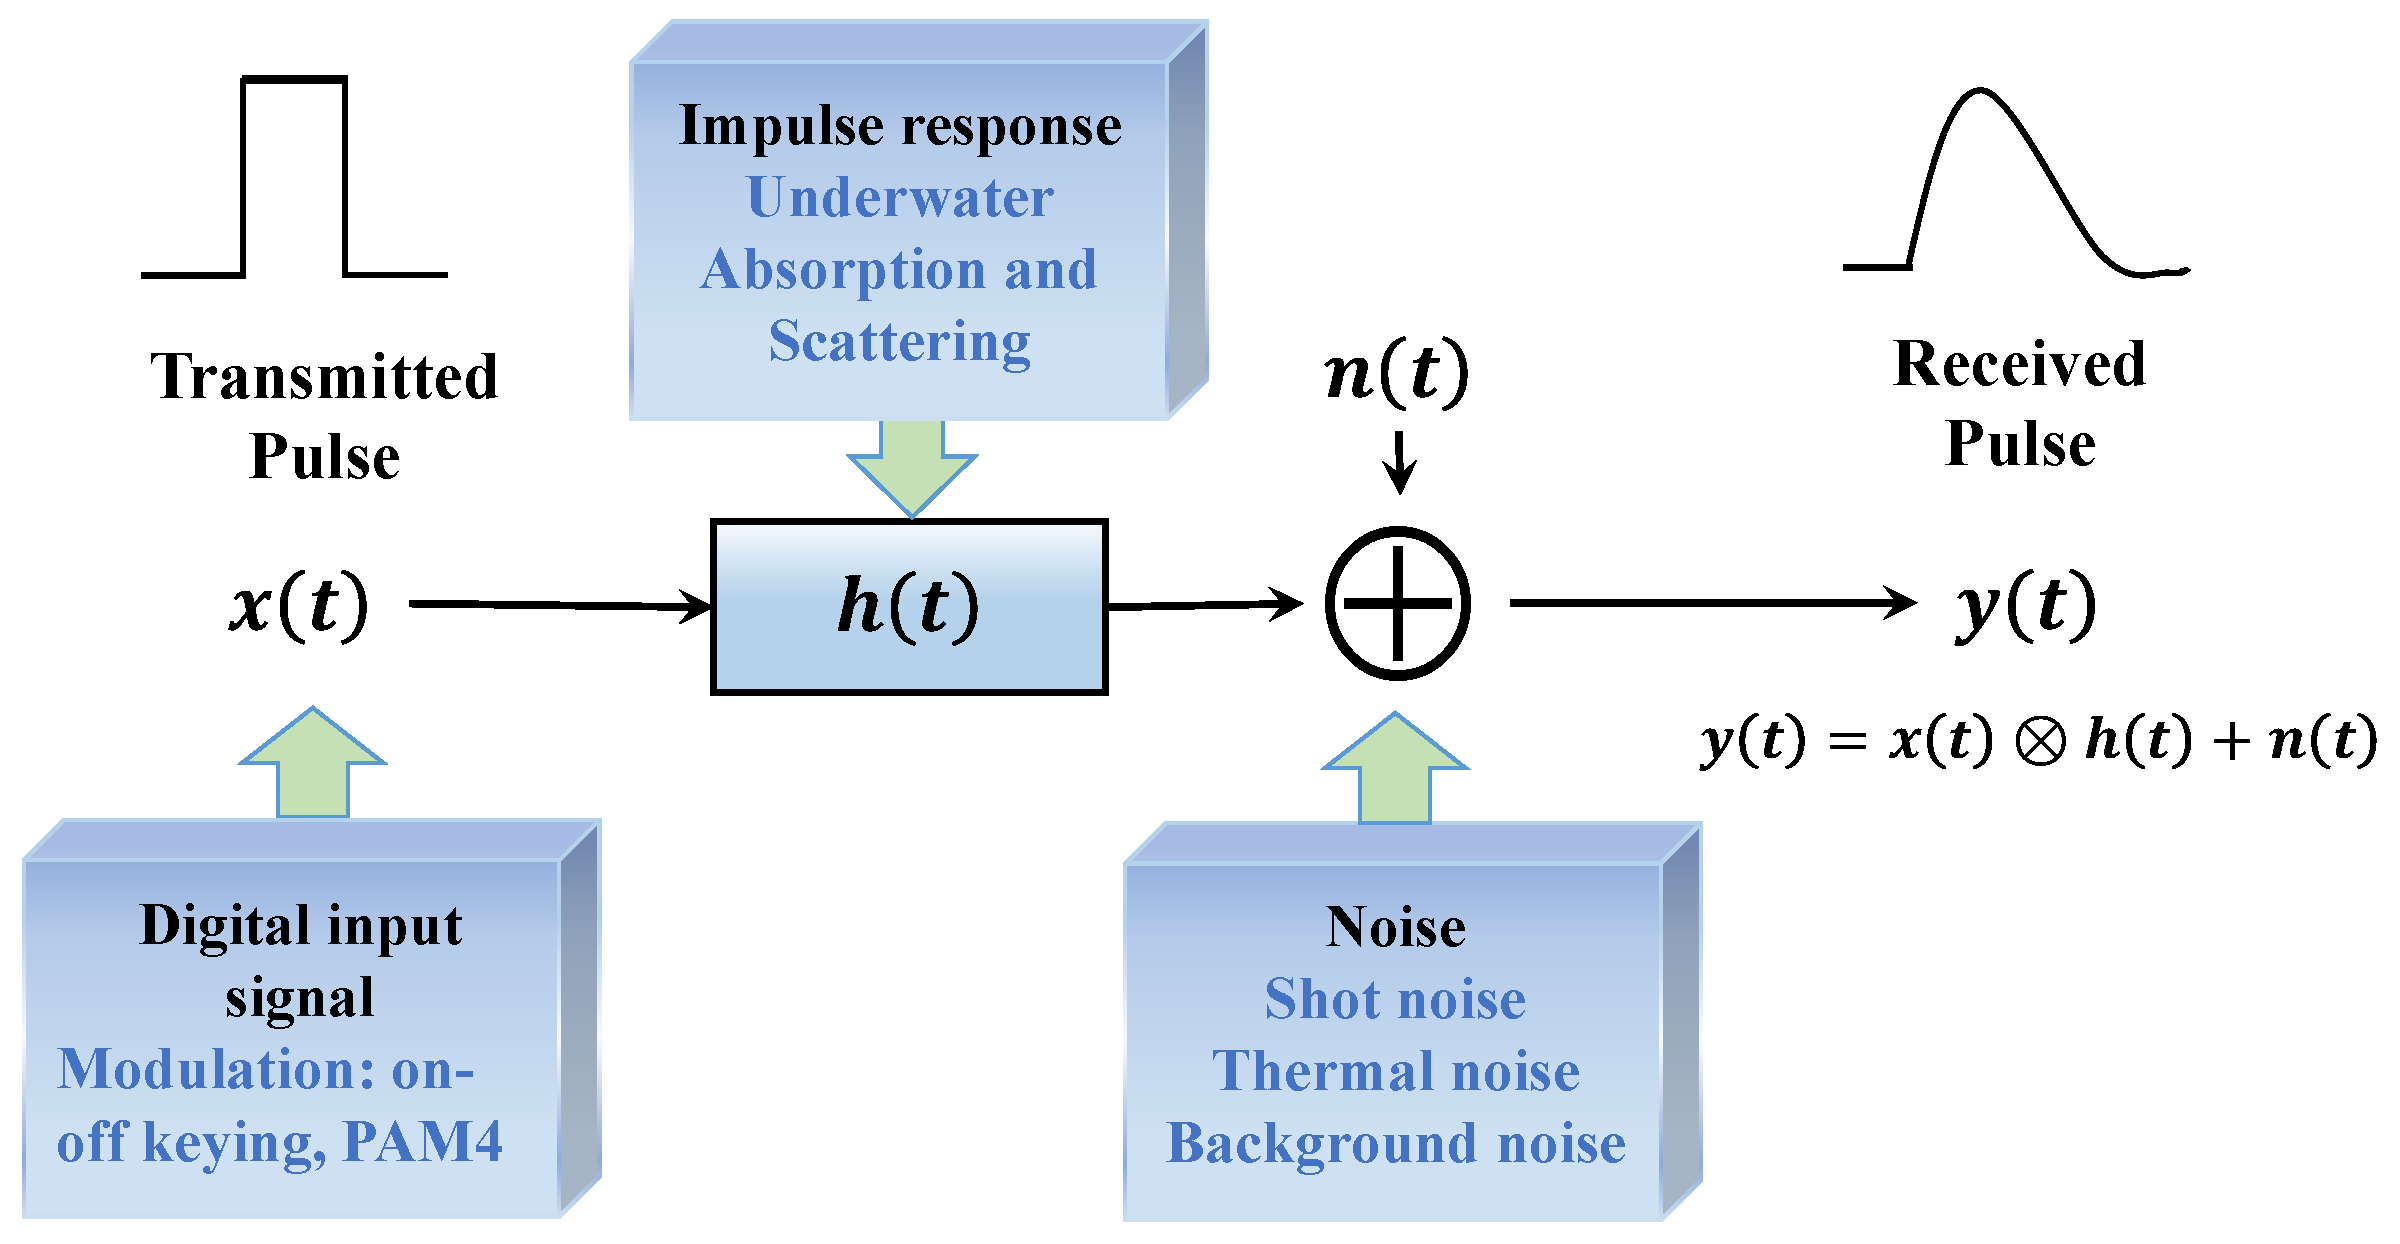
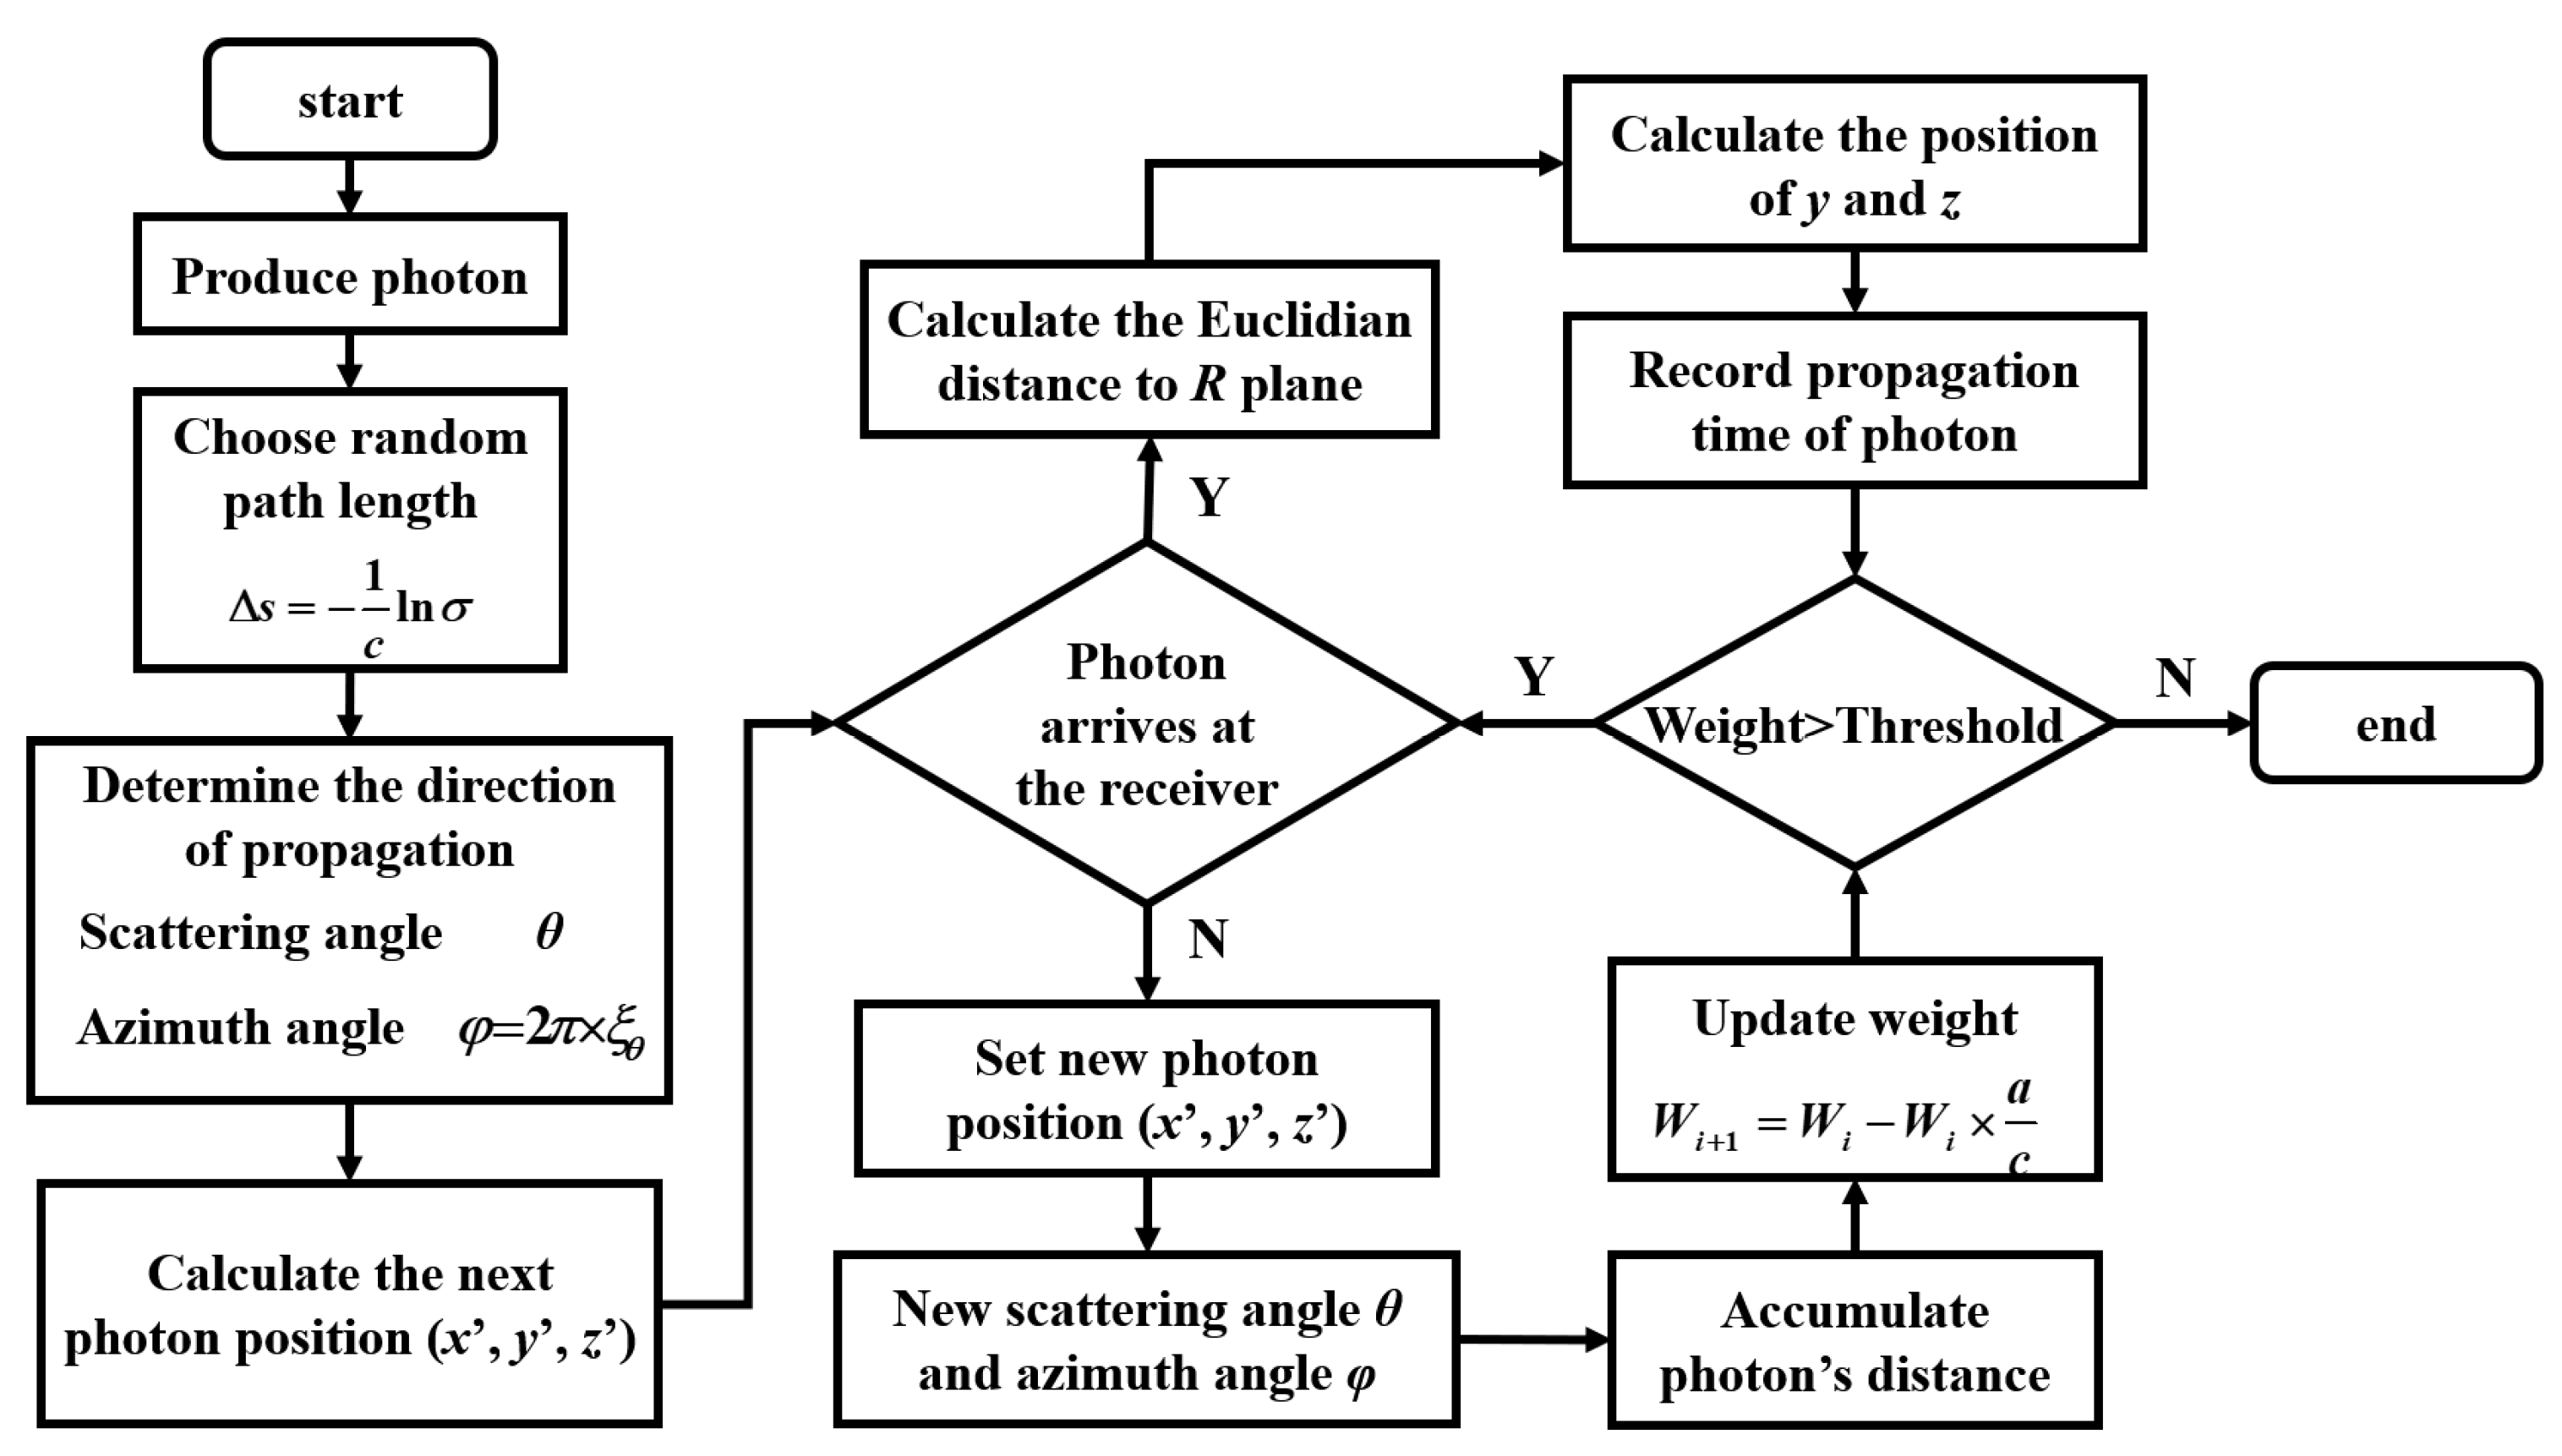
It is noteworthy that the actual UWOC system is a time-variant system, because the parameters of the channel are affected by the temperature, velocity fields, and turbidity of the seawater. To simplify the analysis of the problem, we focus on the impact of important communication parameters such as the seawater optical attenuation coefficient, communication distance on the UWOC system. Here, we consider that the UWOC system has a precisely aligned line-of-sight (LOS) link and the photodetector is perpendicular to the beam [14]. A schematic diagram for the UWOC system model is given in Figure 1.
Many plankton and suspended particles are present in the water, such as mineral components, organic matter, water molecules, and dissolved salts, which affect the propagating photon in two ways, absorption and scattering [15,16,17,18,19]. These effects on the beam are reflected in the underwater channel impulse response. After being sent into the underwater channel, the beam is deteriorated by absorption and scattering in underwater environments before arriving at the receiver. The noise in the UWOC system depends on the type of receiver. The device of the receiver itself produces background radiation noise and dark current noise. The formula for a simplified model of a UWOC system is shown in Figure 1, where x ( t ) is the transmitted signal, h ( t ) is the channel response function, n ( t ) is the noise at the receiver, and indicates the convolution operation [15]. The specific calculation of h ( t ) and n ( t ) will be described in the next part of the paper.

2.1. Channel Model

In this part, we model the underwater channel characteristics of the UWOC system by adopting the Monto Carlo method [17,18,19,20,21] together with a Fournier–Forand (FF) phase function [21].
We use the Monte Carlo method to simulate the process of photon propagation in water to obtain the channel response function h ( t ) mentioned above. The Monte Carlo method is proposed as a kind of numerical calculation method guided by probability theory, commonly solving many computational problems using random or pseudo-random numbers. It is of great significance for UWOC to study the multipath transmission of light and temporal characteristics of the underwater channel in seawater. The Monte Carlo method is widely used in the research of scattering characteristics of a seawater media [22,23,24,25,26]. The propagation of light in water is mainly affected by absorption and scattering [16,17,18,19]. The absorption can be interpreted as a process in which a photon collides with other particles, which reduces the energy of the photons especially in a turbid medium, leading to the attenuation of the amplitude at the receiver [23]. The scattering can be interpreted as an interaction of the photon with other suspended particles, which changes the direction of the optical beams, resulting in temporal dispersion and reduction in the available bandwidth [17].
Monte Carlo simulates the interaction of each photon with plankton and suspended particles in the water and records the state of each photon including the photon position in Cartesian coordinates (x, y, z), direction of transmission described by the zenith angle θ and azimuth angle φ, propagation time t, and weight w [18]. Each photon is initialized with weight (w = 1), location (0, 0, 0), and propagation time (t = 0). After several interactions, the photon is detected by the photoelectrical detector (PD) or absorbed completely by the suspended particles. Figure 2 shows the simulation flow chart for each photon motion in the Monte Carlo method [18].

2.2. Volume Scattering Phase Function

The core of the Monte Carlo simulation of seawater scattering is the interaction between a single photon and scattering particles, with the photon scattering depending on the volume scattering phase function of the scattering medium. Therefore, the analysis and simulation of the scattering phase function of seawater media is a key issue to study the characteristics of seawater scattering.
At present, the scattering phase function (SPF) commonly used in research is the Henyey Greenstein function (HG function) derived by Henyey and Greenstein [27]. The HG function has the advantage of simulating the scattering of photons in water with a random nature of collisions. However, the HG function has an inevitable deficiency in that it cannot be well fitted for both forward and back scattering peaks [17].
Therefore, we adopted a Fournier–Forand (FF) phase function [21]. Compared with HG function, FF function can better fit the scattering situation of underwater particles, so the scattering Angle is determined based on FF phase function in the subsequent Monte Carlo simulation of seawater channel characteristics. The detailed contents about formulas and derivation please refer to [18].

2.3. MLSE Algorithm

The MLSE is an equalization algorithm and considers all possible convolutions of the transmitted sequence with the channel impulse response, and it finds the sequence with the minimum European distance to the received signal. At the receiver, the MLSE algorithm can mitigate the ISI introduced by channel temporal dispersion according to a sequence of bits [28,29].
We define the input sequence as [28,30]:
a ( D ) = a 0 + a 1 D + a 2 D 2 + ,
where D represents the delay operator in a symbol period.
Similarly, the received sequence can be expressed as:
y ( D ) = y 0 + y 1 D + y 2 D 2 + ,
The principle of MLSE is to choose the right a(D) to maximize the probability p[y(D)|a(D)]. The symbol s(D) is the state sequence and has a one-by-one correspondence with a(D); therefore, it is equivalent to choosing the optimum state sequence s(D) to maximize the probability p[y(D)|s(D)].
Considering that the noise is independently distributed, we calculate the log-likelihood value ln p[y(D)|a(D)] by decomposing it into the accumulation of independent increments:
ln p [ y ( D ) | s ( D ) ] = k ln f [ y k x ( s k 1 , s k ) ]
where f (∙) represents the probability density function of the noise sequence and y k is the received sequence and state at time k. x ( s k 1 , s k ) is the input sequence from state s k 1 to state s k [31,32].
The symbol m indicates the level of the signal, and v indicates the tap number for MLSE. During the entire iteration, mv paths are obtained from the previous moment from time 0 to time k at each iteration and mv+1 paths are generated at the current time when all the state sequences are traversed. The most possible path is chosen according to the stored weight value and the Euclidean distance between y(k+1) and a(k+1) at a time of k + 1. Then, the symbols before time k + 1 can be determined for accumulation the next time by comparing the path storage weights in each state s ( k + 1 , i ) . Finally, we obtain the optimum s(D) to maximize the probability p[y(D)|s(D)].

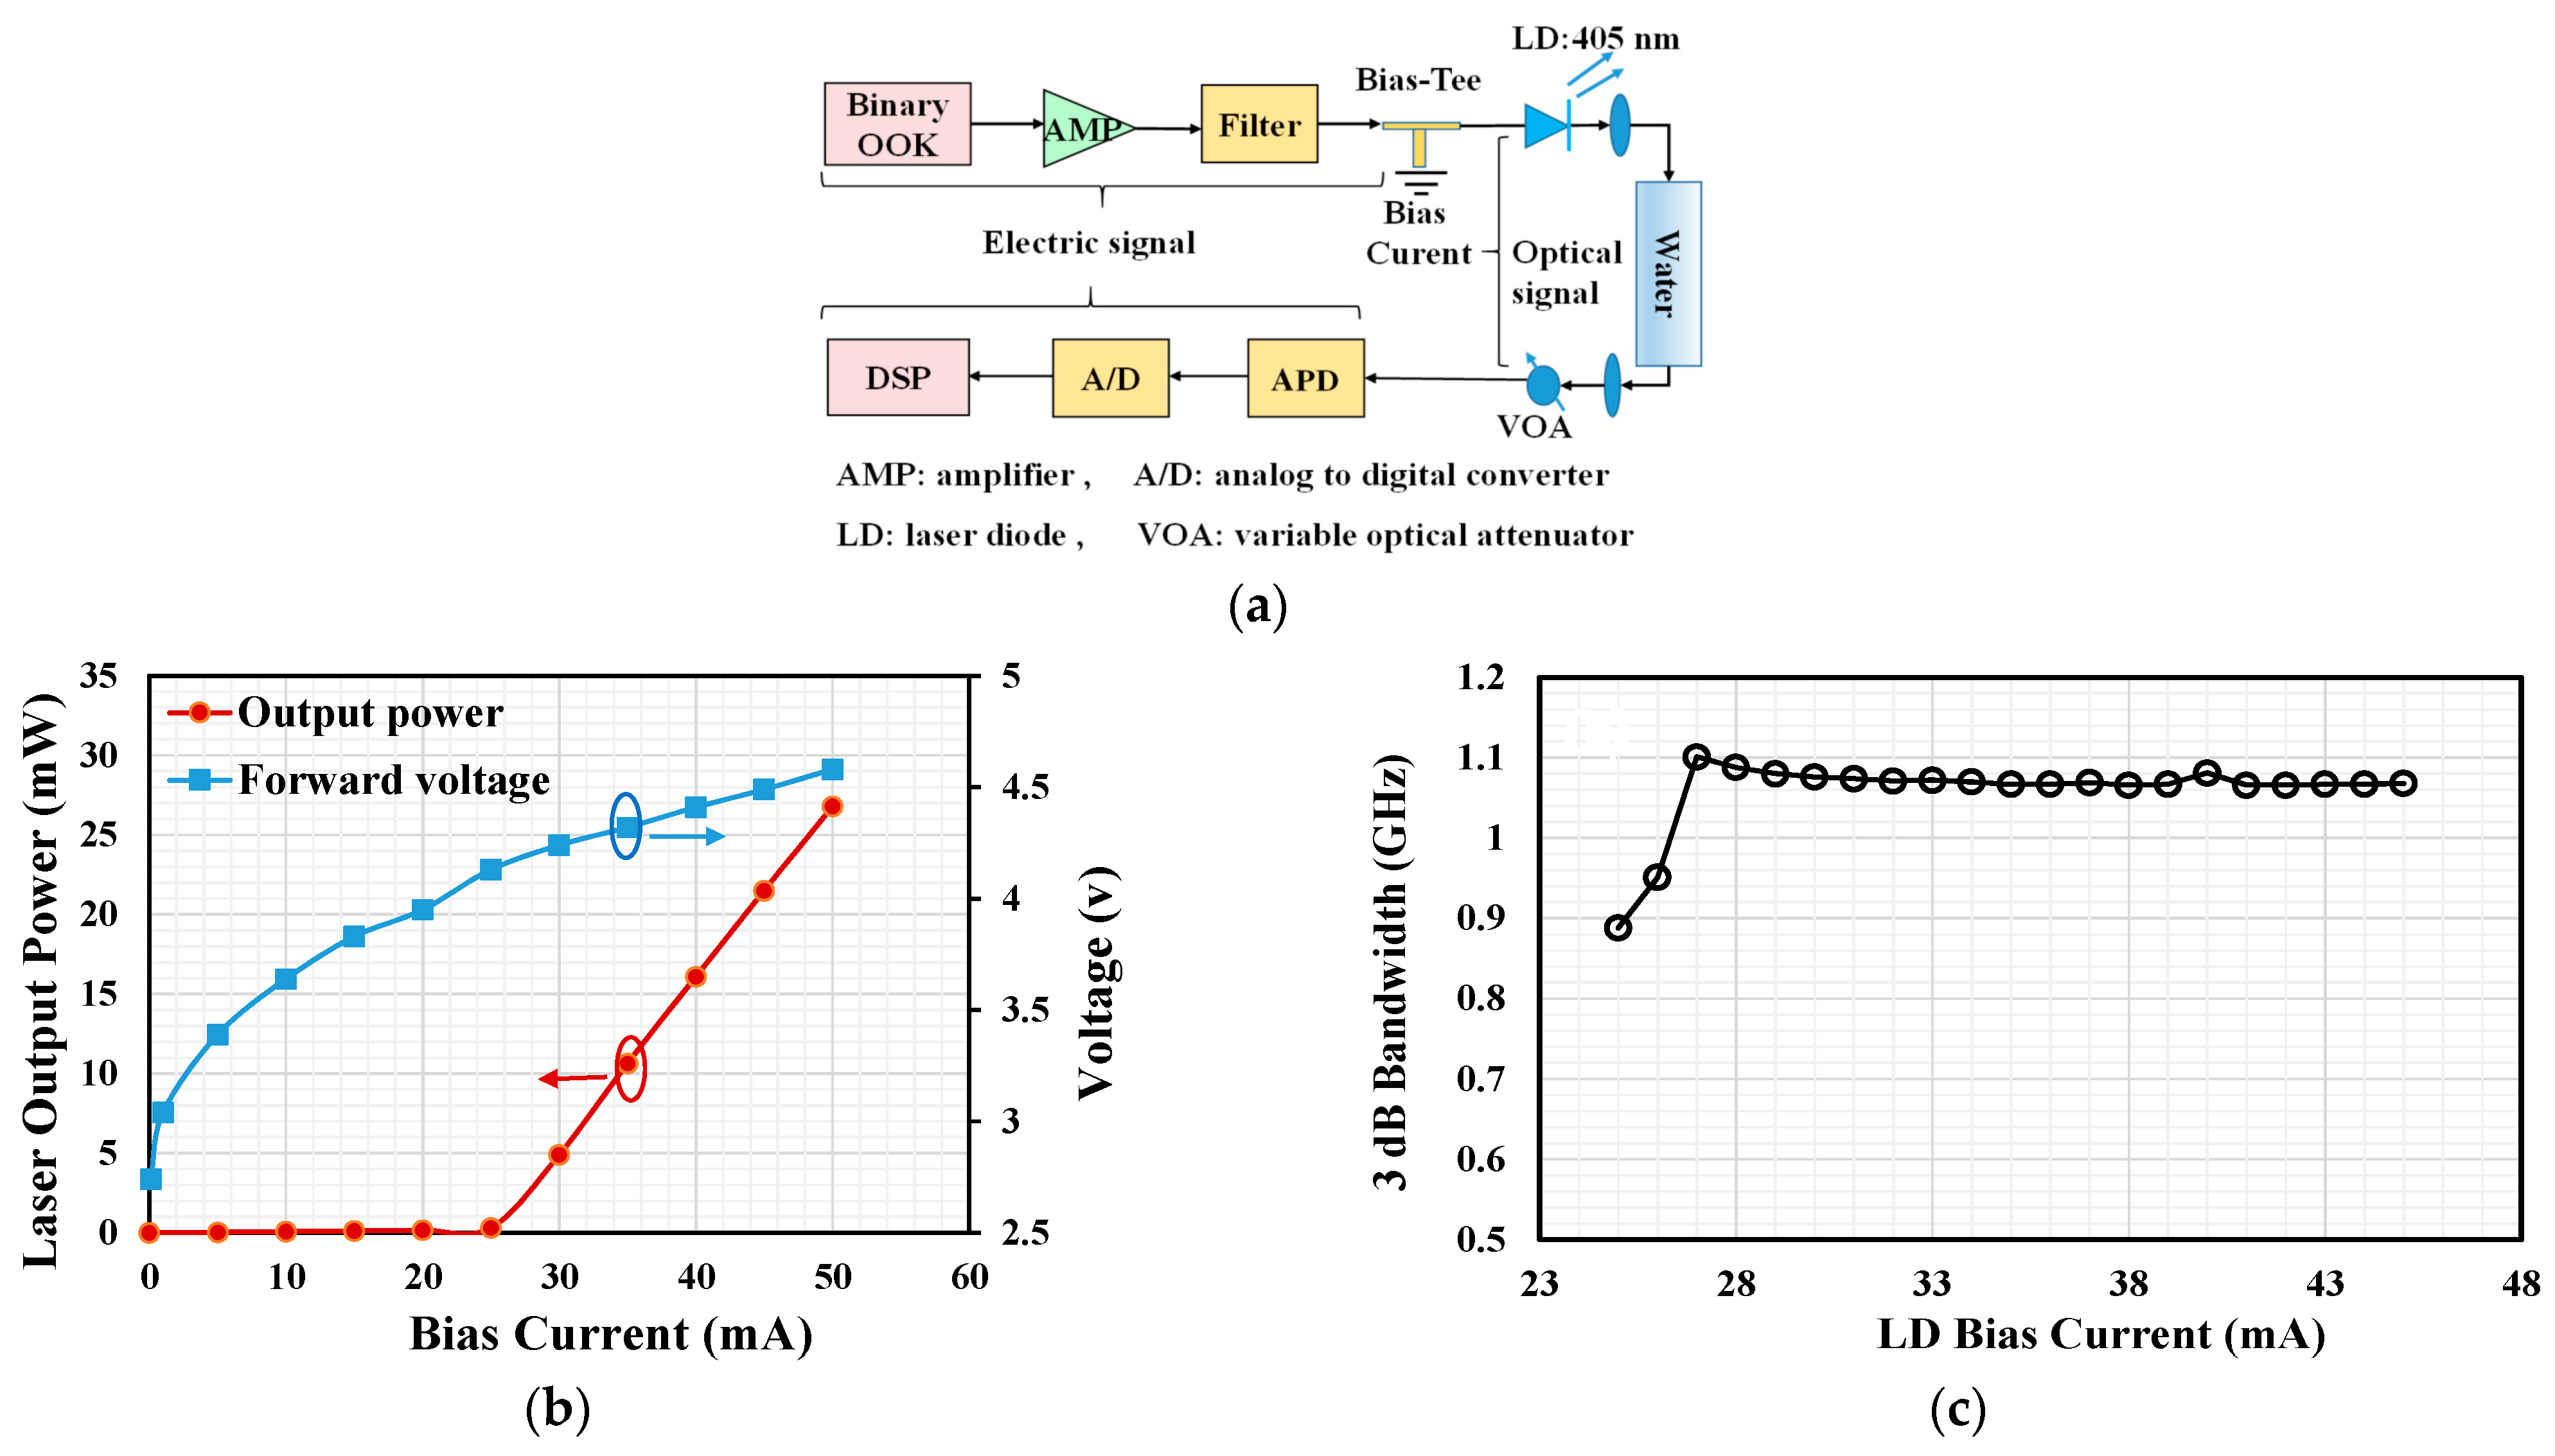
3. Experimental Setup

The schematic of the experimental setup is illustrated in Figure 3a. At the transmitter, binary electrical OOK signal is generated from an arbitrary waveform generator (Agilent M8190A, 12 Sa/s) using a pseudo-random bit sequence (PRBS) with length of 215. After a broadband power amplifier (SHF 100 BP, 3 dB bandwidth of 22 GHz, gain of 19 dB), the amplified electrical NRZ-OOK signal is filtered by a 1.5 GHz electrical low pass filter to exclude the excess noise. Through a bias-tee, the electrical NRZ-OOK signal, together with the direct bias current, is combined to drive the compact 405 nm blue laser diode (Thorlabs L405P20) for generating the free-space blue light signal. Using a micro lens with focal distance of 4.6 mm, the free-space optical signal is transmitted through a common 1-meter length glass tank filled with tap water. The experiment is carried out under common illumination condition, without special treatment for preventing the illumination light.
At the receiver side, a neutral density filter (NDF) is used as variable optical attenuator to adjust the attenuation of the received optical power. A Si amplified fixed detector (Thorlabs APD210, 400–1000 nm, 3 dB bandwidth of 1 GHz) is used to detect the received optical signal. After optical-electrical conversion, the waveform of the received electrical signal is captured by a digital oscilloscope (Agilent DSO 9320A, 80 GSa/s) working with sampling frequency of 10 GSa/s, and sharing the same 10 MHz reference clock with the AWG to avoid the sampling frequency drift.
Before the signal transmission, we first characterize the specifications of the LD, and bandwidth of the system, as shown in Figure 3b,c. The relations between laser output power, forward voltage, and bias current for driving the LD is characterized to make sure the LD is driven in its linear region. As shown in Figure 3b, the threshold current of the 405 nm LD is 25 mA, and the output power reaches 27 mW at bias current of 50 mA. We, then, measure the overall bandwidth of the experimental system by using a vector network analyzer (Agilent 8722ES), as shown in Figure 3c. For measuring the system bandwidth, both the broadband power amplifier and the 1.5 GHz low pass filter are removed. As shown in Figure 3c, by adjusting the bias current of the LD from 25 to 45 mA, the maximum 3 dB bandwidth of the system is 1.1 GHz for bias current of 27 mA and 39 mA. For bias current within 27–45 mA, the 3-dB bandwidth of the overall system is about 1.08 GHz. In the experiment, the received data are processed offline by using either traditional symbol-by-symbol (SBS) detection or the MLSE detection, which is used for mitigation the ISI caused by the bandwidth limitations when transmitting high bitrate signal. The bit-error-ratio (BER) is measured from more than half million symbols.

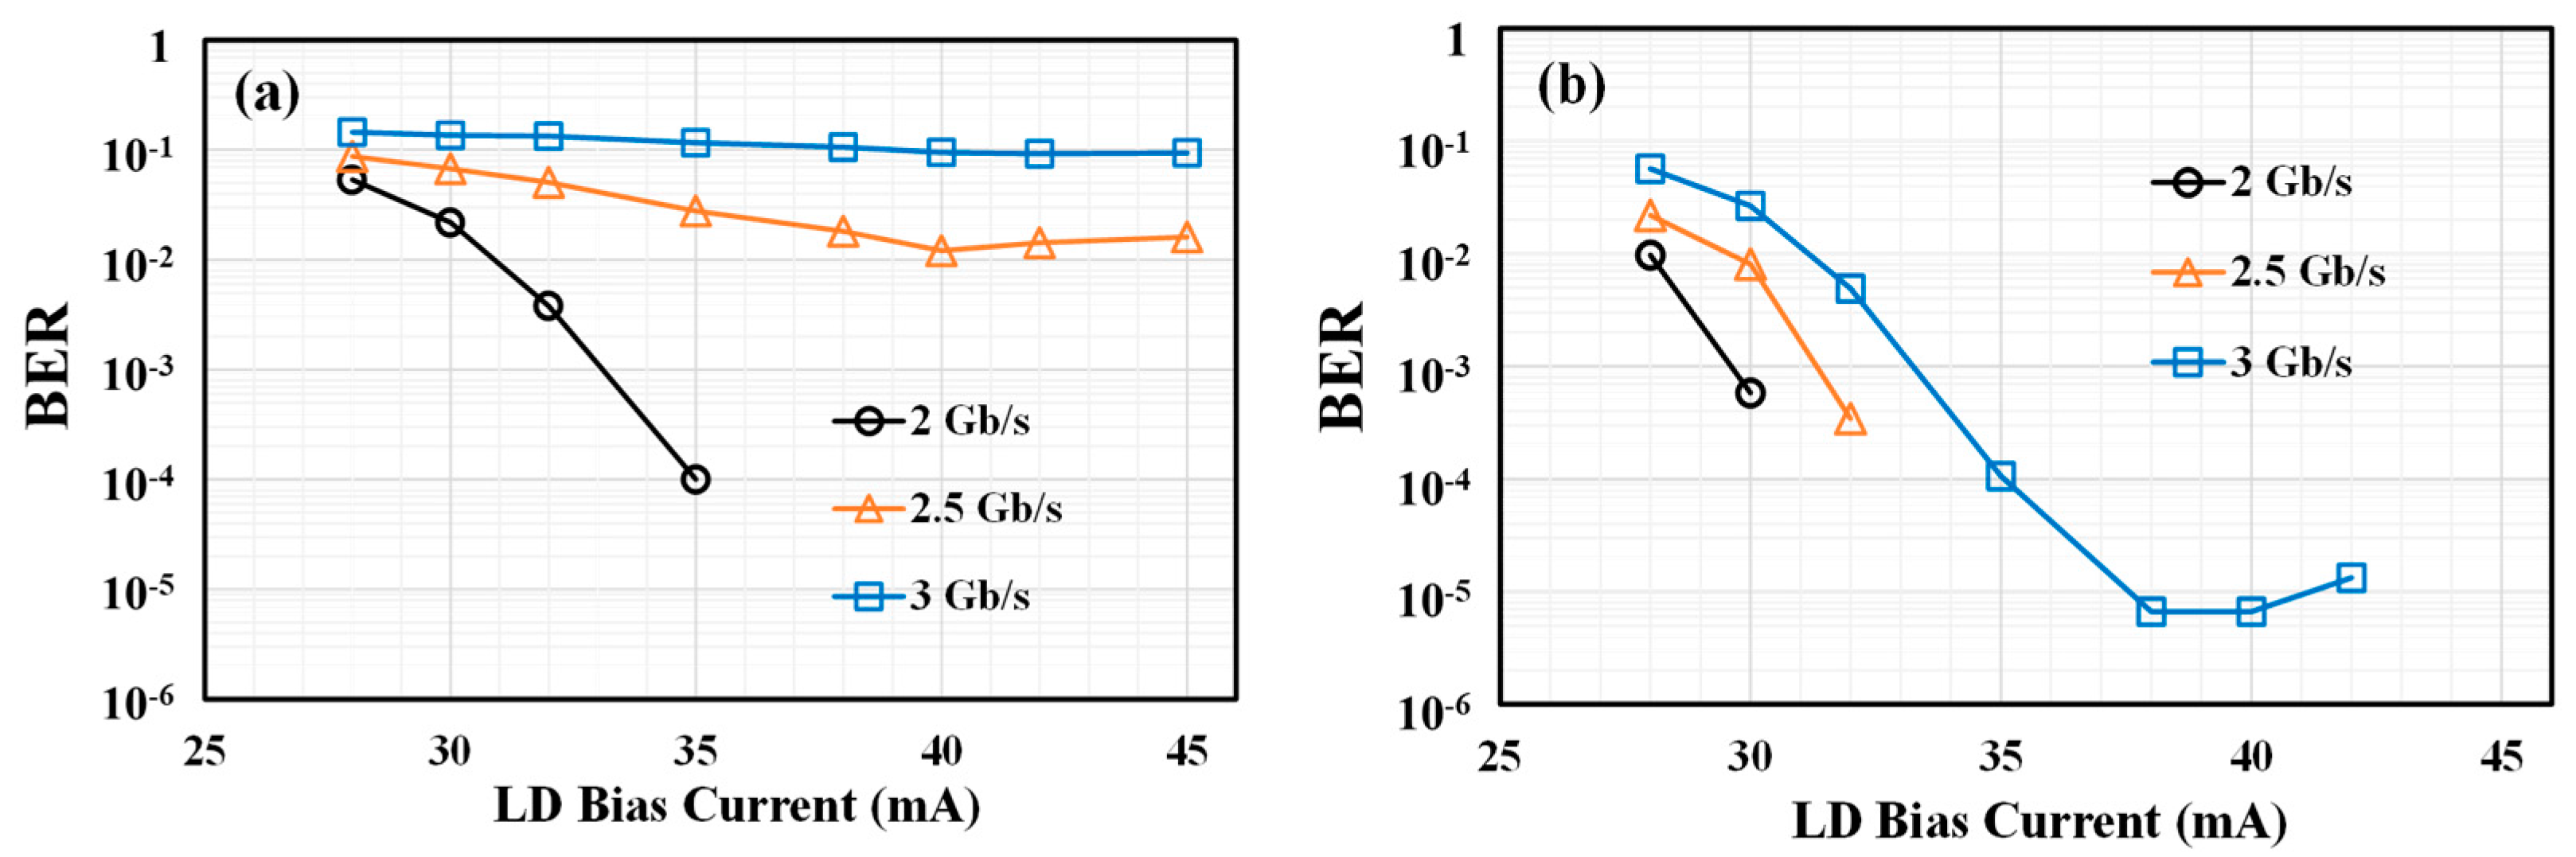
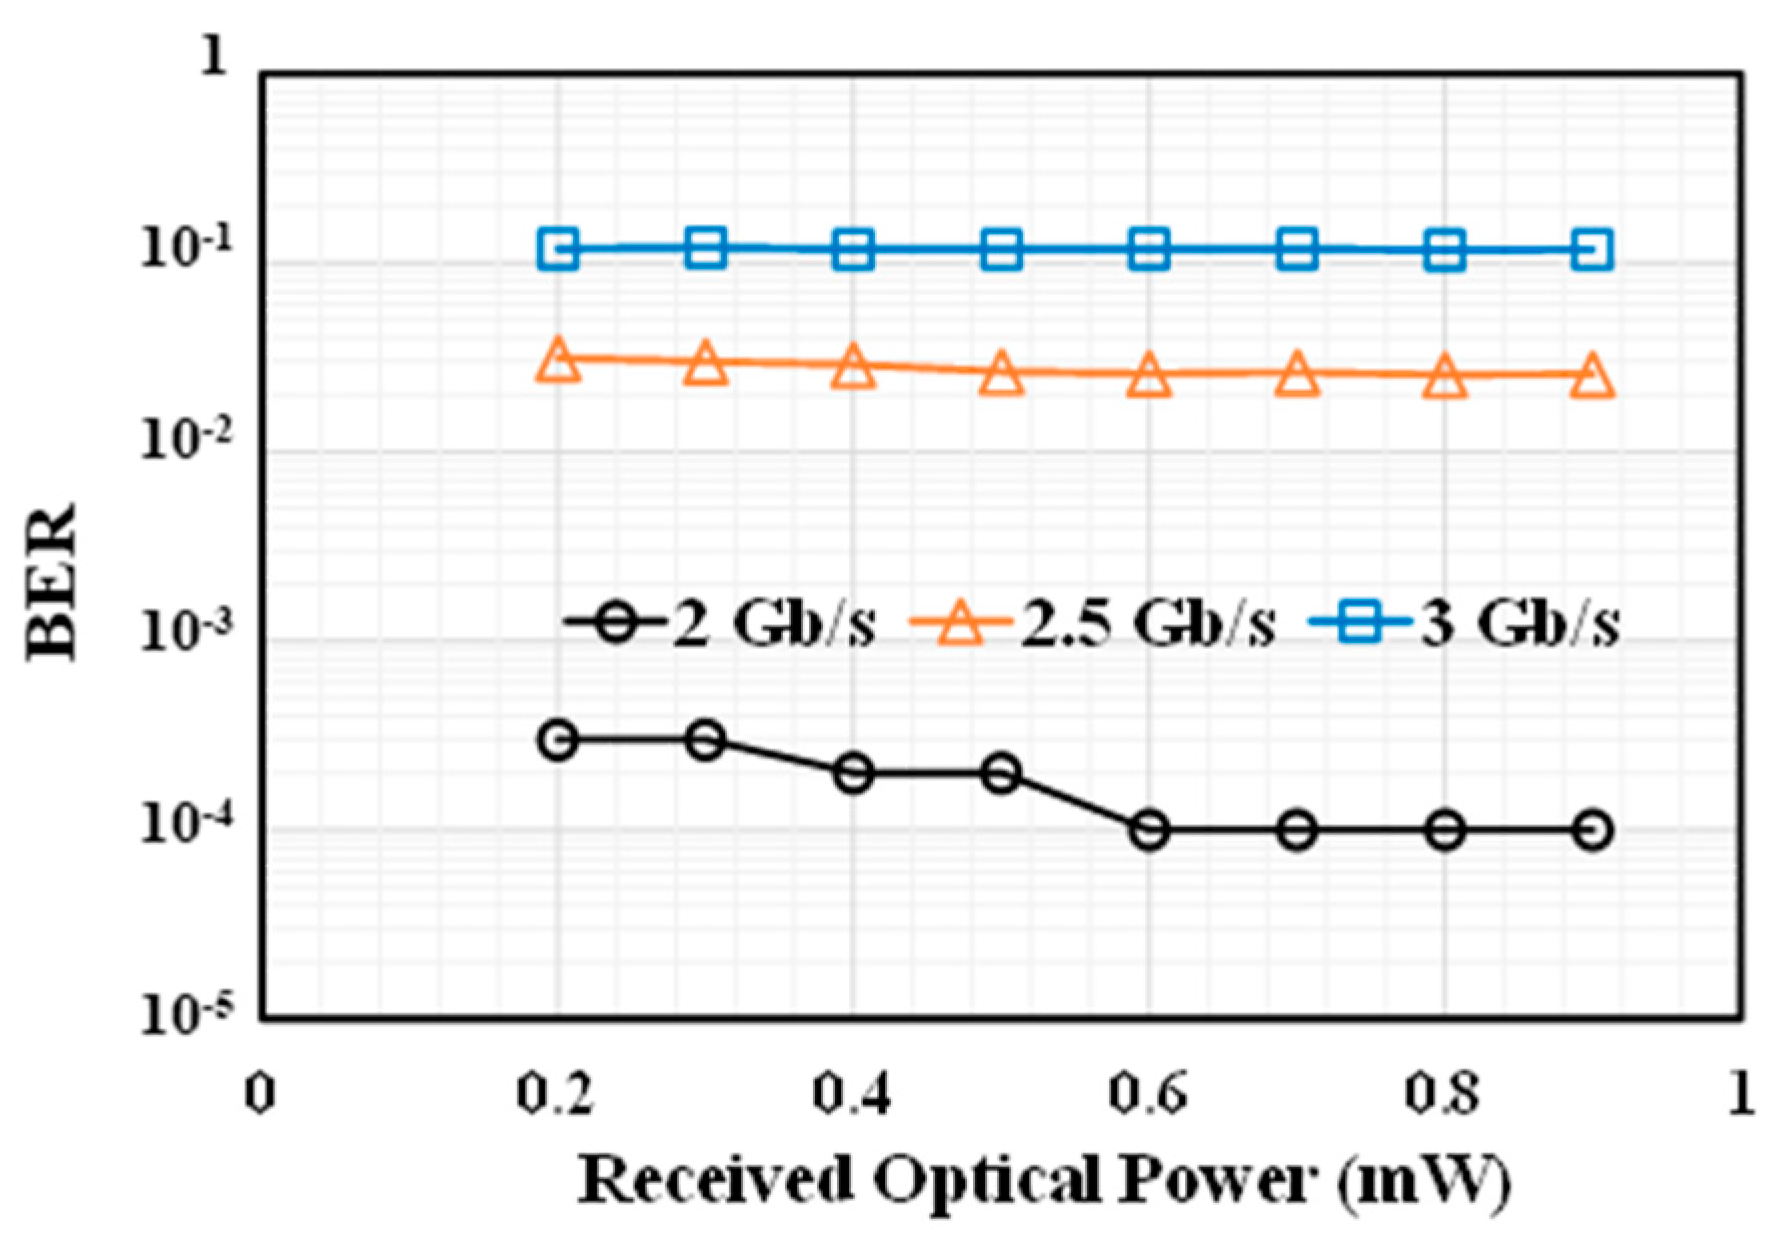
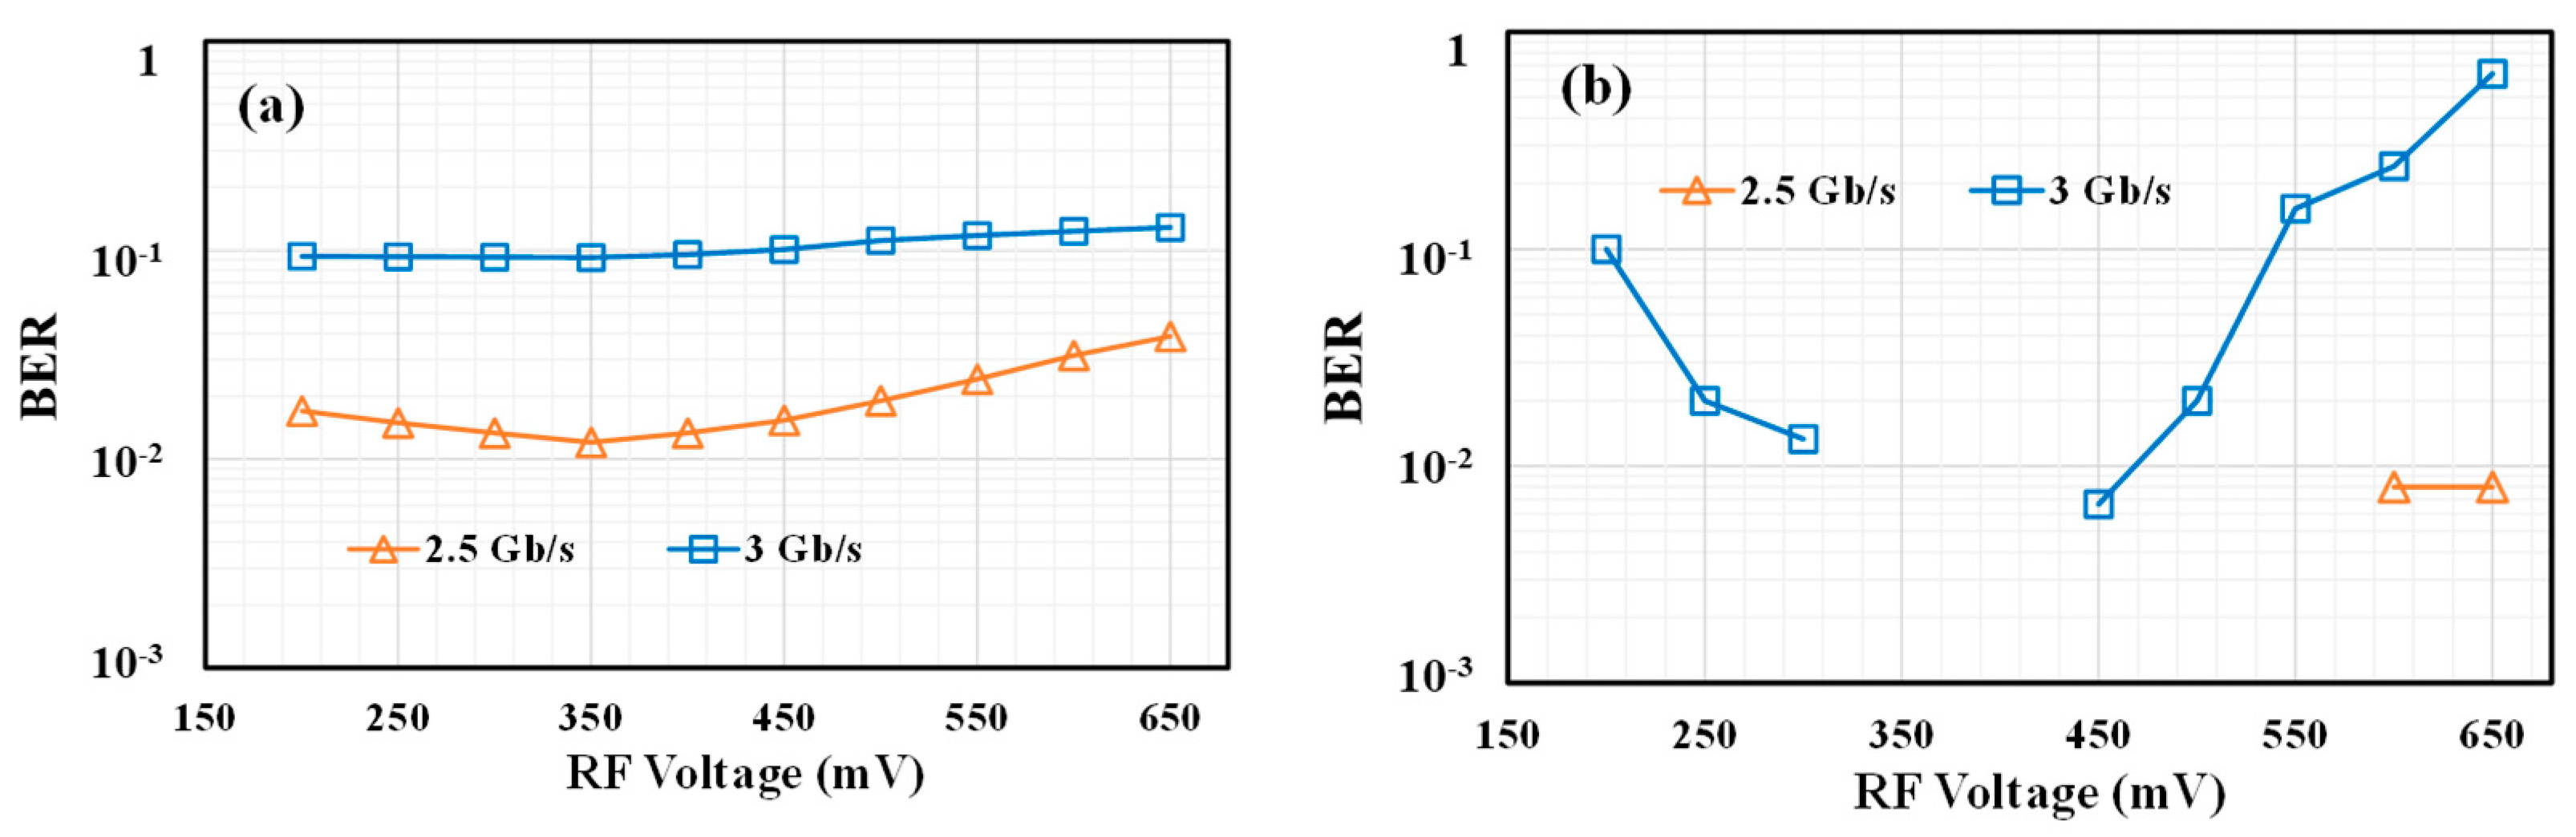
4. Experimental Results and Discussion

To obtain the optimal system working conditions, we first investigate the influence of LD bias current and amplitude of the modulation bandwidth on the system performance. The influence of LD bias current on the BER for 2 Gb/s, 2.5 Gb/s, and 3 Gb/s OOK signals is shown in Figure 4, by using either SBS detection and 7-tap MLSE detection. During the measurement, the received optical power is fixed at 0.6 mW by adjusting the attenuation of the neutral density filter, and the amplitude of the electrical OOK signal sent from the AWG is fixed at Vpp = 0.4 V.
As shown in Figure 4a, by using SBS detection, the BER reduces from 2.1 × 10⁻² to 1 × 10⁻⁴ when the LD bias current increase from 30 mA to 35 mA. For larger bias current, no bit error is detected for 2 Gb/s signal. However, for higher bitrate, the minimum BER increases to 1.2 × 10⁻² and 9.4 × 10⁻² for 2.5 Gb/s and 3 Gb/s signal, respectively, due to the large inter-symbol interference introduced by the limited system bandwidth. Figure 4b shows the BER performance by using the MLSE detection, which are used to combat with large ISI. As shown in Figure 4b, the BER reduce significantly by using the MLSE detection. For instance, the BER of 3 Gb/s OOK signal with MLSE detection reduces from 9.4 × 10⁻² to 6.6 × 10⁻⁶, compared to the traditional SBS detection. Moreover, for 2 Gb/s and 2.5 Gb/s OOK signal, no bit error is observed when the LD bias current is above 30 and 32 mA, respectively.
By keeping the laser bias current of 35 mA, we further investigate the influence of signal amplitude on the BER performance for 2.5 and 3 Gb/s OOK signal, still using either SBS detection or 7-tap MLSE detection, as shown in Figure 5. As shown in Figure 5a, the minimum BER of 2.5 and 3 Gb/s OOK transmission by using SBS detection is 1.2 × 10⁻² and 9.2 × 10⁻², respectively, obtained at optimal RF voltage of 350 mV. By using MLSE detection, the optimal RF voltage is still about 350 mV for 3 Gb/s OOK signal, as shown in Figure 5b and the BER of 3 Gb/s OOK signal is reduced from 1 × 10⁻² to 6.6 × 10⁻⁶ at RF voltage of 450 mV, compared to the traditional SBS detection. For 2.5 Gb/s signal, no bit error is observed when RF voltage is below 550 mV. From the results as shown in Figure 4 and Figure 5, it can be observed either small LD bias current and large overdriving voltage can cause noticeable system degradation and, thus, the bias current and RF voltage need to be optimized for achieving appropriate system performance.
By fixing the laser bias current of 35 mA and OOK amplitude voltage of 350 mV, we measure the BER performance for various received optical power by adjusting the neutral density filter, as shown in Figure 6. It is shown that with SBS detection, the received optical power only slightly influences the BER of OOK signal. Moreover, no BER difference is observed when the received optical power is larger than 0.6 mW (−2.2 dBm).
After thoroughly system optimization, we fix the LD bias current of 40 mA, RF voltage of 350 mV and received optical power of 0.6 mW for further investigation. By changing the transmitted OOK bitrate from 2 Gb/s to 5 Gb/s, the BER performance for both SBS and MLSE detection are obtained, as shown in Figure 7. Assuming BER threshold of 3.8 × 10⁻³ for FEC with 7% overhead, it can be observed the maximum signal bitrate that can be transmitted by using SBS detection is roughly 2.4 Gb/s. As shown in Figure 7, by using the MLSE detection, the maximum tolerable OOK bitrate is 4 Gb/s, reaching spectral efficiency of almost 4 b/s/Hz by using OOK signaling.
The current state of the art bandwidth-limited OOK transmissions in high-speed fiber optical transmissions use MLSE algorithm with tap number of 7–10 [33]. Larger tap number would require unavoidable processing complexity and costs. Thus, it is necessary to find the minimum required tap number of MLSE algorithm for bandwidth limited underwater optical wireless OOK transmission with various bitrates. The relation between MLSE tap number and BER performances for 3, 3.5, and 4 Gb/s OOK signals are shown in Figure 8.
With the increase in the bitrate, the required number of taps of MLSE detection for achieving the same BER performance also increases. For instance, as shown in Figure 8, the minimum required tap number of for MLSE is 3, 5, and 6 for signal bitrate of 3, 3.5, and 4 Gb/s, respectively. By further increasing the MLSE tap number, lower BER can still be obtained with the increase in processing complexity. By using 9 tap MLSE, the BER that can be obtained for 3.5 Gb/s and 4 Gb/s OOK is 8.5 × 10⁻⁶ and 1.5 × 10⁻³, respectively. Thus, under the serious bandwidth limitation of the UWOC communication, the OOK signaling with MLSE detection can realize high transmission bitrate and spectral efficiency, with the advantage for its simplicity, and cost efficiency, exhibiting great potential for high-speed UWOC applications.

5. Simulation Results and Discussion

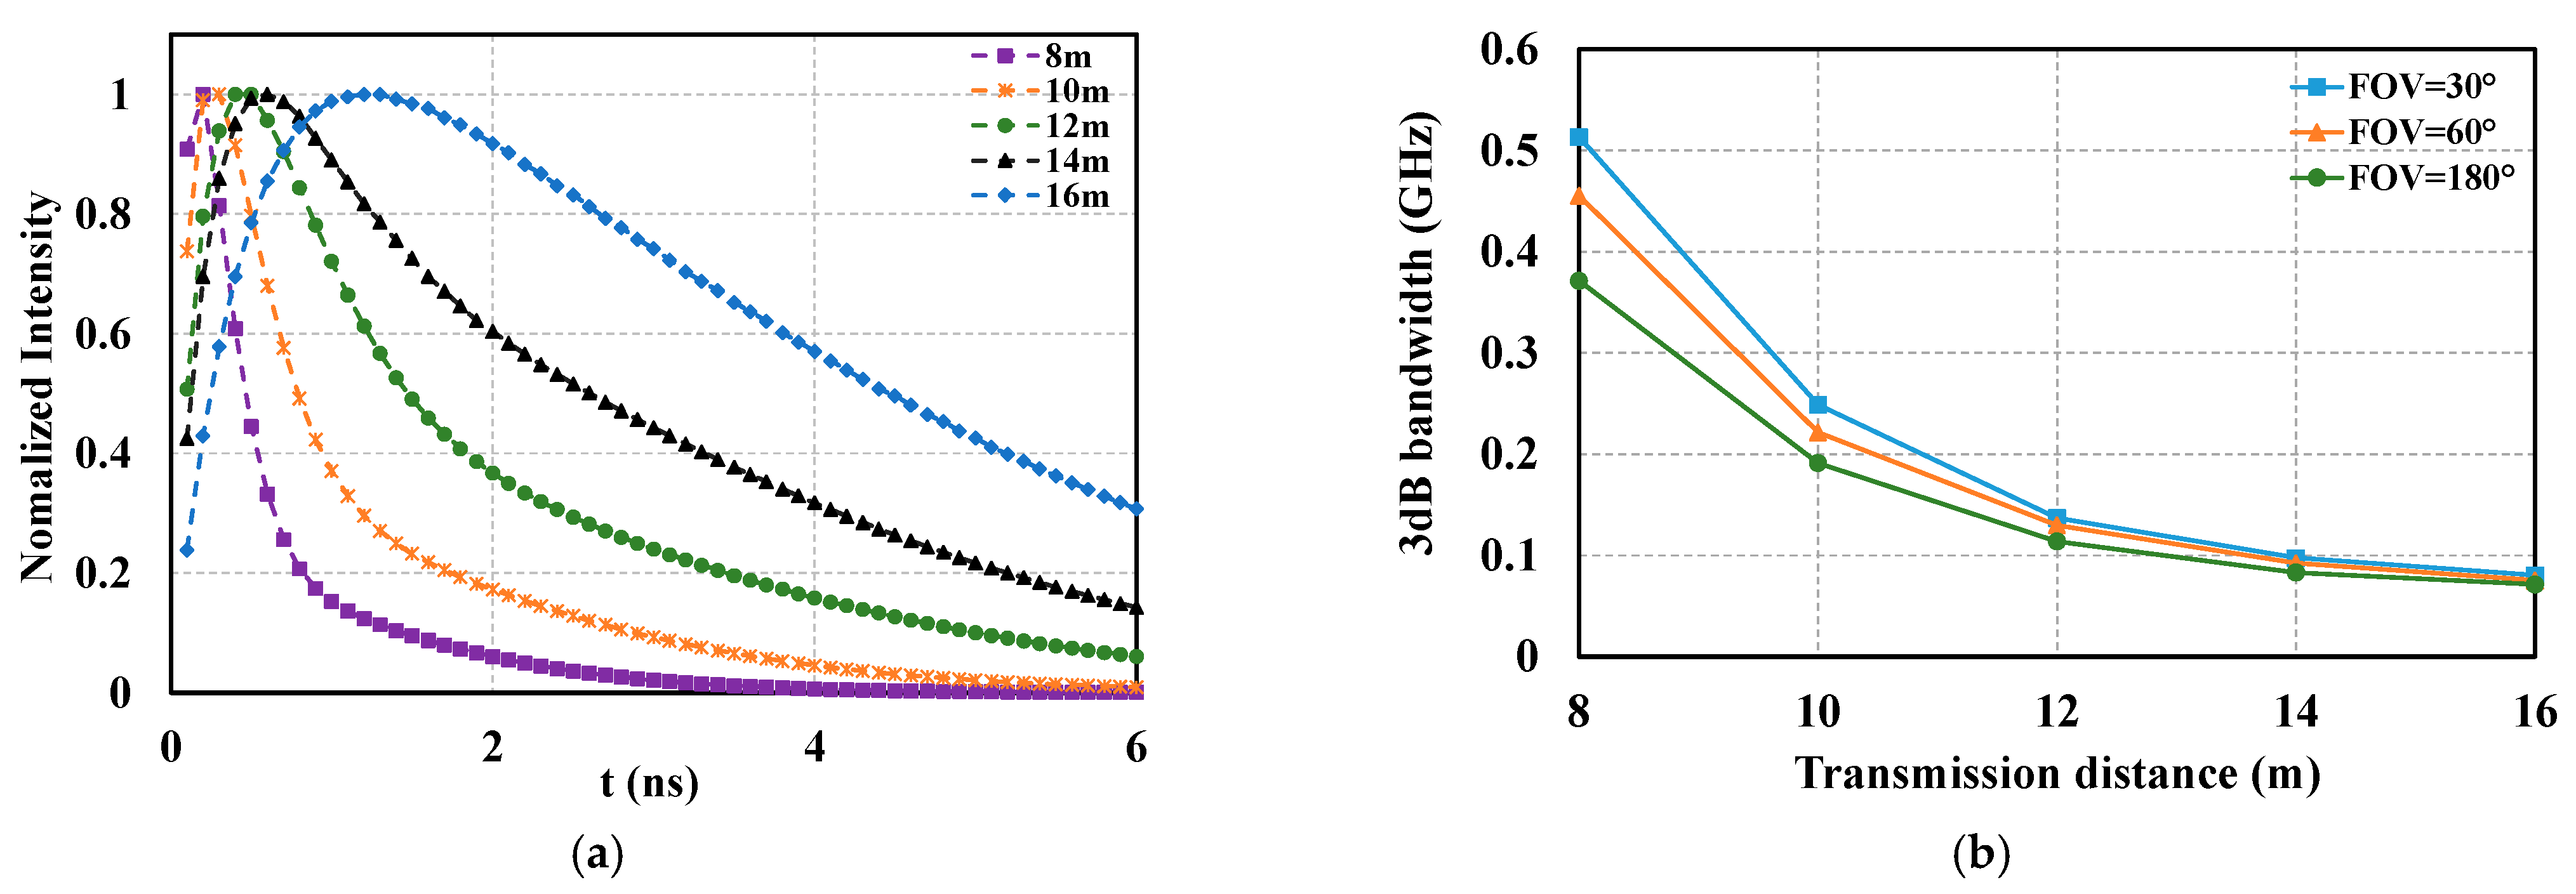
5.1. Channel Characteristics

Based on the Monte Carlo method together with the volume scattering phase function mentioned above, we simulate the beam propagation of various link ranges in harbor water and obtain the impulse response curve for the channel. In [32], we have obtained some simulation results of this work. The parameter settings for Monte Carlo simulation and the noise model are listed in (a) of the Table 1 [14], and (b) of the Table 1 [34], respectively.
To observe the impact of the transmission distance on the channel impulse response, we normalized the simulation results with link range distances of 8 m, 10 m, 12 m, 14 m, and 16 m, respectively, as shown in Figure 9a. After comparing the curves for the impulse response for different transmission distances in harbor water shown in Figure 9a, we believe that as the transmission distance increases, the temporal dispersion becomes increasingly large, which leads to the power of the pulse spreading into adjacent symbols. An obvious reason for this is that the longer transmission distance gives photons more of a chance to collide, thus leading to more photons being absorbed and scattered by the planktons and suspended particles. It is obvious that the temporal dispersion becomes very large when the transmission distance is 16 m, the full width at half maximum (FWHM) of the response exceeds 4ns, as shown in Figure 9a.
To obtain the channel performance in harbor water in the frequency domain, we take a Fourier transform of the channel time domain response and calculate the 3-dB bandwidth for different transmission distances and different FOVs, as shown in Figure 9b. The results are obtained under the condition of harbor water, which has a rigorous limitation on channel bandwidth. According to Figure 9b, with the transmission distance increasing, the channel bandwidth decreases dramatically. When the FOV is 30°, the channel bandwidth is reduced from 0.5 to 0.1 GHz for distances from 8 to 14 m.

5.2. Performance Evaluation

In this section, we present the performance evaluation for a UWOC system based on the channel impulse response. First, we predicate a reasonable tap number for MLSE, and, then, we evaluate the effect of ISI caused by temporal dispersion, as well as BER performance. Finally, we discuss the power budget.
At the receiver, the MLSE algorithm is adopted to compensate for the ISI induced by the limited bandwidth underwater channel, resulting in improved system performance. Figure 10 shows the relationship between BER and MLSE tap numbers for varying transmission rates when the transmission power is fixed at 24 dBm and FOV is 30°.
As shown in Figure 10, the BER performance is considerably improved as the MLSE tap number increases. The BER of the 0.6 Gb/s OOK signal decreases from 4.5 × 10⁻³ to 1.34 × 10⁻⁵ for increasing MLSE tap number from 2 to 5. However, the system performance improvement is not obvious when the MLSE tap number increases from 5 to 7. Considering that an increase in the tap number will improve the system complexity, we adopt a 5-taps MLSE as a trade-off between compensation effect and complexity.
Due to the absorption and scattering of photons caused by particles in the water, the channel response shows temporal dispersion, i.e., temporal spread of the beam pulse, thus, leading to ISI. The OOK and pulse amplitude modulation (PAM) signals are investigated, respectively, to evaluate the effect of ISI. We evaluate the system performance by sending a pseudo random binary sequence (PRBS) with a length of 220 through the harbor water underwater channel. The BER performance without MLSE is also investigated and compared. Figure 11 shows the BER performance versus transmission power for various transmission distances and signal bitrates when the FOV is 30°. The transmission power is defined as the average transmission power of the pulse slots after modulation [14]. To investigate the system performance influenced by various modulation formats and MLSE, we conduct an UWOC system simulation changing from OOK modulation to PAM4 modulation. A simulation for OOK and PAM4 under different transmission distances is conducted to assess the underwater channel quality. At the receiver, for OOK transmission and PAM4 transmission, MLSE is adopted to equalize the temporal dispersion influence.
From Figure 11a, ISI leads to BER become lower than 7% FEC threshold for high data rates, but the system performance shows an obvious improvement after using MLSE. ISI mitigation with MLSE is evident in Figure 11b. From Figure 11b, when the transmission distance is 14 m, the BER performance of the UWOC cannot meet the threshold of 7% FEC without using MLSE. However, after using 5-tap MLSE, a transmission rate of 0.6 Gb/s can be achieved. Additionally, by adopting 5-tap MLSE, the maximum available bitrate with HD-FEC is improved from 0.4 to 0.8 Gb/s for 12 m transmission distance.
As shown in Figure 12, PAM4 modulation could transmit at a high bitrate, but it only achieves a 0.8 Gb/s transmission for 8 m transmission distance without MLSE at 23 dBm transmit power. After adopting MLSE, the transmission capacity comes to 2 Gb/s for 10 m transmission distance at 25 dBm transmit power.
To take a full consideration of the required transmission power of the laser in the experiments, we investigated the relationship between the required transmit power and the transmit distance, as well as the transmission rate using the OOK modulation. The power budget is defined as the minimum transmit power required that enables the BER performance to meet the threshold of 7% FEC. The dotted line shows the results for the power budget versus the transmission distance after adopting MLSE, and the solid line shows the results obtained without MLSE, as shown in Figure 13.
From Figure 13, it is observed that when the transmission distance is short, the MLSE can effectively reduce the power budget. For example, the power budget is reduced by 4 dB after using MLSE for a transmission rate and distance of 0.8 Gb/s and 10 m, respectively. When the signal could not be transmitted due to temporal dispersion, we are able to achieve a 14-m transmission by utilizing MLSE. Therefore, MLSE is a feasible algorithm for realizing transmission with a large bandwidth and to effectively reduce the power budget in turbid harbor water.

6. Conclusions

For UWOC systems, there still exist bandwidth limitations, with a lack of studies to investigate its influence on system’s performance and effective compensation methods for its mitigation. In this paper, we investigate the bandwidth limitation for UWOC system caused by transceiver and underwater temporal dispersion, as well as how to mitigate it through experiments and simulations.
Experimental results show that, compared with conventional symbol-by-symbol detection, the maximum bitrate of the simple rectangular shape OOK signaling is raised from 2.4 Gb/s to 4 Gb/s by adopting the 7-tap MLSE detection. In the simulation, we use Monte Carlo method with Fournier–Forand phase function to simulate the temporal dispersion and bring in the bandwidth limitation in underwater channel. With MLSE adopted at the receiver, the maximum available bitrate is improved from 0.4 to 0.8 Gb/s in 12 m of harbor water. Moreover, the power budget can be reduced from 27.8 dBm to 23.6 dBm for 0.8 Gb/s 10 m OOK transmission with MLSE equalization. Both the experimental and simulation results show that MLSE method has the potential for enhancing the performance for UWOC systems faced with bandwidth limitation.

Author Contributions

J.Z. performed the experiment and realized simulation models about MLSE; G.G. performed the investigation and wrote the original draft. Z.M. performed analytical calculations and plotting. J.L. performed the Monte Carlo simulation. Y.G. discussed the experimental results and revised the manuscript. All authors have read and agreed to the published version of the manuscript.

Funding

This work was supported in part by the National Natural Science Foundation of China under Grant U1831110, in part by the Fundamental Research Funds for the Central Universities under Grant 2019XD-A15-2, and in part by the State Key Laboratory of Information Photonics and Optical Communications Funds under Grant IPOC2020ZZ02.

Data Availability Statement

Not applicable.

Conflicts of Interest

The authors declare no conflict of interest.

References

  1. Zeng, Z.; Fu, S.; Zhang, H.; Dong, Y.; Cheng, J. A survey of underwater optical wireless communications. IEEE Commun. Surv. Tutor. 2016, 19, 204–238. [Google Scholar] [CrossRef]
  2. Kaushal, H.; Kaddoum, G. Underwater optical wireless communication. IEEE Access 2016, 4, 1518–1547. [Google Scholar] [CrossRef]
  3. Saeed, N.; Celik, A.; Al-Naffouri, T.Y.; Alouini, M.S. Underwater optical wireless communications, networking, and localization: A survey. Ad Hoc Netw. 2019, 94, 101935. [Google Scholar] [CrossRef] [Green Version]
  4. Liu, X.; Yi, S.; Zhou, X.; Fang, Z.; Qiu, Z.J.; Hu, L.; Cong, C.; Zheng, L.; Liu, R.; Tian, P. 34.5 m underwater optical wireless communication with 2.70 Gbps data rate based on a green laser diode with NRZ-OOK modulation. Opt. Express 2017, 25, 27937–27947. [Google Scholar] [CrossRef] [PubMed]
  5. Lu, C.; Wang, J.; Li, S.; Xu, Z. 60 m/2.5 Gbps Underwater Optical Wireless Communication with NRZ-OOK Modulation and Digital Nonlinear Equalization. In Proceedings of the 2019 Conference on Lasers and Electro-Optics (CLEO), San Jose, CA, USA, 5–10 May 2019; pp. 1–2. [Google Scholar] [CrossRef]
  6. Li, C.-Y.; Lu, H.-H.; Tsai, W.-S.; Wang, Z.-H.; Hung, C.-W.; Su, C.-W.; Lu, Y.-F. A 5 m/25 Gbps Underwater Wireless Optical Communication System. IEEE Photonics J. 2018, 10, 1–9. [Google Scholar] [CrossRef]
  7. Fei, C.; Zhang, J.; Zhang, G.; Wu, Y.; Hong, X.; He, S. Demonstration of 15-M 7.33-Gb/s 450-nm Underwater Wireless Optical Discrete Multitone Transmission Using Post Nonlinear Equalization. J. Lightwave Technol. 2018, 36, 728–734. [Google Scholar] [CrossRef]
  8. Du, J.; Wang, Y.; Fei, C.; Chen, R.; Zhang, G.; Hong, X.; He, S. Experimental demonstration of 50-m/5-Gbps underwater optical wireless communication with low-complexity chaotic encryption. Opt. Express 2021, 29, 783–796. [Google Scholar] [CrossRef] [PubMed]
  9. Wang, J.; Lu, C.; Li, S.; Xu, Z. 100 m/500 Mbps underwater optical wireless communication using an NRZ-OOK modulated 520 nm laser diode. Opt. Express 2019, 27, 12171–12181. [Google Scholar] [CrossRef] [PubMed]
  10. Chen, X.; Yang, X.; Tong, Z.; Dai, Y.; Li, X.; Zhao, M.; Zhang, Z.; Zhao, J.; Xu, J. 150 m/500 Mbps Underwater Wireless Optical Communication Enabled by Sensitive Detection and the Combination of Receiver-Side Partial Response Shaping and TCM Technology. J. Lightwave Technol. 2021, 39, 4614–4621. [Google Scholar] [CrossRef]
  11. Zhang, L.; Tang, X.; Sun, C.; Chen, Z.; Li, Z.; Wang, H.; Jiang, R.; Shi, W.; Zhang, A. Over 10 attenuation length gigabits per second underwater wireless optical communication using a silicon photomultiplier (SiPM) based receiver. Opt. Express 2020, 28, 24968–24980. [Google Scholar] [CrossRef] [PubMed]
  12. Baghdady, J.; Miller, K.; Morgan, K.; Byrd, M.; Osler, S.; Ragusa, R.; Li, W.; Cochenour, B.M.; Johnson, E.G. Multi Gigabit/s underwater optical communication link using orbital angular momentum multiplexing. Opt. Express 2016, 24, 9794–9805. [Google Scholar] [CrossRef]
  13. Ren, Y.; Li, L.; Wang, Z.; Kamali, S.M.; Arbabi, E.; Arbabi, A.; Zhao, Z.; Xie, G.; Cao, Y.; Ahmed, N.; et al. Orbital Angular Momentum-based Space Division Multiplexing for High capacity Underwater Optical Communications. Sci. Rep. 2016, 6, 33306. [Google Scholar] [CrossRef] [PubMed]
  14. Tang, S.; Dong, Y.; Zhang, X. Impulse response modeling for underwater wireless optical communication links. IEEE Trans. Commun. 2014, 62, 226–234. [Google Scholar] [CrossRef]
  15. Jaruwatanadilok, S. Underwater wireless optical communication channel modeling and performance evaluation using vector radiative transfer theory. IEEE J. Sel. Areas Commun. 2008, 26, 1620–1627. [Google Scholar] [CrossRef]
  16. Gabriel, C.; Khalighi, M.; Bourennane, S.; Leon, P.; Rigaud, V. Channel modeling for underwater optical communication. In Proceedings of the IEEE GC Wkshps, Houston, TX, USA, 5–9 December 2011; pp. 833–837. [Google Scholar]
  17. Gabriel, C.; Khalighi, M.; Bourennane, S.; Leon, P.; Rigaud, V. Monte-Carlo-based channel characterization for underwater optical communication systems. IEEE/OSA J. Opt. Commun. Net. 2013, 5, 1–12. [Google Scholar] [CrossRef] [Green Version]
  18. Cox, W.C. Simulation, Modeling and Design of Underwater Optical Communication Systems. In Dissertations & Theses—Gradworks; North Carolina State University: Raleigh, NC, USA, 2012; Volume 34, pp. 930–942. [Google Scholar]
  19. Li, J.; Ma, Y.; Zhou, Q.; Zhou, B.; Wang, H. Monte Carlo study on pulse response of underwater optical channel. Opt. Eng. 2012, 51, 066001. [Google Scholar] [CrossRef]
  20. Dalgleish, F.; Caimi, F.; Vuorenkoski, A. Efficient laser pulse dispersion codes for turbid undersea imaging and communications applications. Ocean Sens. Monit. II 2010, 7678, 1–12. [Google Scholar] [CrossRef]
  21. Mobley, C. Light and Water: Radiative Transfer in Natural Waters; Academic Press (Elsevier Science): Amsterdam, The Netherlands, 1994. [Google Scholar]
  22. Lillycrop, W.J.; Parson, L.E.; Irish, J.L. Development and Operation of the SHOALS Airborne Lidar Hydrographic System. In CIS Selected Papers: Laser Remote Sensing of Natural Waters: From Theory to Practice; SPIE: Bellingham, DC, USA, 1996; Volume 2964, pp. 26–37. [Google Scholar] [CrossRef]
  23. Cochenour, B.M.; Mullen, L.J. Free-space optical communications underwater. In Advanced Optical Wireless Communon System; Cambridge University Press: Cambridge, UK, 2012; pp. 201–239. [Google Scholar]
  24. Hickman, G.D.; Hogg, J.E. Application of an airborne pulsed laser for near shore bathymetric measurements. Remote Sens. Environ. 1969, 1, 47–58. [Google Scholar] [CrossRef]
  25. Lillycrop, W.J.; Parson, L.E.; Estep, L.L. Field testing of the U S Army Cops of engineers airborne lidar: Hydrography survey system. In Proceedings of the US Hydrographic Conference, Norfolk, VA, USA, 18–23 April 1994; pp. 144–151. [Google Scholar]
  26. Wang, L.; Jacques, S.L.; Zheng, L. MCML, Monte Carlo modeling of light transport in multi-layered tissues. Comput. Meth. Prog. Biomed. 1995, 47, 131–146. [Google Scholar] [CrossRef]
  27. Henyey, L.C.; Greenstein, J.L. Diffuse radiation in the Galaxy. Astrophys. J. 1941, 93, 70–83. [Google Scholar] [CrossRef]
  28. Manor, H.; Arnon, S. Performance of an optical wireless communication system as a function of wavelength. Appl. Opt. 2003, 42, 4285–4294. [Google Scholar] [CrossRef] [PubMed]
  29. Chen, S.; Xie, C.; Zhang, J. Comparison of advanced detection techniques for QPSK signals in super-Nyquist WDM systems. IEEE Photonics Technol. Lett. 2014, 27, 105–108. [Google Scholar] [CrossRef]
  30. Gao, G.; Li, J.; Zhao, L.; Guo, Y.; Zhang, F. 1 Gb/s underwater optical wireless On-off-keying communication with 167 MHz receiver bandwidth. In Proceedings of the 2018 OCEANS—MTS/IEEE Kobe Techno-Oceans (OTO), Kobe, Japan, 28–31 May 2018; pp. 1–4. [Google Scholar]
  31. Xu, C.; Gao, G.; Chen, S.; Zhang, J.; Luo, M.; Hu, R.; Yang, Q. Sub-symbol-rate sampling for PDM-QPSK signals in super-Nyquist WDM systems using quadrature poly-binary shaping. Opt. Express 2016, 24, 26678–26686. [Google Scholar] [CrossRef] [PubMed]
  32. Li, J.; Gao, G.; Xu, C.; Bai, J.; Guo, Y. Influence of Temporal Dispersion on the Undersea Wireless Optical Communication and Its Mitigation using MLSE. In Proceedings of the OCEANS 2018 MTS/IEEE Charleston, Charleston, SC, USA, 22–25 October 2018; pp. 1–5. [Google Scholar] [CrossRef]
  33. Karinou, F.; Stojanović, N.; Yu, Z.; Zhao, Y. Toward cost-efficient 100G metro networks using IM/DD 10 GHz components and MLSE receiver. J. Lightwave Technol. 2015, 33, 4109–4117. [Google Scholar] [CrossRef]
  34. Hamza, T.; Khalighi, M.-A.; Bourennane, S.; Léon, P.; Opderbecke, J. Investigation of solar noise impact on the performance of underwater wireless optical communication links. Opt. Express 2016, 24, 25832–25845. [Google Scholar] [CrossRef] [PubMed]
Figure 1. Model of UWOC channel.
Photonics 09 00182 g001
Figure 2. Flow chart for Monte Carlo simulation.
Photonics 09 00182 g002
Figure 3. (a) Schematic diagram of the experimental setup. (b) Laser diode output power and voltage vs. bias current. (c) LD bias current vs. 3 dB bandwidth of the system.
Photonics 09 00182 g003
Figure 4. BER vs. LD bias current for various bitrate using (a) symbol by symbol detection and (b) 7-tap MLSE detection.
Photonics 09 00182 g004
Figure 5. BER vs. amplitude voltage of RF OOK signal by using (a) symbol by symbol (SBS) detection and (b) MLSE detection, the LD bias current is 35 mA and received optical power is 0.6 mW.
Photonics 09 00182 g005
Figure 6. BER vs. received optical power by using SBS detection, the LD bias current is 35 mA and RF voltage is 350 mV.
Photonics 09 00182 g006
Figure 7. BER vs. signal bitrate using symbol by symbol detection and 7-tap MLSE detection.
Photonics 09 00182 g007
Figure 8. BER vs. signal bitrate using symbol by symbol detection and 7-tap MLSE detection.
Photonics 09 00182 g008
Figure 9. (a) The normalized channel impulse response with different link range. (b) 3 dB channel bandwidth versus transmission distance under FOV of 30°, 60°, and 180°.
Photonics 09 00182 g009
Figure 10. BER vs. MLSE tap number by transmitting 0.4, 0.6, 0.8, and 1 Gb/s Signal bitrate in harbor water of 10 m with transmit power of 24 dBm and 30° FOV.
Photonics 09 00182 g010
Figure 11. (a) 12 m transmission distance’s BER performance versus transmit power with OOK modulation in harbor water with 30° FOV. (b) 14 m transmission distance’s BER performance versus transmit power with OOK modulation in harbor water with 30° FOV.
Photonics 09 00182 g011
Figure 12. (a) 8 m transmission distance’s BER performance versus transmit power with PAM4 modulation in harbor water with 30° FOV. (b) 10 m transmission distance’s BER performance versus transmit power with PAM4 modulation in harbor water with 30° FOV.
Photonics 09 00182 g012
Figure 13. Required transmit power versus transmission distance with OOK modulation in harbor water with 30° FOV.
Photonics 09 00182 g013
Table 1. (a) Parameter settings for Monte Carlo simulation [14]. (b) Parameter settings for the noise model [34].
(a)
CoefficientValue
absorption coefficient a0.366 m−1
scattering coefficient b1.824 m−1
refractive index n1.33
PMT cumulative integration time td0.1 ns
radius of receive aperture R50 cm
asymmetry factor g0.9
photon number simulation108
various fields of view (FOV)30°
(b)
CoefficientValue
electronic bandwidth B20 GHz
quantum efficiency of the detector η0.8
wavelength of the source λ532 nm
the electron charge q1.6 × 10−19 coulombs
dark current Idc1.226 nA
equivalent temperature Te290 K
noise figure F4
load resistance RL100 Ω
Publisher’s Note: MDPI stays neutral with regard to jurisdictional claims in published maps and institutional affiliations.

