1. Introduction
Cholangiocellular cancer (CCC), which includes intrahepatic cholangiocarcinoma, extrahepatic cholangiocarcinoma, gallbladder cancer, and Vater ampulla cancer, are the most commonly diagnosed primary malignancies of the biliary tract, accounting for approximately 3% of all gastrointestinal malignancies [
1]. Epidemiological data showed the incidence and mortality from CCC have an upward trend worldwide [
2]. Although the listed cancers belong to the same category of CCC, each anatomical subgroup represents a unique cancer biology with different molecular characteristics and treatment options [
3]. Despite the fact that these types of tumors are considered rare, the incidence and mortality of CCC have increased over the past few decades [
4]. Radical resection is the main treatment for CCC, but most patients are diagnosed with inoperable, locally advanced, or metastatic disease [
5]. Although the development of more aggressive surgical approaches and techniques has increased the chances of improving the effectiveness of radical surgical resection, these patients remain at high risk of recurrence and new cancer formation [
6].
Through the continuous development and research of new medical technologies, fluorescence diagnostics (FD) and photodynamic therapy (PDT) have shown potential in the diagnosis and treatment of CCC [
7,
8]. Chlorin e6 is a well-known photosensitizer that is widely used for various malignant neoplasms. Noticeably, fluorescent diagnosis with chlorin e6 via an endoscopic video system has demonstrated an enhanced median of survival of patients diagnosed with head and neck cancer [
9]. The main principle of fluorescence diagnostics is the selective accumulation of a certain fluorescent marker in tumor cells. The higher the selectivity, the greater the ability to determine the boundaries of a pathological formation, and the more its radical removal can be carried out. At the same time, the analysis of fluorescence can be used as a method of monitoring the effectiveness of PDT. PDT is a minimally invasive therapy that includes a combination of three factors: a photosensitizer (PS), molecular oxygen, and light of a definite wavelength. The main principle of treatment is the creation of a photochemical reaction upon excitation of the PS accumulated in cancer cells, enriched in tumor tissue, using light of a certain wavelength to generate reactive oxygen species (ROS), such as excited singlet oxygen and superoxide negative radicals [
10,
11]. The death of cancer cells is caused by radiation of a certain wavelength due to the generation of ROS. During the photodynamic process, photosensitizer molecules become photobleached. In other words, the PS engaged in converting irradiating light in reactive oxygen able to kill cells undergoes in parallel a photo-oxidizing reaction making less or no fluorescent photoproducts. The photobleaching of the photosensitizer is controlled by the decrease in fluorescence signal. PDT, together with bile duct stenting, can improve bile duct patency by reducing local obstruction caused by malignant tissues due to the cytotoxic effects of ROS [
12]. The most effective and complete PDT treatment is demonstrated under the control of fluorescent diagnostics by photosensitizer photobleaching [
13,
14]. Today, in most cases, the use of PDT in the clinic is still carried out using a priori values of the dose of the drug and light without personalized control. Photobleaching of a photosensitizer during PDT is a fairly good parameter for measuring its effectiveness and can be assessed by fluorescence level, as has been shown for 5-ALA-induced PP IX [
15]. The photosensitizers of chlorine nature are also prone to photodegradation during PDT [
16]. The observed dependencies of the photosensitizer photodegradation on the light fluence make it possible to use it to determine the absorbed light dose. PDT was chosen by us for the treatment of cholangiocellular carcinoma as a result of the analysis of works in this area, which showed that chlorine-based photosensitizers are effective against these pathologies on cancer cell cultures [
17,
18] in addition to PDT with other types of photosensitizers [
19,
20].
Both spectroscopic and video-fluorescent methods are used to carry out FD with most cancers to conduct complete tumor destruction [
21,
22]. The video-fluorescent system simultaneously obtains the fluorescence signal and visible image of the pathological tissue in real time. However, the fluorescence index determines the relative quantity of accumulated PS in tumor tissue, which essentially facilitates the identification of the tumor localization and its boundaries. Fluorescent imaging has also demonstrated actual results for analysis of tumor growth and treatment response on cancer cells [
23]. However, using spectroscopic methods in the diagnosis of bile ducts tumors is not always informative, since the operating surgeon has to see from which tissue the fluorescent signal is received; therefore, in this case, it is more effective to use video-fluorescent methods for detecting tumors. Additionally, spectroscopic methods are not always convenient, since the fluorescent signal is obtained from a specific point, and video-fluorescence methods do not allow quantitative assessment of the signal. However, the approach proposed in this article solves both the problem of video navigation and the calculation of fluorescence indexes.
2. Materials and Methods
The LESA-01-BIOSPEC spectroscopic system (BIOSPEC LCC) was used as a spectrum analyzer, which consists of a personal computer with special software, a He-Ne laser with a generation wavelength at 632.8 nm and 5 mW/cm2 density power, a spectrometer, and a Y-shaped optical fiber. The fluorescence signal was obtained from the diffusely reflected signal from the research area.
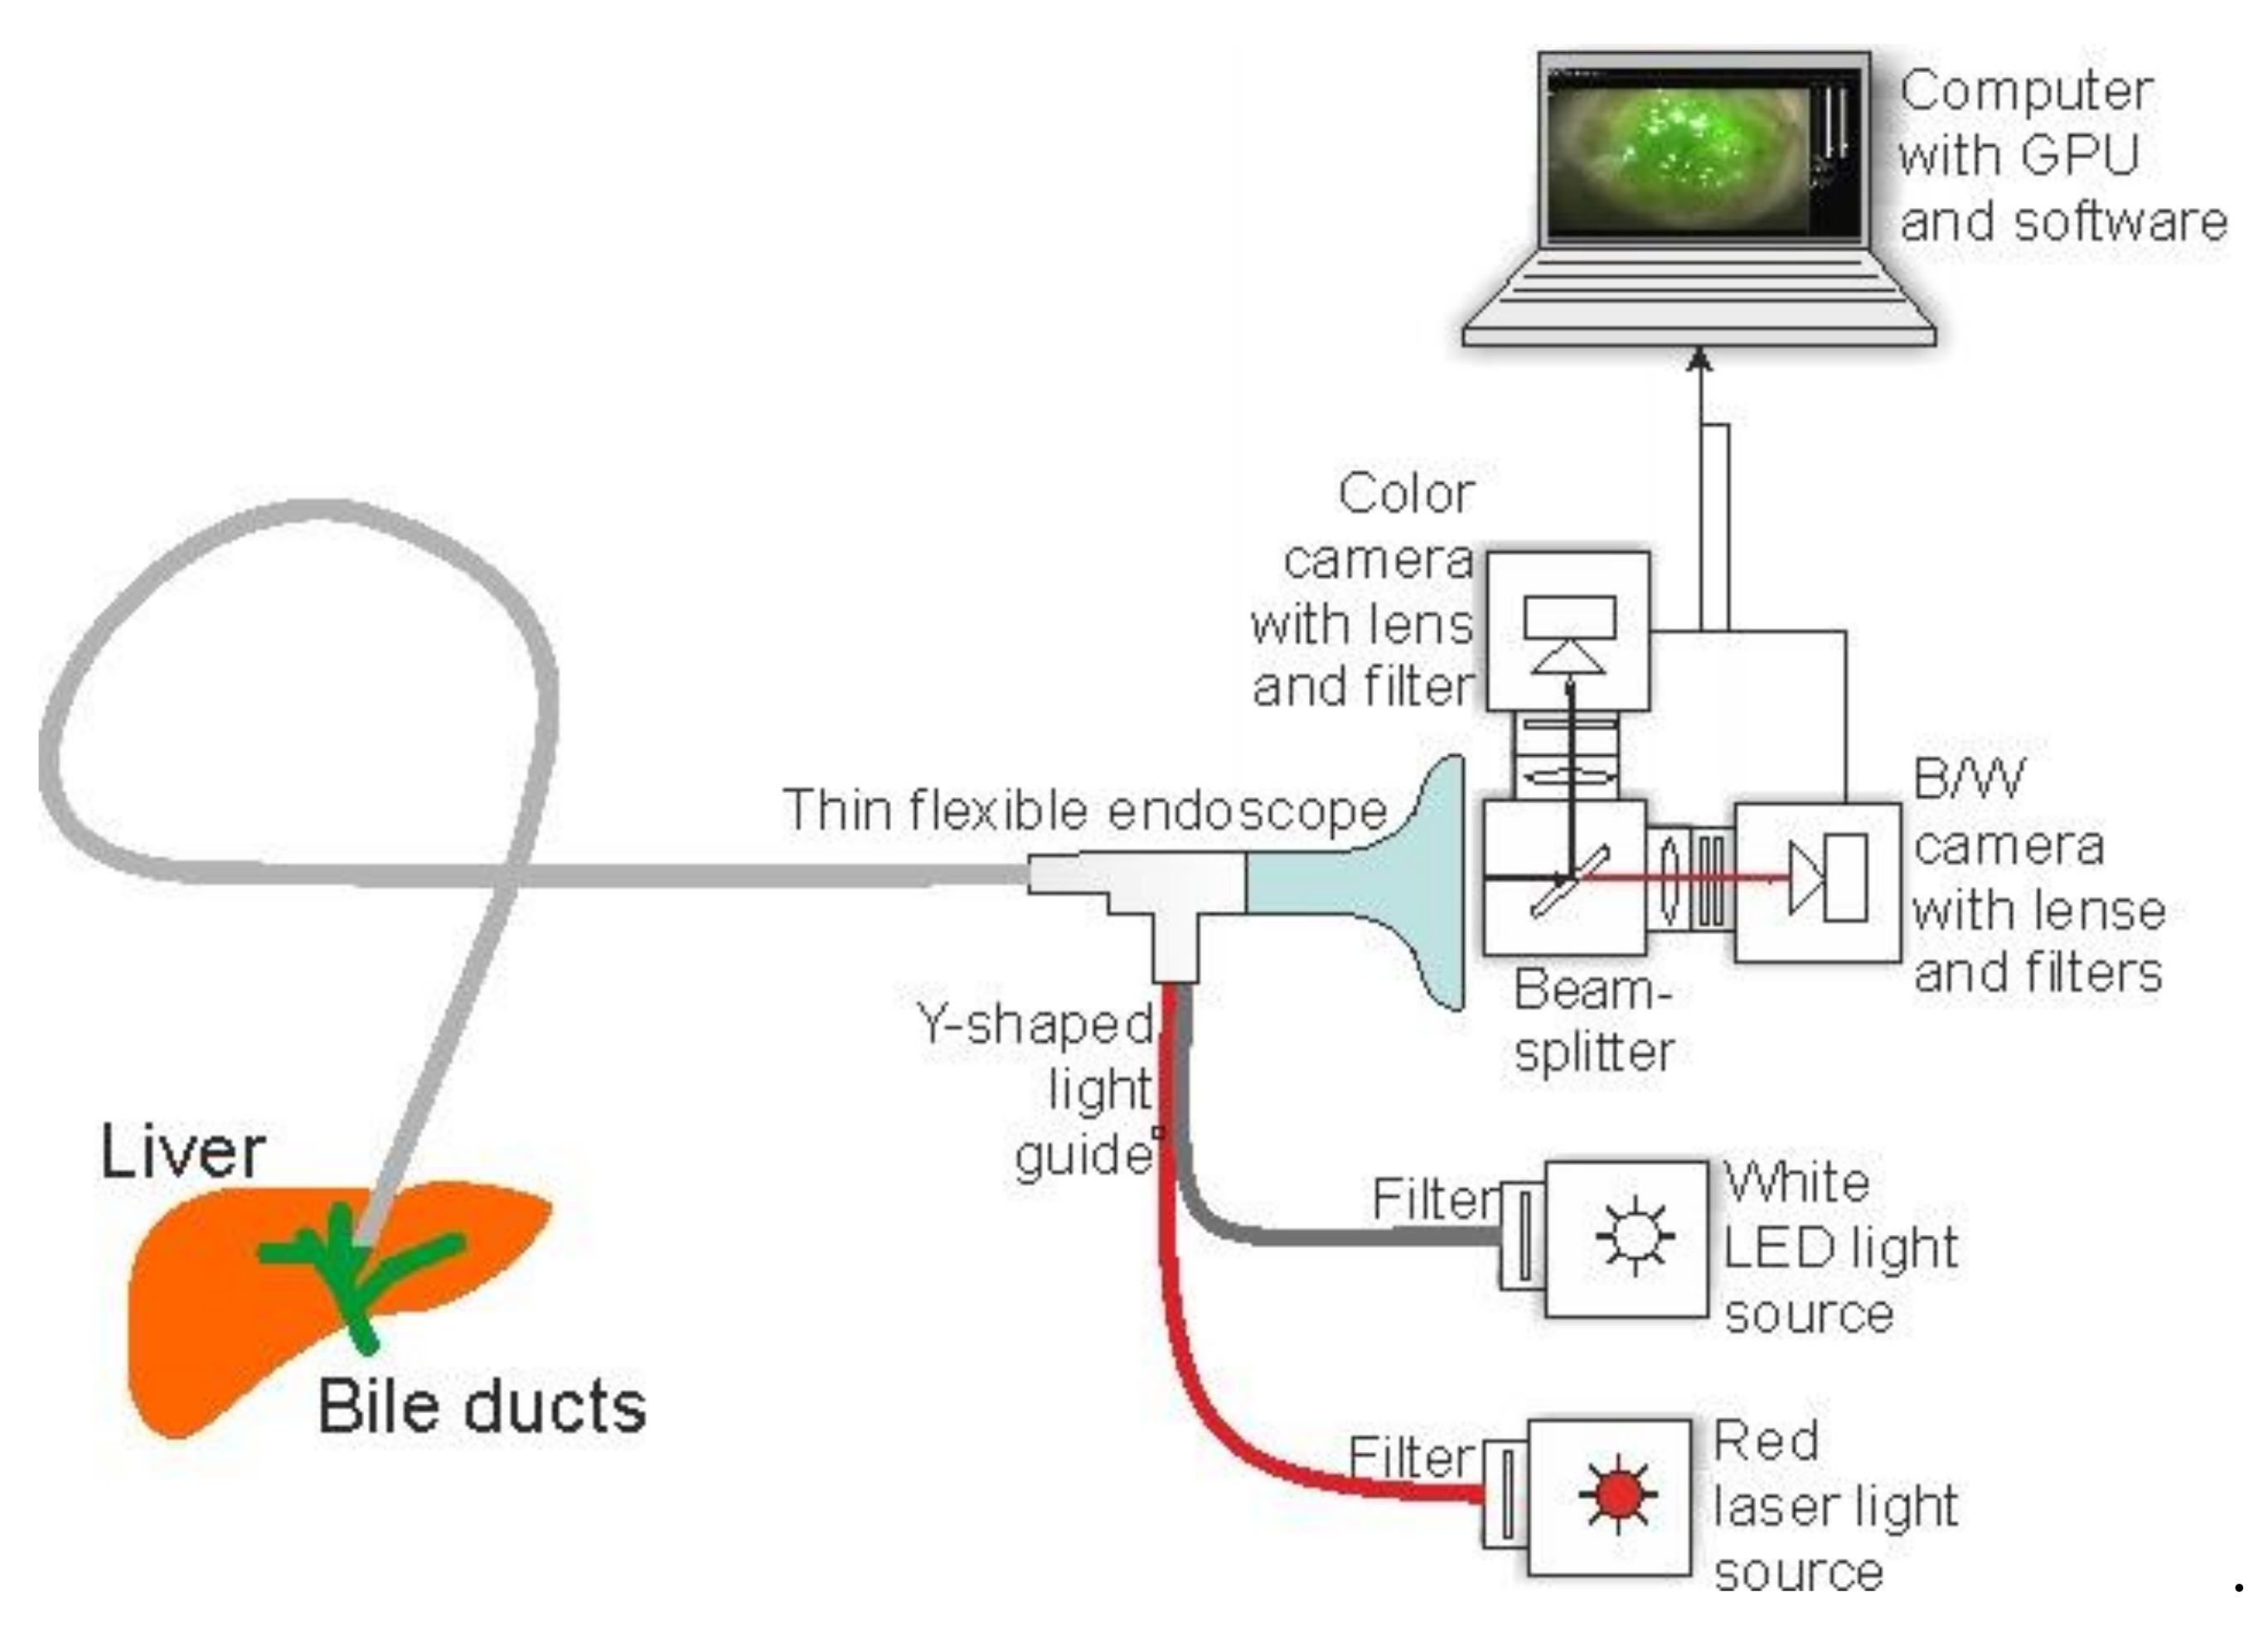
The UFF-630/675-01-BIOSPEC video-fluorescent system (BIOSPEC LCC) consists of a computer with special software, a camera unit that includes one monochrome camera necessary for recording fluorescence and a color camera necessary for visual navigation, an LED source with a generation wavelength at 635 nm, a broadband white light source, and a flexible endoscope for delivering light to the area under study and recording the backscattered signal. Light from a white light source and laser radiation pass through collimators and narrow-band filter to the optical inputs of the endoscope. A flexible endoscope with a rigid nozzle is used to deliver radiation to the study area and register diffusely reflected light. Diffuse reflected light is recorded by a registration unit consisting of two channels for detecting a fluorescent signal, each of which has an installed video camera. The light falls on a beam splitter with a separation boundary of 652 nm. The reflected light travels to a color camera with a filter transmitting light in the range of 400–625 nm. The visible light image obtained from the camera displays the patient’s organs in the usual color. Another part of the reflected light falls on a black-and-white camera with a light filter that transmits radiation in the range of 670–750 nm to register the fluorescence of chloride e6 photosensitizers. Special software was designed to display the information received from the cameras on the computer monitor. The image in fluorescent light in the far-red wavelength range of 670–750 nm, obtained with a black-and-white camera, is combined with an image obtained with a color camera by processing and adding. Thus, a fluorescent image obtained from a black-and-white camera is programmatically superimposed on an image obtained from a color camera. Next, the fluorescent image is stained in a pseudo color (usually it is green, since it provides more contrast from the color of biological tissue; moreover, the color of pseudo staining can be selected individually from the palette). A fluorescent image, the degree of accumulation of photosensitizers, and the size of a malignant neoplasm are displayed on the monitor. The fluorescent video recording system allows the simultaneous observation of the reflected and fluorescent images of the area under study and adjust the brightness and unevenness of the fluorescent radiation (
Figure 1).
The optical resolution of the endoscope is 0.5 mm with a 5 mW/cm2 power density at the outlet of the distal tip. During diagnostics, an interactive target (red point) is present on the monitor screen. When targeting different parts of the studied area, the fluorescence index corresponding to this area is calculated and displayed, which allows pinpointing pathological areas.
The study was carried out on 12 different patients diagnosed with bile duct cancer (BDC). Photodynamic therapy of CCC was performed for patients who had been denied surgical resection of the tumor. The group consisted of elderly patients aged 65 ± 11 years old with primary unresectable cholangiocellular cancer or somatically severe patients who were denied tumor resection either because of the presence of concomitant diseases or because of age, which increases the risk of such operations. Each patient was injected intravenously with a photosensitizer based on chlorin e6 with the commercial name Photolon BELMEDPREPARATY at a concentration of 1 mg/kg 2 h before FD and PDT. The advantage of this PS is the 2 h it takes to reach the maximum accumulation, as well as a fast period of elimination from the body (on average 48 h). During the post-treatment period, the patients were advised to limit exposure to light. At the maximum of PS accumulation, each patient underwent FD of the tumor area using the spectroscopic and video-fluorescent systems. FD was performed using a spectroscopic system and video-fluorescent equipment with minimally invasive surgery. A minimally invasive operation implies that at the beginning of the procedure, an introducer is installed percutaneously in the bile duct under the control of an X-ray system. Through an introducer, it is possible to deliver optical fibers for FD and PDT and a flexible endoscope to the study area, and flush the duct of the incoming bile, which strongly fluoresces and would interfere with the study. The optical fiber of the spectroscopic system was applied in effortless contact to the distal end of the tumor and nearby healthy normal tissue to obtain a fluorescent signal. The endoscope tip was headed into a bile duct and fixed at 0.5 cm distance from tumor neoplasm. Spectroscopic measurements and video-fluorescence measurements were obtained at the same tissue region. The diameter of the common bile duct is 6–8 mm, and based on this, the irradiated area was, on average, 350–500 mm2. The length of the distal end of the optical fiber, presented as a tip in the form of a diffuser, was 20 mm. Thus, one PDT session of a 20 mm long section of the bile duct averaged 8–12 min. If the tumor was more than 20 mm long, 2 or more PDT sessions were performed to irradiate the tumor along its entire length. If there was a complete block of the bile duct, PDT was first performed with an end fiber to reduce tumor tissue, then with a diffuser-type fiber to reduce the tumor diameter, followed by stenting of the bile duct. If there was an incomplete block of the bile duct, PDT was performed with a diffuser-type fiber to reduce the diameter of the tumor followed by stenting of the bile duct. The fluorescent diagnosis was carried out after every PDT session. The tumor tissue parts with intense PS signal were radiated again to achieve a photobleaching effect.
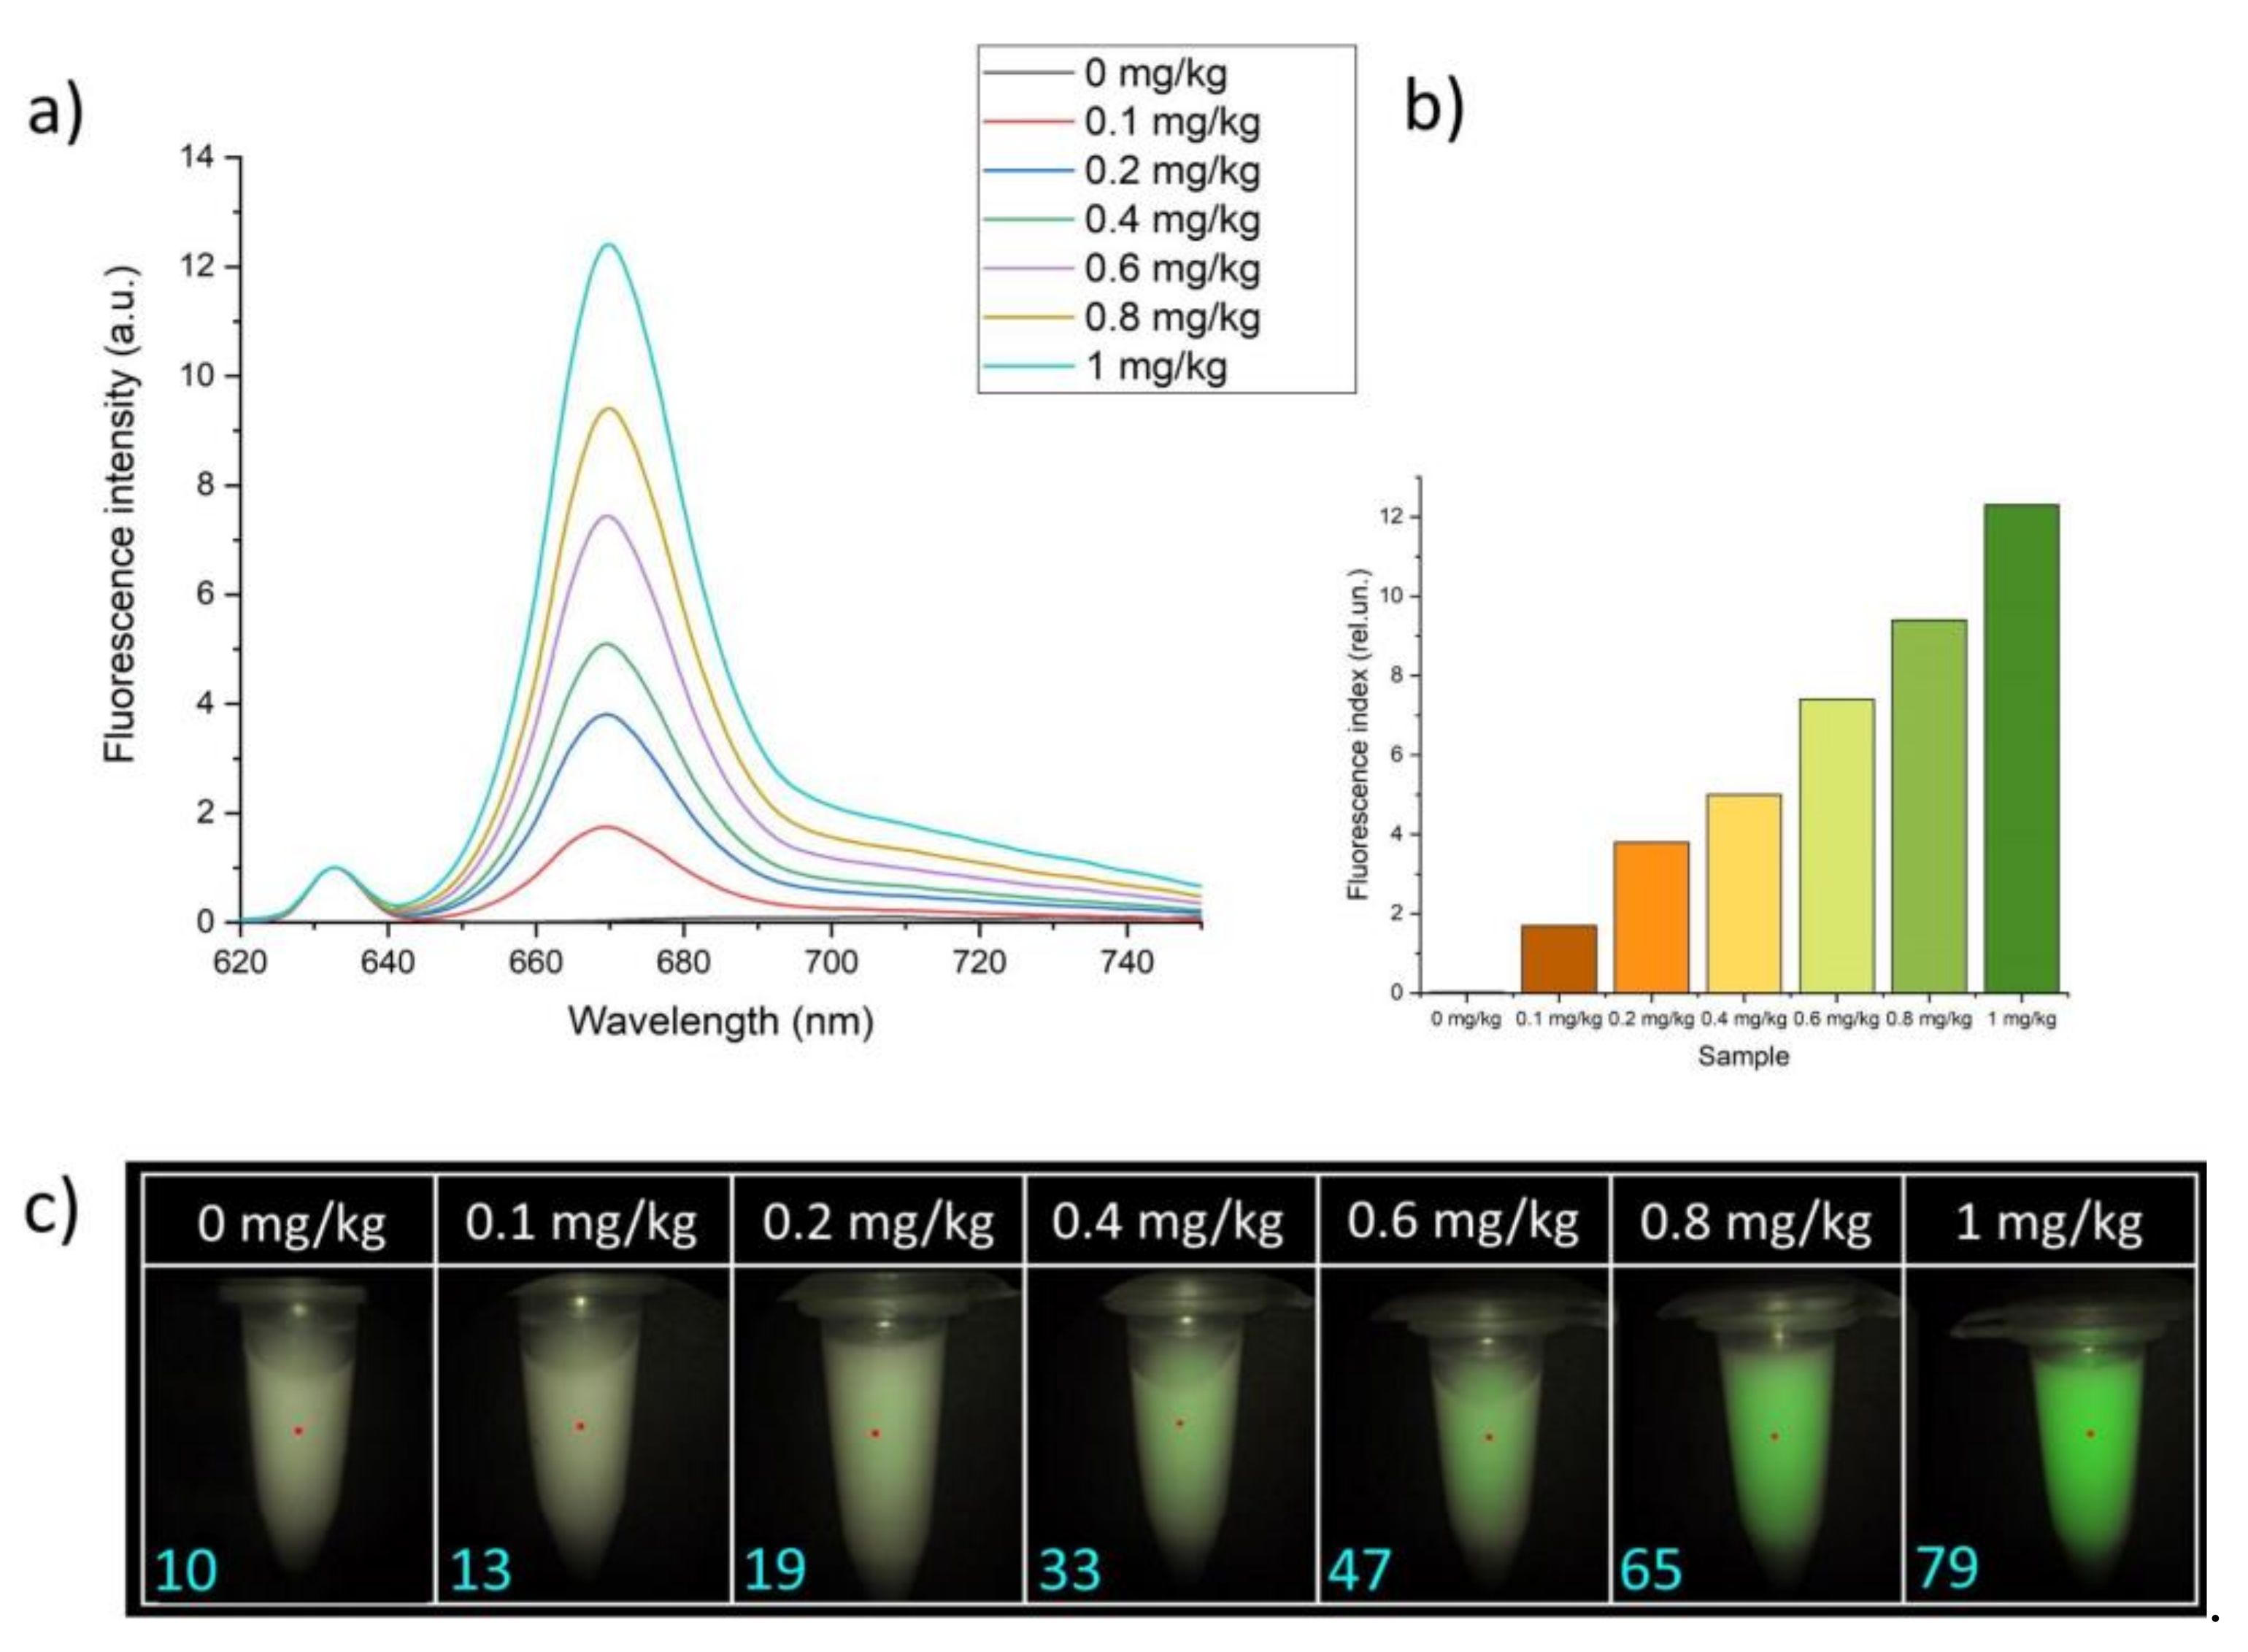
Biological phantom samples were used as experimental models, which consisted of a 1.8% fat emulsion of Intralipid Fresenius Kabi. This percentage was chosen for better representation of mucosa tissue optical properties. We prepared 1 mL of the phantoms in 1.5 mL Eppendorf tube. Each sample included a PS concentration of 0.1, 0.2, 0.4, 0.6, 0.8, or 1 mg/kg. For obtaining fluorescence signals, the optical fiber tip of the spectroscopic system was placed in effortless contact with the Eppendorf tube and the endoscope was fixed on a tripod for adjusting the operating distance between the video channel and the experimental sample.
A comparative analysis of the diagnostic methods was carried out using the methods of mathematical statistics. Pearson’s correlation coefficient was used to determine the linear relationship between spectroscopic and video-fluorescence methods; Student’s t-test was used to determine the difference between the mean values of the fluorescence index.
3. Results
3.1. Biological Models
An analysis was carried out on phantom samples that represented the parameters of scattering and absorption coefficients of biological tissue. Spectral fluorescence analysis was performed, and the fluorescence index was calculated for each sample (
Figure 2a,b). The fluorescence index was calculated as the ratio of the areas under the chlorin e6 spectral fluorescence curve to the spectral curve of back-reflected laser radiation, to exclude contribution of laser radiation. In addition, video-fluorescence analysis was performed for each model sample, which also included the calculation of the fluorescence index. To obtain the fluorescence index, the average pixel intensity of the image obtained from a monochrome video camera in the research area was calculated via the video system normalized to the parameters of a monochrome video camera. This value was normalized to the calculated average pixel intensity of the image of the red component of the color video camera of the area under study, then normalized to the parameters of the color video camera. The fluorescence generation wavelength was 635 nm. The combined mode was formed by superimposing a black-and-white fluorescent image on a color image. Green was chosen for pseudo-coloration of a fluorescent signal to enhance the contrast between the fluorescent areas of pathological tissue and healthy tissue; however, it is possible to change the color of the pseudo degradation to any other color (
Figure 2c).
3.2. Patients
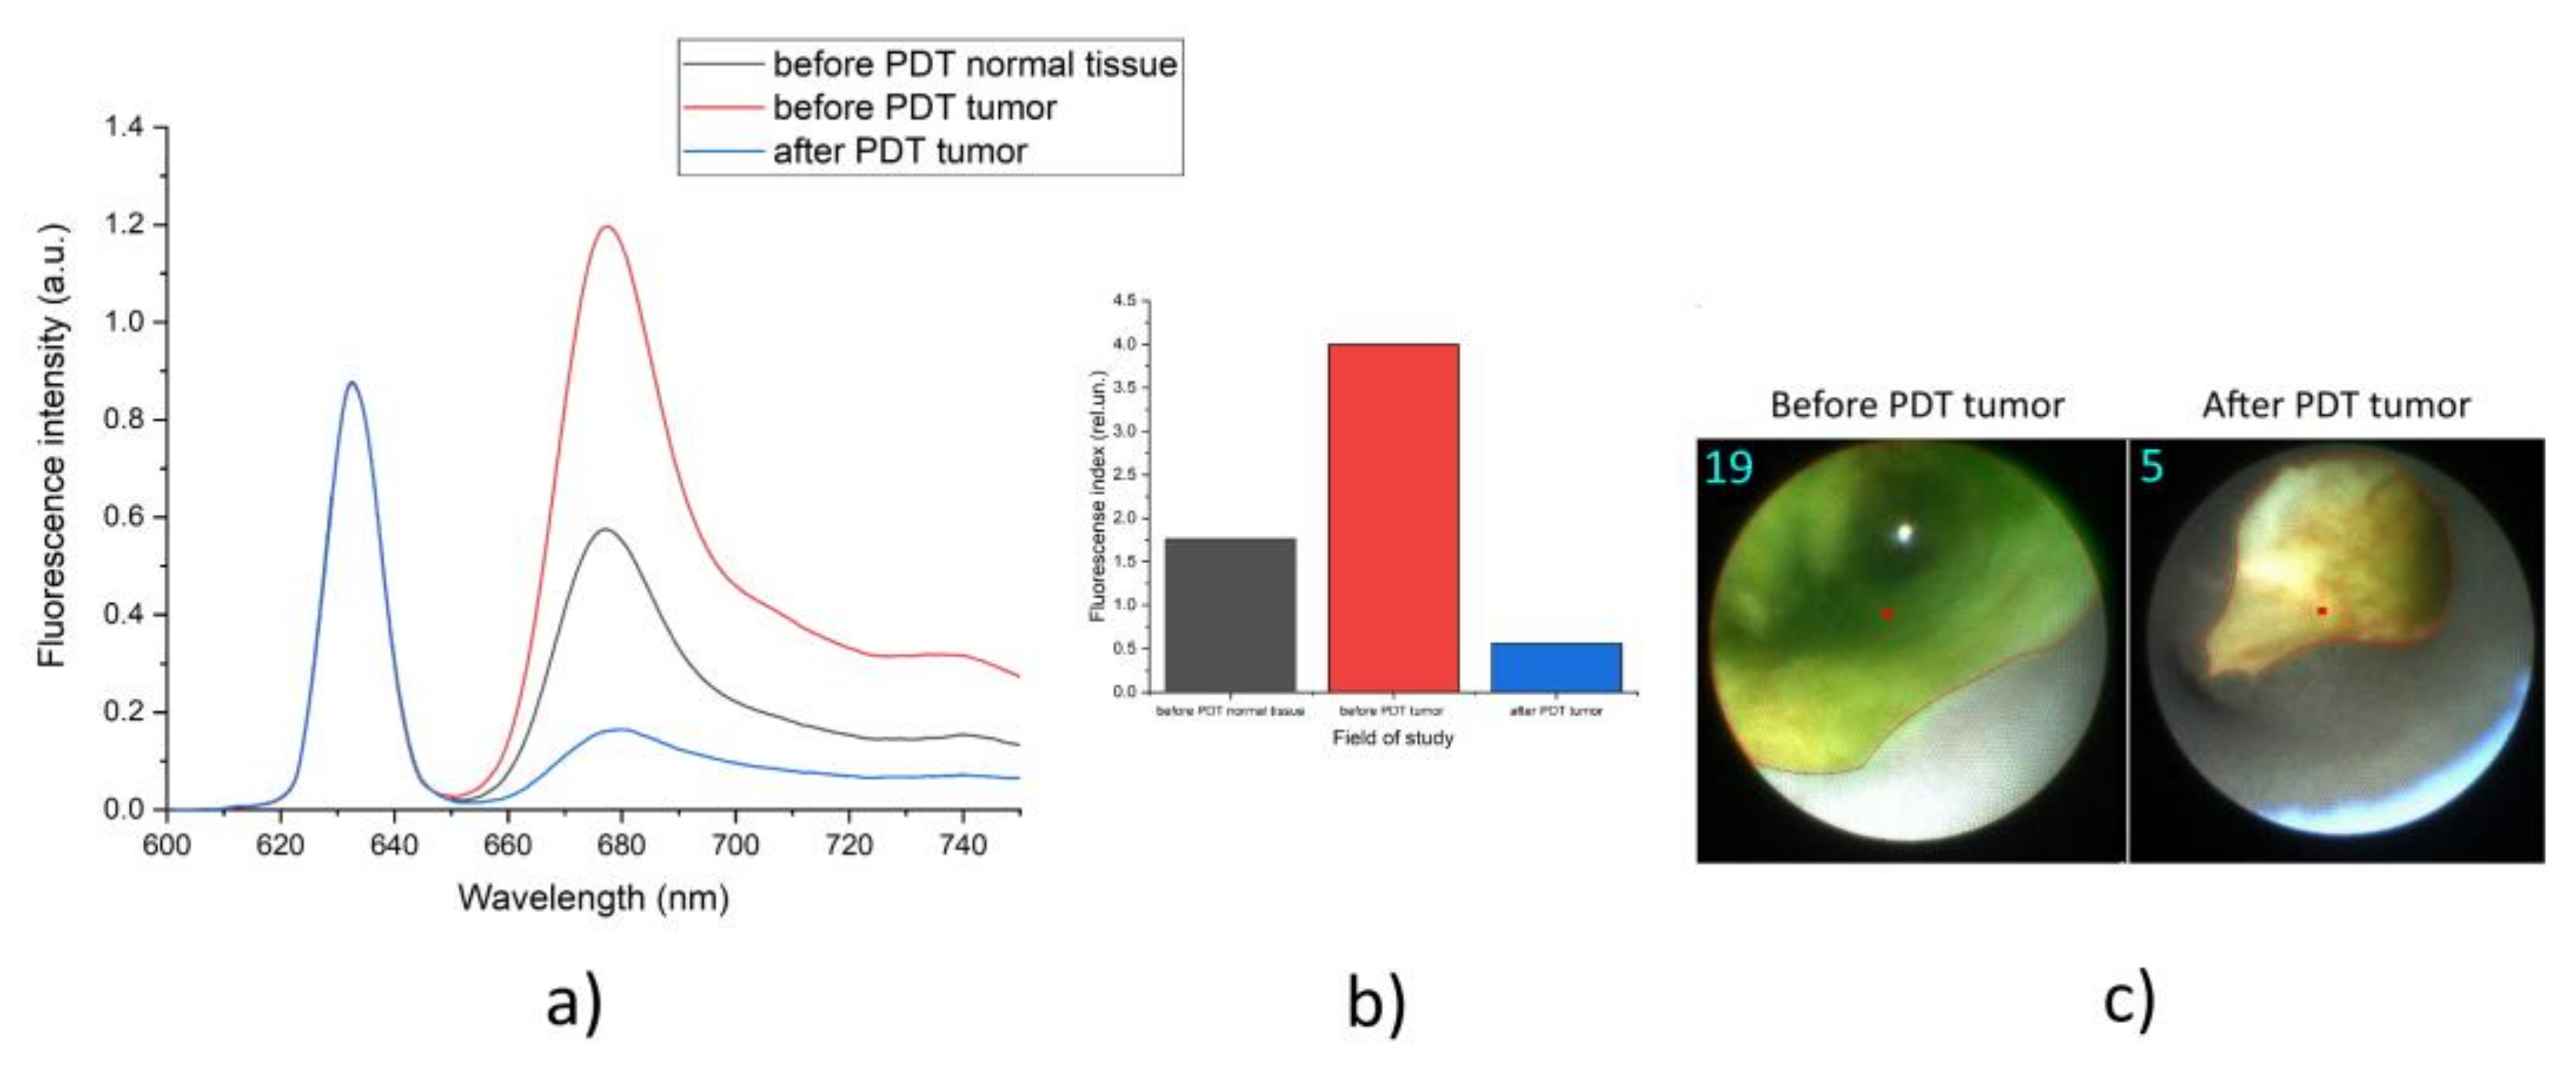
The fluorescence diagnosis of patients diagnosed with CCC was carried out before and after PDT via spectroscopic and video-fluorescent systems. PDT of a malignant neoplasm of the bile ducts was carried out with 100–200 J/cm
2. Spectral data and video-fluorescent images of the same localization were obtained from the study area in one of the patients (
Figure 3).
The numerical values of the fluorescence indexes of all patients before and after PDT were obtained (
Table 1). Both methods of obtaining data were used in each of the patients.
Statistical analysis of the results obtained by the spectroscopic system and the video-fluorescence system was carried out. The connection between the data on the concentration of the fluorophore, determined by two different methods, was assessed with correlation and regression analysis.
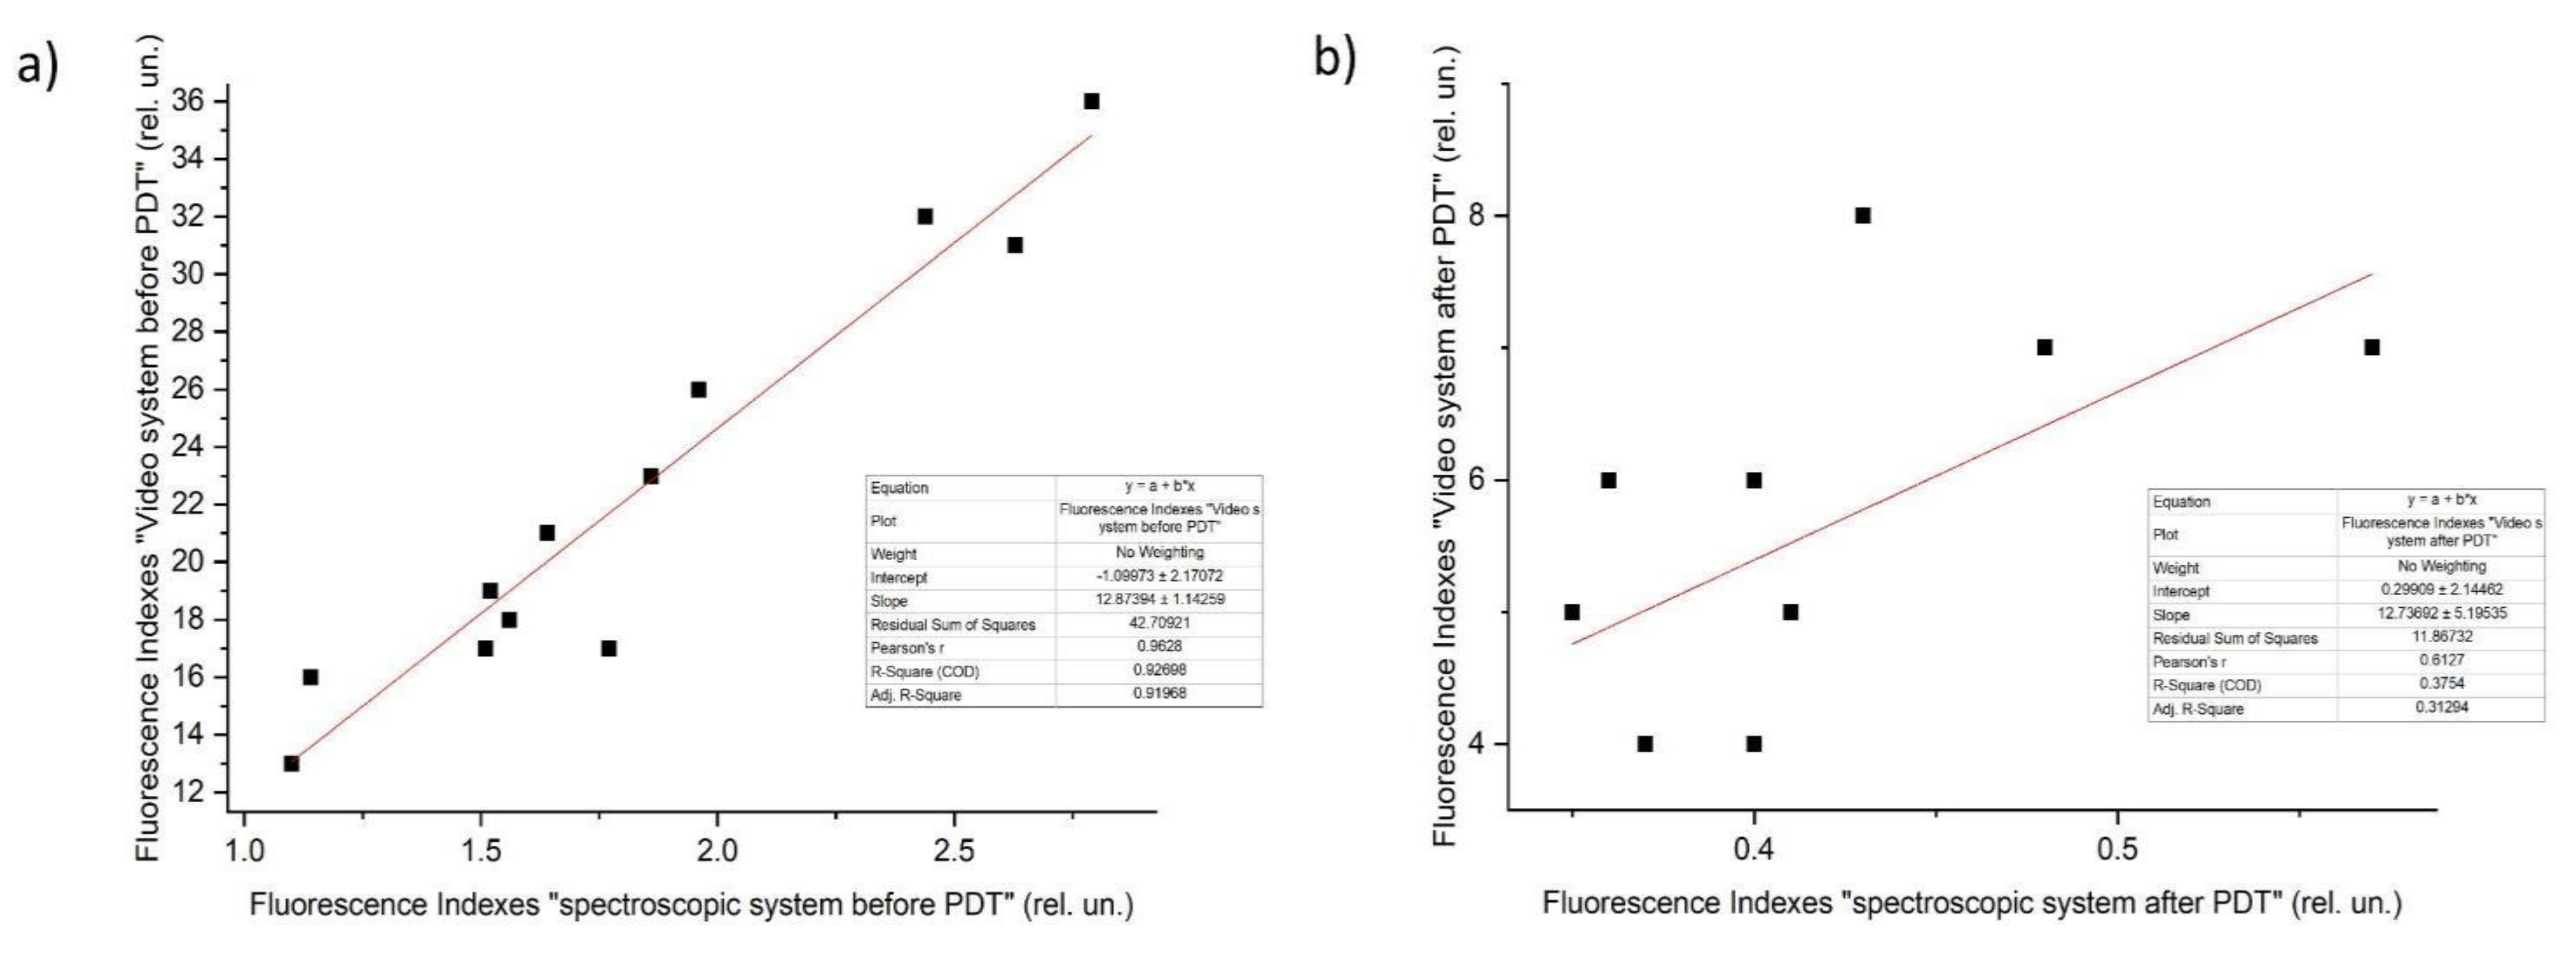
For the comparison before PDT between the video-fluorescence and the spectroscopic system, the Pearson’s coefficient was ~0.96. For the comparison after PDT between the video-fluorescent system and the spectroscopic system, the Pearson’s coefficient was ~0.61. We explain the decrease in the correlation coefficient between video and spectral data after PDT by the fact that PS burnout occurs unevenly, and the measurement of the fluorescence index of the video and spectral methods may not exactly coincide at the position of the sensor. At the same time, before the PDT procedure, the physiologically determined and more uniform distribution of PS provided a higher correlation coefficient between these two methods.
To assess the interchangeability of the data obtained from the spectroscopic system and the intraoperative fluorescent video system, regression analysis was used based on a linear regression equation:
where Y is the dependent variable, in this case serving as the values of the fluorescence index obtained using the video system; X is the independent variable, in this case represented by the integral values obtained using the spectroscopic system; a is the free term of the estimation line; and b is the slope showing how much Y increases as X increases. Using this method, regression lines were constructed for the values obtained from tumors at the maximum accumulation of chlorin e6 (
Figure 4).
After we assessed the correlation of the two types of fluorescence analysis considered, the next important step was to compare the ability of these methods to assess the effect of PDT.
To statistically evaluate the decrease in fluorescence indexes after PDT during diagnostics with the spectroscopic system, the paired Student’s t-test was applied. The obtained empirical value t = 9.2 is greater than the critical one (t0.01 = 3.01, t0.05 = 2.2); therefore, we concluded that there were statistically significant differences between the fluorescence intensity on before PDT with the spectroscopic system and after PDT with the spectroscopic system.
To statistically evaluate the decrease in the fluorescence indexes after PDT during diagnostics with the video-fluorescent system, the paired Student’s t-test was also used. The obtained empirical value t = 8.5 is greater than the critical one (t0.01 = 3.01, t0.05 = 2.2); therefore, we concluded that there were statistically significant differences between the fluorescence intensity before PDT with the video-fluorescent system and after PDT with the video-fluorescent system.
For each method of photobleaching assessment of the photosensitizer, a confidence interval was calculated. The average value of photobleaching for the spectroscopic system was 76% (with a 95% probability, the photobleaching observed by this method ranged from 72% to 80%), while the average value for the video-fluorescent system was 74% (with a probability of 95%, the photobleaching observed by this method ranged from 68% to 78%).
4. Discussion
The efficiency and completeness of the PDT procedure is enhanced under control of PDT before and after therapy. Spectroscopic estimates allow obtaining information about tumor tissue and its boundaries with high accuracy. Unfortunately, obtaining fluorescent information of BDC is not convenient due to complex navigation of the fiber distal tip into the bile duct and the absence of visualization to control malignant focus. The video-fluorescent system increases the efficiency of BDC fluorescent diagnosis and the completeness of PDT treatment. Visual navigation allows images of malignant neoplasm and its boundaries to be obtained with accumulated PS. The fluorescence index illustrates the numerical values of the relative PS concentration in tumor tissue.
Correlation analysis shows fluorescence index values obtained via the spectroscopic system are comparable to the fluorescent values of the video system. Analyzing all patients, Pearson’s coefficient is near one, which demonstrates similarity of obtained information. Consequently, the video system is highly beneficial both for visual determination of the localization of the tumor and its boundaries and for determining the value of the fluorescence index at a selected point. Student’s
t-test showed the optimal PS photobleaching results, which indicated the completeness of PDT. More than 60% PS photobleaching results are sufficient for destruction of cancer cells [
15,
24].
The key concept of the video-fluorescence system is the ability to perform fluorescent diagnostics of malignant neoplasms of the bile ducts containing a PS accumulated in the tumor in real time and to estimate the relative PS concentration near the tumor tissue. The system allows oncologists to intraoperatively see an image on the screen in the usual color gamut, or at least as close as possible to that.
5. Conclusions
The methods of fluorescence diagnostics considered in this article are promising in the field of oncological diseases treatment of the biliary tract and in the prevention of relapses. The obtained spectroscopic and video-fluorescent data, as well as their subsequent statistical processing, showed a direct correlation between these two diagnostic methods. The applied paired Student’s t-test showed a significant difference between the fluorescence indexes before and after PDT in both diagnostic methods, which indicated the efficiency of treatment by these methods. Therefore, these approaches allow considerable correlation of fluorescence signal of accumulated PS in cancer cells for successful identification of the tumor localization and its boundaries, which is necessary for complete tumor destruction and, as a consequence, relapse-free recovery of patients.
Author Contributions
Conceptualization, V.L. and A.S.; methodology, I.R.; software, M.L., M.A., C.D. and W.B.; validation, T.S. and M.L.; formal analysis, D.Y.; investigation, A.S.; resources, K.E.; data curation, D.F.; writing—original draft preparation, D.Y. and D.F.; writing—review and editing, D.Y. and D.F.; visualization, G.Z.; supervision, A.S.; project administration, V.L.; funding acquisition, V.L. All authors have read and agreed to the published version of the manuscript.
Funding
This research was funded by RFBR according to the research project No. 21-58-15005 and CNRS funding International Emerging Action IEA “CystoMos”.
Institutional Review Board Statement
The study was conducted according to the guidelines of the Declaration of Helsinki, and approved by the Ethics Committee of First Sechenov State Medical University, Ministry of Health of the Russian Federation (131, 17 September 2020).
Informed Consent Statement
All registered patients completed the informed consent form.
Conflicts of Interest
The authors declare no conflict of interest.
References
- Razumilava, N.; Gores, G.J. Cholangiocarcinoma. Lancet 2014, 383, 2168–2179. [Google Scholar] [CrossRef]
- Bridgewater, J.A.; Goodman, K.A.; Kalyan, A.; Mulcahy, M.F. Biliary Tract Cancer: Epidemiology, Radiotherapy, and Molecular Profiling. Am. Soc. Clin. Oncol. Educ. 2016, 35, 194–203. [Google Scholar] [CrossRef] [PubMed]
- Rizvi, S.; Khan, S.A.; Hallemeier, C.L.; Kelley, R.K.; Gores, G.J. Cholangiocarcinoma—Evolving concepts and therapeutic strategies. Nat. Rev. Clin. Oncol. 2018, 15, 95–111. [Google Scholar] [CrossRef] [PubMed]
- Saha, S.K.; Zhu, A.X.; Fuchs, C.S.; Brooks, G.A. Forty-year trends in cholangiocarcinoma incidence in the US: Intrahepatic disease on the rise. Oncologist 2016, 21, 594–599. [Google Scholar] [CrossRef]
- Forner, A.; Vidili, G.; Rengo, M.; Bujanda, L.; Ponz-Sarvisé, M.; Lamarca, A. Clinical presentation, diagnosis and staging of cholangiocarcinoma. Liver Int. 2019, 39, 98–107. [Google Scholar] [CrossRef]
- Brandi, G.; Rizzo, A.; Dall’Olio, F.G.; Ercolani, G.; Cescon, M.; Frega, G.; Tavolari, S.; Palloni, A.; De Lorenzo, S.; Abbati, F.; et al. Percutaneous radiofrequency ablation in intrahepatic cholangiocarcinoma: A retrospective single-center experience. Int. J. Hyperth. 2020, 37, 479–485. [Google Scholar] [CrossRef]
- Benson, A.B.; D’Angelica, M.I.; Abrams, T.A.; Are, C.; Bloomston, P.M.; Chang, D.T.; Clary, B.M.; Covey, A.M.; Ensminger, W.D.; Lyer, R.; et al. Hepatobiliary Cancers, Version 2. J. Natl. Compr. Cancer Netw. 2014, 12, 1152–1182. [Google Scholar] [CrossRef]
- Yakovlev, D.V.; Farrakhova, D.S.; Shiryaev, A.A.; Efendiev, K.T.; Loshchenov, M.V.; Amirkhanova, L.M.; Kornev, D.O.; Levkin, V.V.; Reshetov, I.V.; Loschenov, V.B. New approaches to diagnostics and treatment of cholangiocellular cancer based on photonics methods. Front. Optoelectron. 2020, 13, 352–359. [Google Scholar] [CrossRef]
- Farrakhova, D.; Shiryaev, A.; Yakovlev, D.; Efendiev, K.; Maklygina, Y.; Borodkin, A.; Loshchenov, M.V.; Bezdetnaya, L.; Ryabova, A.; Amirkhanova, L.M.; et al. Trials of a fluorescent endoscopic video system for diagnosis and treatment of the head and neck cancer. J. Clin. Med. 2019, 8, 2229. [Google Scholar] [CrossRef]
- Zhang, Z.J.; Wang, K.P.; Mo, J.G.; Xiong, L.; Wen, Y. Photodynamic Therapy Regulates Fate of Cancer Stem Cells through Reactive Oxygen Species. World J. Stem Cells 2020, 12, 562–584. [Google Scholar] [CrossRef]
- Loschenov, V.B.; Konov, V.I.; Prokhorov, A.M. Photodynamic therapy and fluorescence diagnostics. Laser Phys. Lawrence 2000, 10, 1188–1207. [Google Scholar]
- Li, Z.; Jiang, X.; Xiao, H.; Chen, S.; Zhu, W.; Lu, H.; Cao, L.; Xue, P.; Li, H.; Zhang, D. Long-term Results of ERCP- or PTCS-Directed Photodynamic Therapy for Unresectable Hilar Cholangiocarcinoma. Surg. Endosc. 2020, 35, 5655–5664. [Google Scholar] [CrossRef] [PubMed]
- James, N.S.; Cheruku, R.R.; Missert, J.R.; Sunar, U.; Pandey, R.K. Measurement of cyanine dye photobleaching in photosensitizer cyanine dye conjugates could help in optimizing light dosimetry for improved photodynamic therapy of cancer. Molecules 2018, 23, 1842. [Google Scholar] [CrossRef] [PubMed]
- Maliszewska, I.; Wanarska, E.; Thompson, A.C.; Samuel, I.D.; Matczyszyn, K. Biogenic Gold Nanoparticles Decrease Methylene Blue Photobleaching and Enhance Antimicrobial Photodynamic Therapy. Molecules 2021, 26, 623. [Google Scholar] [CrossRef] [PubMed]
- Pogue, B.W.; Elliott, J.T.; Kanick, S.C.; Davis, S.C.; Samkoe, K.S.; Maytin, E.V.; Pereira, S.P.; Hasan, T. Revisiting photodynamic therapy dosimetry: Reductionist & surrogate approaches to facilitate clinical success. Phys. Med. Biol. 2016, 61, R57. [Google Scholar]
- Ferreira, J.; Menezes, P.F.C.; Kurachi, C.; Sibata, C.; Allison, R.R.; Bagnato, V.S. Photostability of different chlorine photosensitizers. Laser Phys. Lett. 2007, 5, 156. [Google Scholar] [CrossRef]
- Murakami, G.; Nanashima, A.; Nonaka, T.; Tominaga, T.; Wakata, K.; Sumida, Y.; Akashi, H.; Okazaki, S.; Kataoka, H.; Nagayasu, T. Photodynamic Therapy Using Novel Glucose-conjugated Chlorin Increases Apoptosis of Cholangiocellular Carcinoma in Comparison with Talaporfin Sodium. Anticancer Res. 2016, 36, 4493–4501. [Google Scholar] [CrossRef]
- He, C.; Xia, J.; Gao, Y.; Chen, Z.; Wan, X. Chlorin A-mediated photodynamic therapy induced apoptosis in human cholangiocarcinoma cells via impaired autophagy flux. Am. J. Transl. Res. 2020, 12, 5080–5094. [Google Scholar]
- Schmidt, J.; Kuzyniak, W.; Berkholz, J.; Steinemann, G.; Ogbodu, R.; Hoffmann, B.; Nouailles, G.; Gürek, A.G.; Nitzsche, B.; Höpfner, M. Novel zinc- and silicon-phthalocyanines as photosensitizers for photodynamic therapy of cholangiocarcinoma. Int. J. Mol. Med. 2018, 42, 534–546. [Google Scholar] [CrossRef]
- Kim, D.H.; Im, B.N.; Hwang, H.S.; Na, K. Gemcitabine-loaded DSPE-PEG-PheoA liposome as a photomediated immune modulator for cholangiocarcinoma treatment. Biomaterials 2018, 183, 139–150. [Google Scholar] [CrossRef]
- Kustov, D.M.; Kozlikina, E.I.; Efendiev, K.T.; Loshchenov, M.V.; Grachev, P.V.; Maklygina, Y.S.; Trifonov, I.S.; Baranov, A.V.; Stranadko, E.F.; Panchenkov, D.N.; et al. Laser-induced fluorescent visualization and photodynamic therapy in surgical treatment of glial brain tumors. Biomed. Opt. Express 2021, 12, 1761–1773. [Google Scholar] [CrossRef] [PubMed]
- Lee, Y.J.; Krishnan, G.; Nishio, N.; van den Berg, N.S.; Lu, G.; Martin, B.A.; van Keulen, S.; Colevas, A.D.; Kapoor, S.; Liu, J.T.C.; et al. Intraoperative Fluorescence-Guided Surgery in Head and Neck Squamous Cell Carcinoma. Laryngoscope 2021, 131, 529–534. [Google Scholar] [CrossRef] [PubMed]
- Celli, J.P.; Rizvi, I.; Evans, C.L.; Abu-Yousif, A.O.; Hasan, T. Quantitative imaging reveals heterogeneous growth dynamics and treatment-dependent residual tumor distributions in a three-dimensional ovarian cancer model. J. Biomed. Opt. 2010, 15, 051603. [Google Scholar] [CrossRef] [PubMed][Green Version]
- Zheng, Q.; Jockusch, S.; Zhou, Z.; Blanchard, S.C. The contribution of reactive oxygen species to the photobleaching of organic fluorophores. Photochem. Photobiol. 2014, 90, 448–454. [Google Scholar] [CrossRef] [PubMed]
| Publisher’s Note: MDPI stays neutral with regard to jurisdictional claims in published maps and institutional affiliations. |
© 2022 by the authors. Licensee MDPI, Basel, Switzerland. This article is an open access article distributed under the terms and conditions of the Creative Commons Attribution (CC BY) license (https://creativecommons.org/licenses/by/4.0/).

 ,
, 


