Abstract
Simulation and experimental performance analyses of simultaneous up-converted signals, for the first time, were investigated utilizing a semiconductor optical amplifier Mach–Zehnder interferometer (SOA-MZI) sampling mixer in co- and counter-directions for standard and differential modulation modes. An optical pulse source at a sampling frequency of fs = 15.6 GHz was used as a sampling signal. The IF signal channels carrying quadrature phase shift keying (QPSK) data at frequencies fm were up-converted at different mixing frequencies up to 195.5 GHz. Using the Virtual Photonics Inc. (VPI) simulator, we realized mixed QPSK signals and studied their characteristics through a conversion gain and an error vector magnitude (EVM). Simulations of up mixing operated in a frequency range up to 158 GHz. For the standard modulation in the co-direction, the conversion gain decreased from 43.3 dB at the mixing frequency of 16.6 GHz to 21.8 dB at 157 GHz for the first channel and from 43 dB at 17.6 GHz to 21 dB at 158 GHz for the second channel. The use of the differential modulation principle improved the conversion gain by about 10 dB at 195.5 GHz compared to standard modulations in co- and counter-directions. The EVM reached, respectively, 15.5 and 17.5% for the differential modulation in both configurations, at the bit rate of 100 Gbit/s at 195.5 GHz. The benefit provided by the differential modulation was that EVM values were shifted by 20% for all channels in both configurations at 100 Gbit/s. In the real measurement, we confirmed that co-directional conversion exhibited a better performance than the counter-directional operation. In addition, the real mixed signal exhibited lower efficiency and quality in comparison with simulated signals due to the sensitivity of the receiver.
1. Introduction
A huge variety of applications are emerging in the millimeter-wave (mm-wave) and terahertz (THz) parts of the electromagnetic spectrum. Ultra-wideband communications have received attention because of the potential for extremely high bit rates over a short distance [1,2]. Besides, photo-mixing devices have been successfully developed to produce considerable power levels at frequencies up to 1.5 THz [3,4,5].
Furthermore, radio over fiber (RoF) systems used to send radio frequency (RF) signals via optical fiber have enticed a significant attention. These systems offer several advantages, such as low loss transmission, low weight, wide bandwidth, and immunity to electromagnetic interference compared to an all-electrical transmission. There is a variety of RoF applications, such as: cellular communications, satellite communications, wireless fidelity (WiFi), and radar systems [6].
Some mixing techniques include photonic signal frequency up conversion, which shifts a signal from an intermediate frequency (IF) to a RF domain. There are different schemes of these techniques to achieve frequency mixing based on different optical mixers such as the electro-optic modulator (EOM) [7,8], the electro-absorption modulator (EAM) [9] based on the cross-absorption modulation (XAM) [10], and the nonlinear photo-detection [11,12]. These mixing techniques offer features including a wider bandwidth than the technique utilizing an electric mixer. Moreover, various architectures of mixing exploit the nonlinear effects in a semiconductor optical amplifier (SOA), such as cross-gain modulation (XGM) [13,14], four-wave mixing (FWM) [15,16] or cross-phase modulation (XPM). The XPM effect is exploited within a SOA-MZI (SOA Mach–Zehnder interferometer) for up-conversion [17,18], and up and down conversions for full-duplex applications [19]. Sampling techniques [20,21] based on a sampling signal driven by an optical pulse source can be used in electronic or optical digital systems for frequency mixing [22,23,24,25]. Furthermore, several techniques are used to implement a RoF system for increasing the channel capacity of a single-mode fiber (SMF) [8,26,27].
Recently, a similar SOA-MZI-based system by all-optical sampling for a signal channel [22] reported conversion gains for multiple mixing frequencies. Specifically, a signal at 0.5 GHz was up-converted at mixing frequencies between 8.3 GHz related to the first harmonic of the optical pulse source, and 39.5 GHz related to the fifth one. The conversion gain achieved in this range of frequencies was reduced from 15.5 to 13.4 dB. During our previous work in [22,23,24,25], the maximum frequency range that corresponded to the highest mixing frequency of the up-converted signals was obtained up to 39.5 GHz. In other studies, the maximum frequency range was observed up to 60 GHz without the use of the sampling technique. However, the latest studies did not achieve a good performance of the system.
In this manuscript, we study and compare a pioneering mixing operation of two channels by using two principles called standard and differential modulation modes in co- and counter-direction configurations based a SOA-MZI sampling mixer. Besides, we present the frequency up-conversion of two IF channels that carry QPSK data at 1 GHz (channel 1) and 2 GHz (channel 2) to an optical radio frequency (RF) signal that exhibits the mixing frequencies , where is the harmonics order and is the IF channel index, at the output of the SOA-MZI photonic mixer. It is worth noting that we used four architectures (cases) that are standard modulation in co-direction, standard modulation in counter-direction, differential modulation in co-direction, and differential modulation in counter-direction. Then, for the second part of simulations, we also managed to simultaneously up-convert ten IF signals ranging from 0.2 to 2 GHz in the four different cases. The proposed up-conversion architecture utilizing a SOA-MZI showed features such as broad bandwidth, capability of simultaneous conversion, and high conversion gain. In addition, simulation results of two or ten simultaneous up-converted signals by all-optical sampling are achieved through conversion gains and error vector magnitudes (EVMs) for the first time through the Virtual Photonics Inc. (VPI) [28] simulator in order to evaluate the efficiency and quality of this optical transmission system.
The benefits of this work are, the highest, to our knowledge, frequency range used, up to 158 GHz, EVM simulations at the bit rate up to 100 Gbit/s, and positive conversion gains, which were achieved at the SOA-MZI output in the four cases. Furthermore, the differential modulation principle improved considerably the quality of the sampled signal at the SOA-MZI output by maintaining the same level of its replicas. In that case, we could simultaneously up-convert more channels at the SOA-MZI output and study their quality. This work can be used in many applications, such as ultra-wideband communications, millimeter-wave and microwave applications, wireless access applications [29], and satellite communications. The implementation of the principle of the differential modulation provides fundamental features such as higher optical amplification, wider bandwidth, and higher conversion efficiency compared to the standard modulation. On the other hand, the experimental work for simultaneous ten channels up-converted at the SOA-MZI output confirms the results obtained by simulations and showing that the co-direction configuration exhibited higher performance than the counter-direction one.
The remainder of the paper is arranged as follows. In Section 2, we describe the principle of operation for the standard and differential modulation modes. In Section 3, the conditions of the conducted simulations are analyzed and simulation setups are given for all cases. Then, the simulation results for the simultaneous frequency mixing are achieved by showing four electrical spectrums for different cases and then the conversion gain is obtained in order to assess the optical transmission system. In Section 4, frequency mixing of complex-modulated QPSK data by using the four cases against the EVM are presented. Besides, the real measurements are obtained in Section 5 and compared with the simulation work. Finally, in Section 6, the conclusions reached through this work are given.
2. Principle of Standard and Differential Modulation Modes
SOA-MZI is a mature optical device. The optical sampling is performed by using the XPM effect in a SOA-MZI used as an optical switch. SOA-MZIs possess some attractive features of low power requirements, compactness, high extinction ratios [30,31], and noise reduction [32]. In addition, the possibility of using the same experimental setup based on the SOA-MZI [22] to implement up- and down-conversions makes the scheme a very versatile choice. The large data bandwidth is fundamentally related to the carrier lifetime of SOAs [33].
The architecture of the real SOA-MZI used in simulations by the VPI simulator is given in Figure 1 and Figure 2, which is already proposed in our previously published work [34,35]. One SOA was located in each arm of the MZI. The phase shifters located in the upper and lower arms helped to provide a phase optimization for both output arms. With this SOA-MZI structure, the input signals traveled in the same direction, as seen in Figure 1, but they may travel in the counter-direction, as displayed in Figure 2, since the SOAs can be operated bi-directionally.
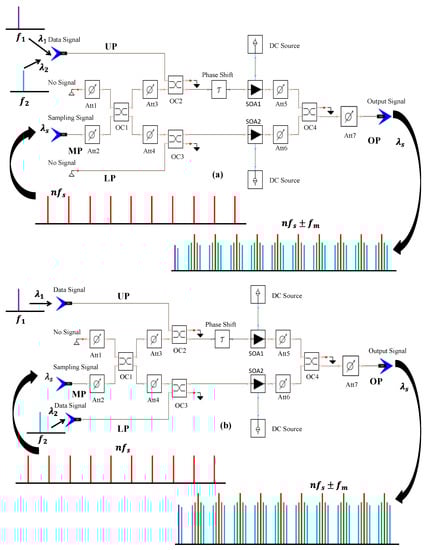
Figure 1.
SOA-MZI in the co-direction configuration. Att: Attenuator, OC: Optical Coupler, MP: Middle Port, OP: Output Port, UP: Upper Port, and LP: Lower Port. (a) Standard modulation mode, (b) Differential modulation mode.
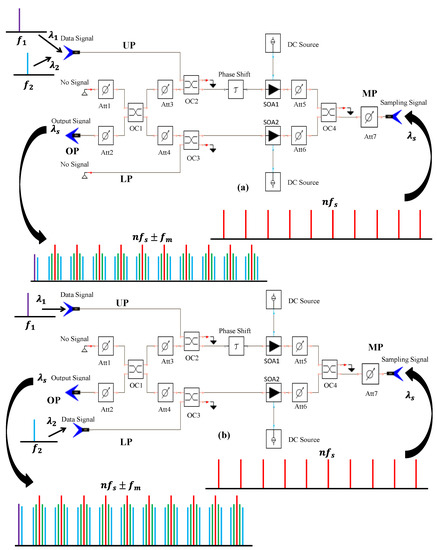
Figure 2.
SOA-MZI in the counter-direction configuration. (a) Standard modulation mode, (b) Differential modulation mode.
Figure 1a explains the principle of operation for the standard modulation. The sampling signal with a sampling frequency at the wavelength is separated into two identical copies at the middle port (MP) to the upper and lower arms. Besides, the two data signals at carrier frequencies are simultaneously injected at the upper port (UP), where ranges from 1 to 2. In this case, any data signal causes a phase shift in the upper copy of the sampling signal. This results in a continuous variation of the amplified sampling signal that appears at the upper and lower outputs, i.e., in a modulation of the sampling signal by the data signal. Hence, the sampled signal at the SOA-MZI output after filtering at was replicated from to mixing frequencies , where ranges from 1 to 10. It is worth noting that if sundry ten IF signals are injected at the same time at UP, we can obtain the same results with many up-converted signals at , where , in this case, ranges from one to ten.
The proposed differential modulation, which is a pioneering work to the best of our expertise, is depending on a XPM of two input optical signals in the MZI built using SOAs as shown in Figure 1b. In this architecture, the first data signal at the frequency at the UP is injected into the upper arm and the second data signal at at the LP is entered at the lower arm. As the principle of the standard modulation, the same sampling signal that corresponds to ultra-short clock pulses is coupled into the MP of the MZI and split into the upper and lower arms simultaneously by using an optical coupler (OC). These signals modulate the gain of both SOAs where their carrier densities and refractive indexes are modulated. In addition, the sampling signal in the upper arm is modulated by the first data signal and the same signal is modulated by the second data signal in the lower arm. The presence of the data signal affects the phase of the sampling signal due to the XPM.
Then, a phase shift occurs on the sampling signal in the upper arm as the standard modulation. However, another phase shift appears on the same signal in the lower arm. Thus, this causes a phase modulation of the sampling signal propagating in both SOAs according to the input signals. At the SOA-MZI output port (OP), the signal from both SOAs interfered in order to obtain the mixed signal. This signal was considerably improved compared to the one in the standard modulation due to the enhanced amplified sampling signal in both arms that preserves the same harmonic power whatever the harmonic rank is. As we can display from the electrical spectrum of the mixed signal achieved after filtering at , the data signals were up-converted from to . The differential modulation solved two main issues together: the enhancement of mixed signals and up-conversion process of a number of simultaneous IF signals at the SOA-MZI output.
For the counter-direction in Figure 2, we interchanged between the signals at the OP and the MP in comparison with the co-direction. The operation of both principles of standard and differential modulation modes possessed the same function as the co-direction. The results at the SOA-MZI output showed that the sampled signal at diminished slightly in comparison with the co-direction for both modes.
It is worth noting that all the physical parameters of the SOAs in the SOA-MZI are the same for Figure 1 and Figure 2. Besides, the most significant SOA parameters are shown in Table 1. The structure of the real SOA-MZI used to obtain a frequency conversion to higher frequencies by all-optical sampling is illustrated in Figure 1 and Figure 2, while its static and dynamic characteristics are studied in order to identify the best operating point used in the up-conversion process. The nominal operating point was chosen as follows: the bias currents of SOA1 and SOA2 were both biased at 350 mA and the phase shifters were controlled in order to obtain the minimum optical power at the SOA-MZI output.

Table 1.
The SOAs parameter values used in the simulation setups.
Table 1 lists the parameter values of SOA-MZI used in our simulations for the conversion gain and EVM results. The differential carrier lifetime was estimated by measuring the SOA-MZI bandwidth (cutoff frequency) using a pump–probe technique. Besides, we observed that the conversion gain was related to the carrier lifetime τ, which depends on the SOA physical properties. Additionally, for a given SOA-MZI, and τ were interdependent and associated to its operating condition. Therefore, the effect of each critical SOA-MZI parameter depended on the exact operating point of the SOA-MZI. As a result, , τ, and the bias currents of the SOAs were chosen in order to obtain the best operating point of the SOA-MZI. This leads to the better quality of the mixed signal at the SOA-MZI output as well as the optical transmission system.
The theoretical study of the frequency up-conversion function based on single SOA-MZI has already been studied in [36] for the switching architecture in co-propagating direction. In our work, we were only interested in the equation of the optical power obtained at the SOA-MZI output, while its derivation was demonstrated in detail in [36]. The optical modulation power at the output port (OP) of the SOA-MZI at mixing frequencies can be written as:
where
is the differential carrier lifetime,
is the attentaion coefficient of ,
is the SOA1 gain,
is the optical input modulation power at a frequency
is the optical power of the sampling signal,
is the electrical power at ,
0.8 A/W is the responsitivity of the PIN photodiode,
33 dB is the gain of the low noise amplifier,
50 Ω is the load resistance of the photodetector.
The operating point has been chosen to maximize the contrast ratio (CR), which is given by the ratio between high and low transmissions of the optical power at the SOA-MZI output. The data signal possessed a mean optical power of −12 dBm at 1545 nm (i.e., 194.17 THz) is injected into the SOA-MZI UP. The sampling signal with various optical powers ranging from 40 to 6 dBm was injected at the MP. The wavelength of the sampling signal was 1550 nm (i.e., 193.54 THz). The Figure 3 shows the SOA-MZI static characteristic with a maximum CR 37 dB for the co-direction and CR 35 dB for the counter-one. Hence, the maximum transmitted powers of the data signal at the SOA-MZI output were achieved at the peak powers of 1 and 3 dBm for co- and counter-directions, respectively.
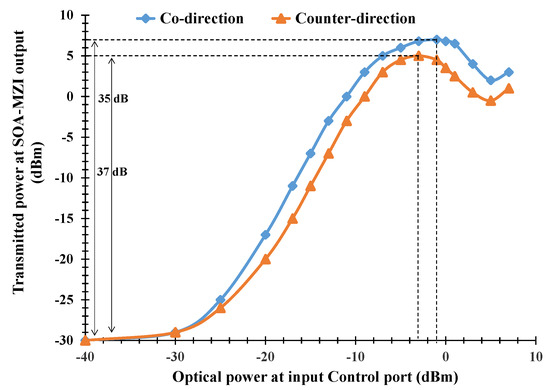
Figure 3.
Static characteristic of the SOA-MZI that represents the transmitted power at the SOA-MZI out as a function of the input optical power at SOA-MZI MP. The contrast ratio (CR) equal to 37 dB is achieved for the co-direction schema and CR equal to 35 dB is achieved for the counter-direction one.
The dynamic behavior of the SOA-MZI depends on the carrier lifetime and the stimulated carrier recombination time [37]. Both SOAs are biased at the bias current of 350 mA. An optical power of −12 dBm at the wavelength of 1545 nm is injected at the UP and an intensity-modulated optical power of 1 dBm for the co-direction schema and 3 dBm for the counter-direction one at 1550 nm was injected at the MP. At the SOA-MZI output, the modulated optical data signal was photo-detected by a photodiode (PD) and amplified by a low noise amplifier (LNA). The frequency response of the used SOA-MZI in Figure 4 shows a low-pass behavior with an8.5 GHz cutoff frequency for the co-direction schema and 8.3 GHz for the counter-direction one.
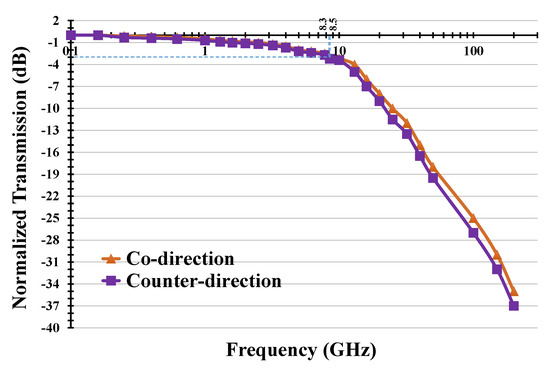
Figure 4.
Dynamic characteristic of the SOA-MZI with the bandwidth of 8.5 GHz for the co-direction and 8.3 GHz for the counter-direction.
3. Conversion Gain Results
Simulation setups of simultaneous all-optical up-conversion of two IF signals are shown in Figure 5 and Figure 6. In this work, two IF signals (IF1 and IF2) are used to evaluate simultaneous up-conversion at the SOA-MZI output. The first laser source (LS1) producing a continuous wave (CW) signal (IF1 signal) at the wavelength 1545 nm was intensity-modulated by the first Mach–Zehnder Modulator (MZM1) driven by an electrical subcarrier carrying QPSK (quadrature phase shift keying) data at IF1 freqyency 1 GHz. Besides, the second laser source (LS2) producing a CW signal (IF2 signal) at = 1546 nm was intensity-modulated by the second (MZM2) driven by an electrical subcarrier carrying QPSK data at 2 GHz. The generation and detection module at the electrical port of the MZMs was used to generate the QPSK data. For the standard modulation mode in co- and counter-directions, as displayed in Figure 5a and Figure 6b, the IF1 and IF2 signals were combined by the first optical coupler (OC1) and injected at the upper port (UP) of the SOA-MZI. In co- and counter-directions for the differential modulation, the IF1 signal was injected at the UP and the IF2 signal at the lower port (LP), as seen in Figure 5 and Figure 6b.
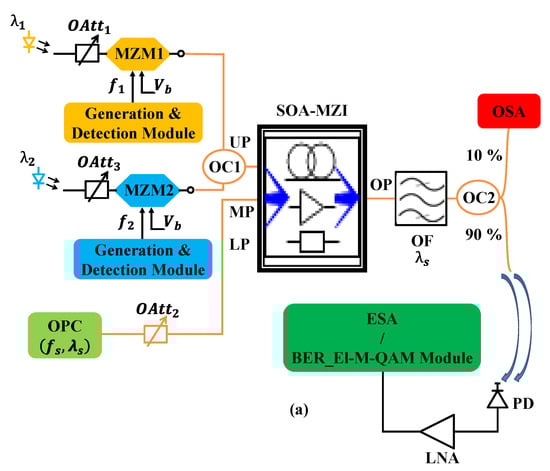
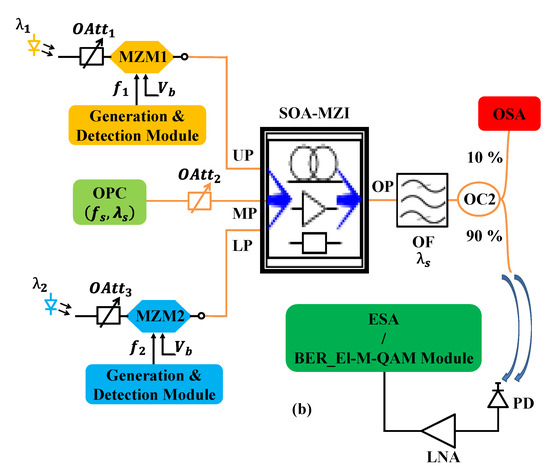
Figure 5.
Block diagram of the simulation setup of QPSK frequency mixing for co-direction configuration. OAtt: Optical Attenuator, OF: Optical Filter, LNA: Low-Noise Amplifier, MZM: Mach–Zehnder Modulator, OC: Optical Coupler, BER: Bit Error Rate, QAM: Quadrature Amplitude Modulation, PD: Photodiode, and : Bias voltage. (a) Standard modulation mode, (b) Differential modulation mode.
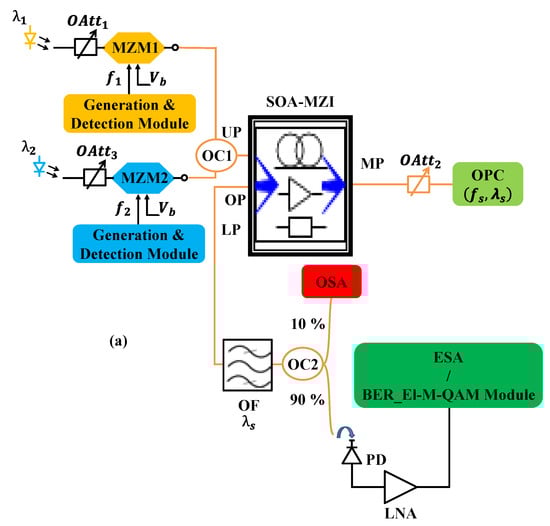
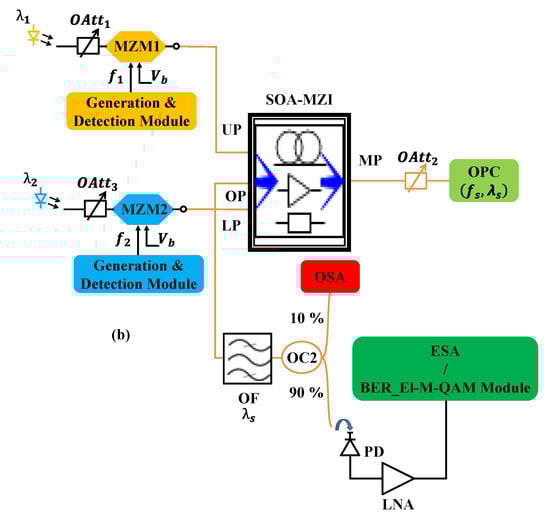
Figure 6.
Block diagram of the simulation setup of frequency mixing for counter-direction schema. (a) Standard modulation mode, (b) Differential modulation mode.
The sampling signal at a repetition rate of 15.6 GHz was generated by an optical pulse source (OPC) [22] that exhibited a wavelength of 1550 nm. Its electrical spectrum showed harmonics at . The signal was an input to the middle port (MP) of the SOA-MZI using different optical signal mode fibers. The position of this signal was exchangeable, as given in Figure 5 and Figure 6. In order to make frequency up-conversion, the average optical sampling power was adjusted to approximately 1 dBm in the co-direction schema and 3 dBm in the counter-direction one (Figure 3) by using the second optical attenuator OAtt2.
In [22], the sampling frequency is chosen to be 7.8 GHz, which is close to the cutoff frequency of the SOA-MZI. The increase of the sampling frequency from 7.8 to 19.5 GHz improves the quality and the efficiency of the optical transmission system based on an SOA-MZI as explained in [25]. As a result, by representing the theorem of Nyquist Shannon on the sampling frequency to avoid any aliasing on the sampled signals, the selected sampling frequency 27.8 15.6 GHz, where the electrical spectrum of the sampling signal that exhibits harmonics ranging from up to , can also lead to the better system characteristics.
At the SOA-MZI output, the optical filter (OF) is tuned at 1550 nm. The sampled signal is photo-detected with the 200 GHz photodiode (PD) with a responsivity of 0.85 A/W and amplified by a 33 dB-gain low-noise amplifier (LNA) and displayed on an electrical spectrum analyzer (ESA) to obtain mixing spectrums or used the BER_EL-M-QAM module to demodulate QPSK data and find its EVM. The used PD is called uni-traveling carrier (UTC) PDs that are high-power and high-linearity PDs. Besides, they are demonstrated in an upsurge of applications, such as RoF, mm-wave, production of low phase noise microwave signals, and antenna link systems based on optical fibers [4,38,39]. Furthermore, UTC-PDs can be used for frequency mixing for higher frequency range up to 300 GHz.
The simulations were carried out by using a VPI Transmission Maker [28]. The two optical carriers injected at the UP for the standard modulation and at UP and LP for the differential modulation were intensity modulated by a sinewave signal at the frequencies 1 GHz for the IF1 signal and 2 GHz for the IF2 signal. In both cases, the mean optical power of each optical carrier was 12 dBm. The electrical power of the corresponding photo-detected signal was 35.8 dBm for the IF1 signal and 36.4 dBm for the IF2 one. The peak power of the sampling signal was adjusted to be 1 dBm in the co-direction and 3 dBm in the counter-direction at the MP. The sampled signal at the SOA-MZI output was optically filtered at before being photodetected, amplified and displayed on an ESA.
In order to validate the principle of the standard and differential modulations in the co- and counter-directions, we presented the electrical spectrum of the sampled signals at the SOA-MZI output, modulated at 1 GHz and 2 GHz. These spectrums are shown in Figure 7 and Figure 8 for the standard and differential modulations in the co-direction, respectively, and in Figure 9 and Figure 10 for the both modes in the counter-direction, respectively. Regarding this, we can compare the mixed signals in order to observe the electrical powers of mixed signals for the four cases and compute the conversion gain.
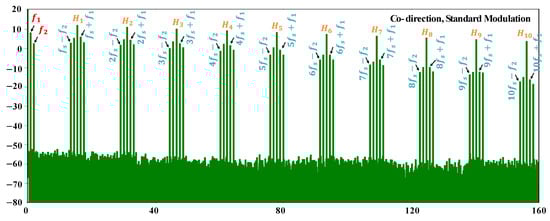
Figure 7.
Electrical spectrum of the up-converted signal, which represents the electrical power in dBm as a function of frequency in GHz, at mixing frequencies at the SOA-MZI output for the standard modulation mode in the co-direction. The frequencies of the two input signals are 1 GHz and 2 GHz, the sampling frequency is 15.6 GHz and the harmonics of the sampling signal at .
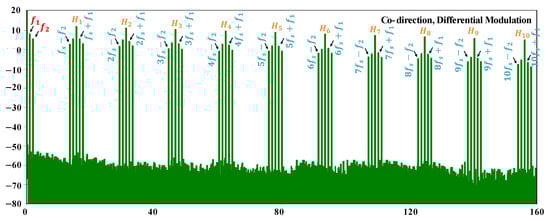
Figure 8.
Electrical spectrum of the up-converted signal, which represents the electrical power in dBm as a function of frequency in GHz, at at the SOA-MZI output for the differential modulation in the co-direction. The frequencies of the two input signals are 1 GHz and 2 GHz, the sampling frequency is 15.6 GHz and the harmonics of the sampling signal at .
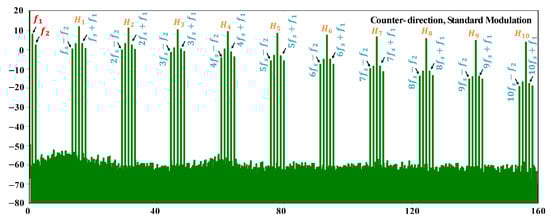
Figure 9.
Electrical spectrum of the up-converted signal, which represents the electrical power in dBm as a function of frequency in GHz, at at the SOA-MZI output for the standard modulation in the counter-direction. The frequencies of the two input signals are 1 GHz and 2 GHz, the sampling frequency is 15.6 GHz and the harmonics of the sampling signal at .
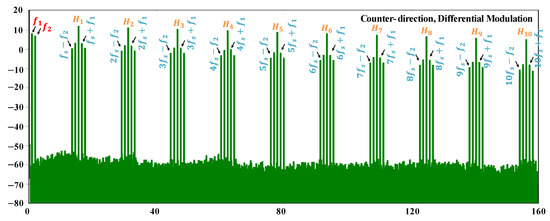
Figure 10.
Electrical spectrum of the up-converted signal, which represents the electrical power in dBm as a function of frequency in GHz, at at the SOA-MZI output for the differential modulation in the counter-direction. The frequencies of the two input signals are 1 GHz and 2 GHz, the sampling frequency is 15.6 GHz and the harmonics of the sampling signal at .
It is observed that the input signals were up-converted at mixing frequencies related to channel one and related to channel two for both configurations. The harmonics power of the sampling signal transposed at 1550 nm showed that high frequencies contain close amplified power compared to the low ones, regardless of the SOA-MZI low-pass behavior for the four cases. The difference between the tenth and the first harmonic was only 7 dB for the standard and differential modulation in the co-direction, while it was 9 dB for both cases in the counter-direction.
For the differential modulation, the up-converted signals were amplified considerably at the higher mixing frequencies compared to the ones for the standard modulation in co- and counter-directions. The mixed signals are attenuated with an average value of 2 dB in the case of counter-direction compared to the ones for the co-direction for the whole mixing frequencies. In all cases, we can observe that the up-converted signals involve up to the tenth harmonic of the sampling signal. Hence, the highest frequency range in this case becomes 158 GHz, which is the highest mixing frequency.
In conclusion, the use of the principle of the differential modulation in both directions enhanced the characteristics of the mixed signals. This may lead to bolstering the quality of the optical transmission system. It is important to highlight that we could obtain a frequency mixing at the higher frequency range for the differential modulation compared to the standard one. In order to fairly compare between them, the electrical spectrums of the mixed signals were stopped at the mixing frequency of GHz for the four cases.
To describe the efficiency of the frequency up-conversion process, it is convenient to define the conversion efficiency as the ratio of the electrical power of the mixed signals at mixing frequencies at the SOA-MZI output to the one of an input IF signal computed at the IF frequencies for the standard and differential modulations in co- and counter-directions.
As seen in Figure 11, the IF1 signal at at the data input is up-converted at at the SOA-MZI output. For the standard modulation in the co-direction, the conversion gain obtained at , shown in Figure 11 decreases from 43.3 dB at 16.6 GHz related to the first harmonic of the sampling signal to 21.8 dB at 157 GHz related to the tenth harmonic . Besides, the use of the principle of the differential modulation improved the conversion gain considerably at higher mixing frequencies, which reached 31.8 dB at 157 GHz for the differential modulation, while it was 21.8 dB at the same frequency for the standard one.
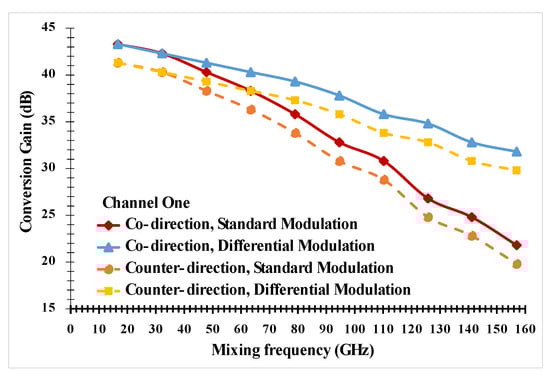
Figure 11.
Up-conversion gain at different mixing frequencies for the standard and differential modulation modes in the co- and counter-directions. The IF1 signal at 1 GHz is up-converted at .
We should also mention that the conversion gain attenuated 2 dB over the entire mixing frequencies for both modes in the counter-direction due to its lower cut off frequency compared to the ones in the co-direction. Additionally, positive conversion gains were obtained for all mixing frequencies in all cases due to the gains of the SOAs in SOA-MZIs and the mixing frequency that was related to the harmonics of the sampling signal, which possess close amplitudes. Because of the SOA-MZI low pass behavior, the conversion gain degraded a lot at the high mixing frequencies. Regardless of that, the modulation principle for the differential mode played a role in amplifying the electrical power at the high mixing frequencies. In reality, it was difficult to obtain the same harmonic power or the same replica power due to the low pass behavior of the SOA-MZI.
For up-converted signals at at the SOA-MZI output, the conversion gain obtained at , seen in Figure 12, showed the same behavior as the one related to the sampled signal at . However, the conversion gain of the sampled signal related to the channel two for the four cases degraded more than the one related to the channel one. This discrepancy is linked to different amplifications of both subcarriers at and due to the SOAs: the gain difference between the low frequency subcarrier at 1 GHz and the one at 2 GHz was about 3 dB for both configurations. It is worth noting that the range of mixing frequency was not the same for both up-converted signals. As seen in Figure 12, conversion gain decreased from 43 dB at 17.6 GHz to 21 dB at 158 for the standard modulation mode in the co-direction. In addition, it also decreased from 41 dB at 17.6 GHz to 19 dB at 158 GHz for the same mode in the counter-one. Moreover, for differential modulation in co- and counter-directions, the conversion gain improved 10 dB at the highest mixing frequency compared to the standard modulation in both directions.
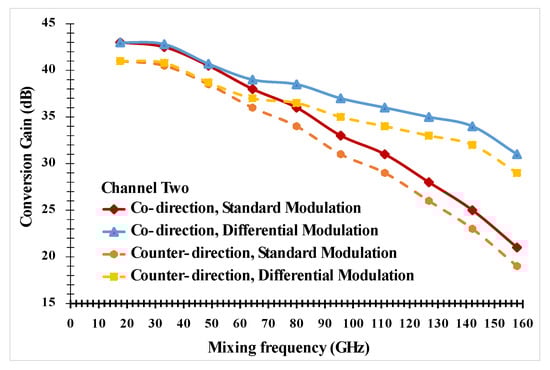
Figure 12.
Up-conversion gain at different mixing frequencies for the standard and differential modulation modes in the co- and counter-directions. The IF2 signal at 2 GHz is up-converted at .
As a result, we could obtain an up-conversion process in co- and counter-directions with very close simulation results through the conversion gain. Besides, positive conversion gain was achieved at the high mixing frequencies. Moreover, the maximum frequency range up to 158 GHz was achieved for both directions. It is crucial to notice that SOA-MZI low pass behavior degraded the mixed signal for about 35 dB at 158 GHz at any carrier frequency. However, the modulation principle played a significant role in amplifying the electrical power of the sampled signal compared to the switching principle [22,35]. This resulted in higher conversion gains.
Table 2 can be considered as another view of the conversion gains of up-converted signals, as shown in Figure 11 and Figure 12. To clarify the figures, three conversion gains at the first, fifth, and tenth mixing frequencies have only been selected with respect to the first and second channels. The best up-conversion gains of mixed signals were shown for the standard modulation in the co-direction. Besides, the conversion gains related to channel two exhibited slightly lower values compared to the ones related to channel one under the four considered scenarios.
Table 2.
Simulated up-conversion gains of the simultaneous up-converted signals at in the co- and counter-direction schemas for the standard and differential modulation modes.
In order to make the conversion scheme utilizing a SOA-MZI useful for the implementation of RoF, mm-wave or microwave systems, many IF signals at the UP or LP can be simultaneously up-converted at the SOA-MZI output. This is due to the wavelength of the sampled signal at the SOA-MZI output that is different to that of the optical input signal carrying data. Hence, for the second part of the simulation work, ten optical data signals injected at the UP for the standard modulation in co- and counter-directions were up-converted at the SOA-MZI output at mixing frequencies , where ranged from 1 to 10.
On the other hand, five IF signals injected at the UP and other five ones were injected at the LP for the differential modulation in both directions are up-converted at the SOA-MZI output at . ranged from 0.2 GHz at 1 to 2 GHz at 10. For example, the IF1 signal (channel one) was at 0.2 GHz, the IF5 signal (channel five) was at 1 GHz, which corresponded to the channel one in the first part of simulations, and the IF10 signal (channel ten) was at 2 GHz that corresponds to the channel two of the first part of simulations.
Up-conversion gains were achieved for the simultaneous up-converted signals at . They were only presented at related to of the sampling signal, as exhibited in Figure 13 for the four scenarios. Besides, the up-conversion gain slightly decreased with the channel rank for the four scenarios. For the differential modulation mode, the conversion gain improved 10 dB over the entire channel range compared to the standard modulation mode in both direction schemas. In the counter-direction schema, the conversion gain declined 2 dB for all channels compared to the one in the co-direction for both modes.
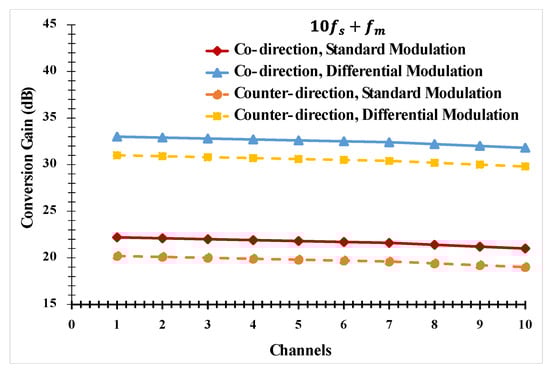
Figure 13.
Conversion gains of simultaneous ten up-converted signals at related to the tenth harmonic of the sampling signal at the SOA-MZI output.
It is worth noting that a low range of the IF frequency of the data signal at the SOA-MZI input to be sampled at the SOA-MZI output was requested. The range of the IF signal should be up to 2 GHz. I decided to split this range up to 10 channels in this work, where the IF frequency spanned from 0.2 GHz for channel one to 2 GHz for channel ten. However, I could also divide it up to twenty channels or more. In that case, the IF frequency ranged from 0.1 GHz for channel one to 2 GHz for channel twenty. As a result, ten channels were chosen in order to up-convert them at the output of the sampling SOA-MZI.
4. Frequency Up-Conversion of QPSK Data
Frequency mixing of QPSK data carried by the electrical subcarrier, which was injected in the optical MZMs for up-conversion simulations, was evaluated at the bit rate of 100 Gbit/s. The generation and detection module generated QPSK data at the carrier frequency of 1 GHz for channel one and 2 GHz for channel two. The quality of the frequency mixing was evaluated through the error vector magnitude (EVM) of the received symbols [40]. The EVM of the mixed symbol was obtained through the BER_El-M-QAM module. As in VPI’s demo, this module was used to evaluate the EVM of the received constellation. Hence, EVM values were calculated from the bit error rate (BER). This module was relevant to the BER, and the passable limit was realized as the value that provided an amounting to BER of 0.0038, which sponsored an error-free fulfillment after executing forward error correction (FEC) methods [41]. The EVM limit of the QPSK data was 17.5% [42,43].
The optical output power directly at the SOA-MZI output was 0.2 dBm with a loss of 3 dB due to the optical losses of the OF. During the optical to electrical conversion stage at the SOA-MZI output, there are thermal and shot noise currents and the photocurrent due to the mixed signal, which were generated in the photodiode (PD). Thus, the total current produced by the PD became the combination of the mixed signal current with the noise currents. After that, the electrical signal was amplified through an LNA. As a result, the noise carried on the sampled signal after photo-detection and amplification at the SOA-MZI output should be considered in any BER calculations.
As seen in Figure 14, the EVM of up-converted QPSK signals augments with the mixing frequency at 100 Gbit/s for the four conditions. The EVM ranged from 10% at 16.6 GHz attached to of the sampling signal up to 33% at 157 GHz relevant to for the standard modulation in the co-direction. For the differential modulation, the EVM value improves higher at the higher mixing frequency. It reaches 13.5% at 157 GHz, which was below the EVM limit of 17.5%. The EVM at the highest mixing frequency demeaned more than the one at the lowest mixing one due to the SOA-MZI low pass behavior. Following the higher harmonic rank of the sampling signal plays the staple function to improve mixed signals because of the differential modulation principle.
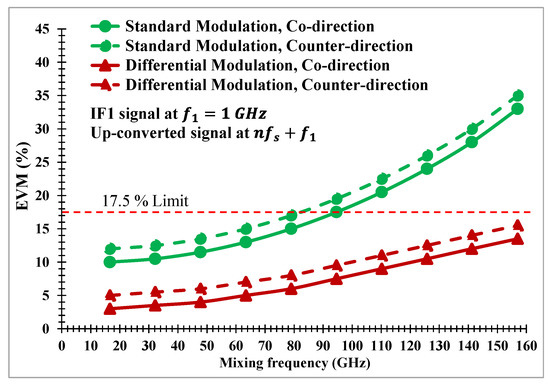
Figure 14.
EVM of up-converted QPSK signals from GHz to the mixing frequencies at the bit rate of 100 Gbit/s for the four cases.
In the case of the counter-direction configuration, the EVM increased an average value of 2% over the full range of mixing frequencies for both modes compared to the co-direction one. It reached 15.5% at 157 GHz, which was below the EVM limit of 17.5%. Furthermore, the EVM values of up-converted QPSK signals at 100 Gbit/s were well below the required limit of 17.5% for the differential modulation mode in both configurations, while they were above the limit at the higher mixing frequencies for the standard modulation mode in both configurations. The maximum bit rate we can achieve during up-conversion process is 100 Gbit/s.
The EVMs of up-converted QPSK signals at the mixing frequencies at 100 Gbit/s for the standard and differential modulation modes in co- and counter-directions are displayed in Figure 15. The comparison of the EVM between Figure 14 and Figure 15 shows that the EVM increased an average value of 2% over the full range of the mixing frequency for the four affairs for the channel two compared to channel one. This increase was due to the electrical power of the channel two that is lower than the one of the first channel at the SOA-MZI output as well as the SOA-MZI input. The EVM achieves good values of 15.5 and 17.5% for the differential modulation mode in both configurations, respectively, at the maximum frequency range of 158 GHz.
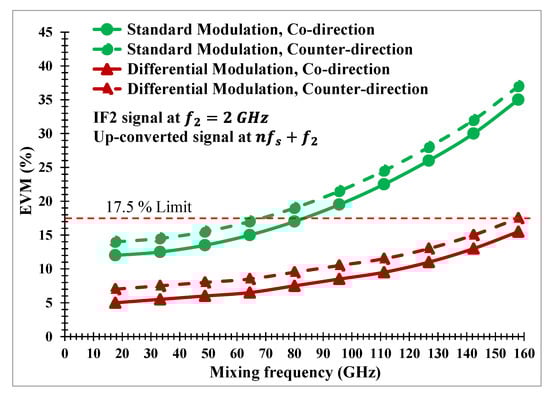
Figure 15.
EVM of up-converted QPSK signals from GHz to the mixing frequencies at the bit rate of 100 Gbit/s for the four cases.
The EVM of the simultaneous ten up-converted signals at the SOA-MZI output is given in Figure 16. Besides, it was only obtained at the mixing frequency at the bit rate of 100 Gbit/s. The EVM augments with the channel rank for the standard and differential modulation modes in co- and counter-directions. Furthermore, it strongly ameliorated for the differential modulation in both configurations compared to the standard modulation. This amelioration was about 20% over the entire range of the channel rank. In the counter-direction, the EVM inclined 2% for all channels compared to the one in co-direction one for both modes.
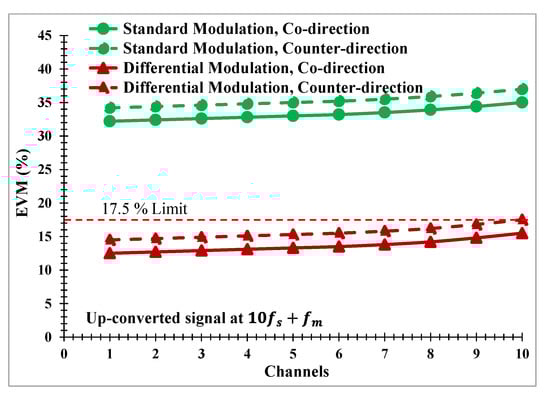
Figure 16.
EVM of simultaneous ten up-converted signals at related to the tenth harmonic of the sampling signal at the SOA-MZI output at 100 Gbit/s.
The co-directional conversion exhibits a better performance (higher contrast ratio (CR), higher conversion gains, and lower EVMs) at high speed than the counter-directional conversion, because the interaction time between the IF signal and the sampling signal in SOAs is longer in the co-directional propagation [44]. In counter-direction, the frequency conversion based on a SOA-MZI is working well as CR and output power are concerned. The speed limit of the counter-direction with respect to co-direction was an issue for frequency mixing over the entire range of the mixing frequency at different bit rates used in the simulations. The speed in this case can be also limited by other, more serious, parameters such as differential carrier lifetime, SOA saturation power, SOA gain, and SOA current. However, these parameters are chosen to be the same for the co- and counter-directions in standard and differential modes in order to obtain on the fair comparisons. As a result, the speed was influenced by the propagation of direction schemas. On the other hand, the differential configuration depended on SOA-MZI led to a clear enhancement of the system performances [22] comparing to the standard configuration. As a result, the differential modulation mode in co-directions schemas was the best of the four considered scenarios thanks to the quality and efficiency of optical transmission systems through the conversion gain and EVM.
5. Experimental Frequency Mixing Performance
In order to compare with the simulation results, we built an experimental setup [22], which was the same as the one used in the simulation setup. Besides, the operating point was similar for both setups. The maximum frequency range reached in the experimental work is limited to 64.4 GHz due to limited bandwidth of the ESA. So, the comparison between the real and simulated work will be for frequency mixing of the ten channels (10 IF signals) in the range of the mixing frequencies from 15.6 0.2 15.8 GHz, which is the lowest mixing frequency, to 4 (15.6) 2 64.4 GHz, which is the highest one. We only compared the real and simulated up-converted signals of the ten channels based on the SOA-MZI in the co- and counter-direction schemas for the differential modulation at related to the fourth harmonic of the sampling signal. As a result, for the experimental study, ten channels are up-converted simultaneously, which are the same as the second part of the simulations.
The conversion gain of the simultaneous ten up-converted signals was measured at as shown in Table 3, where ranges from one to ten. In addition, it increased with the channel order due to rise the electrical power of the mixed signal with . The measured conversion gain was lower than the simulated one due to the noise that is generated at the receiver, such as shot and thermal noise in addition to optical losses to the optical fiber for both co- and counter-direction schemas. The experimental work confirmed the behavior of the counter-direction, which exhibited a lower conversion gain of 2 dB in comparison with the co-direction schema.
Table 3.
Real and stimulated conversion gains of the ten up-converted signals in co- and counter-direction schemas at .
In order to measure the quality of the optical transmission system, the EVM of the ten QPSK up-converted signals were measured in the co- and counter-directions and compared with the simulation results at the bit rate of 100 Gbit/s, as displayed in Table 4. The real EVMs were higher than the simulated ones for both the co- and counter-directions due to the unexpected noise and the thermal noise in the experimental setup. In the counter-direction, for both the real and simulated works, the EVM degraded 2% for all the channels in comparison with the co-direction. This confirmed that the co-direction system was better than the counter-direction one in terms of its quality.
Table 4.
Real and stimulated EVMs of the ten mixed signals in co- and counter-direction schemas at at the bit rate of 100 Gbit/s.
The eye diagram is another way to study the quality of the system simultaneous ten QPSK up-conversion. It visualizes the effect of noise and signal distortion as a result of transmission over a channel. However, it is difficult to show the eye diagram for every mixed signal because of the large number, forty, of eye diagrams for co- and counter-directions at 4fs + fm related to the fourth harmonic of the sampling signal. In this case, we select and display an eye diagram for the QPSK up converted signal at 4fs + f10 at BR = 100 Gbit/s for co- and counter-directions. Hence, we only show two constellations and eye diagrams, side by side as shown in Figure 17. For the co-direction system, the constellation and eye diagrams were better compared to the counter-direction. The eye opening corresponds to the opening in the middle, which measures the effect of noise on the signal. In (b) and (c), there is less noise, so the opening is narrower than in (e) and (f).
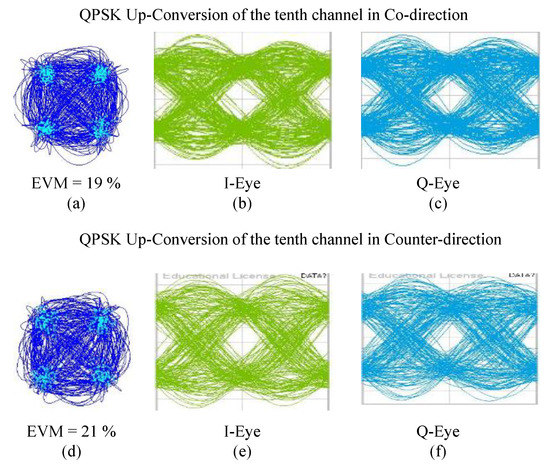
Figure 17.
Demodulation of the QPSK up-converted signal at at BR = 100 Gbit/s. For co-direction (a–c), constellation diagram (a), I-Eye diagram (b), and Q-Eye diagram (c). For counter-direction (d–f), constellation diagram (d), I-Eye diagram (e), and Q-Eye diagram (f).
6. Conclusions
This paper aimed to fulfill simultaneous frequency up-conversion of ten IF signals, for the first time, to a higher frequency range up to 158 GHz without severe crosstalk and fiber dispersion power penalty. Additionally, we confirmed that we could achieve frequency conversion based on the SOA-MZI sampling mixer in co- and counter-configurations. The simulation results showed that both applicable configurations can effectively be used for frequency mixing with the important achievements. However, the results for co-direction were better than the ones of counter-propagation. Furthermore, the comparison of the principle of the standard and differential modulation modes was fulfilled in order to assess the performance of the optical transmission system. Besides, the main difficulty becomes to find a module to generate QPSK data and another one to demodulate this data at high frequencies at the SOA-MZI output. By using a VPI simulator, we have presented simulation results of frequency up mixing based on an SOA-MZI for the four scenarios. By using up to the tenth harmonic of the sampling signal, all-optical frequency up-conversions could be performed in the range up to 158 GHz. The efficiency of this mixer has been evaluated through its conversion gain. Positive conversion gains were reached at all mixing frequencies, whatever the number of the IF signals to be up-converted was. The frequency conversion of QPSK data showed exploitable EVMs for bit rates up to 100 Gbit/s. Using the SOA-MZI sampling mixer in a differential modulation mode led to a clear improvement of the performances. Distinctly, the EVM of frequency up-converted QPSK data derived from the IF signal at GHz reached 15.5 and 17.5% for the co- and counter-direction configurations, respectively at 158 GHz related to tenth harmonic of the sampling signal at 100 Gbit/s. Finally, this concept is efficient, cost effective and may be applied to modern RoF, mm-wave, and microwave systems and wireless access networks without a performance degradation. In the real measurement, we confirm that co-directional conversion performed better than the counter-directional operation. Additionally, the real mixed signal possessed the lower efficiency of 2 dB and the higher EVM of 3% at 64.4 GHz in comparison with simulated signals due to receiver sensitivity.
Author Contributions
All the authors, H.T., A.M. and A.N., contributed equally to this paper. All authors have read and agreed to the published version of the manuscript.
Funding
This research received no external funding.
Institutional Review Board Statement
Not Applicable.
Informed Consent Statement
Not Applicable.
Data Availability Statement
Data underlying the results presented in this paper are not publicly available at this time but may be obtained from the authors upon reasonable request.
Conflicts of Interest
The authors declare no conflict of interest.
References
- Kleine-Ostmann, T.; Nagatsuma, T. A Review on Terahertz Communications Research. J. Infrared Millim. Terahertz Waves 2011, 32, 143–171. [Google Scholar] [CrossRef]
- Stöhr, A.; Renaud, C.; Rogers, D.; Rymanov, V.; Seeds, A.; Steffan, A.G.; Umbach, A.; Weiss, M.; Babiel, S.; Cannard, P.J.; et al. Millimeter-Wave Photonic Components for Broadband Wireless Systems. IEEE Trans. Microw. Theory Tech. 2010, 58, 3071–3082. [Google Scholar] [CrossRef] [Green Version]
- Rouvalis, E.; Renaud, C.; Moodie, D.G.; Robertson, M.J.; Seeds, A.J. Traveling-wave Uni-Traveling Carrier Photodiodes for continuous wave THz generation. Opt. Express 2010, 18, 11105–11110. [Google Scholar] [CrossRef]
- Ito, H.; Kodama, S.; Muramoto, Y.; Furuta, T.; Nagatsuma, T.; Ishibashi, T. High-speed and high-output InP-InGaAs unitraveling-carrier photodiodes. IEEE J. Sel. Top. Quantum Electron. 2004, 10, 709–727. [Google Scholar] [CrossRef]
- Preu, S.; Döhler, G.H.; Malzer, S.; Wang, L.J.; Gossard, A.C. Tunable, continuous-wave terahertz photomixer sources and applications. J. Appl. Phys. 2011, 109, 061301. [Google Scholar] [CrossRef] [Green Version]
- Thomas, V.A.; El-Hajjar, M.; Hanzo, L. Millimeter-Wave Radio over Fiber Optical Upconversion Techniques Relying on Link Nonlinearity. IEEE Commun. Surv. Tutor. 2015, 18, 29–53. [Google Scholar] [CrossRef] [Green Version]
- Sun, C.; Orazi, R.; Pappert, S.; Burns, W. A photonic-link millimeter-wave mixer using cascaded optical modulators and harmonic carrier generation. IEEE Photonics Technol. Lett. 1996, 8, 1166–1168. [Google Scholar] [CrossRef] [Green Version]
- Schaffer, C.; Sauer, M.; Kojucharow, K.; Kaluzni, H. Increasing the channel number in WDM mm-wave systems by spectral overlap. In Proceedings of the International Topical Meeting on Microwave Photonics MWP 2000 (Cat. No.00EX430), Oxford, UK, 1–13 September 2000; pp. 164–167. [Google Scholar]
- Kuri, T.; Kitayama, K.; Ogawa, Y. Fiber-optic millimeter-wave uplink system incorporating remotely fed 60-GHz-band optical pilot tone. IEEE Trans. Microw. Theory Tech. 1999, 47, 1332–1337. [Google Scholar] [CrossRef]
- Park, C.S.; Oh, C.K.; Lee, C.G.; Kim, D.-H.; Park, C.-S. A photonic up-converter for a WDM radio-over-fiber system using cross-absorption modulation in an EAM. IEEE Photonics Technol. Lett. 2005, 17, 1950–1952. [Google Scholar] [CrossRef]
- Tsuchiya, M.; Hoshida, T. Nonlinear photodetection scheme and its system applications to fiber-optic millimeter-wave wireless down-links. IEEE Trans. Microw. Theory Tech. 1999, 47, 1342–1350. [Google Scholar] [CrossRef]
- Paresys, F.; Shao, T.; Maury, G.; Le Guennec, Y.; Cabon, B. Bidirectional Millimeter-Wave Radio-Over-Fiber System Based on Photodiode Mixing and Optical Heterodyning. J. Opt. Commun. Netw. 2012, 5, 74–80. [Google Scholar] [CrossRef]
- Seo, Y.-K.; Choi, C.-S.; Choi, W.-Y. All-optical signal up-conversion for radio-on-fiber applications using cross-gain modulation in semiconductor optical amplifiers. IEEE Photonics Technol. Lett. 2002, 14, 1448–1450. [Google Scholar] [CrossRef]
- Jung, H.D.; Tangdiongga, E.; Koonen, T. All-optical multicasting of millimetre-wave signals using optical frequency multiplication technique for in-building networks. In Proceedings of the 2009 35th European Conference on Optical Communication, Vienna, Austria, 20–24 September 2009; pp. 1–2. [Google Scholar]
- Kim, H.-J.; Song, H.-J.; Song, J.-I. All-optical Frequency Up-conversion Technique using Four-wave Mixing in Semiconductor Optical Amplifiers for Radio-over-fiber Applications. In Proceedings of the 2007 IEEE/MTT-S International Microwave Symposium, Honolulu, HI, USA, 3–8 June 2007; pp. 67–70. [Google Scholar]
- Kim, H.-J.; Song, J.-I. Simultaneous WDM RoF signal generation utilizing an all-optical frequency up converter based on FWM in an SOA. IEEE Photonics Technol. Lett. 2011, 23, 828–830. [Google Scholar]
- Song, H.-J.; Lee, J.S.; Song, J.-I. Signal Up-Conversion by Using a Cross-Phase-Modulation in All-Optical SOA-MZI Wavelength Converter. IEEE Photonics Technol. Lett. 2004, 16, 593–595. [Google Scholar] [CrossRef]
- Lee, J.S.; Song, H.; Kim, W.B.; Fujise, M.; Kim, Y.-H.; Song, J. All-optical harmonic frequency upconversion of radio over fibre signal using cross-phase modulation in semiconductor optical amplifier. Electron. Lett. 2004, 40, 1211–1213. [Google Scholar] [CrossRef]
- Song, J.-I.; Song, H.-J. Simultaneous Frequency Conversion Technique Utilizing an SOA-MZI for Full-Duplex WDM Radio over Fiber Applications. IEICE Trans. Electron. 2007, E90-C, 351–358. [Google Scholar] [CrossRef]
- Juodawlkis, P.; Hargreaves, J.; Younger, R.; Titi, G.; Twichell, J. Optical down-sampling of wide-band microwave signals. J. Light. Technol. 2003, 21, 3116–3124. [Google Scholar] [CrossRef]
- Gamage, P.A.; Nirmalathas, A.; Lim, C.; Novak, D.; Waterhouse, R. Design and Analysis of Digitized RF-Over-Fiber Links. J. Light. Technol. 2009, 27, 2052–2061. [Google Scholar] [CrossRef]
- Termos, H.; Rampone, T.; Sharaiha, A.; Hamié, A.; Alaeddine, A. All-Optical Radiofrequency Sampling Mixer Based on a Semiconductor Optical Amplifier Mach–Zehnder Interferometer Using a Standard and a Differential Configuration. J. Lightwave Technol. 2016, 34, 4688–4695. [Google Scholar] [CrossRef]
- Termos, H.; Rampone, T.; Sharaiha, A.; Hamié, A.; Alaeddine, A. Up and down frequency conversion of a QPSK signal by an all-optical radiofrequency sampling mixer based on a semiconductor optical amplifier Mach-Zehnder interferometer. In Proceedings of the 2015 International Topical Meeting on Microwave Photonics (MWP), Paphos, Cyprus, 26–29 October 2015; pp. 1–4. [Google Scholar]
- Termos, H.; Rampone, T.; Sharaiha, A.; Hamie, A.; Alaeddine, A. OFDM signal up and down frequency conversions by a sampling method using a SOA-MZI. In Proceedings of the 2017 29th International Conference on Microelectronics (ICM), Beirut, Lebanon, 10–13 December 2017; pp. 1–5. [Google Scholar]
- Termos, H.; Rampone, T.; Sharaiha, A. Sampling rate influence in up and down mixing of QPSK and OFDM signals using an SOA-MZI in a differential configuration. Electron. Lett. 2018, 54, 990–991. [Google Scholar] [CrossRef]
- Toda, H.; Yamashita, T.; Kuri, T.; Kitayama, K.-I. Demultiplexing using an arrayed-waveguide grating for frequency-interleaved DWDM millimeter-wave radio-on-fiber systems. J. Light. Technol. 2003, 21, 1735–1741. [Google Scholar] [CrossRef]
- Lim, C.; Nirmalathas, A.; Novak, D.; Waterhouse, R. Capacity analysis for WDM fiber-radio backbones with star-tree and ring architecture incorporating wavelength interleaving. J. Lightwave Technol. 2003, 21, 3308–3315. [Google Scholar] [CrossRef]
- VPI Transmission Maker/VPI Component Maker, User’s Manual, Photonic Modules Reference Manuals. VPI Photonics Official Website. Available online: http://www.vpiphotonics.com (accessed on 6 January 2022).
- Gomes, N.J.; Monteiro, P.P.; Gameiro, A. Next Generation Wireless Communications Using Radio over Fiber; Wiley: New York, NY, USA, 2012. [Google Scholar]
- Leuthold, J.; Besse, P.; Eckner, J.; Gamper, E.; Dulk, M.; Melchior, H. All-optical space switches with gain and principally ideal extinction ratios. IEEE J. Quantum Electron. 1998, 34, 622–633. [Google Scholar] [CrossRef]
- Idler, W.; Schilling, M.; Lach, E.; Baums, D.; Wünstel, K.; Körner, U.; Daub, K.; Laube, G. Signal quality and BER performance improvement by wavelength conversion with an integrated three-port Mach-Zehnder interferometer. Electron. Lett. 1995, 31, 454–455. [Google Scholar] [CrossRef]
- Mikkelsen, B.; Danielsen, S.; Joergensen, C.; Pedersen, R.; Poulsen, H.; Stubkjaer, K. All-optical noise reduction capability of interferometric wavelength converters. Electron. Lett. 1996, 32, 566–567. [Google Scholar] [CrossRef]
- Rostami, A.; Nejad, H.B.A.; Qartavol, R.M.; Saghai, H.R. Tb/s Optical Logic Gates Based on Quantum-Dot Semiconductor Optical Amplifiers. IEEE J. Quantum Electron. 2010, 46, 354–360. [Google Scholar] [CrossRef]
- Termos, H.; Mansour, A.; Nasser, A. Simultaneous up- and down-frequency mixing based on a cascaded SOA-MZIs link. Appl. Opt. 2021, 60, 8336. [Google Scholar] [CrossRef]
- Termos, H.; Mansour, A. OFDM signal down frequency conversion based on a SOA-MZI sampling mixer using differential modulation and switching architectures. Optik 2021, 245, 167761. [Google Scholar] [CrossRef]
- Termos, H. Study of up and down Conversion Technique by All Optical Sampling Based on a SOA-MZI. Ph.D. Thesis, Université de Bretagne Occidentale, Brest, France, February 2017. [Google Scholar]
- Spyropoulou, M.; Pleros, N.; Miliou, A. SOA-MZI-Based Nonlinear Optical Signal Processing: A Frequency Domain Transfer Function for Wavelength Conversion, Clock Recovery, and Packet Envelope Detection. IEEE J. Quantum Electron. 2010, 47, 40–49. [Google Scholar] [CrossRef]
- Rouvalis, E.; Fice, M.; Renaud, C.; Seeds, A.J. Millimeter-Wave Optoelectronic Mixers Based on Uni-Traveling Carrier Photodiodes. IEEE Trans. Microw. Theory Tech. 2012, 60, 686–691. [Google Scholar] [CrossRef]
- Ito, H.; Furuta, T.; Hirota, Y.; Ishibashi, T.; Hirata, A.; Nagatsuma, T.; Matsuo, H.; Noguchi, T.; Ishiguro, M. Photonic millimeter-wave emission at 300 GHz using an antenna-integrated uni-traveling-carrier photodiode. Electron. Lett. 2002, 38, 989–990. [Google Scholar] [CrossRef]
- Schmogrow, R.; Nebendahl, B.; Winter, M.; Josten, A.; Hillerkuss, D.; Koenig, S.; Meyer, J.; Dreschmann, M.; Huebner, M.; Koos, C.; et al. Error Vector Magnitude as a Performance Measure for Advanced Modulation Formats. IEEE Photonics Technol. Lett. 2011, 24, 61–63. [Google Scholar] [CrossRef]
- Mestre, M.A.; Mardoyan, H.; Caillaud, C.; Rios-Müller, R.; Renaudier, J.; Jennevé, P.; Blache, F. Compact InP-based DFB-EAM enabling PAM-4 112 Gb/s transmission over 2 km. J. Lightwave Technol. 2016, 34, 1572–1578. [Google Scholar] [CrossRef]
- 3GPP TS 36.104, Base Station (BS) Radio Transmission and Reception, Version 14.3.0 Release 14. 2017. Available online: https://www.etsi.org/deliver/etsi_ts/136100_136199/136104/14.03.00_60/ts_136104v140300p.pdf (accessed on 6 January 2022).
- Nguyen, D.-N.; Bohata, J.; Spacil, J.; Dousek, D.; Komanec, M.; Zvanovec, S.; Ghassemlooy, Z.; Ortega, B. M-QAM transmission over hybrid microwave photonic links at the K-band. Opt. Express 2019, 27, 33745–33756. [Google Scholar] [CrossRef] [PubMed]
- Joergensen, C.; Danielsen, S.; Stubkjaer, K.; Schilling, M.; Daub, K.; Doussiere, P.; Pommerau, F.; Hansen, P.; Poulsen, H.; Kloch, A.; et al. All-optical wavelength conversion at bit rates above 10 Gb/s using semiconductor optical amplifiers. J. Sel. Topics Quantum Electron. 1997, 3, 1168–1180. [Google Scholar] [CrossRef] [Green Version]
Publisher’s Note: MDPI stays neutral with regard to jurisdictional claims in published maps and institutional affiliations. |
© 2022 by the authors. Licensee MDPI, Basel, Switzerland. This article is an open access article distributed under the terms and conditions of the Creative Commons Attribution (CC BY) license (https://creativecommons.org/licenses/by/4.0/).