Article

A Semi-Supervised Method for PatchMatch Multi-View Stereo with Sparse Points

National Demonstration Center for Experimental Electrical, School of Electronic and Information Engineering, Changchun University of Science and Technology, Changchun 130022, China
*
Author to whom correspondence should be addressed.
Photonics 2022, 9(12), 983; https://doi.org/10.3390/photonics9120983
Submission received: 7 November 2022 / Revised: 7 December 2022 / Accepted: 7 December 2022 / Published: 14 December 2022

Abstract

:
Recently, the deep-learning-based PatchMatch method has been rapidly developed in 3D reconstruction, based on which boundary regions are filled with other parts that most closely match edge parts, but limited PatchMatch data hinder the generalization of the method to unknown settings. If various large-scale PatchMatch datasets are generated, the process would require considerable time and resources when performing neighborhood point-matching calculations using random iterative algorithms. To solve this issue, we first propose a new, sparse, semi-supervised stereo-matching framework called SGT-PatchMatchNet, which can reconstruct reliable 3D structures with a small number of 3D points using the ground truth of surface frame values. Secondly, in order to solve the problem of the luminosity inconsistency of some pixels in other views, a photometric similar-point loss function is proposed to improve the performance of 3D reconstruction, which causes the neighborhood information to project the depth value of the predicted depth to meet the same 3D coordinates. Finally, in order to solve the problem of the edge blurring of the depth map obtained using the network model, we propose a robust-point consistency loss function to improve the integrity and robustness of the occlusion and edge areas. The experimental results show that the proposed method not only has good visual effects and performance indicators but can also effectively reduce the amount of computation and improve the calculation time.

1. Introduction

In recent years, 3D reconstruction technology has developed rapidly. Multi-view stereo (MVS) is one of the important methods of 3D reconstruction, based on which dense 3D geometry is reconstructed from the perspective of building depth maps. For decades, 3D reconstruction techniques have been rapidly developed in industrial applications, such as unmanned vehicles, robotics, and video entertainment. Recent studies on MVS [1] and PatchMatch [2] have successfully combined traditional methods with learning-based approaches and have improved the modeling quality of 3D reconstruction with datasets such as DTU. However, contrary to the increasing dependence on datasets, there are fundamental problems in collecting the dense ground truth of 3D structures with surface frame values, which hinder the generalization of these methods to unknown data, so the effective use of data and obtaining high-quality reconstructions are also important issues in the field of 3D vision.
Previous semi-supervised domains are all trained on the basis of MVS and not implemented using the PatchMatch method [3,4,5]. This is because with MVS, the depth map is obtained by constructing the cost volume, and we only need to refine the depth map, while in the PatchMatch method, the depth map is obtained through neighborhood point matching, and therefore each point needs to be refined; thus, the implementation of semi-supervised frameworks becomes more difficult using the PatchMatch method. In addition, the MVS method mainly relies on the assumption of the same color constancy, i.e., it assumes that the corresponding points between different views have the same color, while the PatchMatch method mainly relies on the adaptive propagation of the neighborhood point space. In real scenes, various factors may interfere with the accuracy of color distribution and neighborhood points, such as lighting conditions, reflections, noise, and texture-free regions. Therefore, the ideal unsupervised loss can easily be confused by these common color interference and neighborhood point errors, leading to poor training results in challenging scenarios [6].
In this paper, we explore a new, sparse, semi-supervised PatchMatch (SGT-PatchMatch) problem, which involves the following three points:
  • Active sensors should be used for the acquisition of accurate and complete surface information, but the process usually takes several hours, for instance, when acquiring data on moving dynamic objects in a field of view [7]. The existing mature technique COLMAP [8] can accurately estimate the camera’s pose and thus obtain complete surface information but requires precise and non-overlapping camera coordinate positions; therefore, the application of this operational technique is limited.
  • Assuming that only the depth information of sparse 3D point construction is involved in the test, the SGT-PatchMatch problem is solved by studying its basic features. However, the relatively sparse depth information will inevitably reduce the quality of the overall 3D reconstruction, so it is necessary to ensure the effectiveness of the test in addition to improving the training speed.
  • The learning-based PatchMatch method is able to solve these difficulties by using the contextual information of the non-occluded part of the neighborhood (for occluded pixels) and the high-resolution features of the edge pixels (for edge pixels), and the actual depth value on the occluded region or edge can be obtained through the matching points. However, with a small amount of information for supervision, the model using the learning-based PatchMatch method will be insensitive to occluded pixels and edge pixels.
To address the above problems, we proposed corresponding solutions: Firstly, a sparse, semi-supervised learning approach was proposed to simplify the model, enhance the generalization ability in the invisible environment, and complete the training and testing of the whole network by filling multiple triangular regions constructed by sparse points to obtain depth information for the supervision of the network. Secondly, we proposed photometric similar-point loss [9] and robust-point consistency loss [10] to solidify the color values and self-nuisance points. The photometric similar-point loss function involves the 3D points back-projected from the corresponding pixels that are returned to the actual intersecting locations under the world coordinate system, and the redundant information is continuously optimized through the comparison of similar points to achieve dynamic balance and to enhance the 3D reconstruction performance of the accurately predicted region, where back-projection refers to the conversion from pixels in the image coordinate system to the 3D points in the world coordinate system. Due to the inaccuracy of the depth values, the corresponding pixel points may be back-projected to different 3D points, so it is reasonable to convert to a world coordinate system for matching. The robust-point consistency loss function reduces the interference of mismatched neighborhood points and enhances the robustness of the network by checking the edge information integrity as well as accuracy.
To validate our approach in the SGT-PatchMatch problem, we designed the SGT-PatchMatchNet network, which selects the sparse points from the original dense 3D structure to serve as points for the supervision of the network. First, we randomly selected our sparse points according to the length and width of the imageNext; then, we used the photometric similar-point loss and robust-point consistency loss functions to refine the depth map for occlusion and edge problems. Finally, we compared SGT-PatchMatchNet with PatchMatchNet [11] and confirmed that the problems of SGT-PatchMatchNet can be solved.

2. Related Work

2.1. Learning-Based Multi-View Stereo (MVS) and PatchMatch

In recent years, learning-based methods have been successfully applied in the field of MVS reconstruction. From the traditional voxel-based and grid-based methods to the current depth-map-based methods, the speed and quality of reconstruction have been continuously improved. Due to the limitations of voxel-based and grid-based image processing, researchers have gradually shifted their goals toward learning-based depth map methods to handle large-scale reconstruction. Yao et al. first proposed an end-to-end network MVSNet [12], for which they constructed a 3D cost volume by twisting adjacent depth images. In addition, they applied a 3DCNN to normalize the cost volume and regress the depth map. In another study [13], R-MVSNet was used for the convolutional GRU sequential construction of cost volume to reduce GPU memory consumption. To improve the accuracy of the reconstruction, using Cascade-MVSNet, the authors of [14] refined the convolutional network by means of chunked convolution. To improve the speed of reconstruction, in [15], Fast-MVSNet was used to define a sparse-to-dense strategy through which differentiable Gaussian Newton layers were introduced to obtain the sparse depth map. To improve the completeness of the reconstruction, a new training network, PatchMatchNet, predicted the depth information obtained from matching through the adaptive propagation of neighborhood points and refined the depth map with three iterations. To meet the needs of large-scale reconstruction, using P-MVSNet, the authors of [16] proposed a new depth normal consistency loss and a global refinement algorithm to iteratively compute pixel line depths and normal values in a multi-scale framework through a SLAM vision system to balance the inherent local properties of PatchMatch. These networks are all highly dependent on dense ground truth to participate in supervision despite their difficulty in data collection, so we focused on working to reduce the dependence of the network on dense ground truth.

2.2. Learning-Based Unsupervised and Semi-Supervised Models

In the existing unsupervised learning and semi-supervised learning models, most of them are implemented in a network such as multi-view stereo (MVS). However, the previous supervised learning MVS methods heavily rely on depth maps with ground truth information and are thus more time-consuming in generating dense depth maps in large-scale datasets. To overcome this limitation, Tejas used luminosity consistency loss to design a new stereo-matching network [17], using only the image from the new view as a supervised signal. Using MVS2, the authors of another study proposed an unsupervised MVS consistency loss [18]. M3VSNet was also used to propose a normal depth consistency loss [19] incorporated into the 3D point cloud format. In [20], the authors used JDACS to propose luminosity loss and semantic segmentation loss based on MVSNet and Cascade-MVSNet to solve the problem of edge occlusion through a data enhancement consistency module. The above methods are trained to be unsupervised. To further improve the speed of training, Kim proposed the semi-supervised learning network SGT-MVSNet [21], based on which the coordinate values of the mapping are compared using a designed 3D point consistency loss, and finally, an optimized depth map is obtained after using a coarse-to-fine network. All these networks are based on the MVS approach, so we considered the PatchMatch approach to implement sparse, semi-supervised training to further improve the speed of the network.

2.3. Datasets

In selecting a dataset, there are many datasets used to evaluate the MVS algorithm that can be used for the PatchMatch algorithm. The Middlebury dataset is the first publicly available dataset for MVS evaluation. It consists of hundreds of low-resolution images with calibrated cameras in a controlled laboratory environment. The ETH3D dataset [22] includes high-resolution images of building stereo models and 3D surface frame values captured with laser scanners. The DTU dataset [23] contains a large number of point cloud images with a world coordinate system, and they are collected using a robotic arm. The DTU dataset provides reversed and well-textured scenes under different lighting conditions. The Tank&Temples dataset [24] includes high-resolution video data and the 3D ground truth of surface frame values captured with laser scanners. However, access to these datasets is conditional, so it is necessary to study how to better utilize the surface information of these datasets. In order to make the effect more obvious and conducive to comparison, we used the DTU dataset for training and testing and used the Tank&Temples dataset to test the generalization ability of the network.

3. Method

To address the problems of SGT-PatchMatchNet, a semi-supervised learning method was used by sampling sparse points on the ground truth, and the loss function in the network was designed; both of these processes are explained in this section.

3.1. Refinement of Network Issues

According to previous supervised learning models, for a given reference frame I 0 and source frame I i i = 1 N , a dense depth map D of the 3D structure is mainly estimated from the reference view. Additionally, the difference between our problem with the supervised MVS problem is that we calculated the depth value of each 3D point in the ground truth of the surface depth map and filled the depth map based on a triangle constructed from the 3D points, and determined the loss of the formulated depth map with the depth map obtained from the network to achieve a semi-supervised learning model that can be tested with a small number of 3D points.
For some intensive depth estimation tasks, such as semantic segmentation, a deep contextual understanding of each class is required to estimate the occluded regions, which requires a large number of pixel-level annotations. In contrast, PatchMatchNet is based on the feature information of neighborhood points to match pixel points, so it is still possible to predict the depth values of non-occluded pixels in reference frames reasonably well without a large number of surface frame values. However, during the matching process, only some or even no feature information of the neighborhood points is available, which causes some pixels to be inconsistent with the luminosity in other views, and therefore the obtained depth map is not optimal. Furthermore, the depth map obtained with point matching using the network alone cannot meet the reconstruction criteria. Therefore, we proposed photometric similar point loss to solve this problem.
In addition, besides the occlusion problem, the misestimation of edge pixels is also an important issue and an important reflection of the integrity after reconstruction. Since the depth values at the object boundaries often considerably vary, the information of the points at the edge pixels also drastically changes. Therefore, the robustness of the edge information in these regions is particularly important. Using PatchMatchNet, the output is determined with a coarse-to-fine convolutional network, and the network is a supervised network, which can effectively circumvent this problem. In contrast, our proposed SGT-PatchMatchNet is a sparse semi-supervised network, which cannot effectively solve the edge blurring problem, so the robust-point consistency loss function was proposed to solve this problem.

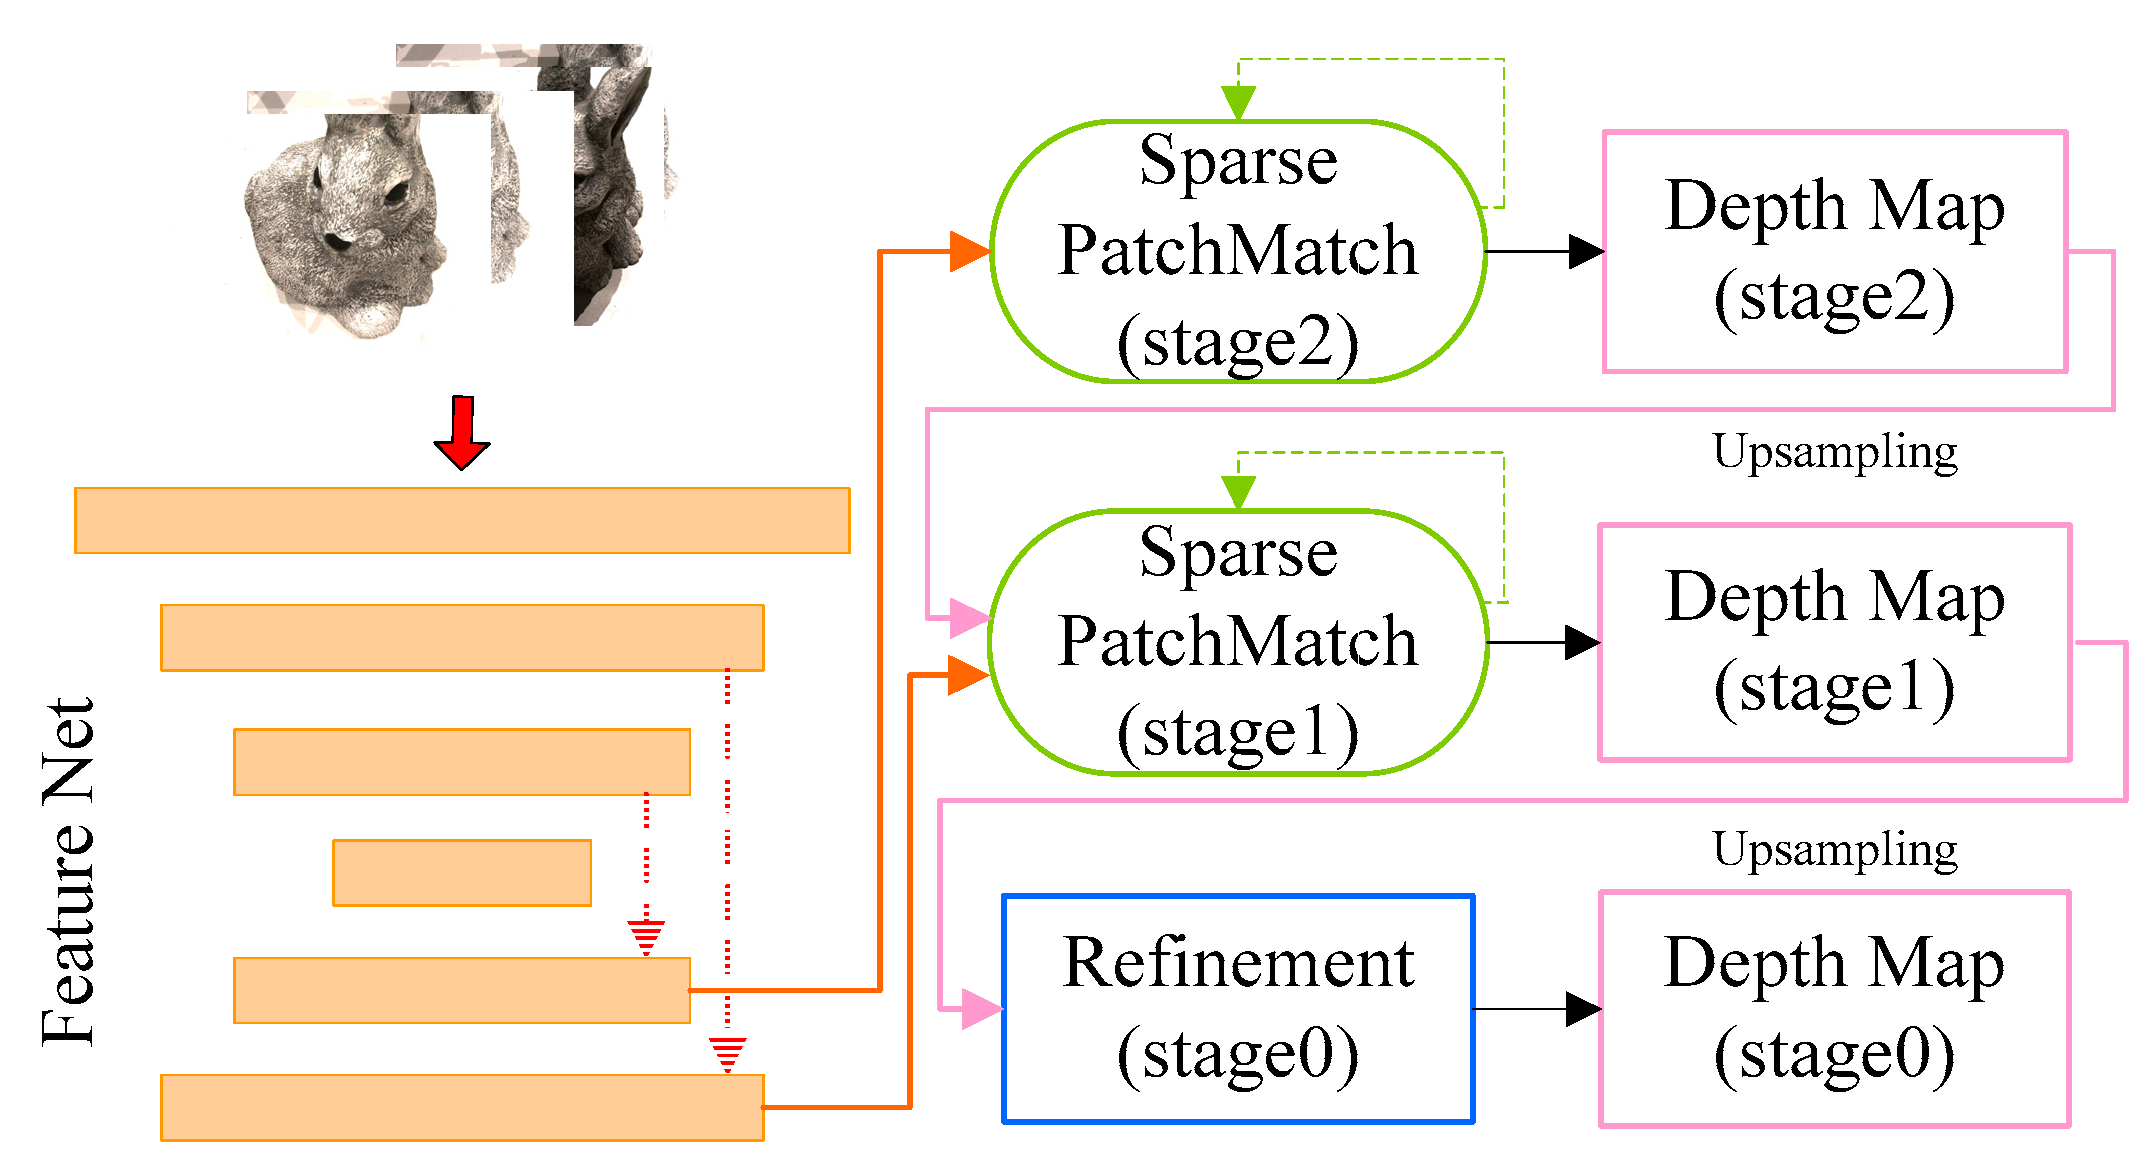
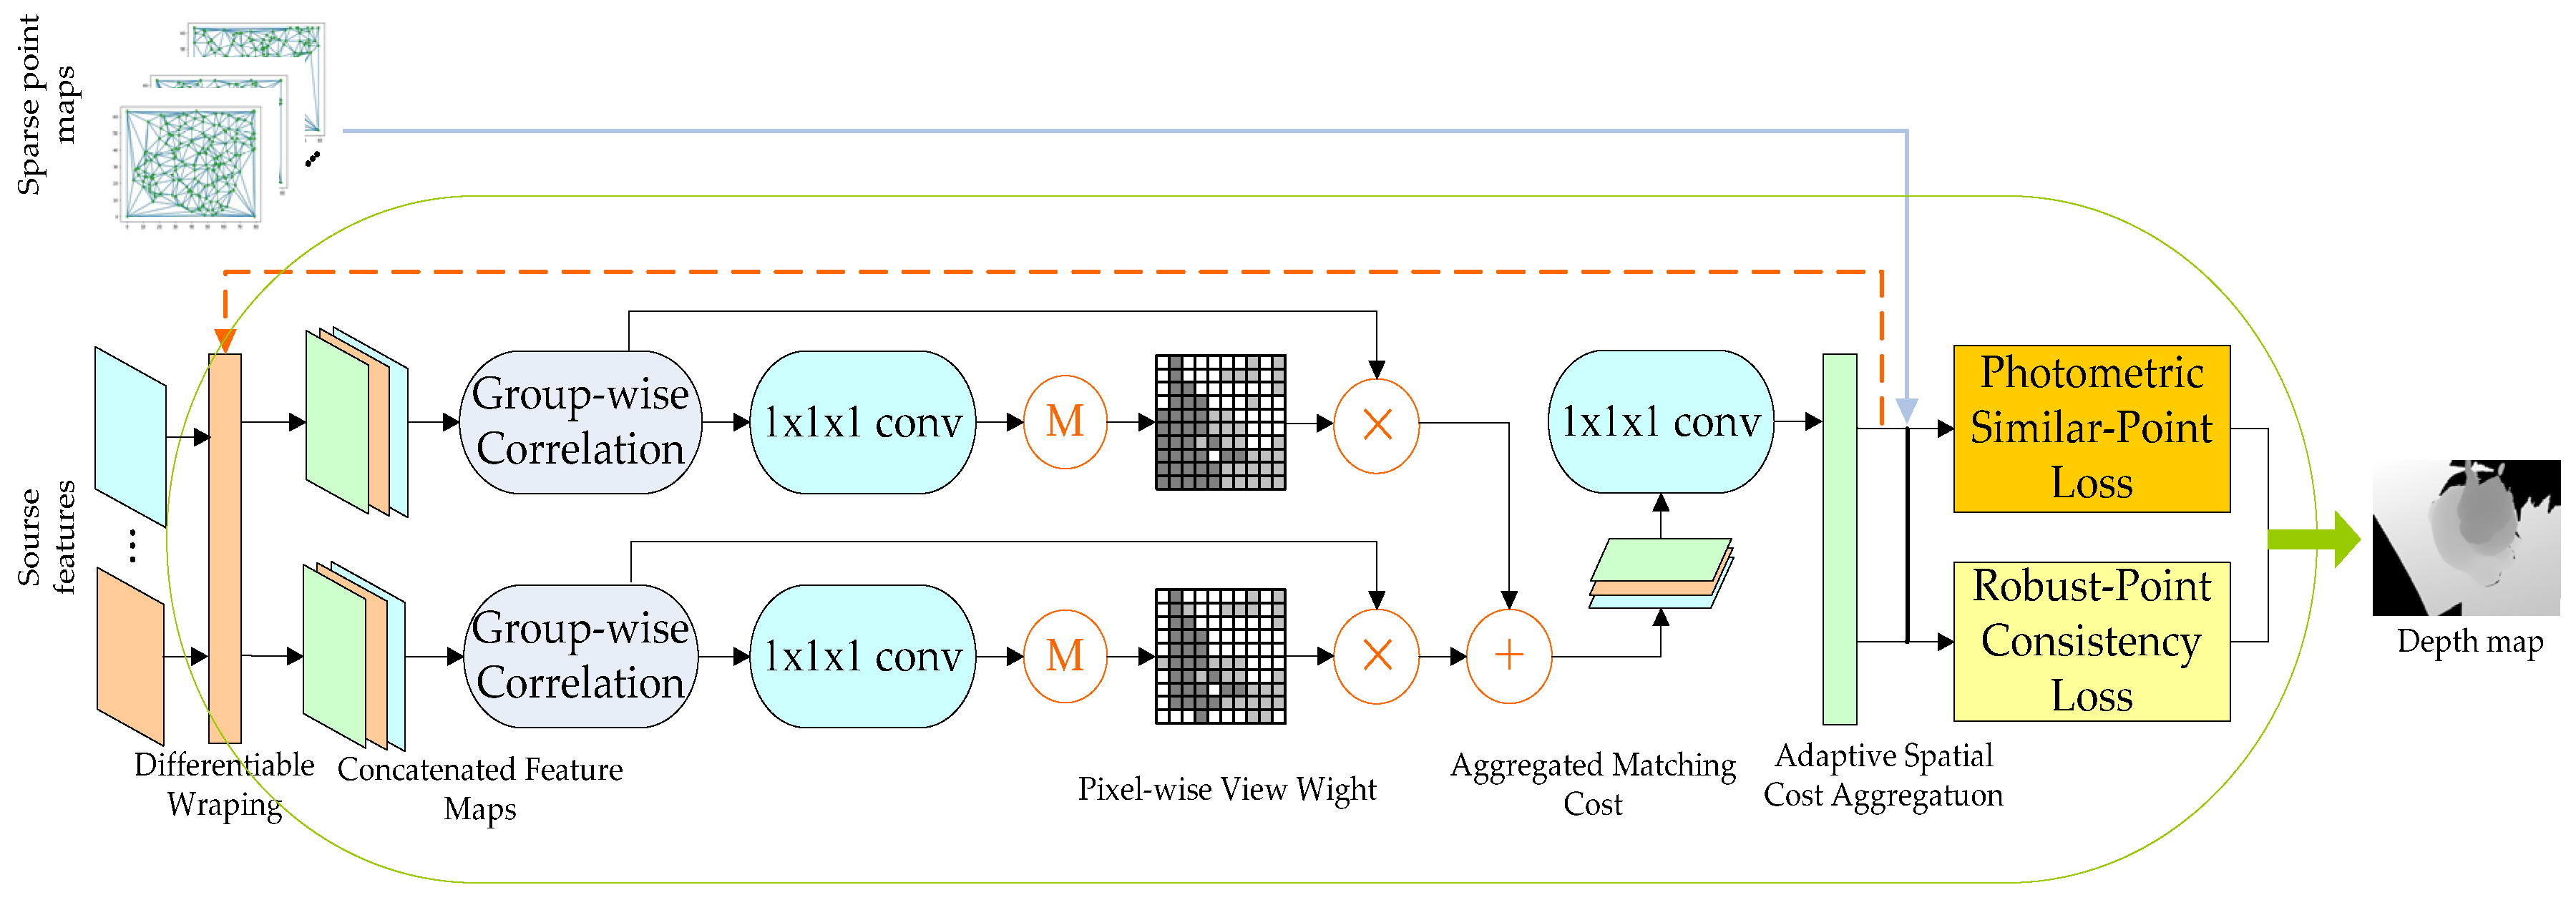
3.2. Network Structure Design

General Network Design: Based on the above problem statement, we sought to maximize the feature distinguishability using a sparse, semi-supervised approach. Unlike the PatchMatchNet network, we only performed two iterations and one optimization to complete the training of the whole network, where the pixel-level features were extracted with a feature extraction module, similar to (FPN); the features were extracted in six layers, and the last two layers were taken as the input to the network. The optimization model prescaled the depth map to the range [0, 1] and converted it back after refinement, and the optimized depth map was obtained using a residual network constructed by two-dimensional convolution. The general framework of the specific SGT-PatchMatchNet is shown in Figure 1.
Subnetwork Design: Our subnetwork SparsePatchMatch inside SGT-PatchMatchNet has a similar structure to the subnetwork PatchMatch inside PatchMatchNet. Firstly, our subnetwork SparsePatchMatch removes the initialization and adaptive propagation modules. Secondly, to complete the semi-supervised training of the network, we performed the sampling of sparse points on the ground truth of surface frame values and determined the loss and optimization of the model with the depth map obtained from the network with a small number of labels involved in the supervision. Additionally, the obtained depth map was tested to evaluate the quality of the network. The general network of the specific SparsePatchMatch is shown in Figure 2.
Loss function Design: In order to solve the problem of inconsistency in the luminosity of some pixels in other views due to having only partial or no feature information for neighborhood points, we designed a photometric similar-point loss function to make the 3D points of pixel mapping accurate and return to points under the world coordinate system. Since this training method is susceptible to error pixels, we designed thresholds α in the loss function to circumvent them. Finally, in order to solve the problem of edge pixel error, we constructed a robust-point consistency loss function, which can effectively avoid the wrong depth value to improve the robustness of edge information. We will elaborate on the innovation and implementation of the network in Section 3.3 of this document.

3.3. Refinement of Network Structure

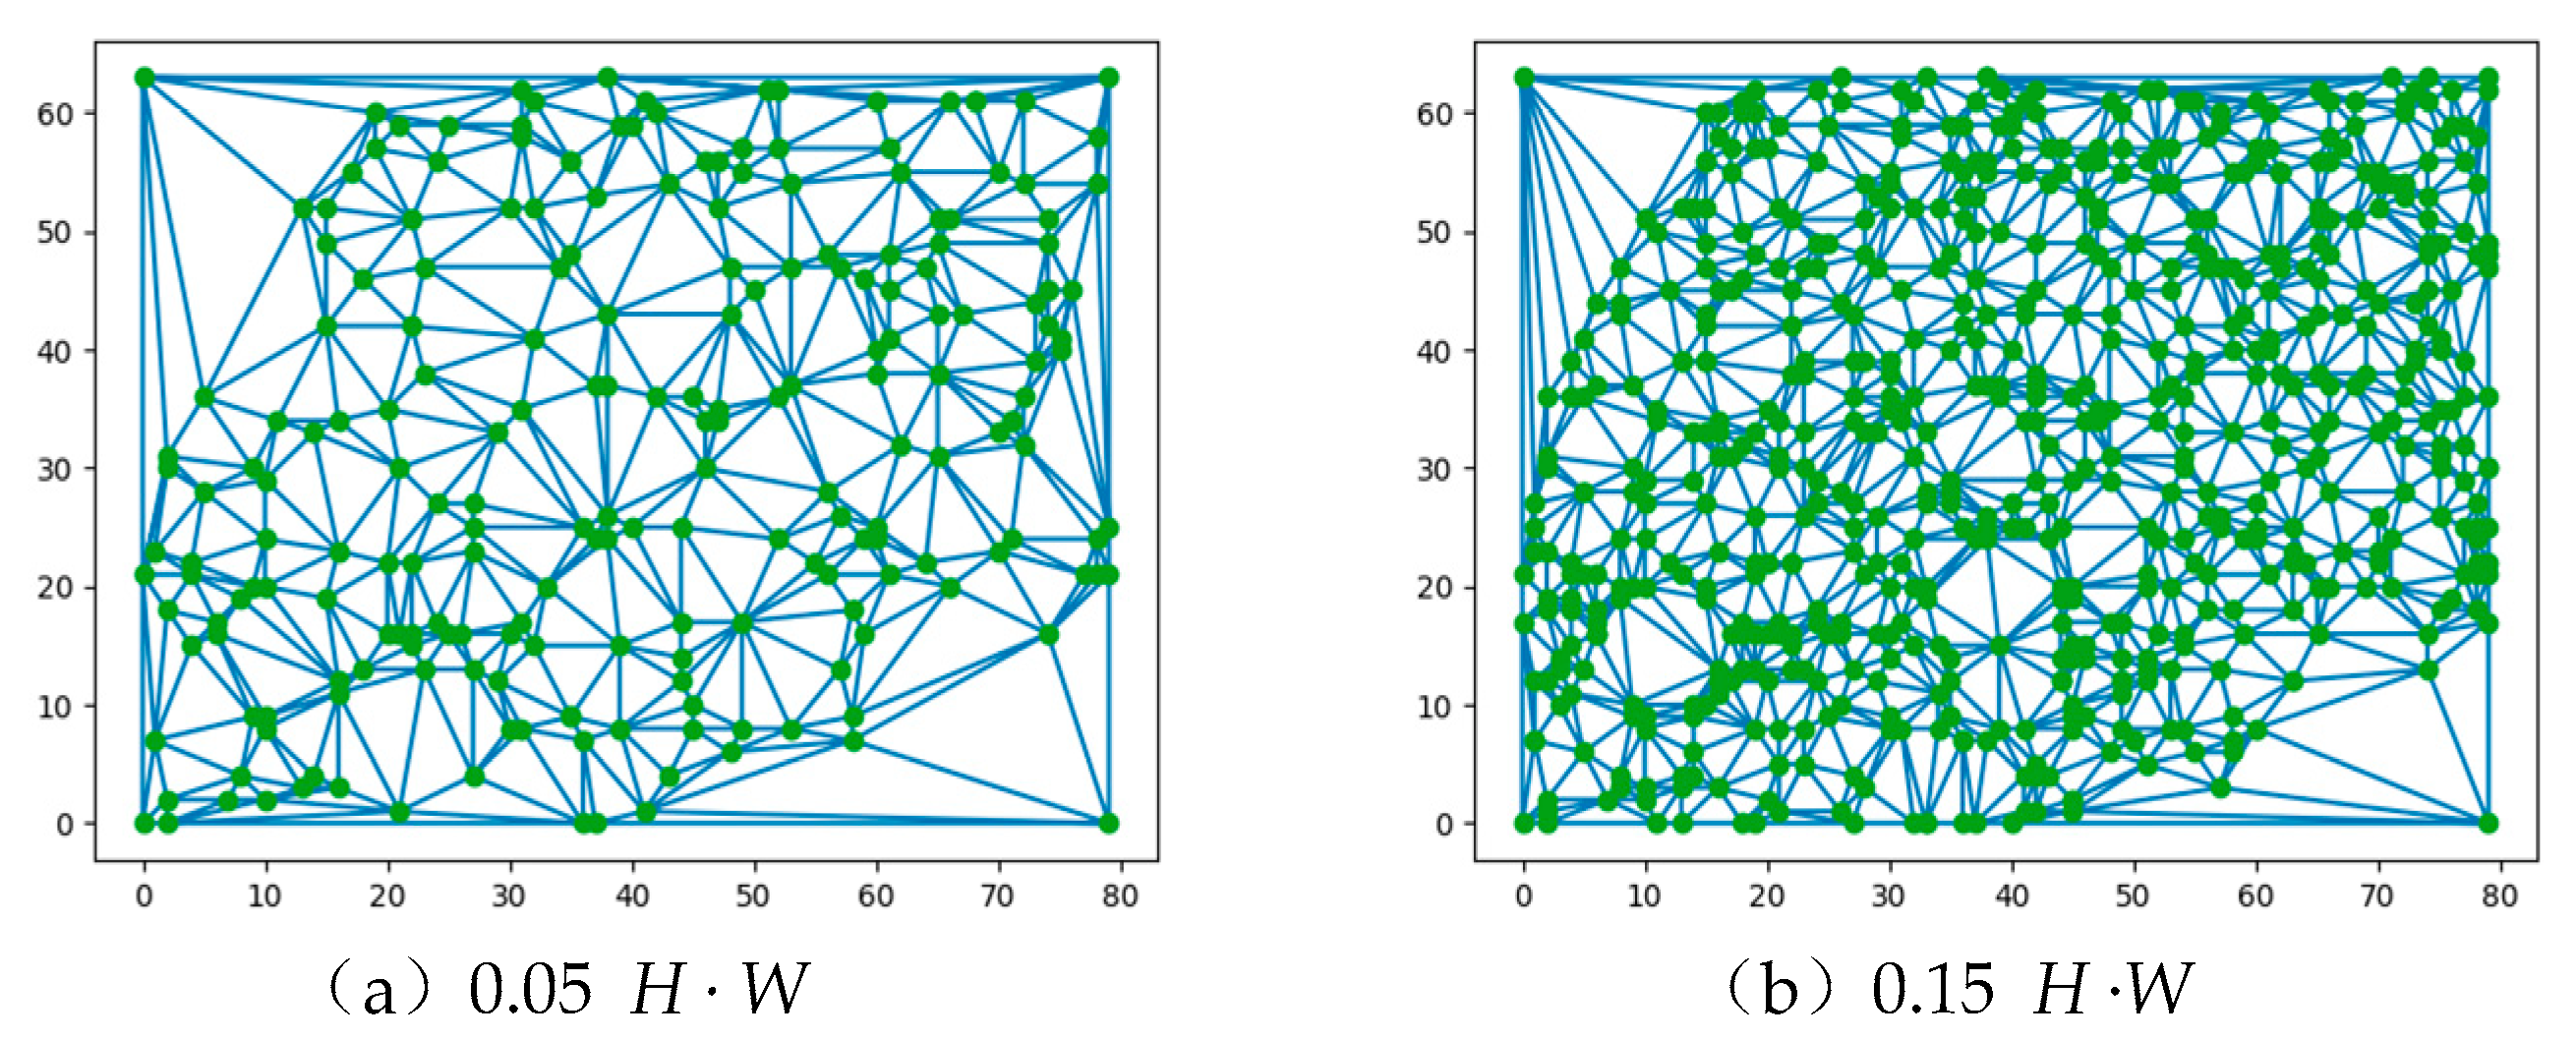
3.3.1. Sparse Point Acquisition

The way of collecting sparse points is different for different datasets. For datasets without the ground truth of surface frame values, we can estimate the bit pose based on the points in the world coordinate system of the image, with the parameters of the camera, and then calculate the depth value of the image, from which we collect the corresponding points that are sparse points, and this approach can be directly obtained using the COLMAP network [8]. The DTU dataset used in our network includes surface frame values, so it can be directly selected. The proposed number of the selected points is 0.05 H · W , H is the image height, and W is the image width. The coordinates of the four corner points were set according to the maximum depth (depth-max) and minimum depth (depth-min) values in the camera parameters, and a little random noise was added in the selection process to enhance the image stability. After selecting each pixel point, we divided each point into regions to obtain an image constructed by multiple triangle regions, and finally, we filled each triangle region to obtain the depth map for supervision. It should be noted that when the two sides of each triangle are determined, the filled area of the triangle can be obtained according to the fork multiplication operation, and the specific triangle filling calculation formula is as follows:
e d g e 0 = 1 i r s 1 · d e p t h 1 p 1 i r s 1 1 i r s 0 · d e p t h 0 p 0 i r s 0 e d g e 1 = 1 i r s 2 · d e p t h 2 p 2 i r s 2 1 i r s 1 · d e p t h 1 p 1 i r s 1 n l = e d g e 0 × e d g e 1
where e d g e 0 and e d g e 1 are the two edges of the triangular region, respectively; i r s 0   i r s 1 , and i r s 2 are the three points selected by the parameters inside the camera; p 0 ,   p 1 , and p 2 are the three points in the triangular region; d e p t h 0 , d e p t h 1 , and d e p t h 2 are the normal vectors perpendicular to the three points, respectively; and n l is the fork product of two edges of e d g e 0 and e d g e 1 .

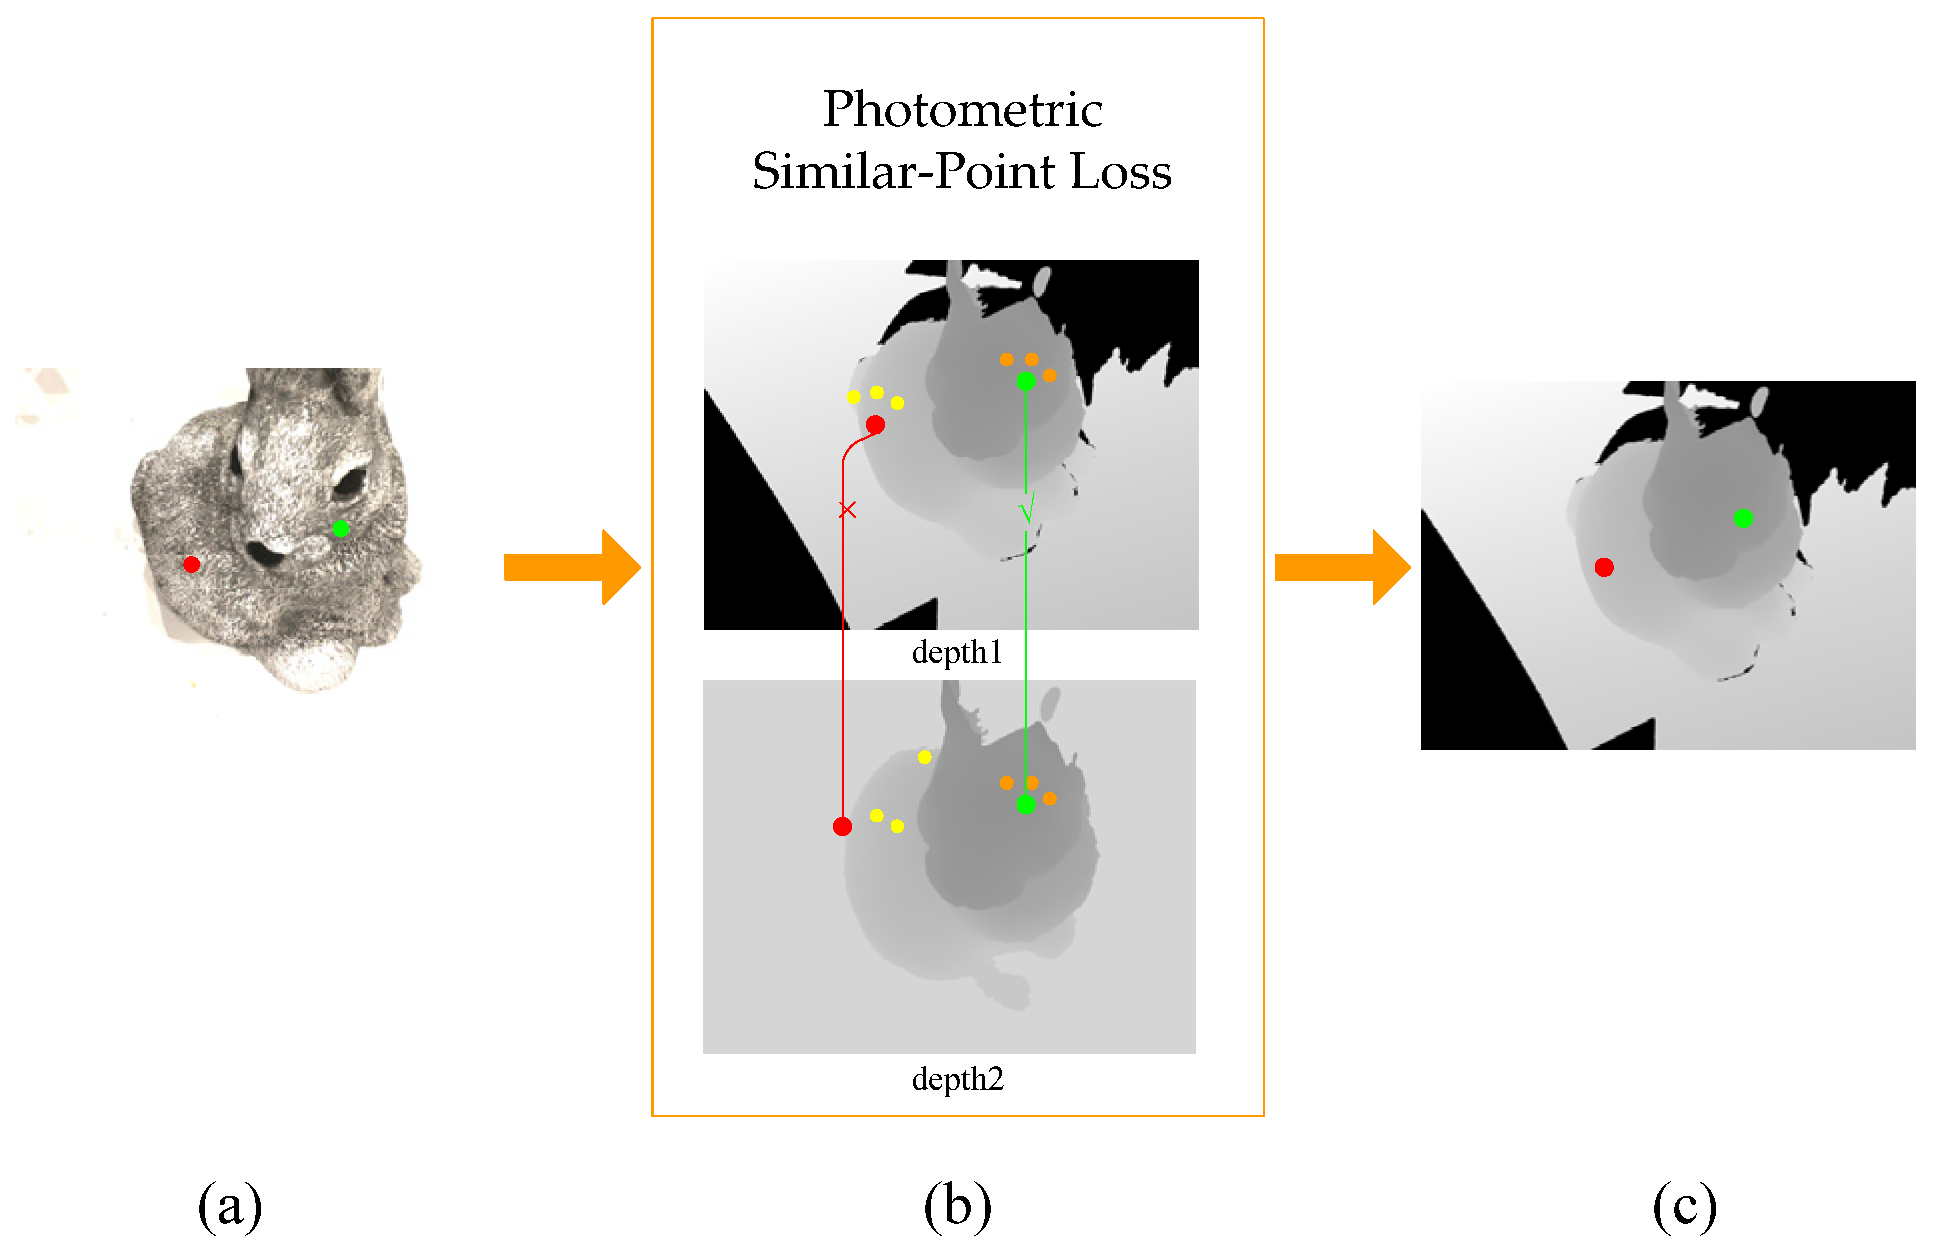
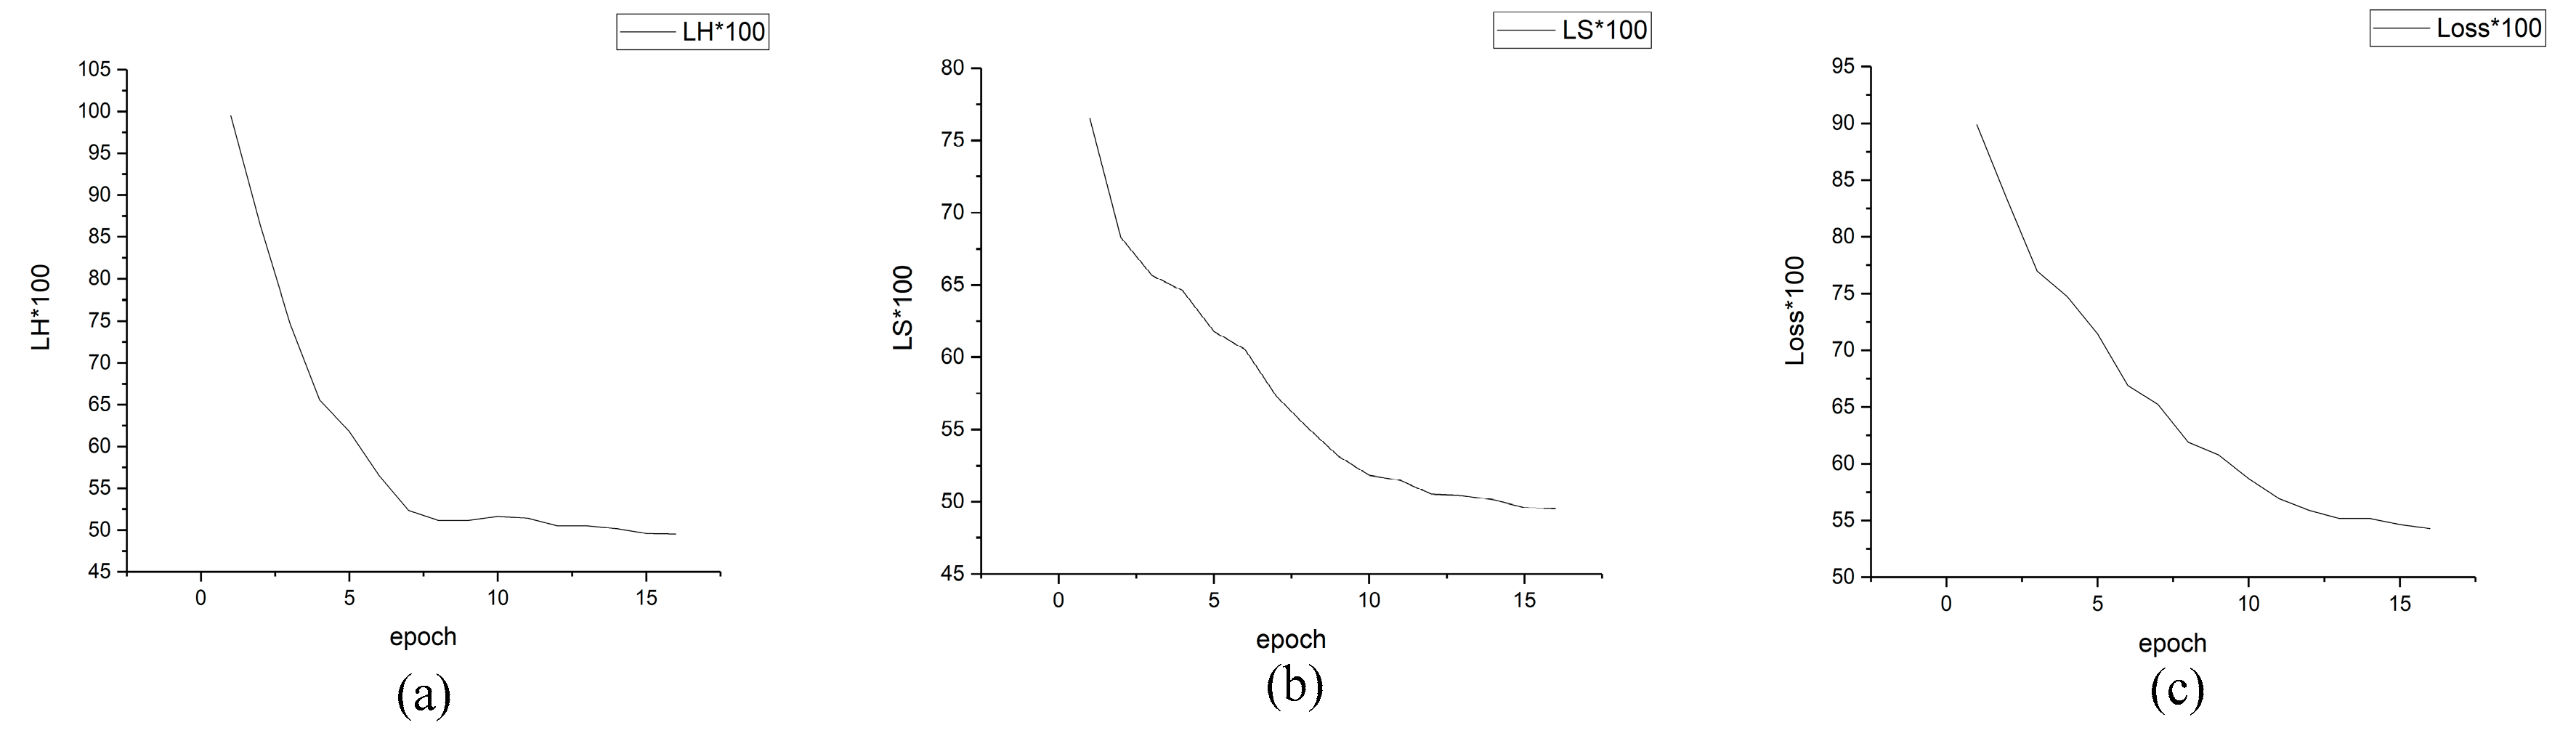
3.3.2. Photometric Similar-Point Loss

The process of matching and reconstructing objects using the PatchMatch method is rapid, but in the process of propagating from neighborhood points to matching points, there will be a large amount of similar information and pixel redundancy. If the difference from the matching point is large, it will affect the accuracy of the final depth map, so we proposed a photometric similar-point loss function to solve this problem, as shown in Figure 3. The key idea of photometric similar points is to minimize the difference between the composite image and the original image of the same view. We used the depth map built from sparse points as a reference, the rest of the views N were the source views of the index i 0 i N , and we set a threshold α to judge the similarity to dynamically adjust the similarity performance of the loss function. The specific formula for photometric similar-point loss [9] is as follows:
L x , y = 0.5 x y 2 ,                               x y < β         x y 0.5 · β ,                 o t h e r w i s e           L 1 = L d 1 , d 2 L 2 = L d 1 x , d 2 x + L d 1 y , d 2 y L S = 1 α L 1 + α L 2
where d 1 represents the sample depth map obtained through the network; d 2 represents the sample depth map built with the sparse points; d 1 x is the gradient of d 1 in the x-axis direction; d 2 x is the gradient of d 2 in the x-axis direction; d 1 y is the gradient of d 1 in the y-axis direction; d 2 y is the gradient of d 2 in the y-axis direction; L x , y is the similarity of loss; L 1 is obtained by defining d 1 and d 2 ; L 2 is obtained by calculating d 1 x , d 2 x ,   d 1 y , and d 2 y ; and L S is the photometric similar-point loss designed by us. The parameter β 0 , and the default is 1. α is the similarity threshold.
In addition, in order to better explain the specific conversion method of pixels in the loss, we defined the conversion relationship from the image coordinate system to the world coordinate system, and the specific formula is as follows:
Z C μ v 1 = 1 d x 0 μ 0 0 1 d y v 0 0 0 1 f 0 0 0 f 0 0 0 1       0 0 0 R t 0 1 X Y Z 1
where Z C is the normal perpendicular to the image plane; μ is the number of columns in the image array and   μ = x d x + μ 0 ; v is the number of rows in the image array and v = x d x + v 0 ; f is the focal length; X ,   Y , Z is the coordinate axis in the world coordinate system; R is a rotation matrix, which is the product of three axial rotation matrices X ,   Y , Z and R = R X R Y R Z ; t is a translation vector, which is the translation distance in the axes and t = t X , t Y , t Z T .

3.3.3. Robust-Point Consistency Loss

When considering edge information errors and occlusion issues, we focused on the pixels on the edges and occlusion in order to obtain a more complete picture when optimizing the depth map, thereby improving the integrity of the match. However, the pixels on edges and occlusions are easily mapped to other wrong pixels when similarity calculations are made. In addition, if the resulting depth value is inaccurate, it is possible to match the wrong pixels in other views, even if there are no occlusion pixels. To solve this problem, we need a strict standard to remove redundant false correspondence and obtain reliable matching pixels. Therefore, we proposed a robust-point consistency loss function [10] on the basis of the photometric similar-point loss function, and the specific calculation formula is as follows:
L H = 1 2 i = u = 1 n d i d u 2 2 + γ 2 p , q ε n ω p , q ρ d p d q 2
where D 1 is a collection of depth maps for the network output, D 1 = d 1 , d 2 , , d n   d i R D 1 , and D 2   is a collection of depth maps built by sparse points, D 2 = d 1 , d 2 , , d n   d u R D 2 . The first section of the formula is the loss of the depth map and the sparse depth map of the network, while the second section of the formula is the loss of the internal depth map of the network. ε is a collection of pixels for each depth map, and ω p , q is determined to balance the weights between each pair of points. The function of ρ · is the penalties for regularized terms, and using an appropriate robust penalty function is the heart of our losses. The depth values from the same set should converge at the same point   d i at which the function of ρ · convergence on 0 obviously normalizes. The function of ρ · is defined as ρ y = y 0 , where [·] is Iverson brackets.
When the similarity of sample depth information is high, i.e., x y < β = 1 , both the photometric similar-point loss and the robust-point consistency loss tend to be quadratic functions. We set the loss of our network according to the weight settings in the existing network JDACS [20] and SGT-MVSNet [21], but the loss value should not be too large or too small; too large a value will cause the loss value to remain high and unable to fall, whereas too small a value will cause the decline to become too fast and therefore unable to be trained, so we need to control the loss value in our process of experimentation, in order to make it fall gradually during training after many experiments; the overall loss function formula is as follows:
L o s s = λ 1 · L S + λ 2 · L H
where the weights are set as λ 1 = 0.456 , λ 2 = 0.512 .

4. Experiments and Analyses

In this paper, the matching and reconstruction results of the algorithm and other advanced algorithms were compared and analyzed, and the experimental results include qualitative and quantitative analyses to prove the advanced nature of the algorithm. Then, in order to verify the effectiveness of the method, adequate ablation experiments were performed.

4.1. Experiment Setup

Dataset: The training process was trained using the DTU dataset, which is a large MVS dataset consisting of 124 different objects or scenes; each object shoots a total of 49 viewing angles, and each angle has a total of 7 different brightness, so there are a total of 343 pictures inside each object or scene folder, and the dataset also has a training image set with the ground truth of surface frame values.
Sparse Point Selection: The triangular region constructed with sparse points for semi-supervised learning was defined to evaluate the reconstruction ability of the matching network so that the network can reconstruct the original 3D structure from a multi-view image. Therefore, in order to verify the effectiveness of our sparse, semi-supervised algorithm, we used sparse points with different density sizes in our evaluation tests. We randomly selected a certain proportion of 3D sparse points from each ground truth data point of surface frame value, namely 0.05 H · W and 0.15 H · W , which were the number of sparse points for supervision. The specific triangular region constructed by the sparse point is shown in Figure 4.
Training and Setting the Model: Before performing these processes, we learned the training methods [25,26] of other authors, and we used the size of 640 × 512 as input for training and testing to match the size of ground truth, which was selected by sparse points. Our proposed SGT-PatchMatchNet was implemented in PyTorch and trained on 1 NVIDIA GTX Titan Xp GPU. We used the Adam optimizer to achieve fast and stable gradient descent, setting the betas of the Adam optimizer to (0.9, 0.999) with a weight decay of 0.0. Our network was trained for 16 epochs with 2 images per batch size, and the initial learning rate was 0.001. In addition, the indicators for evaluating the quality of the network were basically trade-offs in accuracy and completeness, which could also be controlled by the parameters of the reconstruction.

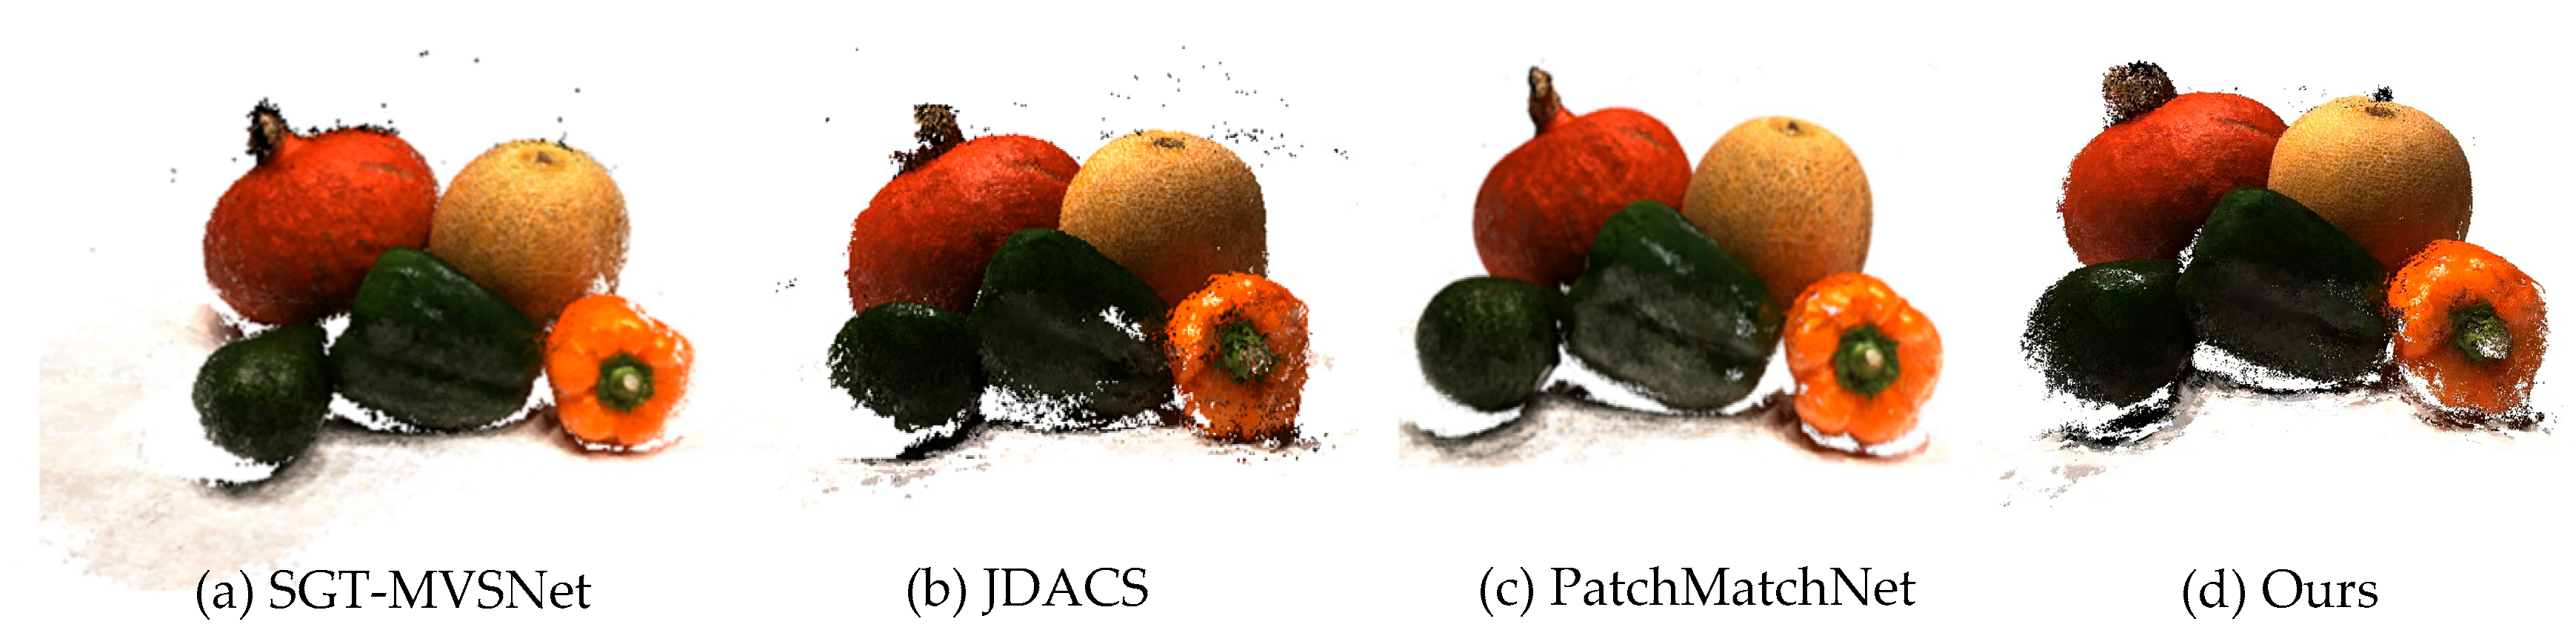
4.2. Comparative Experiment on DTU

We analyzed the 3D reconstruction of the structure of the object on four typical networks to verify the effectiveness of the SGT-PatchMatchNet network. As shown in Table 1, the JDACS network is an unsupervised learning network based on MVSNet, the SGT-MVSNet network is a semi-supervised network based on MVSNet, and PatchMatchNet is the network based on which our model was proposed, which is a supervised network. Our network is a semi-supervised learning model, so we compared it with PatchMatchNet to evaluate its performance. It should be noted that the figures in this section were generated using the MeshLab software, and because they illustrate a 3D display process, there may be angle problems when viewing the image again for comparison, so the position of the comparative pictures may be different. The comparison of various networks under the DTU dataset is shown in Figure 5.
As can be seen in Figure 5c, the supervised network is effective in terms of accuracy and completeness. Figure 5a shows that the rough outline can be reproduced using the semi-supervised model, but there are also deficiencies in accuracy. Figure 5b shows that the effectiveness of the unsupervised model is poor. Figure 5d shows that the effectiveness in accuracy and completeness is greatly improved using our model.
In order to further reflect the characteristics and the advanced nature of this algorithm, we evaluated the performance of the network, and the selected evaluation indicators were accuracy (Acc) and completeness (Comp). Accuracy is an important indicator for evaluating the matching network, and according to the comparison of multiple network experiments, the accuracy of the information can be derived from the accuracy of the network, and whether the edges of the reconstructed objects are blurred. Completeness is the distance from each point of the model for the structured light scan to the closest point of the reconstructed model. In the effective measurement region, comparing its completeness is an important indicator to evaluate the generalization ability of the matching network. The quantitative performance of each network on the DTU is shown in Table 1.
As we can see from the table, the supervised model has the best performance, followed by the semi-supervised model, and the unsupervised model has the worst performance for the traditional algorithm COLMAP; thus, we can see that the supervised model is superior in terms of accuracy, which is also a major feature of the traditional method. However, the overall performance level is not high, and our average indicators combined may be worse than some supervised networks or even lower than unsupervised networks. Therefore, as shown in the table, in which the prominent indicators are shown in bold, our network performs at about the same level as PatchMatchNet and outperforms advanced networks in integrity. In addition, under the same test conditions, we explored the test speed of each network, and it can be seen that our network is faster than PatchMatchNet in testing. As a result, we achieved effective solutions to existing problems, and when implemented, our model is superior to existing methods.

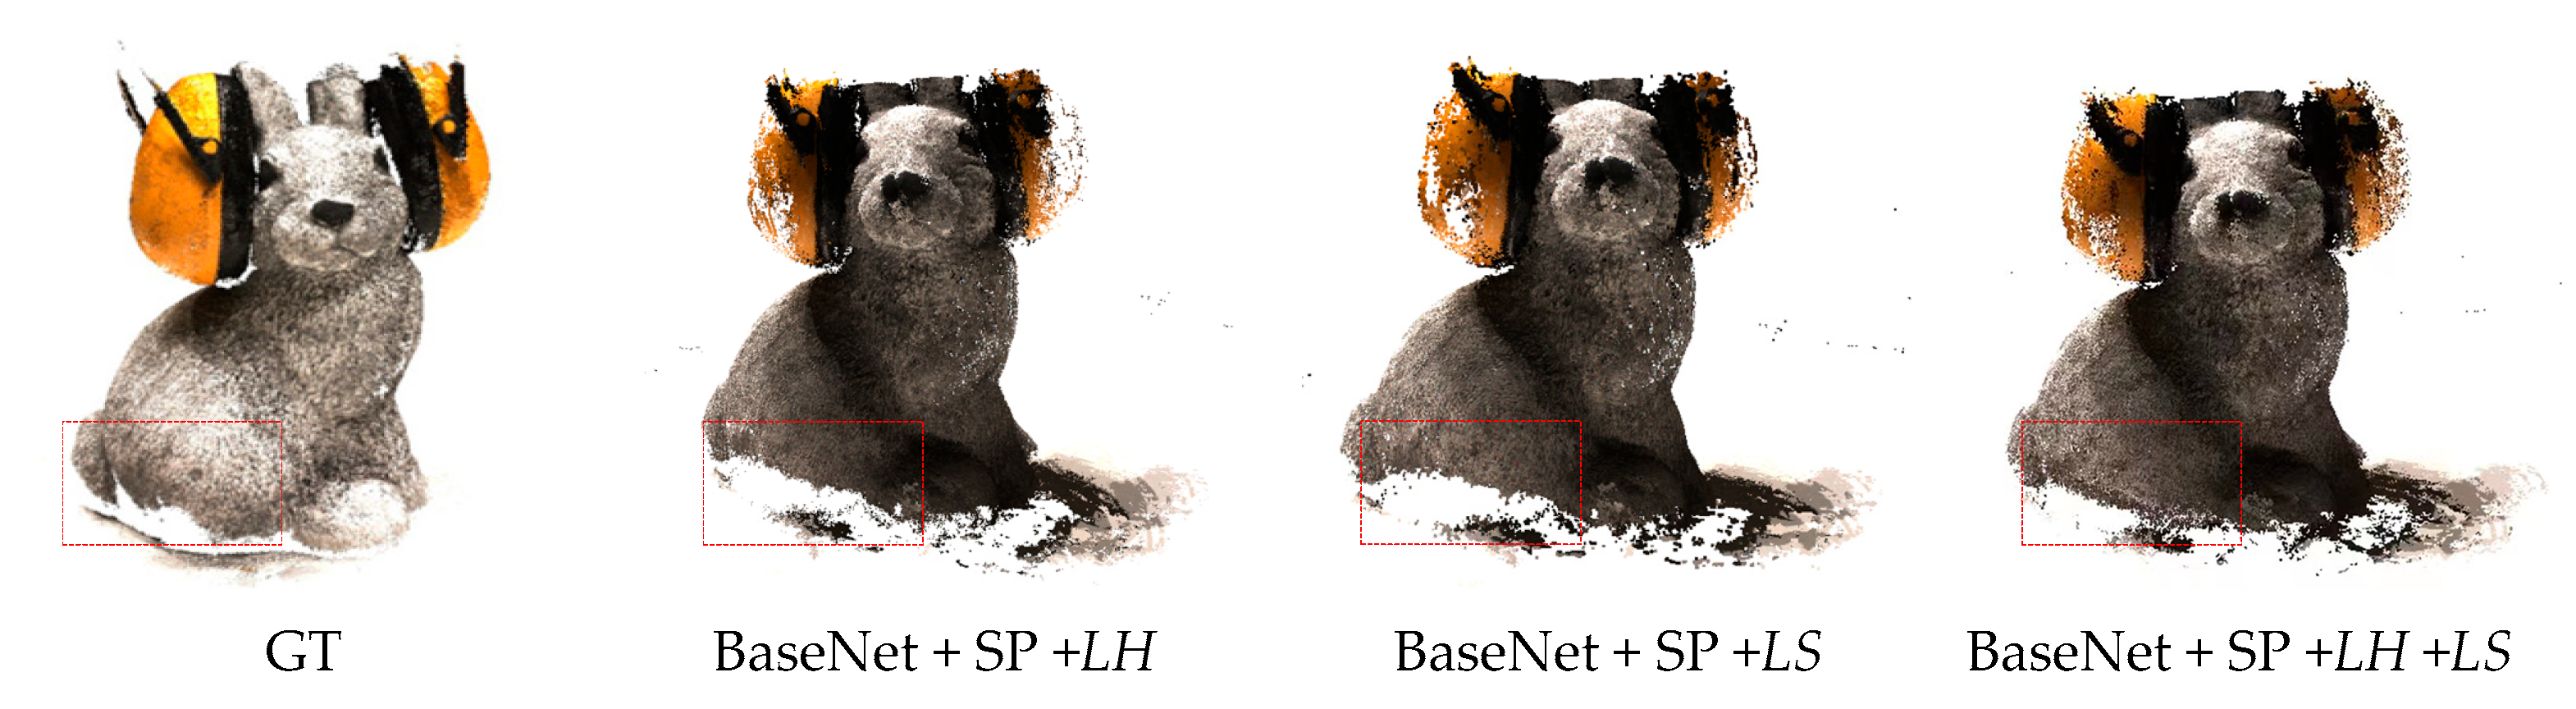
4.3. Ablation Studies
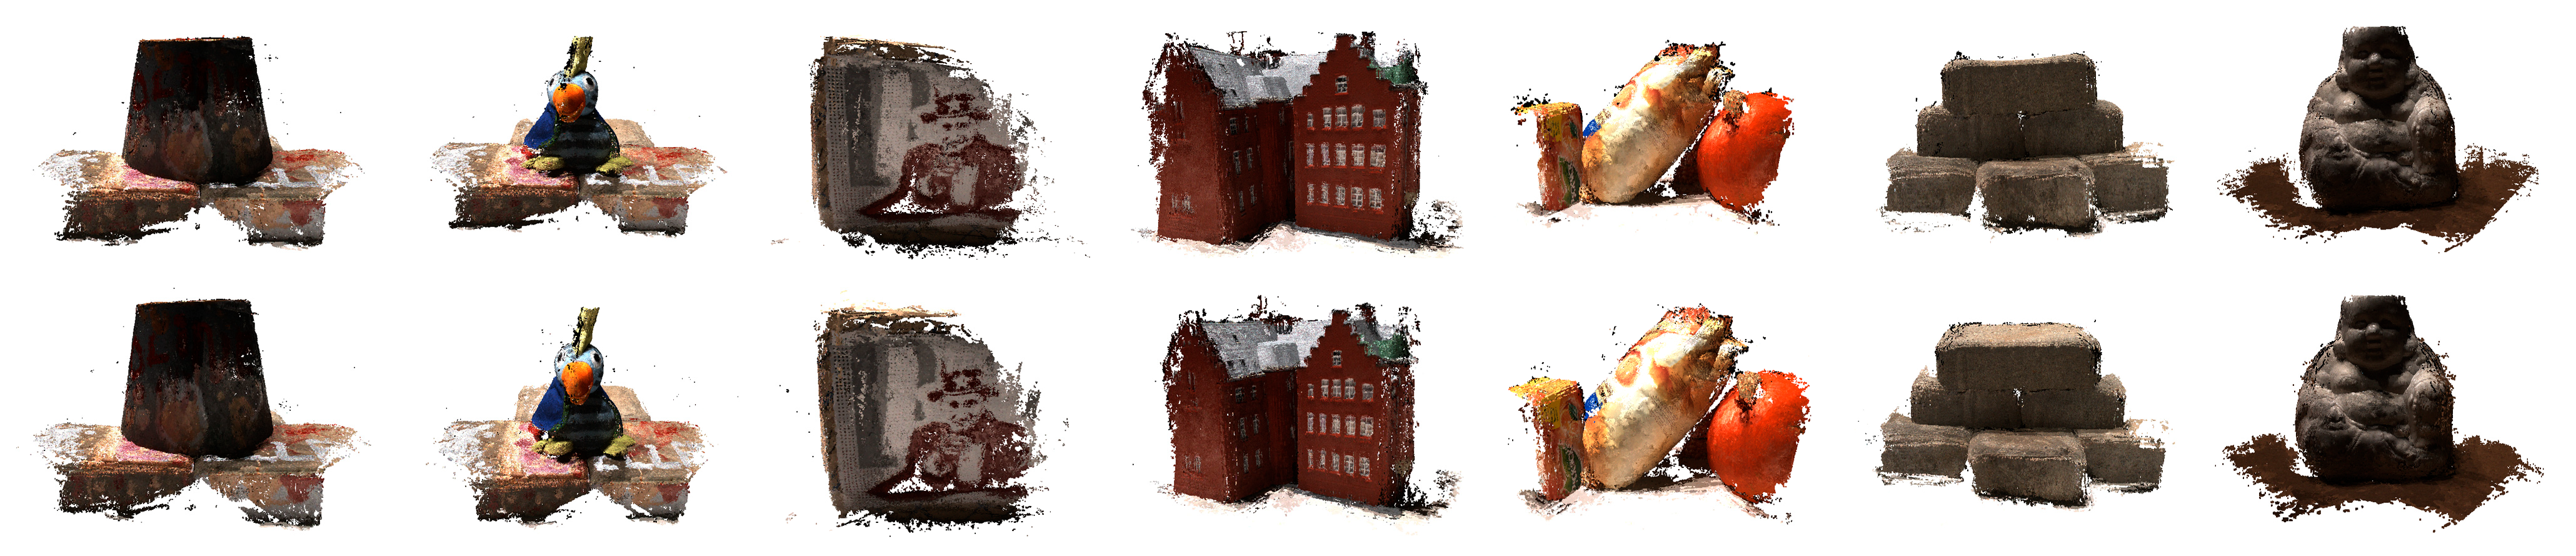
Effect of the loss function: In order to analyze the effectiveness and characteristics of the proposed method in this paper, ablation experiments were performed on the proposed loss function, the results of which are presented in this section. First, 0.05 H · W sparse points (SP) were selected, which was the same as in previous experiments, and the robust-point consistency loss ( L H ) and photometric similar-point loss ( L S ) were removed, and the loss was defined with corresponding weights λ 1 and λ 2 ; when we removed the λ 2 · L H , our loss was λ 1 · L S , and the loss value at this time was less, so in order to prevent the loss from becoming too small and thus affecting the experimental results, we removed weight λ 1 when performing the ablation experiment. In the same way, we removed λ 1 · L S and weight λ 2 . Finally, the experimental results were compared with those obtained using our complete network, and the specific comparison data are shown in Table 2.
As can be inferred from the table, our proposed loss function effectively contributes to improving network performance. In order to better display the effect, we compared the renderings, as shown in Figure 6. As can be seen from the comparison, the effect of our proposed loss function at the edge is also more prominent, which plays an important role in deriving a high-integrity image.
Effect of the Sparse Points: To verify whether different dense sparse points have an impact on the network, we tested with 0.05 H · W and 0.15 H · W sparse points. The specific performance results are shown in Table 3.
We can infer from the table that the density of sparse points does not have a great effect on the performance of the network, but the selection of sparse points does affect the operation time, so selecting a suitable sparse point for supervision can not only improve network performance but also reduce the operation time.
The effect of the training is shown in Figure 7. From the picture, it can be seen that the effect of the two is about the same, and in terms of performance indicators, a small number of sparse points may be slightly inferior to a large number of sparse points, but in terms of training speed, a small number of sparse points have a perfect advantage, so in this network, we selected a small number of sparse points to complete the supervision.
Performance loss curve in training: In order to confirm the validity of the loss function, we recorded the performance curve of the loss function during the ablation process, and the specific effect is shown in Figure 8.

4.4. Generalization

Compared with some photometric stereo methods of photometry [29,30,31,32,33], our method shows progress, and to further validate the generalization capabilities of our network, we directly tested the model trained on the DTU dataset without any additional fine-tuning. We used 6 scenes with an input size of 1920 × 1056 and 151 planes for testing. As shown in Figure 9, using our method, the 3D structures of the new domain were reasonably reconstructed, indicating the feasibility of its generalization.

5. Conclusions

In this paper, we proposed a sparse, semi-supervised network called SGT-PatchMatchNet based on the PatchMatchNet method. The network has a good performance in computing speed and memory consumption. At the same time, in order to reduce the error in the matching process of neighborhood points and solve the occlusion problem, we proposed a photometric similar-point loss function to force the neighborhood information to project the depth value of the predicted depth to meet the same 3D coordinates. In addition, in order to solve the problem of the blurred edges of the depth map obtained using the network model, we proposed a robust-point consistency loss function to improve the integrity and robustness of the occlusion area and the edge area. The experimental results show that compared with the existing unsupervised and semi-supervised matching networks, the proposed method improves by 22.87 % at the performance index and 14.19 % at the calculation speed. The effectiveness of the network was also demonstrated in the field of semi-supervision that we proposed. In the future, we plan to further optimize the model of the network to achieve better reconstruction results on weakly textured objects and transparent objects.

Author Contributions

Conceptualization, W.Z. and K.C.; methodology, K.C.; software, Y.C.; validation, W.Z., J.W. and Y.J.; formal analysis, Y.H.; investigation, K.C.; resources, W.Z.; data curation, Y.J.; writing—original draft preparation, K.C.; writing—review and editing, W.Z. and Y.J.; visualization, J.W.; supervision, K.C.; project administration, Y.H. All authors have read and agreed to the published version of the manuscript.

Funding

This research was funded by the Chongqing Nature Science Foundation: Research on Target Recognition Technology Based on Multi-source Image Fusion in Complex Environment, funding number: CSTB2022NSCQ-MSX1071.

Institutional Review Board Statement

Not applicable.

Informed Consent Statement

Not applicable.

Data Availability Statement

The data presented in this study are available on request from the corresponding author. The data are not publicly available due to the secret for the institute.

Conflicts of Interest

The authors declare no conflict of interest.

References

  1. Cernea, D. OpenMVS: Multi-view stereo reconstruction library. City 2020, 5, 7. [Google Scholar]
  2. Orsingher, M.; Zani, P.; Medici, P.; Bertozzi, M. Revisiting PatchMatch Multi-View Stereo for Urban 3D Reconstruction. In Proceedings of the 2022 IEEE Intelligent Vehicles Symposium (IV), Aachen, Germany, 4–9 June 2022; pp. 190–196. [Google Scholar]
  3. Ding, Y.; Zhu, Q.; Liu, X.; Yuan, W.; Zhang, H.; Zhang, C. KD-MVS: Knowledge Distillation Based Self-supervised Learning for Multi-view Stereo. In Proceedings of the European Conference on Computer Vision, Tel Aviv, Israel, 23–27 October 2022; pp. 630–646. [Google Scholar]
  4. Cheng, X.; Zhao, Y.; Raj, R.S.; Hu, Z.; Yu, X.; Yang, W. Local PatchMatch Based on Superpixel Cut for Efficient High-resolution Stereo Matching. Braz. Arch. Biol. Technol. 2022, 65. [Google Scholar] [CrossRef]
  5. Li, J.; Lu, Z.; Wang, Y.; Wang, Y.; Xiao, J. DS-MVSNet: Unsupervised Multi-view Stereo via Depth Synthesis. In Proceedings of the 30th ACM International Conference on Multimedia, New York, NY, USA, 10–14 October 2022; pp. 5593–5601. [Google Scholar]
  6. Zhai, X.; Oliver, A.; Kolesnikov, A.; Beyer, L. S4l: Self-supervised semi-supervised learning. In Proceedings of the IEEE/CVF International Conference on Computer Vision, Seoul, Republic of Korea, 27 October–2 November 2019; pp. 1476–1485. [Google Scholar]
  7. Hasnain, M.; Pasha, M.F.; Ghani, I.; Jeong, S.R. Simulated dataset collection method of dynamic quality of services (QoS) metrics. Int. J. Inf. Technol. 2021, 13, 889–895. [Google Scholar] [CrossRef]
  8. Liu, S.; Bonelli, W.; Pietrzyk, P.; Bucksch, A. Comparison of Open-Source Three-Dimensional Reconstruction Pipelines for Maize-Root Phenotyping. ESS Open Arch. 2022. [Google Scholar] [CrossRef]
  9. Shen, T.; Luo, Z.; Zhou, L.; Deng, H.; Zhang, R.; Fang, T.; Quan, L. Beyond Photometric Loss for Self-Supervised Ego-Motion Estimation. In Proceedings of the 2019 International Conference on Robotics and Automation (ICRA), Montreal, QC, Canada, 20–24 May 2019. [Google Scholar] [CrossRef] [Green Version]
  10. Duchi, J.; Hashimoto, T.; Namkoong, H. Distributionally robust losses for latent covariate mixtures. Oper. Res. 2022. [Google Scholar] [CrossRef]
  11. Wang, F.; Galliani, S.; Vogel, C.; Speciale, P.; Pollefeys, M. Patchmatchnet: Learned multi-view patchmatch stereo. In Proceedings of the IEEE/CVF Conference on Computer Vision and Pattern Recognition, Nashville, TN, USA, 20–25 June 2021; pp. 14194–14203. [Google Scholar]
  12. Yao, Y.; Luo, Z.; Li, S.; Fang, T.; Quan, L. Mvsnet: Depth inference for unstructured multi-view stereo. In Proceedings of the European Conference on Computer Vision (ECCV), Munich, Germany, 8–14 September 2018; pp. 767–783. [Google Scholar]
  13. Yao, Y.; Luo, Z.; Li, S.; Shen, T.; Fang, T.; Quan, L. Recurrent mvsnet for high-resolution multi-view stereo depth inference. In Proceedings of the IEEE/CVF Conference on Computer Vision and Pattern Recognition, Long Beach, CA, USA, 15–20 June 2019; pp. 5525–5534. [Google Scholar]
  14. Gu, X.; Fan, Z.; Zhu, S.; Dai, Z.; Tan, F.; Tan, P. Cascade cost volume for high-resolution multi-view stereo and stereo matching. In Proceedings of the IEEE/CVF Conference on Computer Vision and Pattern Recognition, Seattle, WA, USA, 13–19 June 2020; pp. 2495–2504. [Google Scholar]
  15. Yu, Z.; Gao, S. Fast-mvsnet: Sparse-to-dense multi-view stereo with learned propagation and gauss-newton refinement. In Proceedings of the IEEE/CVF Conference on Computer Vision and Pattern Recognition, Long Beach, CA, USA, 15–20 June 2019; pp. 1949–1958. [Google Scholar]
  16. Luo, K.; Guan, T.; Ju, L.; Huang, H.; Luo, Y. P-mvsnet: Learning patch-wise matching confidence aggregation for multi-view stereo. In Proceedings of the IEEE/CVF International Conference on Computer Vision, Seoul, Republic of Korea, 27 October–2 November 2019; pp. 10452–10461. [Google Scholar]
  17. Khot, T.; Agrawal, S.; Tulsiani, S.; Mertz, C.; Lucey, S.; Hebert, M. Learning unsupervised multi-view stereopsis via robust photometric consistency. arXiv 2019, arXiv:1905.02706. [Google Scholar]
  18. Dai, Y.; Zhu, Z.; Rao, Z.; Li, B. MVS2: Deep Unsupervised Multi-View Stereo with Multi-View Symmetry. In Proceedings of the 2019 International Conference on 3D Vision (3DV), Quebec City, QC, Canada, 16–19 September 2019; pp. 1–8. [Google Scholar] [CrossRef] [Green Version]
  19. Huang, B.; Yi, H.; Huang, C.; He, Y.; Liu, J.; Liu, X. M3VSNET: Unsupervised Multi-Metric Multi-View Stereo Network. In Proceedings of the 2021 IEEE International Conference on Image Processing (ICIP), Anchorage, AK, USA, 19–22 September 2021; pp. 3163–3167. [Google Scholar] [CrossRef]
  20. Xu, H.; Zhou, Z.; Qiao, Y.; Kang, W.; Wu, Q. Self-supervised Multi-view Stereo via Effective Co-Segmentation and Data-Augmentation. Proc Conf AAAI Artif Intell 2021, 35, 3030–3038. [Google Scholar] [CrossRef]
  21. Kim, T.; Choi, J.; Choi, S.; Jung, D.; Kim, C. Just a Few Points are All You Need for Multi-view Stereo: A Novel Semi-supervised Learning Method for Multi-view Stereo. In Proceedings of the IEEE/CVF International Conference on Computer Vision, Montreal, BC, Canada, 11–17 October 2021; pp. 6158–6166. [Google Scholar] [CrossRef]
  22. Wang, Y.; Wang, L.; Yang, J.; An, W.; Guo, Y. Flickr1024: A Large-Scale Dataset for Stereo Image Super-Resolution. In Proceedings of the IEEE/CVF International Conference on Computer Vision Workshops, Seoul, Republic of Korea, 7–28 October 2019; pp. 3852–3857. [Google Scholar] [CrossRef]
  23. Aanæs, H.; Jensen, R.R.; Vogiatzis, G.; Tola, E.; Dahl, A.B. Large-Scale Data for Multiple-View Stereopsis. Int. J. Comput. Vis. 2016, 120, 153–168. [Google Scholar] [CrossRef] [Green Version]
  24. Knapitsch, A.; Park, J.; Zhou, Q.Y.; Koltun, V. Tanks and temples: Benchmarking large-scale scene reconstruction. ACM Trans. Graph. (ToG) 2017, 36, 1–13. [Google Scholar] [CrossRef]
  25. Kaneda, A.; Nakagawa, T.; Tamura, K.; Noshita, K.; Nakao, H. A proposal of a new automated method for SfM/MVS 3D reconstruction through comparisons of 3D data by SfM/MVS and handheld laser scanners. PLoS ONE 2022, 17, e0270660. [Google Scholar] [CrossRef] [PubMed]
  26. Ding, Y.; Yuan, W.; Zhu, Q.; Zhang, H.; Liu, X.; Wang, Y.; Liu, X. Transmvsnet: Global context-aware multi-view stereo network with transformers. In Proceedings of the IEEE Conference on Computer Vision and Pattern Recognition, New Orleans, LA, USA, 19–20 June 2022; pp. 8585–8594. [Google Scholar]
  27. Mallick, A.; Stückler, J.; Lensch, H. Learning to adapt multi-view stereo by self-supervision. arXiv 2020, arXiv:2009.13278. [Google Scholar]
  28. Xu, H.; Zhou, Z.; Wang, Y.; Kang, W.; Sun, B.; Li, H.; Qiao, Y. Digging into uncertainty in self-supervised multi-view stereo. In Proceedings of the IEEE/CVF International Conference on Computer Vision, Montreal, BC, Canada, 11–17 October 2021; pp. 6078–6087. [Google Scholar]
  29. Kaya, B.; Kumar, S.; Oliveira, C.; Ferrari, V.; Van Gool, L. Uncalibrated neural inverse rendering for photometric stereo of general surfaces. In Proceedings of the IEEE/CVF Conference on Computer Vision and Pattern Recognition, Nashville, TN, USA, 20–25 June 2021; pp. 3804–3814. [Google Scholar]
  30. Ju, Y.; Shi, B.; Jian, M.; Qi, L.; Dong, J.; Lam, K.M. NormAttention-PSN: A High-frequency Region Enhanced Photometric Stereo Network with Normalized Attention. Int. J. Comput. Vis. 2022, 130, 3014–3034. [Google Scholar] [CrossRef]
  31. Honzátko, D.; Türetken, E.; Fua, P.; Dunbar, L.A. Leveraging Spatial and Photometric Context for Calibrated Non-Lambertian Photometric Stereo. In Proceedings of the International Conference on 3D Vision (3DV), London, UK, 1–3 December 2021; pp. 394–402. [Google Scholar]
  32. Jian, M.; Dong, J.; Gong, M.; Yu, H.; Nie, L.; Yin, Y.; Lam, K.-M. Learning the Traditional Art of Chinese Calligraphy via Three-Dimensional Reconstruction and Assessment. IEEE Trans. Multimed. 2019, 22, 970–979. [Google Scholar] [CrossRef] [Green Version]
  33. Karami, A.; Menna, F.; Remondino, F. Combining Photogrammetry and Photometric Stereo to Achieve Precise and Complete 3D Reconstruction. Sensors 2022, 22, 8172. [Google Scholar] [CrossRef] [PubMed]
Figure 1. The overall framework of SGT-PatchMatchNet. Our framework mainly consists of a feature extraction network, two subnetworks, and an optimization network.
Photonics 09 00983 g001
Figure 2. A subnetwork SparsePatchMatch. Our main contribution is to process subsequent depth maps for semi-supervised testing with photometric similar-point loss and robust-point consistency loss.
Photonics 09 00983 g002
Figure 3. Photometric similar-point loss: (a) a pirate point was selected on the source image; (b) the depth map obtained with the network was compared with the depth map constructed using sparse points; (c) optimized density depth map. The green line represents the success of the similarity match, and the red line represents failure of the similarity match.
Photonics 09 00983 g003
Figure 4. Triangular region constructed by sparse points: (a) visualization of a sparse triangular area constructed from 0.05 H · W sparse points; (b) visualization of a dense triangular area constructed from 0.15 H · W sparse points.
Photonics 09 00983 g004
Figure 5. Comparative experiment of the effects of four networks: (a) semi-supervised rendering; (b) unsupervised rendering; (c) supervised rendering; (d) our rendering.
Photonics 09 00983 g005
Figure 6. Comparison of effects after ablation.
Photonics 09 00983 g006
Figure 7. Effect comparison. The above image is the effect of the training of 0.05 H · W sparse points. The below image is the effect of the training of 0.15 H · W sparse points.
Photonics 09 00983 g007
Figure 8. Loss function performance curve: (a) the curve of L H ; (b) the curve of L S ; (c) the curve of loss. The loss value for each pass is the average after training all images.
Photonics 09 00983 g008
Figure 9. Qualitative results of the intermediate set in the Tanks&Temples dataset.
Photonics 09 00983 g009
Table 1. Qualitative comparison table of each comparison algorithm in DTU. ✗ is unsupervised. ✓ is supervised. ☑ is semi-supervised.
MethodSupervisedTesting Speed (n/s)Acc (mm)Comp (mm)Overall (mm)
COLMAP [8]--0.4000.6640.532
MVS2 [18]521,980.7600.5150.637
Meta-MVSNet [27]503.260.5940.7790.687
M3VSNet [19]492.760.6360.5310.583
JDACS [20]485.780.5710.5150.543
U-MVSNet [28]481.310.4700.4300.450
SGT-MVSNet [21]454.670.4410.3810.411
PatchMatchNet [11]492.520.4270.2770.352
Ours418.350.4450.2670.356
Table 2. The effect of each ablation process on the matching results.
MethodAcc (mm)Comp (mm)Overall (mm)
BaseNet+SP+LH0.4820.3240.403
BaseNet+SP+LS0.4780.3110.395
BaseNet+SP+LH+LS (ours)0.4450.2670.356
Table 3. Comparison table of the impact of different dense sparse points on network performance.
MethodGround TruthTesting Speed (n/s)Acc (mm)Comp (mm)Overall (mm)
SGT-
PatchMatchNet
Sparse1
0.05 H · W
418.350.4450.2670.356
Sparse2
0.15 H · W
438.870.4330.2590.346
Publisher’s Note: MDPI stays neutral with regard to jurisdictional claims in published maps and institutional affiliations.

