Article

Detection of Changes in Macrophage Polarization as a Result of 5-Aminolevulinic Acid Photodynamic Therapy Using Fluorescence-Lifetime Imaging Microscopy

1
Prokhorov General Physics Institute of the Russian Academy of Sciences, 119991 Moscow, Russia
2
Institute for Physics and Engineering in Biomedicine, National Research Nuclear University MEPhI, 115409 Moscow, Russia
*
Author to whom correspondence should be addressed.
Photonics 2022, 9(12), 961; https://doi.org/10.3390/photonics9120961
Submission received: 2 November 2022 / Revised: 6 December 2022 / Accepted: 6 December 2022 / Published: 10 December 2022
(This article belongs to the Topic Biomedical Photonics)

Abstract

:
Non-invasive detection of polarized macrophages in tumors is an urgent task in terms of combined antitumor therapy. By analyzing the fluorescence lifetime of the metabolic cofactors—the reduced form of nicotinamide adenine dinucleotide (NADH) and flavins—differences in cellular metabolism of normal tissue, tumor, inflammatory and anti-inflammatory macrophages were demonstrated. In this work we studied changes in the polarization of macrophages obtained from THP-1 monocytes in response to photodynamic therapy with 5-aminolevulinic acid (ALA–PDT). Moderate ALA–PDT in vitro led to changes in M0 macrophages metabolism towards M1 polarization, wherein M1 and M2 macrophages died and were replaced by non-polarized cells. The interstitial distribution of polarized macrophages after ALA–PDT was studied in a mouse tumor model of grafted Lewis lung carcinoma. In response to ALA–PDT, there was an increase in the inflammatory macrophages fraction in the tumor node. Metabolic fluorescence-lifetime imaging microscopy (FLIM) was performed for macrophages in vitro and for tumor cryosections. It was shown that analysis of phasor diagrams for the NADH, flavins, and 5-ALA-induced protoporphyrin IX (PpIX) fluorescence lifetime helps to determine the change in metabolism in response to different modes of PDT at the cellular and tissue levels. These data can be used for post-surgery tissue inspection.

1. Introduction

The tumor immune microenvironment is represented by a large number of myeloid cells in various states, performing a variety of functions. Among myeloid cells, much attention has been paid to tumor-associated macrophages (TAM) [1] and myeloid-derived suppressor cells (MDSC) [2] because of their ability to both initiate and suppress the antitumor immune response [3]. In the tumor, TAMs with M2 polarization, which contribute to the progression of the tumor, are predominant [4,5]. To adapt to the reduced availability of nutrients and oxygen in the tumor microenvironment and the increased demands for energy and building blocks needed to maintain their high proliferation rate, malignant cells undergo metabolic changes. TAMs must also reprogram their metabolism to activate glycolysis, fatty acid synthesis, and altered nitrogen cycle metabolism in order to enhance their protumor potential and bypass therapy resistance [6]. TAMs exhibit complex patterns of metabolic changes that do not correspond to a strict M1 or M2 phenotype. In general, TAMs show an increased level of glycolysis, which correlates with a pro-inflammatory phenotype [7]. However, it should be kept in mind that TAMs may have different metabolic programs and phenotypes within the same tumor, depending on the region in which they are present and on the environmental stresses they face, such as hypoxia. The cellular transformation mechanism may be associated with the fact that TAMs, in order to maintain their activity, use non-mitochondrial type of aerobic glycolysis, in contrast to M1 macrophages [8].
Fluorescence imaging is an inevitable research tool for studying various metabolites in cells and tissues, including pigments. These fluorescent metabolites can be detected and visualized using their own fluorescence (for example, using confocal fluorescence microscopy) [9,10] or using FLIM, which is an advanced version of confocal fluorescence microscopy based on fluorescence time decay differences [11]. Changes in cellular metabolism can be studied both using the gene activity analysis [12] and measuring the metabolic cofactors’ fluorescence lifetime [13]. For example, binding of NADH to respiratory chain proteins during OXPHOS increases the proportion of the protein-bound enzyme, which has a longer fluorescence lifetime, while a decrease in protein-bound NADH and an increase in free NADH during anaerobic glycolysis causes a shortening of the fluorescence lifetime [14].
Metabolic indices, such as optical redox ratio (RR = intensity of NAD(P)H/intensity of FAD), NADH a1/a2 or FLIRR (FLIM redox ratio = NADHa2%/FADa1%), calculated from time-resolved autofluorescence images allow non-invasive metabolism determination of cells and tissues at the cellular level [15]. Thus, using the optical redox ratio, a difference in the polarization and metabolism of macrophages in a tumor [16] and macrophages in a healing wound [17] was demonstrated. It has been shown that during anaerobic glycolysis, the NADH a1/a2 [18], as well as RR [19] increased. RR increases with tumor status, but decreases after chemotherapy, and these differences make it possible to estimate the effectiveness of neoadjuvant treatment [20].
Photodynamic therapy (PDT) is a non-invasive treatment for solid tumors that works both through direct cancer cells phototoxicity and through the immune system modulation [21]. PDT is based on the formation of a large number of reactive oxygen species (ROS) during laser irradiation of tissues that have accumulated photosensitizer (PS) molecules [22,23]. Methods that allow using PDT to influence the immune environment of the tumor have been developed recently [24]. Macrophages play an important role in the tumor response to PDT due to their properties, including PS accumulation, development of an acute inflammatory response, utilization of dead tumor cells, presentation of tumor antigens, and stimulation of tumor restoration. Changing the TAMs polarization to the pro-inflammatory M1 phenotype is a promising therapeutic solution for various cancer types [25]. A possible advantage of PDT is the selective destruction of resident M2 TAMs in the tumor and their replacement with newly invading macrophages of monocytic (bone marrow) origin, which polarize into the pro-inflammatory M1 phenotype [26].
In this work, the possibility of changing the balance of M1/M2 macrophages using ALA–PDT was investigated. The 5-ALA-induced PpIX is produced in mitochondria in the cascade of heme synthesis reactions [27]. For the synthesis of one PpIX molecule, eight molecules of 5-ALA are required; separate stages of heme synthesis are catalyzed by several enzymes, among which are ferrochelatase and porphobilinogen deaminase. Porphobilinogen deaminase catalyzes the deamination of porphobilinogen monomer and its subsequent polymerization to linear tetrapyrrole. The activity of porphobilinogen deaminase increases in tumor cells, so PpIX accumulates more intensively in target tumor cells compared to normal cells [28]. Ferrochelatase catalyzes the final stage of heme biosynthesis by converting protoporphyrin IX to heme B. On the contrary, ferrochelatase in tumor cells acts slowly; the addition of a large amount of 5-ALA to the medium leads to excessive formation of PpIX, and, as a result, to increased accumulation of the chromophore in cells [29]. PpIX accumulates and persists in a significant amount in the tumor for 2–4 h, after which its level in the tumor rapidly decreases, reaching the initial values after about 24 h, while in normal cells it quickly turns photoinactive [30]. However, after the 5-ALA application, other metabolites, such as uroporphyrin [31] and coproporphyrin [32], can form in cells. The tumor specificity of 5-ALA reaches 87% [33]. Additionally, the accumulation of PpIX in cells depends on their metabolic activity, which can lead to selective accumulation of PpIX within the cell population with different severity of dysfunctions.
ALA–PDT has been shown to induce an antitumor immune response through molecular patterns associated with dangerous damage signals (DAMPs). DAMPs activate dendritic cells, including their phenotypic and functional maturation [34]. An increased content of dendritic cells, as well as M1 macrophages, in the tumor correlates with a better prognosis.
We investigated the ability of ALA–PDT to change the interstitial macrophages ratio towards an increase in the fraction of M1-polarized macrophages. Experimental autofluorescence lifetime data are presented to evaluate changes in metabolism in response to different ALA–PDT regimens for polarized macrophage culture in vitro and for a transplanted mouse model of Lewis lung carcinoma in vivo. The data were compared with immunofluorescence staining of cryosections for the presence of polarized macrophages. In addition, the M1/M2 macrophage ratio and the metabolic index NADH a1/a2 were studied at the tissue level.

2. Materials and Methods

2.1. Obtaining Polarized Macrophages from Human Monocyte Culture THP-1

THP-1 monocyte cell line [35] and the technique of their polarization [36] were used. Cells were grown in RPMI-1640 medium (Gibco, UK) supplemented with 10% fetal bovine serum (FBS, BioSera, Nuaille, France), 100 U/mL penicillin and 100 μg/mL streptomycin (Life Technologies, Carlsbad, CA, USA), 2 mM glutamine (Life Technologies, Carlsbad, CA, USA) and 1 mM sodium pyruvate (Life Technologies, Carlsbad, CA, USA) in standard conditions (37 °C, 5% CO2) in suspension at densities from 105 to 8 × 10⁵ cells/mL. Differentiation of THP-1 monocytes into adherently growing macrophages (M0) was achieved by seeding on a coverglass bottom dish with 105 cells/mL in the presence of 150 nM phorbol-12-myristate-13-acetate (PMA) for 24 h. After 48 h of PMA incubation, human recombinant gamma interferon (IFN-γ, 20 ng/mL, Sigma-Aldrich, St. Louis, MO, USA) and lipopolysaccharide (LPS, 100 ng/mL, Sigma-Aldrich, St. Louis, MO, USA) were added for M1 polarization; human recombinant interleukin-4 (IL-4, 20 ng/mL, Sigma-Aldrich, St. Louis, MO, USA) and human recombinant interleukin-13 (IL-13, 20 ng/mL, Sigma-Aldrich, St. Louis, MO, USA) were added for M2-polarization, respectively.

2.2. Determination of 5-ALA-Induced PpIX Accumulation in Macrophage Cultures

A solution for addition to the culture medium was prepared from 10 mg/mL 5-ALA (Alasens, NIOPIK, Moscow, Russia) diluted 100-fold in saline. Its pH was adjusted to 7.0 with 1 M NaOH. 5-ALA was added to the culture medium at a concentration of 100 mg/kg and incubated at 37 °C, 5% CO2.
Spectrally resolved fluorescence images were recorded using a laser scanning confocal inverted microscope LSM-710-NLO (Carl Zeiss AG, Oberkochen, Germany). PpIX fluorescence was excited by a 561 nm 20 mW DPSS laser (LASOS Lasertechnik GmbH, supplied by Carl Zeiss AG, Oberkochen, Germany), and the fluorescence signal was recorded in the 570–750 nm spectral range. To obtain statistically significant results, we performed mathematical processing of the obtained images. Contours of more than 50 cells were distinguished in the images obtained under the same conditions, and the average value of PpIX intensity was obtained for each cell. The cells in the image focus that did not overlap with the image border were selected for analysis.
Open-source image classification and segmentation software ilastik (https://www.ilastik.org, GNU General Public License, accessed on 11 October 2021) was used for image processing [37]. We performed segmentation (searching for the boundaries of individual cells in the transmitted light image channel) and then quantified the accumulation of PpIX by fluorescence intensity for each isolated cell. This was compared with the intensity of PpIX solutions of known concentration in DMSO.

2.3. ALA PDT Procedure on Cells In Vitro

The incubation time of 5-ALA in concentrations of 10 and 100 mg/kg before irradiation was 4 h. For all types of macrophage polarization—M0, M1 and M2—the following PDT regimens were used: (1) 5-ALA 100 mg/kg, 5 J/cm2 irradiation; (2) 5-ALA 10 mg/kg, 50 J/cm2 irradiation; (3) 5-ALA 10 mg/kg, 5 J/cm2 irradiation. Irradiation was performed with a 635 nm laser at a power density of 280 mW/cm2. Intact cells that were not incubated with 5-ALA and without irradiation served as control.

2.4. ALA–PDT Procedure on Tumor Model In Vivo

The Lewis lung carcinoma (LLC) cell line of C57BL strain was used in experiments in vivo and in vitro. The LLC cells were plated at a seeding density of 3 × 10⁵ cells/cm2 in the T-25 flask. The cells were maintained in RPMI-1640 medium supplemented with 2 mM L-glutamine and 10% fetal bovine serum (FBS, BioSera, Nuaille, France) at 37 °C in a humidified atmosphere with 5% CO2. The culture medium was changed 2–3 times per week.
Experiments with mice were performed at the N.N. Blokhin National Medical Research Center of Oncology. Male BALB/c mice that were 25–30 g, 8–10 weeks old were obtained from the Pushchino nursery (Russia). The mice were kept in standard cages at 21 °C. The photoperiod was 12 h of light and 12 h of dark per day. The animals had access to standard laboratory feed and water ad libitum. Tumor grafting was performed by subcutaneous inoculation of mice with LLC cell culture on the right hind paw (50 µL of a 15% tumor cell suspension in Hanks’ Balanced Salt Solution). Tumor growth was assessed on days 6, 8, 10 and 14 after LLC cells injection by the measurement of two bisecting diameters in each tumor using calipers. The size of the tumor was determined by direct measurement of the tumor dimensions. The volume was calculated according to the equation: V = (L × W2) × 0.5, where V = volume, L = length and W = width. Six experimental groups of tree animals each were formed once the tumors attained an average volume of 100–150 mm3.
Two hundred microliters of 5-ALA (based on the total dose in the animal 10 and 100 mg/kg [0.06 mM and 0.6 mM] in physiological solution was administered intravenously 4 h before PDT. The control group received an equivalent amount of physiological solution. Measurement of the 5-ALA-induced PpIX accumulation in tumors was determined by diffuse-reflected fluorescence spectra using a LESA-01-Biospec fiber optic spectrometer and 635 nm laser excitation (BIOSPEC Ltd, Moscow, Russia). Mice were irradiated with 635 nm laser at power density 100 mW/cm2 and doses 50 J/cm2 and 10 J/cm2 (500 s and 100 s, correspondingly).
Mice were euthanized three days post PDT. Tumors along with subcutaneous tissue, skin and muscle were excised en bloc and frozen. Sections of 50 µm thickness were prepared using a freezing microtome Microm HM 560 Cryostat (Thermo Scientific, Waltham, MA, USA) and were further processed for the FLIM procedure and immunofluorescent staining. For the FLIM procedure, the sections were placed in saline under a coverslip and examined immediately.

2.5. FLIM Procedure

The spectra and time-resolved images of autofluorescence and PpIX fluorescence were recorded under two-photon 740 nm excitation with a Chameleon Ultra II femtosecond laser (Coherent, Saxonburg, PA, USA) tunable in the 690–1060 nm range, with pulse width 140 fs, repetition rate 80 MHz. Fluorescence lifetime recording was performed using the FLIM module (Becker & Hickl GmbH, Berlin, Germany) attached to the LSM-710-NLO consisting of a time-correlated single photon counting system (TCSPC) SPC-150, a GaAsP HPM-100-07 hybrid photodetector, and SPCM software. The Plan-Apochromat 63×/1.4 Oil objective (Carl Zeiss AG, Oberkochen, Germany) was used. The FWHM of the TCSPC instrument response function (IRF) was <20 ps (Transit Time Spread, with SPC-150). Bandpass filters upstream of the FB450-40 (Thorlabs, Newton, NJ, USA), FB550-40 (Thorlabs, Newton, NJ, USA), and BP 640/30 (Carl Zeiss AG, Oberkochen, Germany) time-resolved detector were used to isolate fluorescence signals from NADH, flavins, and PpIX, respectively. Time-resolved fluorescence images were processed using SPCImage 8.0 software (Becker & Hickl GmbH, Berlin, Germany). To interpret the time-resolved fluorescence from different spectral ranges corresponding to NADH, flavins, and PpIX highlighting, a phasor diagram approach was applied, where the fluorescence lifetime is stated in a frequency representation [38]. KernelDensity and Makie libraries of the Julia programming language were used to construct the phasor diagrams. The phasor diagram represents the fluorescence decay curve in terms of phase parameters G (x axis) and S (y axis)—real and imaginary parts of the first element in the Fourier series of the repeating decay signal. The distributions were obtained using kernel-density estimation weighted by pixel intensity. The semicircle on the phasor diagram represents the values for monoexponential decay. The points inside the semicircle are a superposition of several lifetimes, and the points outside the circle represent subexponential decay possibly due to the long lifetime decay curve overlap.
In calculating the NADH a1/a2 metabolic index, kinetics were approximated using fixed lifetimes: NADH τ1 = 0.4 ns, τ2 = 2.5 ns; FAD τ1 = 0.25 ns, τ2 = 1.4 ns and τ3 = 5.0 ns [39]. Approximation examples for one M0 macrophages cell are shown in Figure 1. The NADH fluorescence lifetime curve fitting is two-component. The FAD fluorescence lifetime curve fitting is three-component.

2.6. Immunofluorescent Staining

CD86/CD206 antibody staining was used to assess changes in the M1/M2 phenotype of macrophages polarized from THP-1. Cells were fixed for 10 min with 4% paraformaldehyde in cold PBS, washed three times with 5% PBS-FBS, and incubated for 3 h at room temperature with primary antibodies diluted in 5% PBS-FBS anti-human CD86 Antibody Mouse IgG1 (374202, BioLegend, San Diego, CA, USA) and APC anti-human CD206 Antibody (321109, BioLegend, USA). The cells were washed three times with 5% PBS-FBS and then incubated for 1 h with the secondary antibody anti-mouse IgG1 conjugated with Alexa Fluor-488 (406626, BioLegend, San Diego, CA, USA). A 1 μg/mL DAPI was added 10 min before the end of secondary antibody incubation. The cells were then washed three times with PBS, placed under coverslips in Mowiol (Sigma-Aldrich, St. Louis, MO, USA).
Frozen mouse tumor sections were stained with CD86/CD163 antibodies. The sections were fixed for 10 min in acetone at −20 °C, dried, and stored at +4 °C. They were washed twice with PBS, permeabilized with 0.5% Tween 20 for 10 min, washed twice with PBS, and incubated for 30 min in 5% PBS-FBS blocking buffer. Then, they were incubated for 2 h at room temperature with primary antibodies diluted in 5% PBS-FBS anti-mouse CD86 Antibody Rat IgG2a (105001, BioLegend, San Diego, CA, USA) and anti-mouse CD163 Antibody Rat IgG2a (155302, San Diego, CA, BioLegend). Sections were washed three times with 5% PBS-FBS and then incubated for 1 h with Chicken anti-Rat IgG secondary antibody conjugated with Alexa Fluor 647 (A21472, BioLegend, San Diego, CA, USA). A 1 μg/mL DAPI was added 10 min before the end of secondary antibody incubation. Then, the sections were washed three times with PBS and placed under coverslips in Mowiol. The staining result was viewed using a confocal microscope. For each animal in the experimental point, data were averaged over 5 images of 425 × 425 μm.

3. Results

3.1. Accumulation of 5-ALA-Induced PpIX in Polarized Macrophages

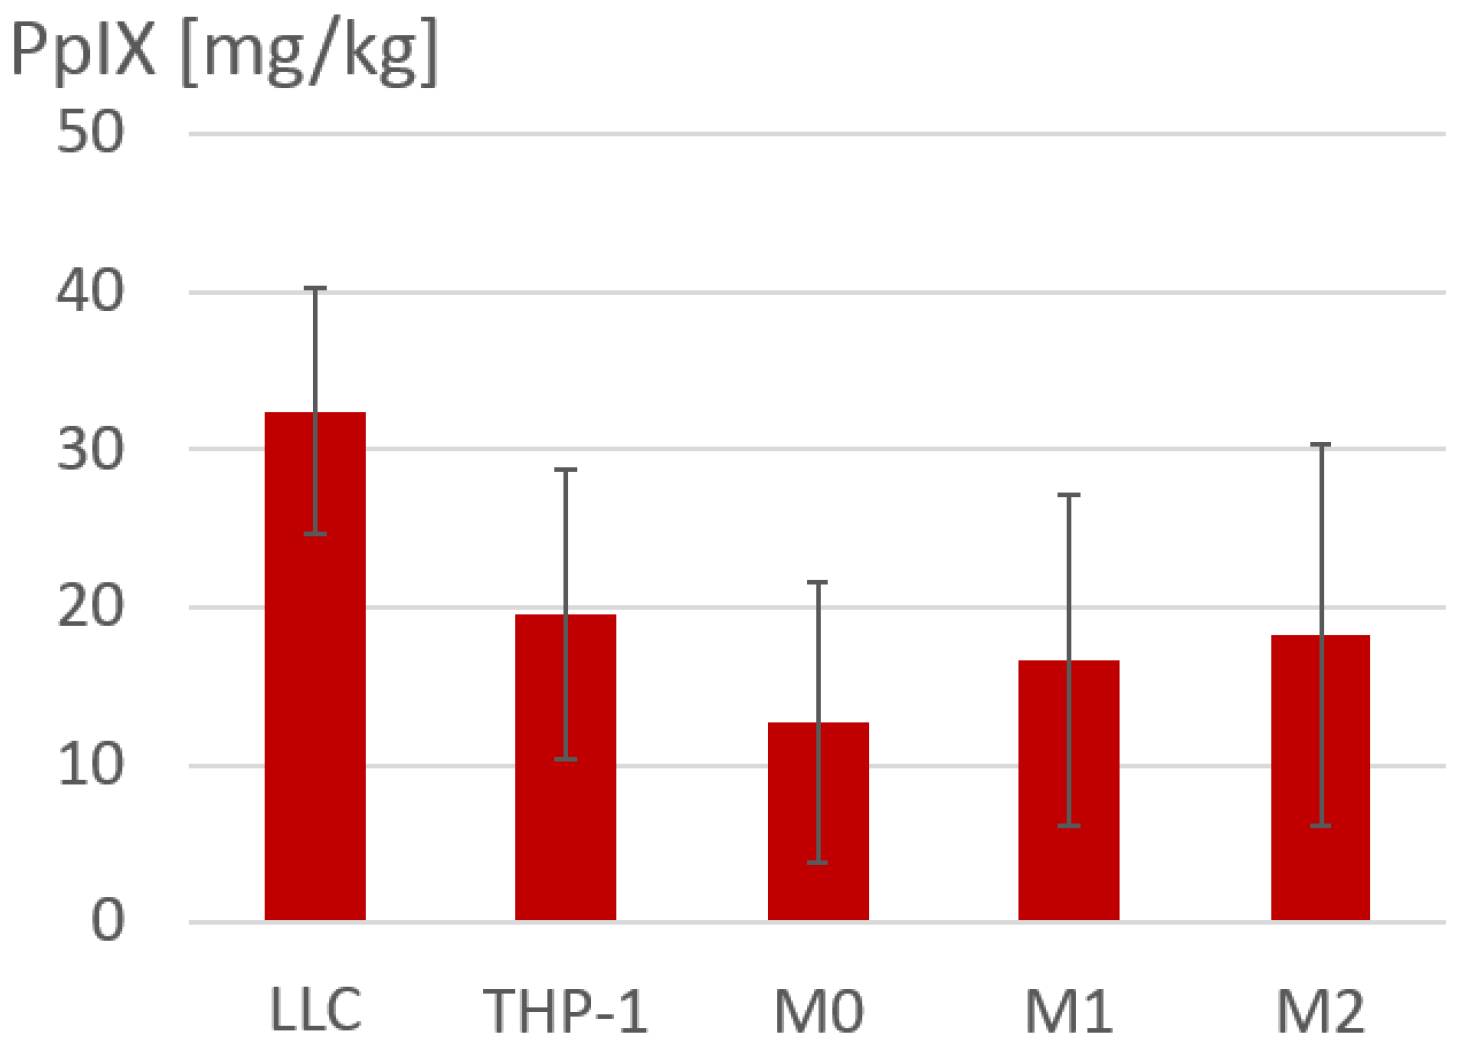
The accumulation of PpIX after 4 h of incubation with 0.6 mM 5-ALA in polarized macrophages and tumor cells was assessed by fluorescence spectra. The highest amount of PpIX was recorded in LLC tumor cell culture, 32.4 ± 7.8 mg/kg, followed by THP-1 (19.5 ± 9.2 mg/kg), M2 (18.2 ± 12.1 mg/kg), M1 (16.7 ± 10.5 mg/kg), and nonpolarized M0 macrophage (12.7 ± 8.9 mg/kg) cultures (Figure 2). It is worth noting the standard deviation is high for PpIX accumulation in polarized macrophages. This is due to the large heterogeneity of accumulation across the cell’s population. Despite specific activation by minimal amounts of cytokines, cells within the same subpopulation are very heterogeneous; they can be in a state of high and low activation [40]. For each polarization type, all cells in the field of view at several images were taken into account, and their fluorescence intensity varied greatly. The differences in the accumulation of 5-ALA-induced PpIX can be interpreted by the rate of metabolism, since it depends on the proliferative activity and work of the enzyme apparatus of the cells [41].

3.2. Immunofluorescence Staining of Macrophage Cultures after 5-ALA–PDT

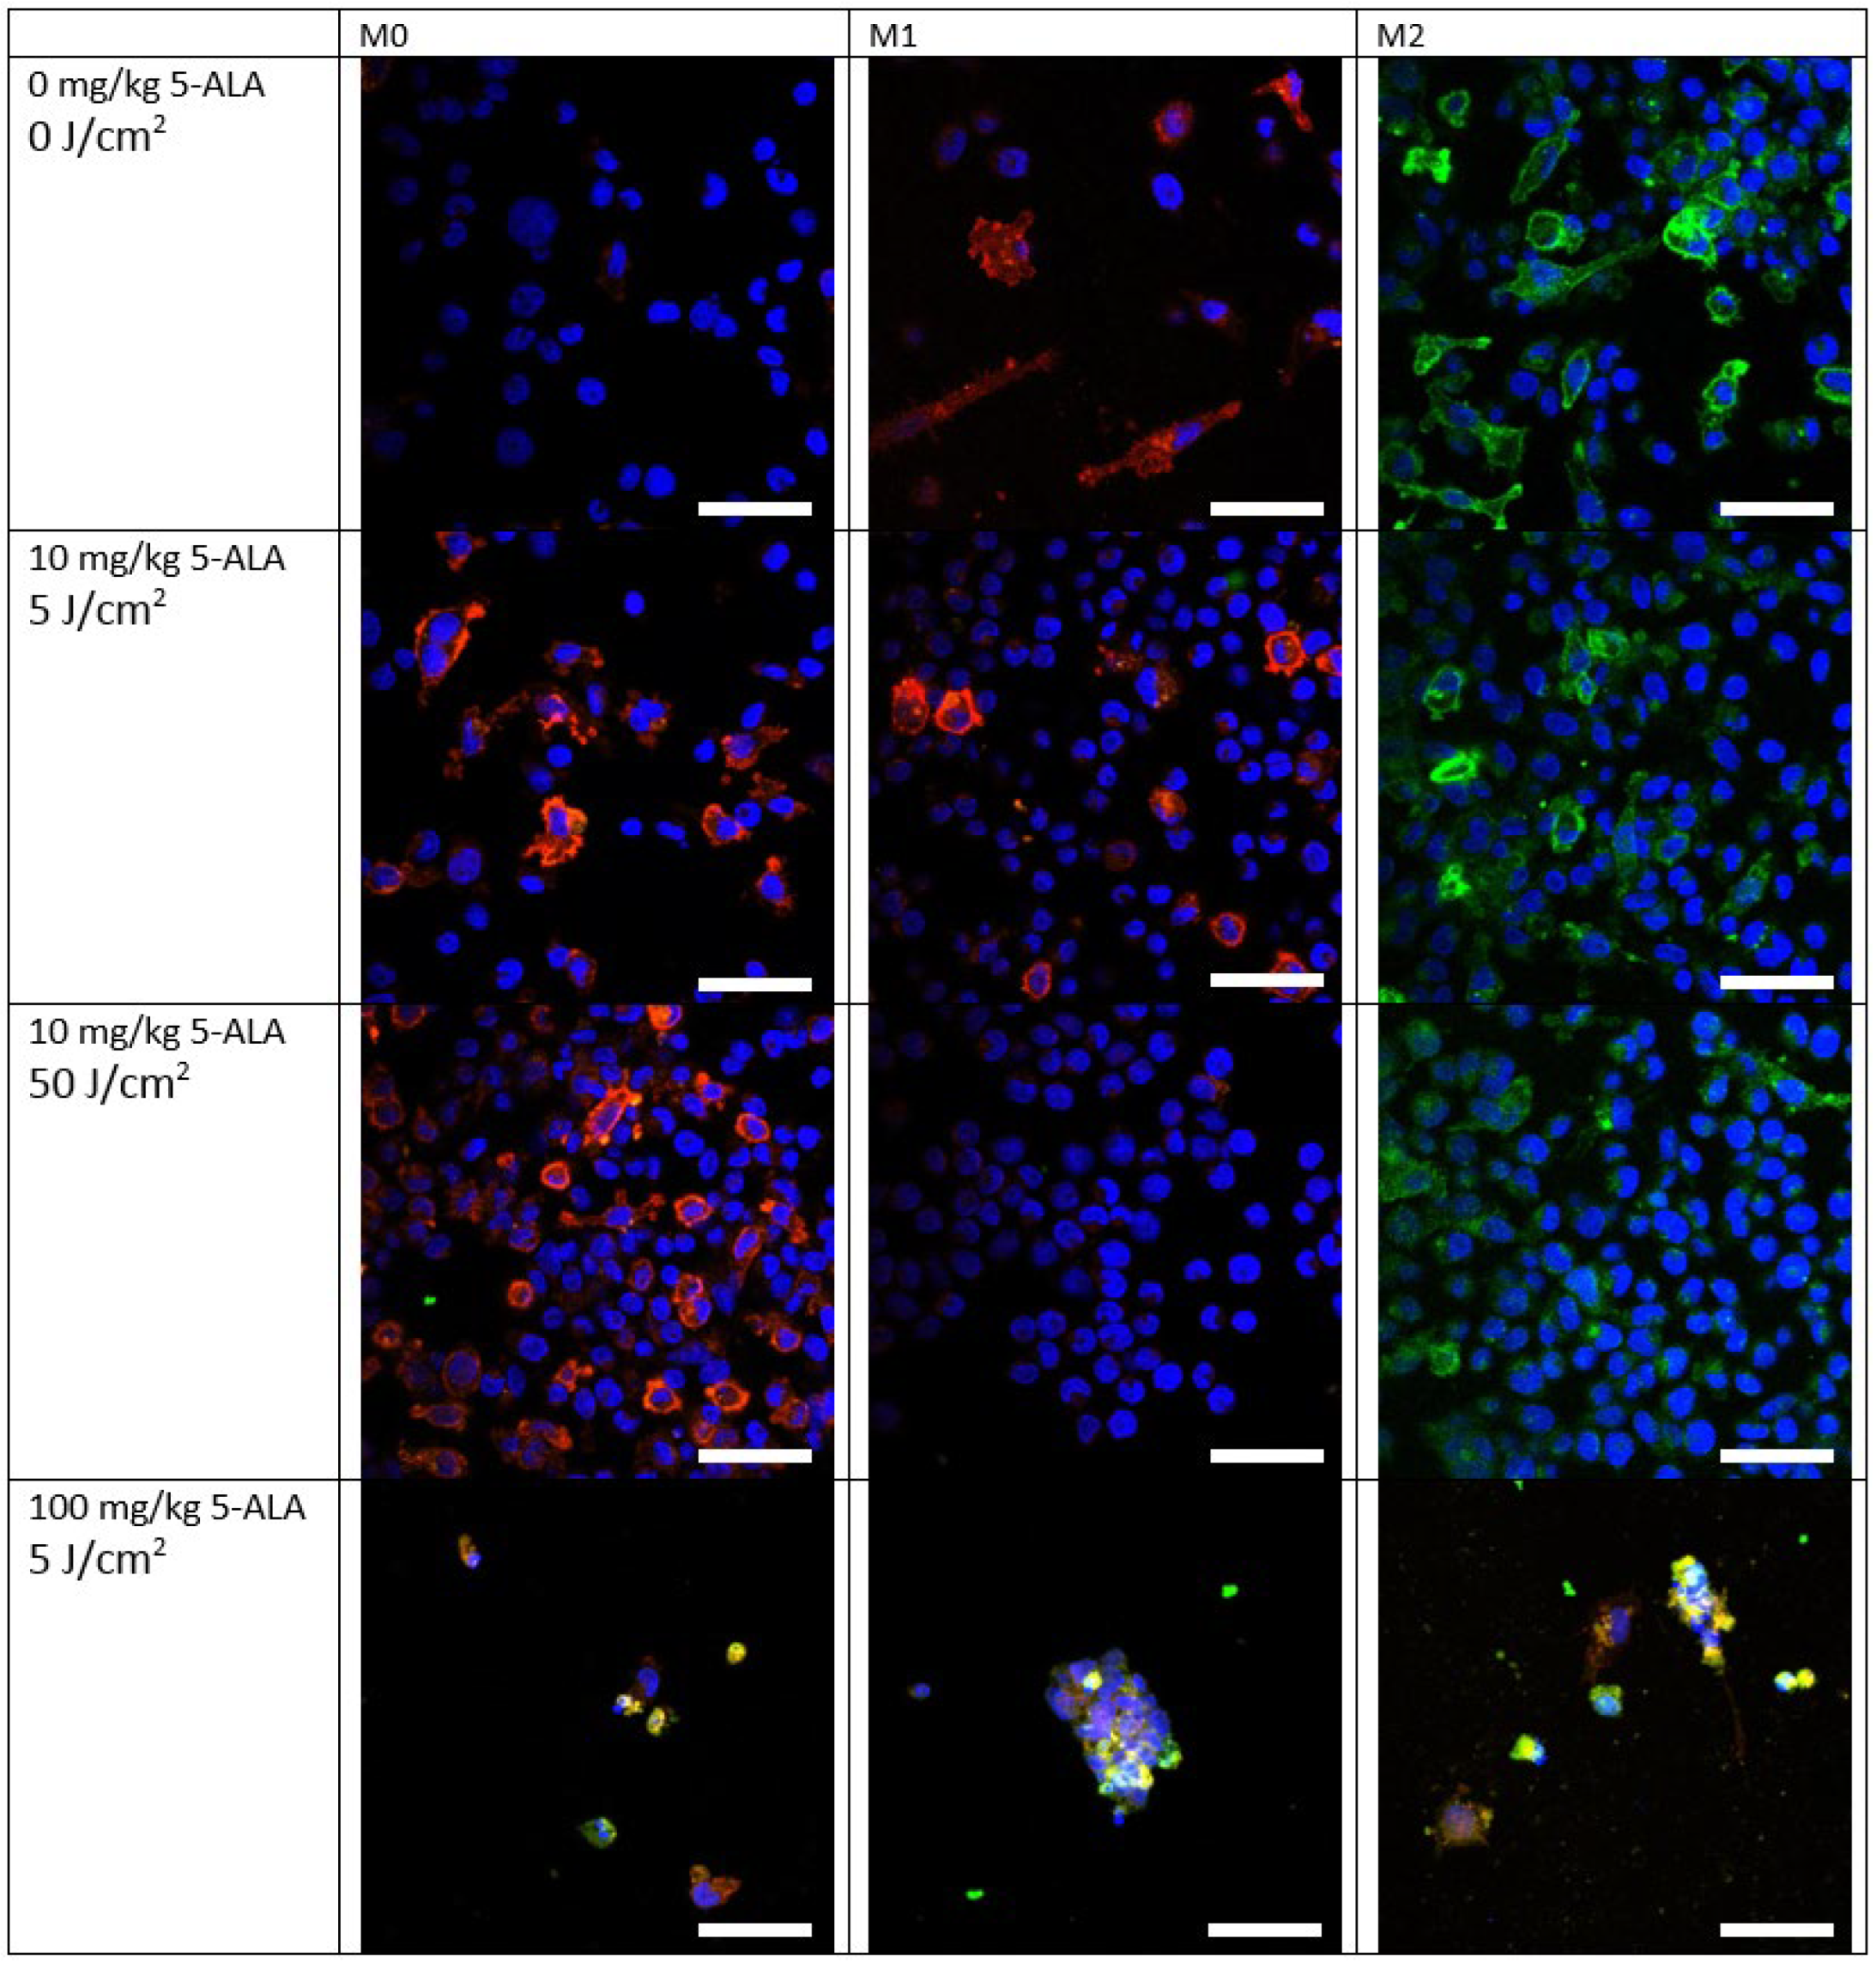
Two days after 5-ALA–PDT, macrophage expression of CD86/CD206 markers corresponding to M1 and M2 polarization was examined (Figure 3).
In samples of M1 and M2 polarized macrophages without exposure, partial staining for M1 and M2 polarization is observed. At the gentlest PDT mode (10 mg/kg 5-ALA, 5 J/cm2), a large presence of non-polarized cells was observed. Moderate PDT (10 mg/kg 5-ALA, 50 J/cm2) resulted in a large number of live cells observed 2 days after PDT. For the M0 polarizations, a significant presence of macrophages stained for the M1 marker was observed. For polarizations M1 and M2, almost all cells lost polarization. It is possible that cells with minimal polarization survived after PDT and proliferated as non-polarized cells. A high concentration of 5-ALA (100 mg/kg) with a low light dose of 5 J/cm2 induced mass necrosis, with macrophage remnants displaying markers characteristic of M1 and M2 types simultaneously, as can be seen in yellow in the images. Doses of irradiation in clinical protocols of ALA–PDT are designed for the induction of tumor cell apoptosis in the tissue and are 50–200 J/cm2 [42,43]. At the same time, some works demonstrate the transformation of M2 macrophages into M1 after low light doses of PDT [44].

3.3. FLIM of Polarized Macrophages In Vitro: Effect of ALA–PDT

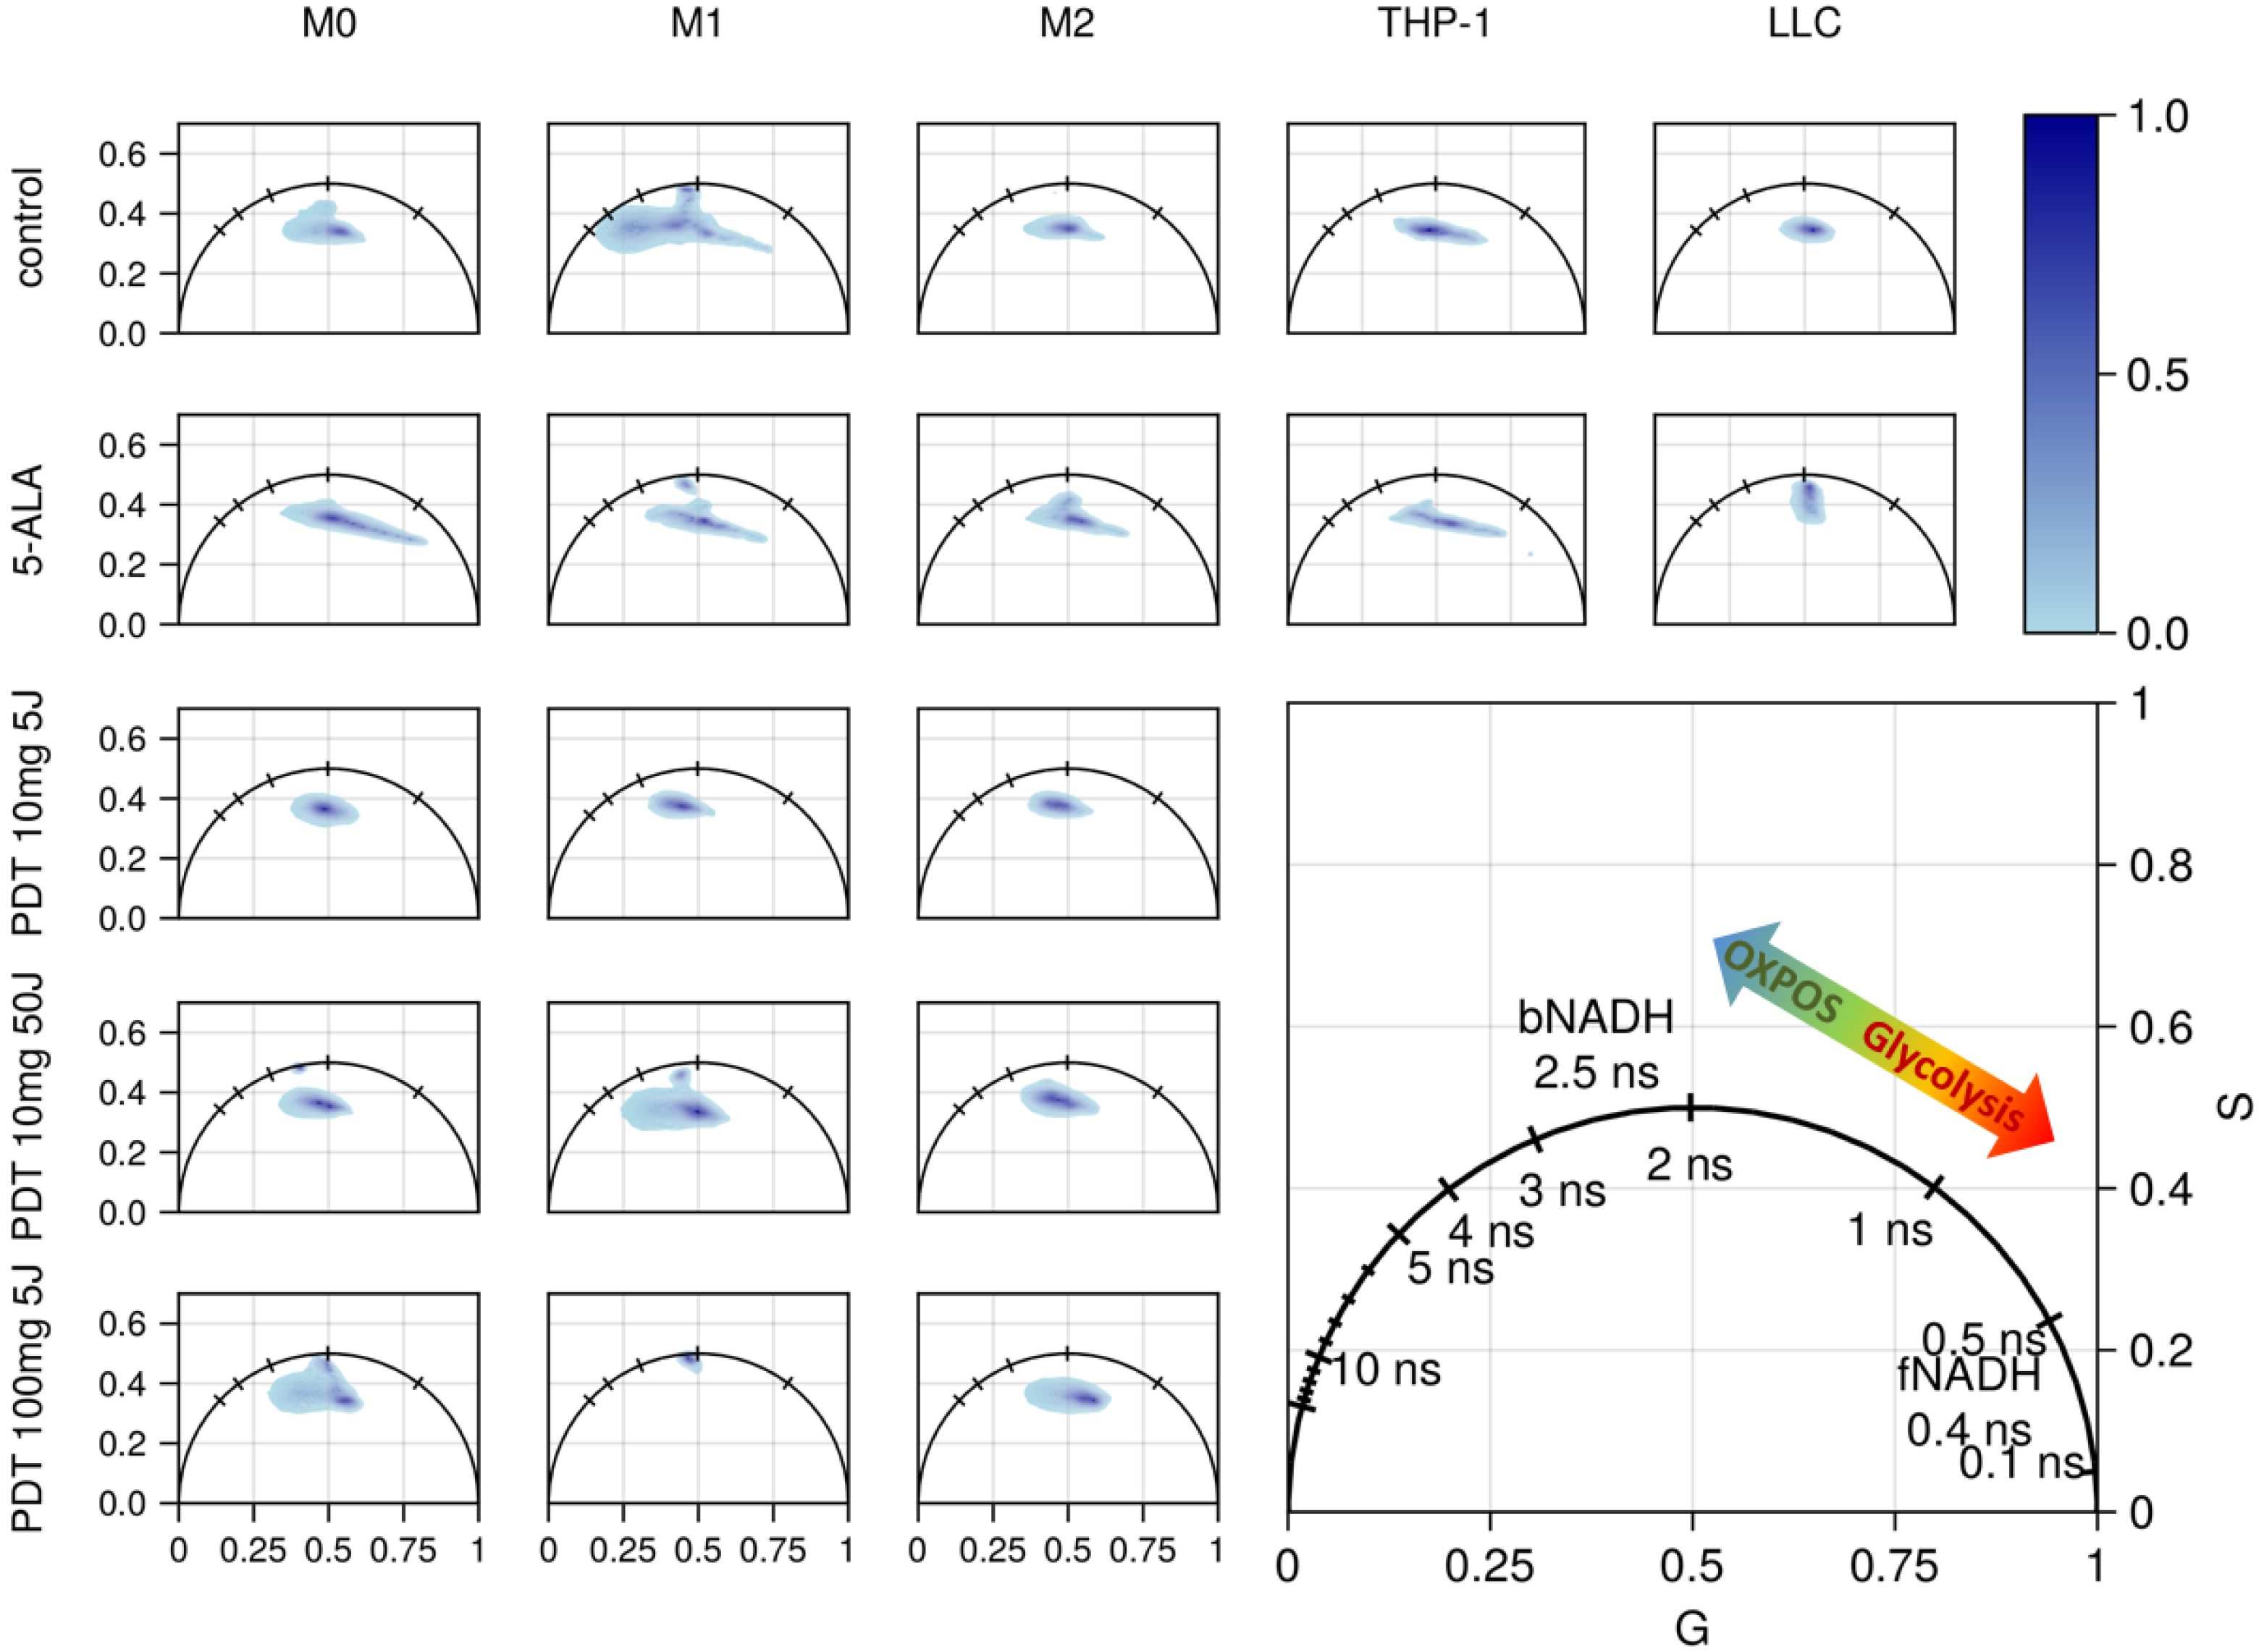
Time-resolved data from spectral bands corresponding to NADH, FAD, and PpIX fluorescence were interpreted using phasor diagrams (Figure 4, Figure 5 and Figure 6). Specific fluorescence lifetimes for various cellular metabolites in the three studied spectral ranges based on literary sources are presented in Table 1. NADH fluorescence of tumor cells, monocytes, and polarized macrophages before and after 5-ALA accumulation and 3 days after PDT varies are shown in Figure 4.
The shift of the pixel distribution in the NADH phasor diagram toward short lifetimes indicates a more glycolytic type of metabolism [55]. Before the addition of 5-ALA, THP-1 cells and tumor cells had a slight shift toward glycolytic metabolism and polarized macrophages toward oxidative phosphorylation. A slight shift from long to short NADH fluorescence lifetime was observed in the M1-M2-M0 series (from oxidative phosphorylation to glycolysis).
For M1 inflammatory macrophages polarized with IFN-γ and LPS, the distribution in the phasor diagram is shifted toward bound NADH with a long fluorescence lifetime. M0 and M2 macrophages polarized with IL-4 and IL-13 show a similar distribution of pixels in the phase diagram shifted toward protein-bound NADH with a fluorescence lifetime of about 2 ns (Figure 4, Control).
A 3 h incubation with 5-ALA resulted in an imbalance in the initial distribution of NADH fluorescence lifetime in THP-1, M0, and M1 macrophages (Figure 4. 5-ALA). The distribution of NADH in macrophages stretches from 3.7 to 0.4 ns, indicating that the two-component kinetics of NADH fluorescence decay and the appearance of more free NADH with short-lived fluorescence [56]. It has recently been discovered that 5-ALA can block an enzyme involved in glycolysis called lactate dehydrogenase, and this leads to inhibition of glycolysis [57]. When lactate dehydrogenase is inhibited, the lifetime of the long component of NADH fluorescence is significantly reduced, and may reflect the involvement of enzymes in glucose metabolism [14]. In the bound state, the average lifetime of NAD(P)H in cells is longer and typically ranges from 1.9 to 5.7 ns [46]. These large differences in the bound state lifetime of NAD(P)H have been attributed to differences in the conformation of NAD(P)H in response to binding by enzymes lactate dehydrogenase, malate dehydrogenase, citrate synthase, the first complex in the electron transfer chain, etc. [47,48,49,50].
Two days after PDT, the preserved macrophages show a shift in the distribution on the phasor diagram of NADH fluorescence toward oxidative phosphorylation. For high doses of PDT, the distribution of pixels in the phase diagram becomes wider and may indicate apoptosis; this is particularly evident in M1 macrophages (Figure 4. M1/PDT 100 mg 5 J).
Phasor diagrams for fluorescence in the spectral range of flavins for macrophages of different polarizations initially differ from the phasor for tumor cells, and also show changes after PDT with different regimens (Figure 5). For the PDT mode with a high concentration of 5-ALA—100 mg/kg, 5 J/cm2 for the M0, M1 and M2 polarizations—a lifetime shift to 2 ns is observed, similar to the shift for the NADH range diagrams. For the moderate PDT mode 5-ALA—10 mg/kg, 5 J/cm2 for all polarizations—a shift toward short lifetime is observed.
Phasor diagrams for the fluorescence in the PpIX spectral range for macrophages of different polarizations also show changes after PDT with different regimens (Figure 6).
Despite the absence of 5-ALA-induced PpIX, the cells have a slight fluorescence of their own porphyrins in the red region, and the phase diagram for cells before incubation with 5-ALA clearly shows a separation of signals in the red spectral range for macrophages in all three polarizations, which is an interesting result. Incubation with 5-ALA leads to a characteristic predominance of long-lived PpIX fluorescence. The long lifetime component of the PpIX solution fluorescence (12.8–17.8 ns) is associated with monomers, and the shorter component (3.5–3.9 ns) is associated with aggregates [51]. In addition, other products of heme synthesis—uro- and coproporphyrins—can be observed in cells during the accumulation of 5-ALA-induced PpIX. Shorter fluorescence lifetime may belong to uro-porphyrin I (1.7 ns) [52]. The lifetimes of uroporphyrin III are 16.5 and 8.4 ns [53]. After exposure to laser irradiation, PpIX is partially converted to its photoproducts, which have shorter lifetimes [54]. The phototoxic efficacy of porphyrins varies considerably, and differences in their presence in different macrophage polarizations may provide a different cellular response to laser irradiation.

3.4. FLIM of Tumor Model In Vivo: Effect of ALA–PDT

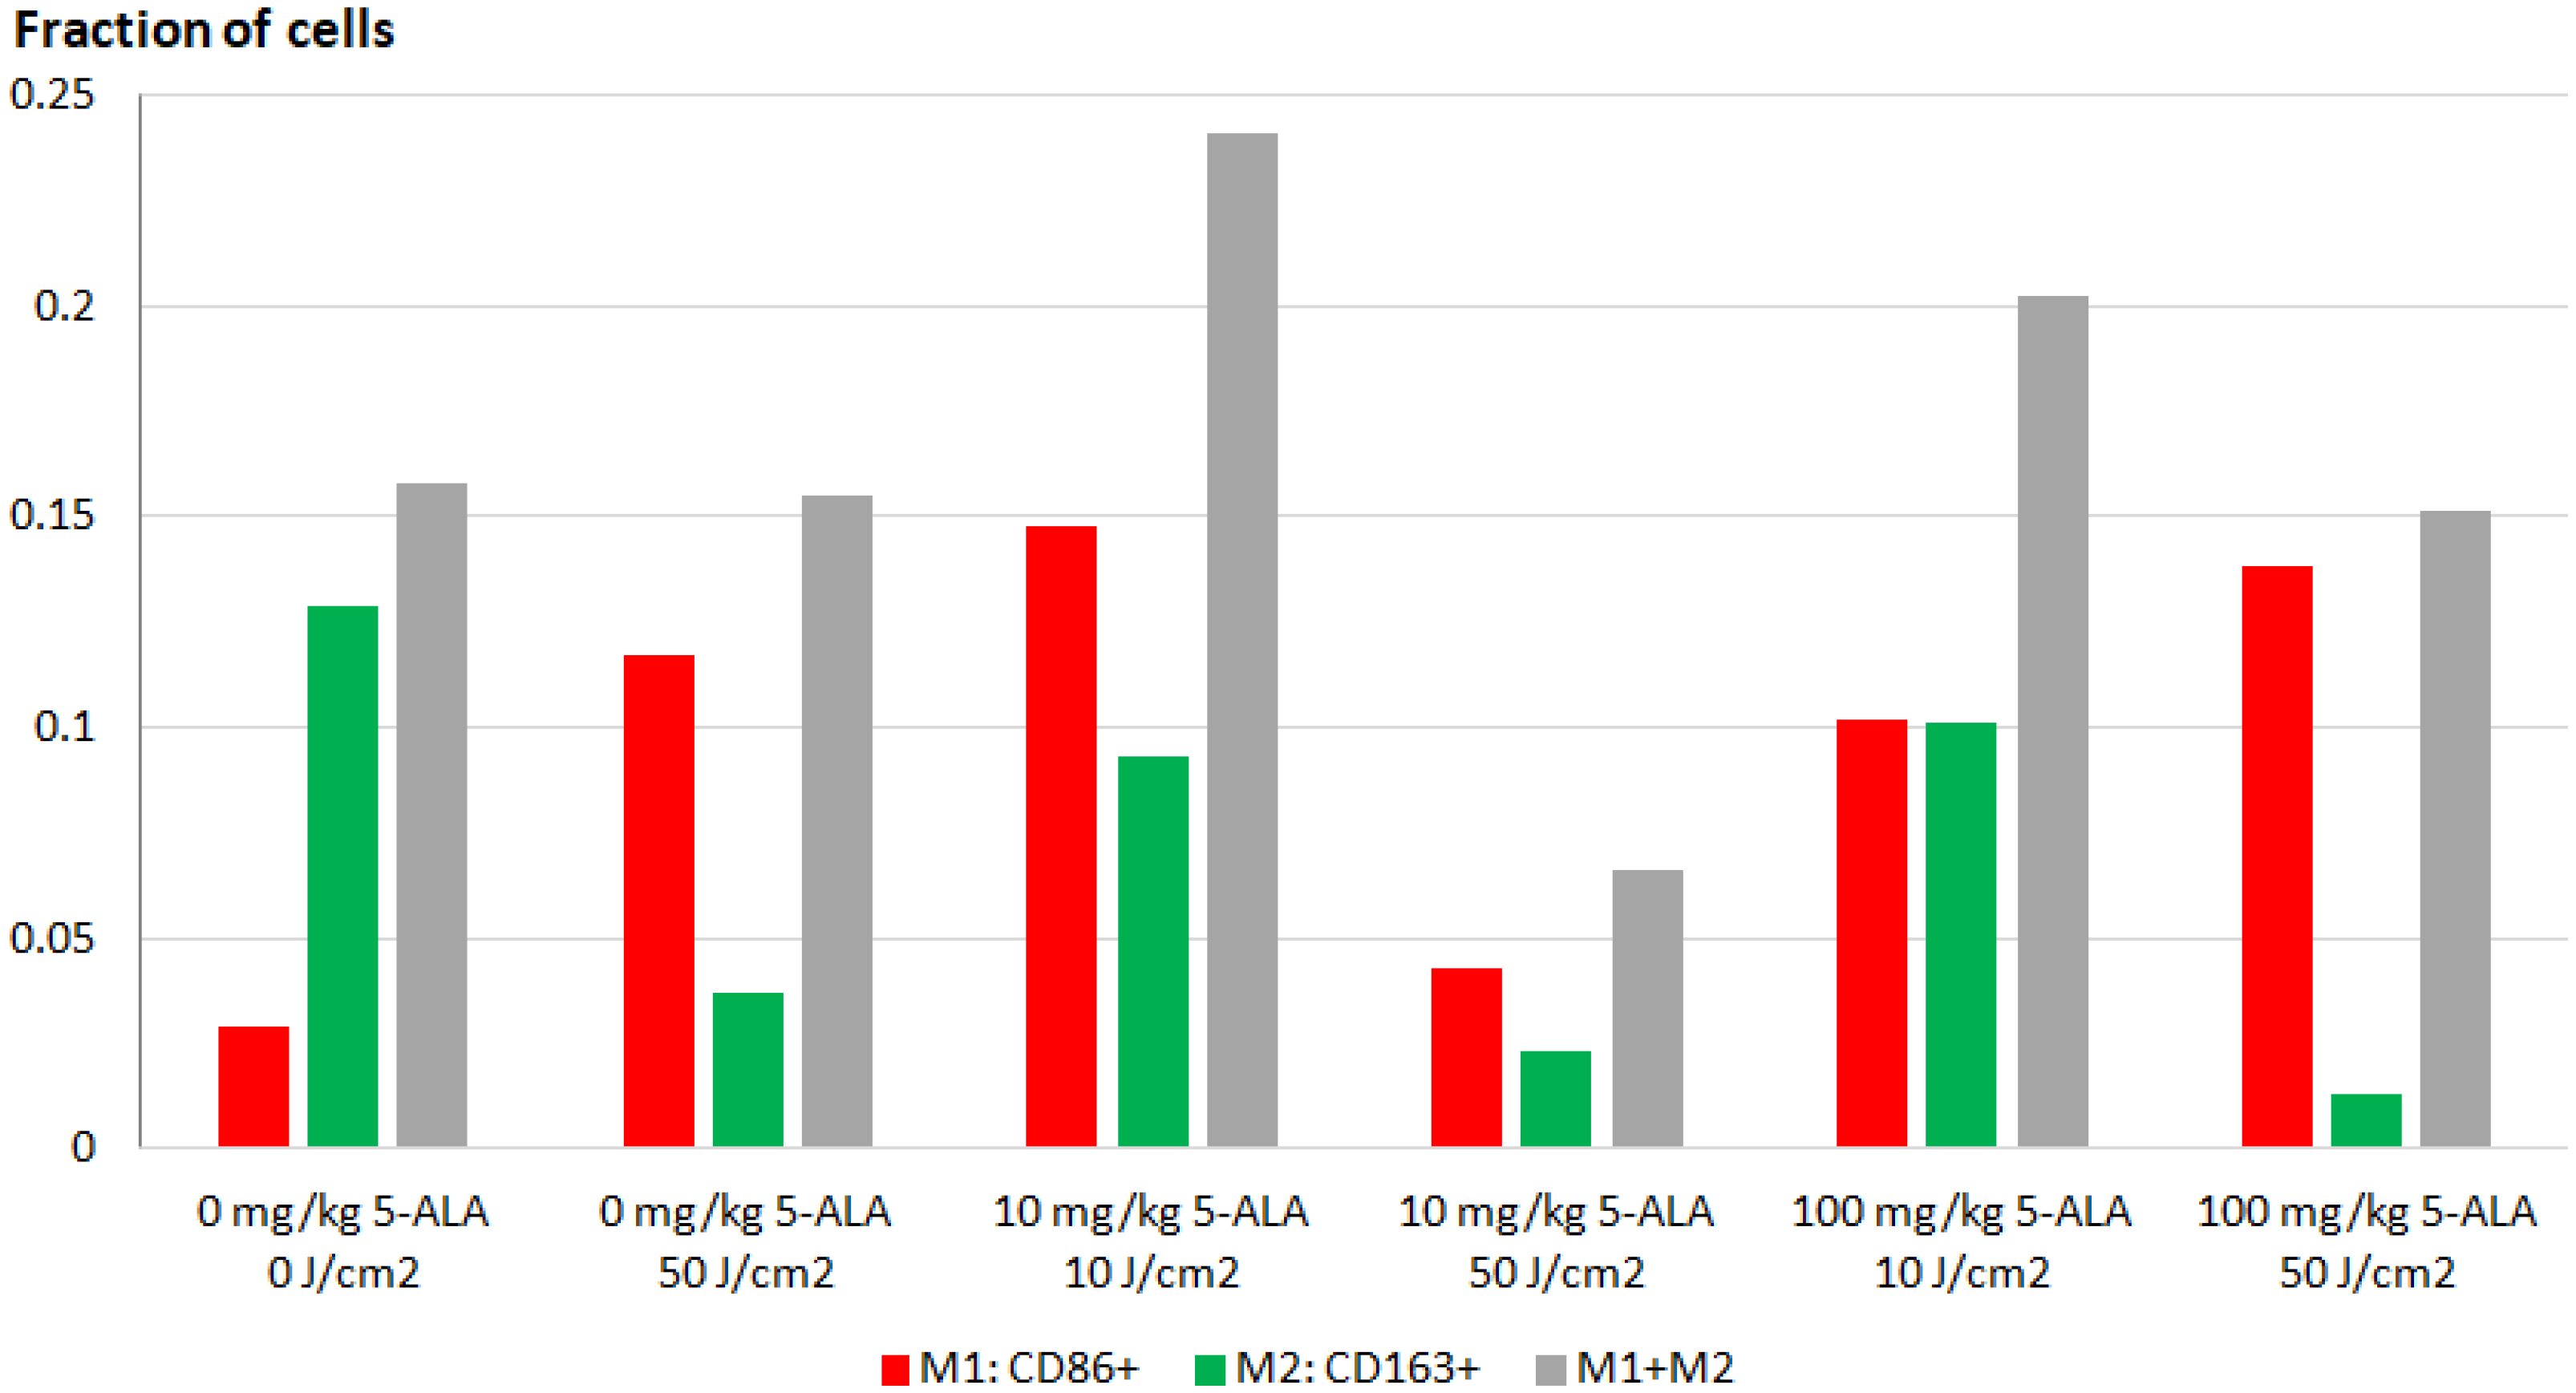
Four hours after intravenous administration of 5-ALA, the intratissue accumulation of PpIX in the tumor area, as measured by fluorescence spectra, was 3.7 ± 0.9 mg/kg for the administered 100 mg/kg of 5-ALA and 0.4 ± 0.1 for the administered 10 mg/kg of 5-ALA. Sections of 50 µm thickness obtained from groups of animals three days after ALA–PDT were analyzed by immunofluorescent staining for the presence of polarized macrophages (Figure 7). All cells, including CD86+ and CD163+ cells, were counted from the images (Figure 8).
Phasor diagrams in the NADH spectral range from tumor slices after PDT with moderate modes (10 mg/kg 5-ALA, 10 and 50 J/cm2) show a shift towards shorter lifetimes relative to the control tumor (Figure 9a). For these cases, the number of M1 macrophages in the tumor exceeds the number of M2 macrophages. For the high-dose PDT (100 mg/kg 5-ALA, 50 J/cm2), despite the high number of M1 macrophages, the phase diagram for NADH appears biased toward 4 ns, due to changes in tumor cells associated with apoptosis.
The phasor diagrams in the FAD spectral range for cases with a higher presence of macrophages, and especially M1-polarized macrophages (ALA–PDT regimens: 10 and 100 mg/kg 5-ALA, 10 J/cm2), in the tumor are shifted toward shorter lifetimes, less than 1.5 ns (Figure 9b). That is, cells with a metabolism shifted more toward anaerobic glycolysis appear in the tumor.
The phasor diagram for the time-resolved fluorescence in the PpIX spectral range for tissues 3 days after PDT demonstrates the remaining high presence of PpIX and PpIX photoproducts (Figure 9c). In cases of low-dose laser irradiation (10 J/cm2), the long lifetime corresponding to PpIX is more pronounced. When the laser dose is increased to 50 J/cm2, the fluorescence lifetime shifts toward a short lifetime that is more consistent with the photoproducts of PpIX.
After a high dose of irradiation, the presence of M2-polarized macrophages in tissues decreases.
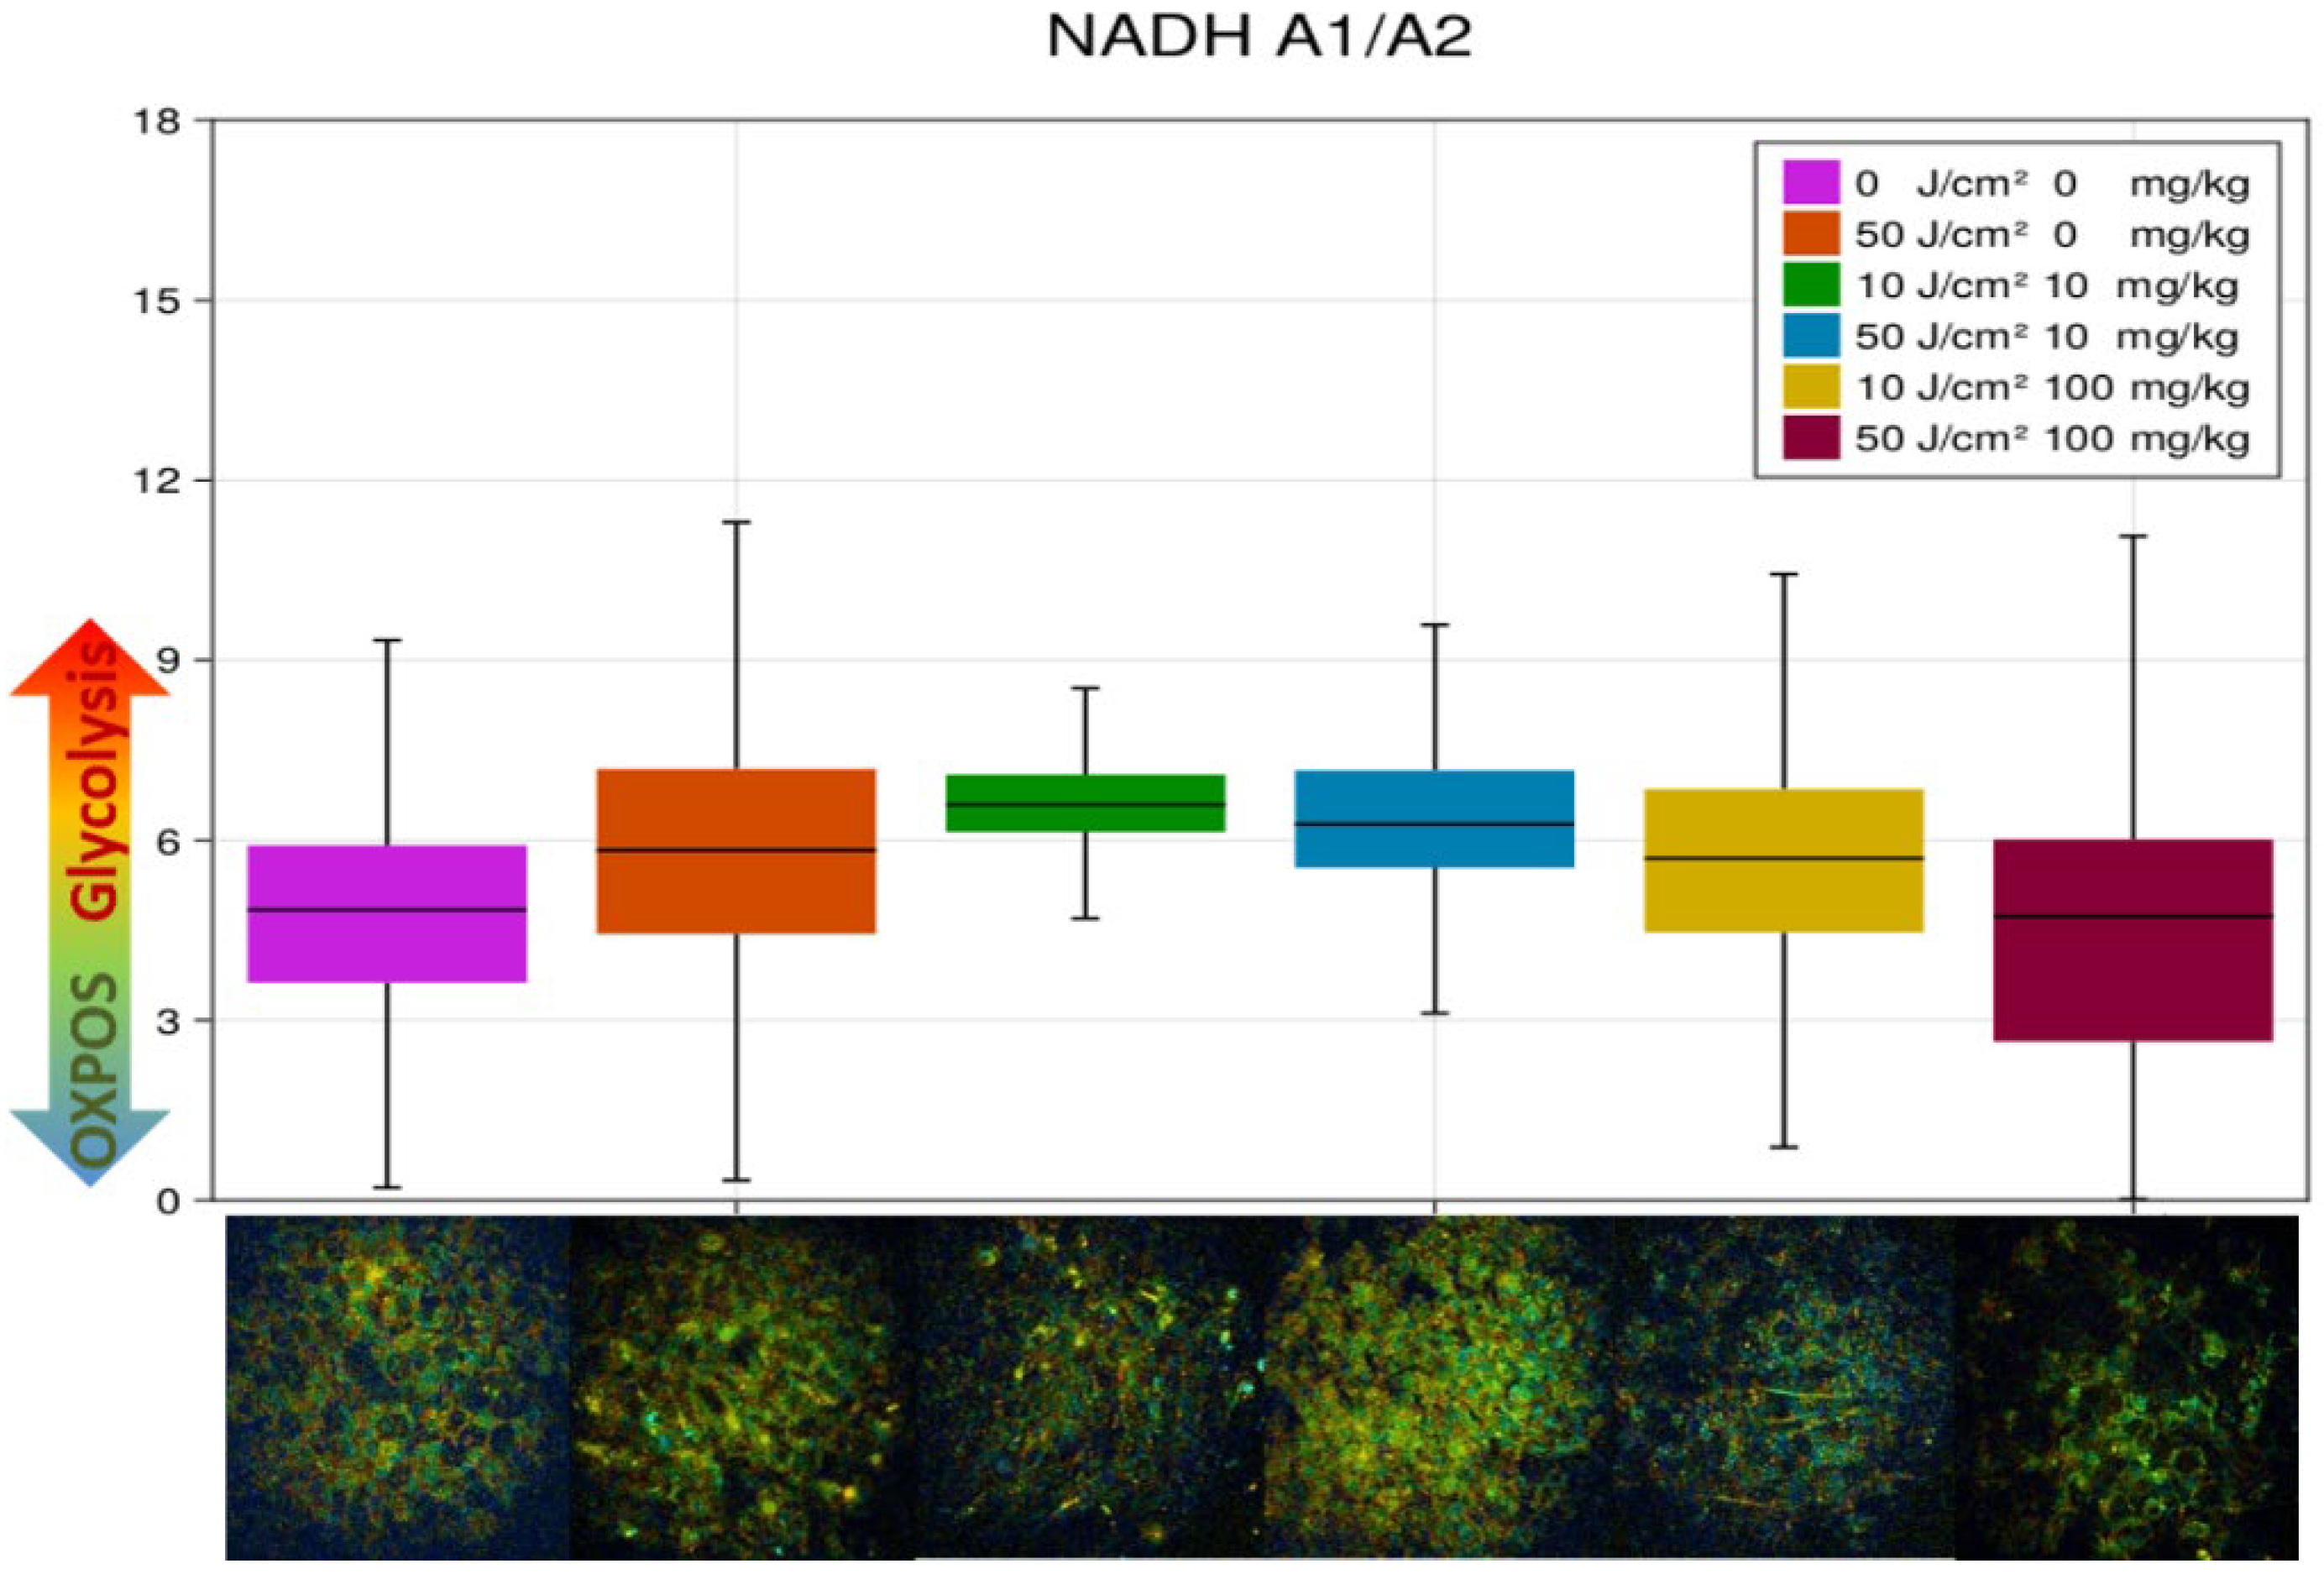
The NADH a1/a2 metabolic index calculated from slice images and averaged across images for each group of mice of different ALA–PDT regimens is shown in Figure 10. Additionally, shown in Figure 10 are corresponding images of tumor slices in pseudocolor of the NADH a1/a2 metabolic index. An increase in inflammatory macrophages in response to ALA–PDT correlates with an increase in the average value of the NADH a1/a2. The value of the NADH a1/a2 varies greatly. However, the next step in the analysis could be the segmentation of brightly fluorescent cells, interpretation of the number and their metabolism per image area.

4. Discussion

Light exposure protocols commonly used in the clinic are generally designed to cause extensive damage to the primary tumor, while the immunobiology of PDT is ignored. A systematic review and meta-analysis of in vitro ALA–PDT experiments summarizes results for several types of cancer cells [58]. Naturally, LC50 and light dose are proportional to ALA–PDT effectiveness. In addition, the PDT effectiveness evaluating results are affected by the duration of cell’s 5-ALA incubation, the irradiation wavelength, irradiation power density and the time between irradiation and viability analysis. Statistical analysis of the calculated ALA–PDT efficacy revealed a trend towards dependence on cancer cells type. The effect of irradiation power density is well demonstrated in experiments with ALA–PDT treatment of glioma spheroids. Spheroids were incubated with 5-ALA 100 (mg/l) for 4 h and then subjected to light doses of 1.5, 3, or 6 J/cm2 for either 1 h (irradiation power density of 0.42, 0.83, or 1.7 mW/cm2) or for a 24 h period at ultra-low irradiation power density (17, 35, or 70 μW/cm2). It was revealed that the ultra-low irradiation power density results in significant spheroid growth inhibition [59]. Unfortunately, there are still very few works when assessing the effect of PDT on tumor cells and cellular stroma.
Photodynamic treatment parameters have a significant influence on the activation of the immune system and the overall success of PDT therapy [60]. In [61], macrophages RAW264.7 were incubated with 5-ALA (0.5 mM = 83 mg/kg) for 5 h, then irradiated with 633 nm red light, 10 mW/cm2 and a total light dose of 0.5 J/cm2. Under these irradiation parameters, the light dose was 10 times lower than in our experiments, M0 macrophages converted to the M1 phenotype, and the percentage of M2 cells was negligible. This is further evidence that low-intensity PDT regimens are necessary to convert M0 macrophages to M1 polarization. High light flux density depletes the oxygen level in the irradiated area, which can lead to ineffective generation of reactive oxygen species, although the treatment can still be effective due to extensive vascular and tumor damage [62]. Furthermore, high energy flux densities appear to have a negative effect on immune reactivity to tumor antigens in patients with basal cell carcinoma [63], confirming that high energy flux densities may not be ideal for developing an immune response, probably because of the powerful vascular shutdown that prevents immune cells from reaching the tumor area. On the other hand, preclinical studies show that low-dose light irradiation at low power densities causes diffuse damage and contributes to an increased inflammatory response, but may result in a slower treatment rate [64].
Based on the reviewed clinical studies, immunostimulatory PDT regimens consist of moderate to high dose irradiation at low irradiation power densities. These illumination regimens can be particularly useful in the clinic in combination with immunostimulatory strategies. Interestingly, a double fractionated irradiation regimen (low light dose followed by high dose) shows higher efficacy than single irradiation for treating patients with superficial basal cell carcinoma [65]. This suggests that greater clinical benefit can be achieved with the development of two-stage PDT programs consisting of a first mode of immunostimulatory irradiation followed by a mode leading to potent tumor destruction, which has proven to be favorable in preclinical conditions [66].
Metabolic FLIM provides specific information with controlled experiments in cell culture, and has been applied to understand disease progression in animal models. NAD(P)H fluorescence lifetimes decrease in cancer cells and tumors following drug treatment; therefore, these metabolic endpoints show potential for treatment monitoring [67]. There are some interesting works on using NAD(P)H lifetime to distinguish between cell death pathways, which may provide treatment optimizations that induce apoptosis instead of necrosis [68]. Because of its non-invasiveness, NAD(P)H fluorescence lifetime imaging has also been used to characterize human tissues in vivo, and ex vivo biotissue studies also promise further benefits. Recent technological developments have shortened FLIM’s runtime. Thus, there is a wide range of technologies capable of capturing relatively weak NAD(P)H signals and using them for clinical applications [69].
Segmentation of the image in vivo into individual cells with their phenotype identification would greatly help in the therapeutic approaches study. Currently, biotissue image fragmentation into individual cells only by the autofluorescence signal seems to be a rather difficult task. However, by using a vector approach to determine the metabolic index through the lifetime of NADH fluorescence, it is possible to study complex and heterogeneous fluorescence with subsequent image mapping [38]. In this study, we used white BALB/c mice, which lack pigmentation. However, in other cases, difficulties with pigmentation and lipofuscin granules are possible. Using characteristics for specific pigments in a non-invasive ‘fit-free’ phasor approach, their contribution to the overall image can be taken into account, especially if applying phasor plot segmentation for different spectral regions [70].

5. Conclusions

An analysis of the metabolic cofactors NADH, flavins and PpIX fluorescence lifetime was made to differentiate the cellular metabolism of normal and tumor tissue, inflammatory and anti-inflammatory macrophages in response to ALA–PDT.
Results on macrophage cultures show that moderate ALA–PDT (10 mg/kg 5-ALA, 10–50 J/cm2) biases nonpolarized M0 macrophages toward M1. At the same time, M1 and M2 macrophages die and are replaced by unpolarized cells.
Tumor models in vivo have demonstrated an increase in the proportion of inflammatory macrophages in the tumor node in response to ALA–PDT.
High doses of ALA–PDT (100 mg/kg 5-ALA, 50 J/cm2) that kill tumor cells may not be ideal for the development of an immune response, probably due to the powerful vasoconstriction that prevents immune cells from entering the tumor area.
Low doses of light irradiation (≤10 J/cm2) cause diffuse damage and promote an increased inflammatory response, but may result in a slower treatment rate.
Preliminary immunostimulatory PDT regimens in combination with drug immunostimulatory strategies may be helpful.
The study of metabolic features with FLIM complements the immunofluorescence staining pattern and is a good tool in the investigation of PDT regimens. The phasor analysis plots for the NADH, flavins, and 5-ALA-induced PpIX fluorescence lifetime helps to study complex and heterogeneous fluorescence at the cellular and tissue levels.

Author Contributions

Conceptualization, A.R., I.R., D.P. and V.L.; methodology, A.R. and I.R.; validation, A.R., I.R. and D.P.; formal analysis, I.R.; investigation, A.R., A.S. and I.M.; resources, V.L. and K.L.; software data processing, I.R.; writing—original draft preparation, A.R.; writing—review and editing, A.R., I.R., K.L. and D.P.; visualization, I.R.; project administration and funding acquisition, A.R. All authors have read and agreed to the published version of the manuscript.

Funding

This research was funded by RFBR, grant No. 20-02-00928 and by the MES of the RF, grant for the creation and development of world-class research centers No. 075-15-2022-315 “Photonics”.

Institutional Review Board Statement

All animal experiments were performed in accordance with European and Russian national guidelines for animal experimentation and were approved by the ethics review committee of the N.N. Blokhin NMRCO (reference number 2017-034, 17 June 2017).

Informed Consent Statement

Not applicable.

Data Availability Statement

The data presented in this study are available on request from the corresponding author.

Acknowledgments

The authors are grateful to Saida Karshieva, a staff member of the N.N. Blokhin NMRCO for help with the in vivo experiments.

Conflicts of Interest

The authors declare no conflict of interest. The funders had no role in the design of the study; in the collection, analyses, or interpretation of data; in the writing of the manuscript; or in the decision to publish the results.

References

  1. Engblom, C.; Pfirschke, C.; Pittet, M.J. The Role of Myeloid Cells in Cancer Therapies. Nat. Rev. Cancer 2016, 16, 447–462. [Google Scholar] [CrossRef] [PubMed]
  2. Haas, L.; Obenauf, A.C. Allies or Enemies—The Multifaceted Role of Myeloid Cells in the Tumor Microenvironment. Front. Immunol. 2019, 10, 2746. [Google Scholar] [CrossRef] [PubMed] [Green Version]
  3. Guerriero, J.L. Macrophages: The Road Less Traveled, Changing Anticancer Therapy. Trends Mol. Med. 2018, 24, 472–489. [Google Scholar] [CrossRef] [PubMed]
  4. House, I.G.; Savas, P.; Lai, J.; Chen, A.X.Y.; Oliver, A.J.; Teo, Z.L.; Todd, K.L.; Henderson, M.A.; Giuffrida, L.; Petley, E.V.; et al. Macrophage-Derived CXCL9 and CXCL10 Are Required for Antitumor Immune Responses Following Immune Checkpoint Blockade. Clin. Cancer Res. 2020, 26, 487–504. [Google Scholar] [CrossRef] [Green Version]
  5. Poh, A.R.; Ernst, M. Targeting Macrophages in Cancer: From Bench to Bedside. Front. Oncol. 2018, 8, 49. [Google Scholar] [CrossRef] [Green Version]
  6. Netea-Maier, R.T.; Smit, J.W.A.; Netea, M.G. Metabolic Changes in Tumor Cells and Tumor-Associated Macrophages: A Mutual Relationship. Cancer Lett. 2018, 413, 102–109. [Google Scholar] [CrossRef]
  7. Rabold, K.; Netea, M.G.; Adema, G.J.; Netea-Maier, R.T. Cellular Metabolism of Tumor-Associated Macrophages—Functional Impact and Consequences. FEBS Lett. 2017, 591, 3022–3041. [Google Scholar] [CrossRef] [Green Version]
  8. Leone, R.D.; Powell, J.D. Metabolism of Immune Cells in Cancer. Nat. Rev. Cancer 2020, 20, 516–531. [Google Scholar] [CrossRef]
  9. Meleppat, R.K.; Ronning, K.E.; Karlen, S.J.; Kothandath, K.K.; Burns, M.E.; Pugh, E.N., Jr.; Zawadzki, R.J. In Situ Morphologic and Spectral Characterization of Retinal Pigment Epithelium Organelles in Mice Using Multicolor Confocal Fluorescence Imaging. Investig. Ophthalmol. Vis. Sci. 2020, 61, 1. [Google Scholar] [CrossRef]
  10. Meleppat, R.K.; Ronning, K.E.; Karlen, S.J.; Burns, M.E.; Pugh, E.N.; Zawadzki, R.J. In Vivo Multimodal Retinal Imaging of Disease-Related Pigmentary Changes in Retinal Pigment Epithelium. Sci. Rep. 2021, 11, 16252. [Google Scholar] [CrossRef]
  11. Suhling, K.; Hirvonen, L.M.; Levitt, J.A.; Chung, P.-H.; Tregido, C.; le Marois, A.; Rusakov, D.A.; Zheng, K.; Ameer-Beg, S.; Poland, S.; et al. Fluorescence Lifetime Imaging (FLIM): Basic Concepts and Recent Applications. In Advanced Time-Correlated Single Photon Counting Applications; Becker, W., Ed.; Springer Series in Chemical Physics; Springer International Publishing: Cham, Switzerland, 2015; pp. 119–188. ISBN 978-3-319-14929-5. [Google Scholar]
  12. Weijer, R.; Clavier, S.; Zaal, E.A.; Pijls, M.M.E.; van Kooten, R.T.; Vermaas, K.; Leen, R.; Jongejan, A.; Moerland, P.D.; van Kampen, A.H.C.; et al. Multi-OMIC Profiling of Survival and Metabolic Signaling Networks in Cells Subjected to Photodynamic Therapy. Cell Mol. Life Sci. 2017, 74, 1133–1151. [Google Scholar] [CrossRef] [PubMed] [Green Version]
  13. Liu, Z.; Pouli, D.; Alonzo, C.A.; Varone, A.; Karaliota, S.; Quinn, K.P.; Münger, K.; Karalis, K.P.; Georgakoudi, I. Mapping Metabolic Changes by Noninvasive, Multiparametric, High-Resolution Imaging Using Endogenous Contrast. Sci. Adv. 2018, 4, eaap9302. [Google Scholar] [CrossRef] [PubMed] [Green Version]
  14. Sharick, J.T.; Favreau, P.F.; Gillette, A.A.; Sdao, S.M.; Merrins, M.J.; Skala, M.C. Protein-Bound NAD(P)H Lifetime Is Sensitive to Multiple Fates of Glucose Carbon. Sci. Rep. 2018, 8, 5456. [Google Scholar] [CrossRef] [Green Version]
  15. Pastore, M.N.; Studier, H.; Bonder, C.S.; Roberts, M.S. Non-Invasive Metabolic Imaging of Melanoma Progression. Exp. Dermatol. 2017, 26, 607–614. [Google Scholar] [CrossRef]
  16. Heaster, T.M.; Heaton, A.R.; Sondel, P.M.; Skala, M.C. Intravital Metabolic Autofluorescence Imaging Captures Macrophage Heterogeneity Across Normal and Cancerous Tissue. Front. Bioeng. Biotechnol. 2021, 9, 644648. [Google Scholar] [CrossRef]
  17. Miskolci, V.; Tweed, K.E.; Lasarev, M.R.; Britt, E.C.; Walsh, A.J.; Zimmerman, L.J.; McDougal, C.E.; Cronan, M.R.; Fan, J.; Sauer, J.-D.; et al. In Vivo Fluorescence Lifetime Imaging of Macrophage Intracellular Metabolism during Wound Responses in Zebrafish. eLife 2022, 11, e66080. [Google Scholar] [CrossRef]
  18. DeCamp, S.J.; Tsuda, V.M.K.; Ferruzzi, J.; Koehler, S.A.; Giblin, J.T.; Roblyer, D.; Zaman, M.H.; Weiss, S.T.; Kılıç, A.; De Marzio, M.; et al. Epithelial Layer Unjamming Shifts Energy Metabolism toward Glycolysis. Sci. Rep. 2020, 10, 18302. [Google Scholar] [CrossRef]
  19. Walsh, A.J.; Cook, R.S.; Sanders, M.E.; Aurisicchio, L.; Ciliberto, G.; Arteaga, C.L.; Skala, M.C. Quantitative Optical Imaging of Primary Tumor Organoid Metabolism Predicts Drug Response in Breast Cancer. Cancer Res. 2014, 74, 5184–5194. [Google Scholar] [CrossRef] [Green Version]
  20. Alhallak, K.; Jenkins, S.V.; Lee, D.E.; Greene, N.P.; Quinn, K.P.; Griffin, R.J.; Dings, R.P.M.; Rajaram, N. Optical Imaging of Radiation-Induced Metabolic Changes in Radiation-Sensitive and Resistant Cancer Cells. J. Biomed. Opt. 2017, 22, 60502. [Google Scholar] [CrossRef] [Green Version]
  21. Castano, A.P.; Mroz, P.; Hamblin, M.R. Photodynamic Therapy and Anti-Tumour Immunity. Nat. Rev. Cancer 2006, 6, 535–545. [Google Scholar] [CrossRef]
  22. Castano, A.P.; Demidova, T.N.; Hamblin, M.R. Mechanisms in Photodynamic Therapy: Part One—Photosensitizers, Photochemistry and Cellular Localization. Photodiagnosis Photodyn. Ther. 2004, 1, 279–293. [Google Scholar] [CrossRef] [PubMed] [Green Version]
  23. Mishchenko, T.; Balalaeva, I.; Gorokhova, A.; Vedunova, M.; Krysko, D.V. Which Cell Death Modality Wins the Contest for Photodynamic Therapy of Cancer? Cell Death Dis. 2022, 13, 1–16. [Google Scholar] [CrossRef] [PubMed]
  24. Alzeibak, R.; Mishchenko, T.A.; Shilyagina, N.Y.; Balalaeva, I.V.; Vedunova, M.V.; Krysko, D.V. Targeting Immunogenic Cancer Cell Death by Photodynamic Therapy: Past, Present and Future. J. Immunother. Cancer 2021, 9, e001926. [Google Scholar] [CrossRef] [PubMed]
  25. Klug, F.; Prakash, H.; Huber, P.E.; Seibel, T.; Bender, N.; Halama, N.; Pfirschke, C.; Voss, R.H.; Timke, C.; Umansky, L.; et al. Low-Dose Irradiation Programs Macrophage Differentiation to an INOS+/M1 Phenotype That Orchestrates Effective T Cell Immunotherapy. Cancer Cell 2013, 24, 589–602. [Google Scholar] [CrossRef] [Green Version]
  26. Korbelik, M.; Hamblin, M.R. The Impact of Macrophage-Cancer Cell Interaction on the Efficacy of Photodynamic Therapy. Photochem. Photobiol. Sci. 2015, 14, 1403–1409. [Google Scholar] [CrossRef] [Green Version]
  27. Wachowska, M.; Muchowicz, A.; Firczuk, M.; Gabrysiak, M.; Winiarska, M.; Wańczyk, M.; Bojarczuk, K.; Golab, J. Aminolevulinic Acid (ALA) as a Prodrug in Photodynamic Therapy of Cancer. Molecules 2011, 16, 4140–4164. [Google Scholar] [CrossRef] [Green Version]
  28. Kiening, M.; Lange, N. A Recap of Heme Metabolism towards Understanding Protoporphyrin IX Selectivity in Cancer Cells. Int. J. Mol. Sci. 2022, 23, 7974. [Google Scholar] [CrossRef]
  29. Hebeda, K.M.; Saarnak, A.E.; Olivo, M.; Sterenborg, H.J.; Wolbers, J.G. 5-Aminolevulinic Acid Induced Endogenous Porphyrin Fluorescence in 9L and C6 Brain Tumours and in the Normal Rat Brain. Acta Neurochir. 1998, 140, 503–512, discussion 512–513. [Google Scholar] [CrossRef]
  30. Kelty, C.J.; Brown, N.J.; Reed, M.W.R.; Ackroyd, R. The Use of 5-Aminolaevulinic Acid as a Photosensitiser in Photodynamic Therapy and Photodiagnosis. Photochem. Photobiol. Sci. 2002, 1, 158–168. [Google Scholar] [CrossRef]
  31. Harada, Y.; Murayama, Y.; Takamatsu, T.; Otsuji, E.; Tanaka, H. 5-Aminolevulinic Acid-Induced Protoporphyrin IX Fluorescence Imaging for Tumor Detection: Recent Advances and Challenges. Int. J. Mol. Sci. 2022, 23, 6478. [Google Scholar] [CrossRef]
  32. Schneckenburger, H.; König, K.; Kunzi-Rapp, K.; Westphal-Frösch, C.; Rück, A. Time-Resolved in-Vivo Fluorescence of Photosensitizing Porphyrins. J. Photochem. Photobiol. B 1993, 21, 143–147. [Google Scholar] [CrossRef] [PubMed]
  33. Collaud, S.; Juzeniene, A.; Moan, J.; Lange, N. On the Selectivity of 5-Aminolevulinic Acid-Induced Protoporphyrin IX Formation. Curr. Med. Chem. Anticancer. Agents 2004, 4, 301–316. [Google Scholar] [CrossRef] [PubMed]
  34. Wang, X.; Ji, J.; Zhang, H.; Fan, Z.; Zhang, L.; Shi, L.; Zhou, F.; Chen, W.R.; Wang, H.; Wang, X. Stimulation of Dendritic Cells by DAMPs in ALA-PDT Treated SCC Tumor Cells. Oncotarget 2015, 6, 44688–44702. [Google Scholar] [CrossRef] [PubMed] [Green Version]
  35. Tsuchiya, S.; Yamabe, M.; Yamaguchi, Y.; Kobayashi, Y.; Konno, T.; Tada, K. Establishment and Characterization of a Human Acute Monocytic Leukemia Cell Line (THP-1). Int. J. Cancer 1980, 26, 171–176. [Google Scholar] [CrossRef]
  36. Genin, M.; Clement, F.; Fattaccioli, A.; Raes, M.; Michiels, C. M1 and M2 Macrophages Derived from THP-1 Cells Differentially Modulate the Response of Cancer Cells to Etoposide. BMC Cancer 2015, 15, 577. [Google Scholar] [CrossRef] [Green Version]
  37. Berg, S.; Kutra, D.; Kroeger, T.; Straehle, C.N.; Kausler, B.X.; Haubold, C.; Schiegg, M.; Ales, J.; Beier, T.; Rudy, M.; et al. Ilastik: Interactive Machine Learning for (Bio)Image Analysis. Nat. Methods 2019, 16, 1226–1232. [Google Scholar] [CrossRef]
  38. Ranjit, S.; Malacrida, L.; Jameson, D.M.; Gratton, E. Fit-Free Analysis of Fluorescence Lifetime Imaging Data Using the Phasor Approach. Nat. Protoc. 2018, 13, 1979–2004. [Google Scholar] [CrossRef] [PubMed]
  39. Kalinina, S.; Freymueller, C.; Naskar, N.; von Einem, B.; Reess, K.; Sroka, R.; Rueck, A. Bioenergetic Alterations of Metabolic Redox Coenzymes as NADH, FAD and FMN by Means of Fluorescence Lifetime Imaging Techniques. Int. J. Mol. Sci. 2021, 22, 5952. [Google Scholar] [CrossRef]
  40. Muldoon, J.J.; Chuang, Y.; Bagheri, N.; Leonard, J.N. Macrophages Employ Quorum Licensing to Regulate Collective Activation. Nat. Commun. 2020, 11, 878. [Google Scholar] [CrossRef] [Green Version]
  41. Valdés, P.A.; Kim, A.; Brantsch, M.; Niu, C.; Moses, Z.B.; Tosteson, T.D.; Wilson, B.C.; Paulsen, K.D.; Roberts, D.W.; Harris, B.T. δ-Aminolevulinic Acid-Induced Protoporphyrin IX Concentration Correlates with Histopathologic Markers of Malignancy in Human Gliomas: The Need for Quantitative Fluorescence-Guided Resection to Identify Regions of Increasing Malignancy. Neuro. Oncol. 2011, 13, 846–856. [Google Scholar] [CrossRef]
  42. Kim, M.M.; Darafsheh, A. Light Sources and Dosimetry Techniques for Photodynamic Therapy. Photochem. Photobiol. 2020, 96, 280–294. [Google Scholar] [CrossRef] [PubMed] [Green Version]
  43. Figueira, J.A.; Veltrini, V.C. Photodynamic Therapy in Oral Potentially Malignant Disorders—Critical Literature Review of Existing Protocols. Photodiagnosis Photodyn. Ther. 2017, 20, 125–129. [Google Scholar] [CrossRef] [PubMed] [Green Version]
  44. Zhu, Z.; Scalfi-Happ, C.; Ryabova, A.; Gräfe, S.; Wiehe, A.; Peter, R.-U.; Loschenov, V.; Steiner, R.; Wittig, R. Photodynamic Activity of Temoporfin Nanoparticles Induces a Shift to the M1-like Phenotype in M2-Polarized Macrophages. J. Photochem. Photobiol. B Biol. 2018, 185, 215–222. [Google Scholar] [CrossRef] [PubMed]
  45. Schaefer, P.M.; Kalinina, S.; Rueck, A.; von Arnim, C.A.F.; von Einem, B. NADH Autofluorescence-A Marker on Its Way to Boost Bioenergetic Research: NADH Autofluorescence. Cytometry 2019, 95, 34–46. [Google Scholar] [CrossRef] [Green Version]
  46. Blacker, T.S.; Duchen, M.R. Investigating Mitochondrial Redox State Using NADH and NADPH Autofluorescence. Free Radic. Biol. Med. 2016, 100, 53–65. [Google Scholar] [CrossRef] [Green Version]
  47. Blinova, K.; Carroll, S.; Bose, S.; Smirnov, A.V.; Harvey, J.J.; Knutson, J.R.; Balaban, R.S. Distribution of Mitochondrial NADH Fluorescence Lifetimes: Steady-State Kinetics of Matrix NADH Interactions. Biochemistry 2005, 44, 2585–2594. [Google Scholar] [CrossRef]
  48. Ranjit, S.; Malacrida, L.; Stakic, M.; Gratton, E. Determination of the Metabolic Index Using the Fluorescence Lifetime of Free and Bound NADH in the Phasor Approach. J. Biophotonics 2019, 12, e201900156. [Google Scholar] [CrossRef]
  49. Ciccarese, F.; Ciminale, V. Escaping Death: Mitochondrial Redox Homeostasis in Cancer Cells. Front. Oncol. 2017, 7, 117. [Google Scholar] [CrossRef] [Green Version]
  50. Stringari, C.; Edwards, R.A.; Pate, K.T.; Waterman, M.L.; Donovan, P.J.; Gratton, E. Metabolic Trajectory of Cellular Differentiation in Small Intestine by Phasor Fluorescence Lifetime Microscopy of NADH. Sci. Rep. 2012, 2, 568. [Google Scholar] [CrossRef] [Green Version]
  51. Myrzakhmetov, B.; Arnoux, P.; Mordon, S.; Acherar, S.; Tsoy, I.; Frochot, C. Photophysical Properties of Protoporphyrin IX, Pyropheophorbide-a and Photofrin® in Different Conditions. Pharmaceuticals 2021, 14, 138. [Google Scholar] [CrossRef]
  52. Rück, A.; Dolp, F.; Hülshoff, C.; Hauser, C.; Scalfi-Happ, C. Fluorescence Lifetime Imaging in PDT. An Overview. Med. Laser Appl. 2005, 20, 125–129. [Google Scholar] [CrossRef]
  53. Schneckenburger, H.; Gschwend, M.H.; Sailer, R.; Rück, A.; Strauβ, W.S.L. Time-Resolved PH-Dependent Fluorescence of Hydrophilic Porphyrins in Solution and in Cultivated Cells. J. Photochem. Photobiol. B Biol. 1995, 27, 251–255. [Google Scholar] [CrossRef]
  54. Brancaleon, L.; Magennis, S.W.; Samuel, I.D.W.; Namdas, E.; Lesar, A.; Moseley, H. Characterization of the Photoproducts of Protoporphyrin IX Bound to Human Serum Albumin and Immunoglobulin G. Biophys. Chem. 2004, 109, 351–360. [Google Scholar] [CrossRef]
  55. Stringari, C.; Nourse, J.L.; Flanagan, L.A.; Gratton, E. Phasor Fluorescence Lifetime Microscopy of Free and Protein-Bound NADH Reveals Neural Stem Cell Differentiation Potential. PLoS ONE 2012, 7, e48014. [Google Scholar] [CrossRef] [Green Version]
  56. Ranjit, S.; Datta, R.; Dvornikov, A.; Gratton, E. Multicomponent Analysis of Phasor Plot in a Single Pixel to Calculate Changes of Metabolic Trajectory in Biological Systems. J. Phys. Chem. A 2019, 123, 9865–9873. [Google Scholar] [CrossRef]
  57. Grigalavicius, M.; Ezzatpanah, S.; Papakyriakou, A.; Raabe, T.T.H.; Yannakopoulou, K.; Theodossiou, T.A. 5-ALA Is a Potent Lactate Dehydrogenase Inhibitor but Not a Substrate: Implications for Cell Glycolysis and New Avenues in 5-ALA-Mediated Anticancer Action. Cancers 2022, 14, 4003. [Google Scholar] [CrossRef]
  58. Shinoda, Y.; Kato, D.; Ando, R.; Endo, H.; Takahashi, T.; Tsuneoka, Y.; Fujiwara, Y. Systematic Review and Meta-Analysis of In Vitro Anti-Human Cancer Experiments Investigating the Use of 5-Aminolevulinic Acid (5-ALA) for Photodynamic Therapy. Pharmaceuticals 2021, 14, 229. [Google Scholar] [CrossRef]
  59. Mathews, M.S.; Angell-Petersen, E.; Sanchez, R.; Sun, C.-H.; Vo, V.; Hirschberg, H.; Madsen, S.J. The Effects of Ultra Low Fluence Rate Single and Repetitive Photodynamic Therapy on Glioma Spheroids. Lasers Surg. Med. 2009, 41, 578–584. [Google Scholar] [CrossRef] [Green Version]
  60. Beltrán Hernández, I.; Yu, Y.; Ossendorp, F.; Korbelik, M.; Oliveira, S. Preclinical and Clinical Evidence of Immune Responses Triggered in Oncologic Photodynamic Therapy: Clinical Recommendations. J. Clin. Med. 2020, 9, 333. [Google Scholar] [CrossRef] [Green Version]
  61. Ji, J.; Wang, P.; Zhou, Q.; Zhu, L.; Zhang, H.; Zhang, Y.; Zheng, Z.; Bhatta, A.K.; Zhang, G.; Wang, X. CCL8 Enhances Sensitivity of Cutaneous Squamous Cell Carcinoma to Photodynamic Therapy by Recruiting M1 Macrophages. Photodiagnosis Photodyn. Ther. 2019, 26, 235–243. [Google Scholar] [CrossRef]
  62. Henderson, B.W.; Busch, T.M.; Vaughan, L.A.; Frawley, N.P.; Babich, D.; Sosa, T.A.; Zollo, J.D.; Dee, A.S.; Cooper, M.T.; Bellnier, D.A.; et al. Photofrin Photodynamic Therapy Can Significantly Deplete or Preserve Oxygenation in Human Basal Cell Carcinomas during Treatment, Depending on Fluence Rate. Cancer Res. 2000, 60, 525–529. [Google Scholar]
  63. Kabingu, E.; Oseroff, A.R.; Wilding, G.E.; Gollnick, S.O. Enhanced Systemic Immune Reactivity to a Basal Cell Carcinoma Associated Antigen Following Photodynamic Therapy. Clin. Cancer Res. 2009, 15, 4460–4466. [Google Scholar] [CrossRef] [Green Version]
  64. Henderson, B.W.; Gollnick, S.O.; Snyder, J.W.; Busch, T.M.; Kousis, P.C.; Cheney, R.T.; Morgan, J. Choice of Oxygen-Conserving Treatment Regimen Determines the Inflammatory Response and Outcome of Photodynamic Therapy of Tumors. Cancer Res. 2004, 64, 2120–2126. [Google Scholar] [CrossRef] [Green Version]
  65. de Vijlder, H.C.; Sterenborg, H.J.C.M.; Neumann, H.A.M.; Robinson, D.J.; de Haas, E.R.M. Light Fractionation Significantly Improves the Response of Superficial Basal Cell Carcinoma to Aminolaevulinic Acid Photodynamic Therapy: Five-Year Follow-up of a Randomized, Prospective Trial. Acta Derm. Venereol. 2012, 92, 641–647. [Google Scholar] [CrossRef] [Green Version]
  66. Shams, M.; Owczarczak, B.; Manderscheid-Kern, P.; Bellnier, D.A.; Gollnick, S.O. Development of Photodynamic Therapy Regimens That Control Primary Tumor Growth and Inhibit Secondary Disease. Cancer Immunol. Immunother. 2015, 64, 287–297. [Google Scholar] [CrossRef] [Green Version]
  67. Walsh, A.J.; Shah, A.T.; Sharick, J.T.; Skala, M.C. Fluorescence Lifetime Measurements of NAD(P)H in Live Cells and Tissue. In Advanced Time-Correlated Single Photon Counting Applications; Becker, W., Ed.; Springer Series in Chemical Physics; Springer International Publishing: Cham, Switzerland, 2015; pp. 435–456. ISBN 978-3-319-14929-5. [Google Scholar]
  68. Wang, H.-W.; Gukassyan, V.; Chen, C.-T.; Wei, Y.-H.; Guo, H.-W.; Yu, J.-S.; Kao, F.-J. Differentiation of Apoptosis from Necrosis by Dynamic Changes of Reduced Nicotinamide Adenine Dinucleotide Fluorescence Lifetime in Live Cells. J. Biomed. Opt. 2008, 13, 054011. [Google Scholar] [CrossRef]
  69. Becker, W.; Shcheslavskiy, V.; Studier, H. TCSPC FLIM with Different Optical Scanning Techniques. In Advanced Time-Correlated Single Photon Counting Applications; Becker, W., Ed.; Springer Series in Chemical Physics; Springer International Publishing: Cham, Switzerland, 2015; pp. 65–117. ISBN 978-3-319-14929-5. [Google Scholar]
  70. Sitiwin, E.; Madigan, M.C.; Gratton, E.; Cherepanoff, S.; Conway, R.M.; Whan, R.; Macmillan, A. Shedding Light on Melanins within in Situ Human Eye Melanocytes Using 2-Photon Microscopy Profiling Techniques. Sci. Rep. 2019, 9, 18585. [Google Scholar] [CrossRef]
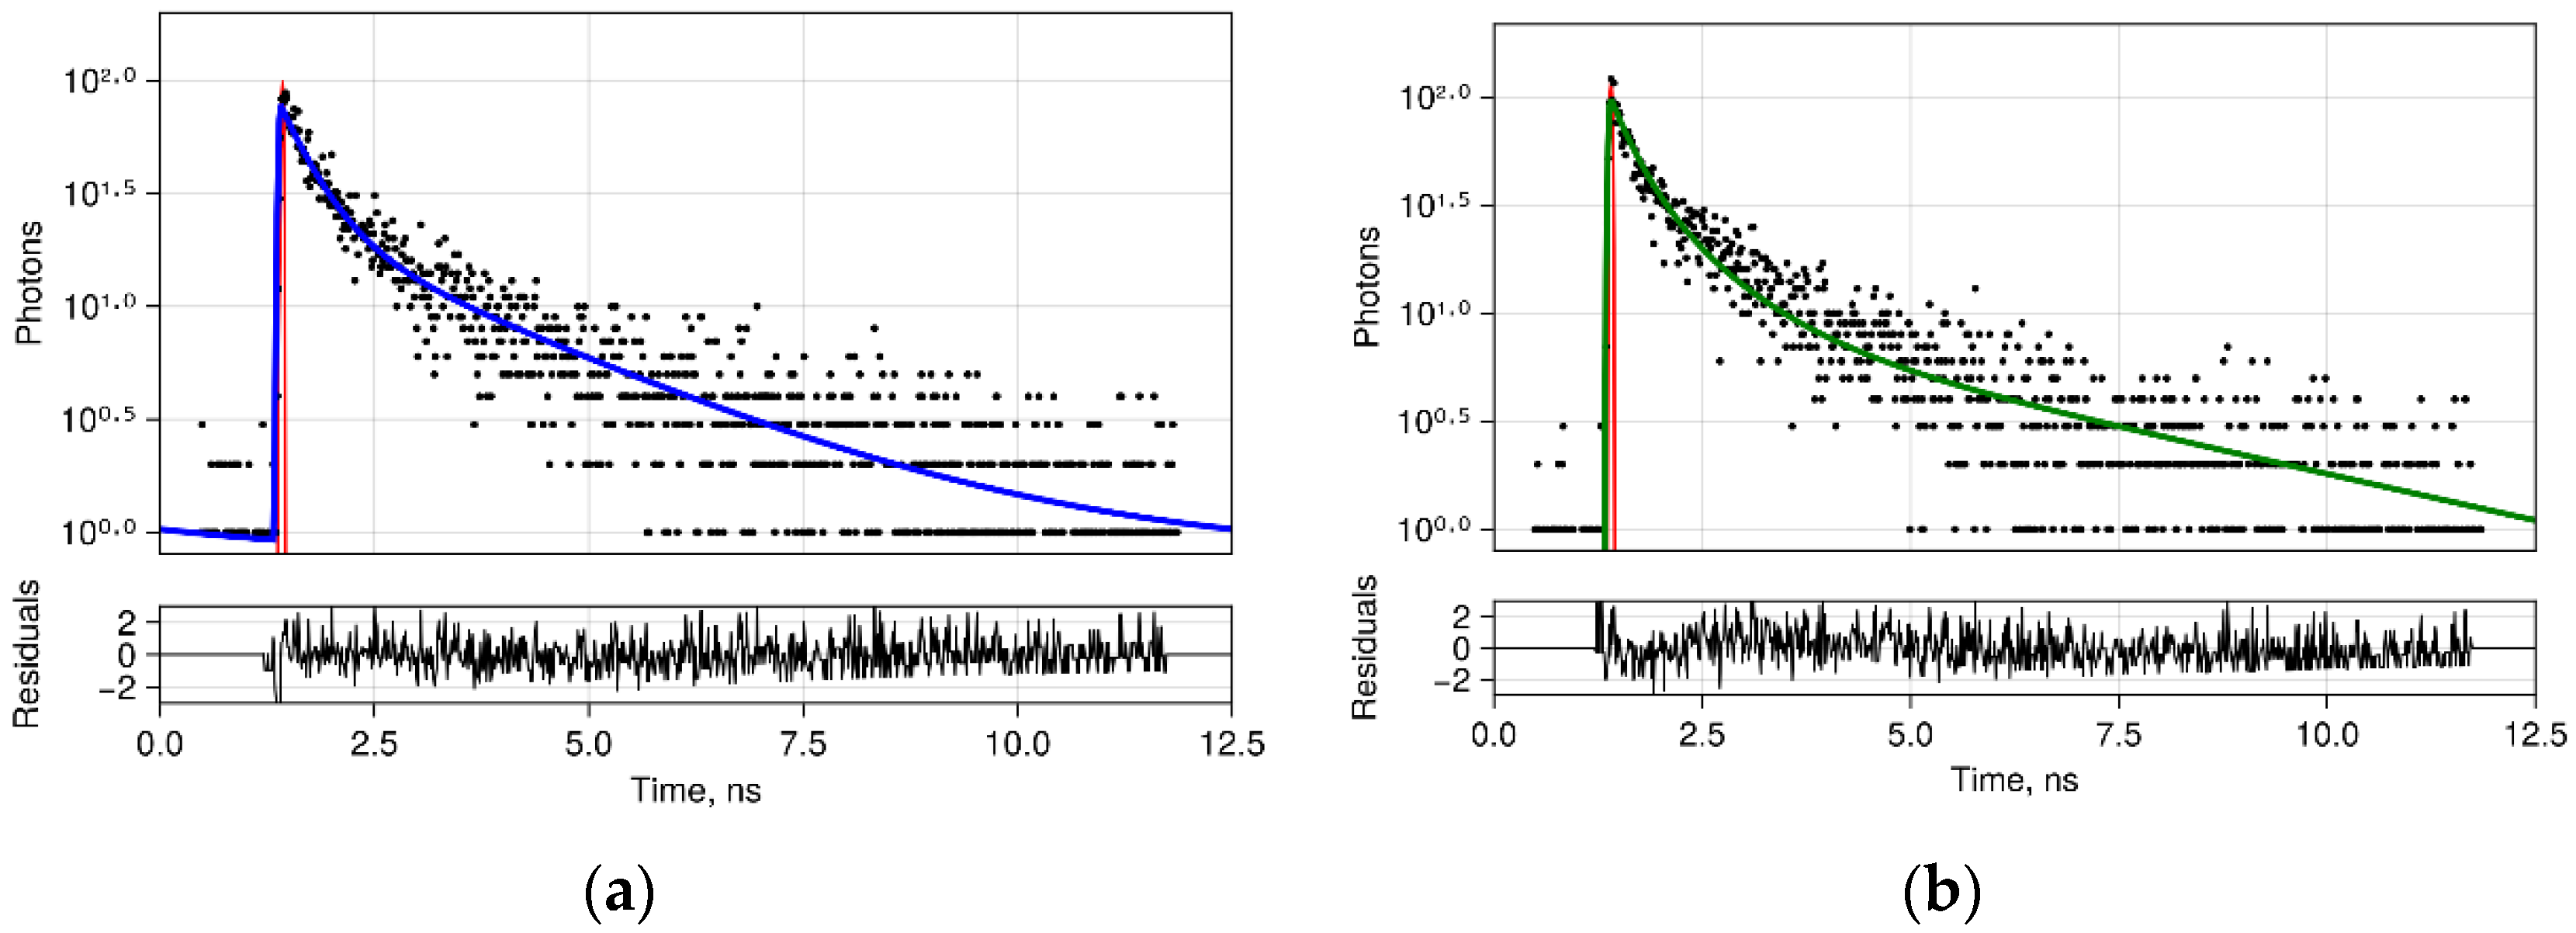
Figure 1. Fitting results for the lifetime of fluorescence in NADH (blue line, (a)) and in FAD (green line, (b)) spectral ranges. Red line is the IRF.
Photonics 09 00961 g001
Figure 2. Accumulation of 5-ALA-induced PpIX in polarized macrophages assessed by fluorescence spectra after 4 h of incubation with 0.6 mM 5-ALA (100 mg/kg). Error bars signify the standard deviation.
Photonics 09 00961 g002
Figure 3. Immunofluorescence staining of M0, M1, and M2 macrophage cultures after different PDT regimens. Staining for CD86 (marker M1, red), CD206 (marker M2, green), and nuclei with Hoechst 33342 (blue). Scale bars are 50 µm.
Photonics 09 00961 g003
Figure 4. Phasor diagrams for time-resolved fluorescence images of cell culture NADH fluorescence.
Photonics 09 00961 g004
Figure 5. Phasor diagrams for time-resolved fluorescence images of cell culture flavin fluorescence.
Photonics 09 00961 g005
Figure 6. Phasor diagrams for time-resolved fluorescence images of cell culture PpIX fluorescence.
Photonics 09 00961 g006
Figure 7. Staining for the presence of M1 and M2 macrophages in tumor sections after ALA–PDT (CD86+ is shown in red, CD163+ in green). Scale bars are 100 μm.
Photonics 09 00961 g007
Figure 8. Fraction of M1 and M2 macrophages in the tumor space, counted per total number of cells.
Photonics 09 00961 g008
Figure 9. Phasor diagrams for time-resolved fluorescence images of tumor slices after ALA–PDT in the spectral bands of NADH (a), flavins (b) and PpIX (c).
Photonics 09 00961 g009
Figure 10. NADH a1/a2 metabolic index averaged for tumor slices after ALA–PDT in various regimens, fluorescence images of tumor slices in pseudocolor of NADH a1/a2 metabolic index, proportion of M1(CD86+) and M2(CD163+) macrophages, averaged per cell number. Error bars signify the standard deviation weighed by the fluorescence intensity of pixels.
Photonics 09 00961 g010
Table 1. Specific fluorescence lifetimes for various cellular metabolites.
Spectral RangeCellular ComponentsDecay Time [ns]References
Blue
410–490 nm
NADHfree NADH—τ1 = 0.4
bound NADH—τ2 = 1.0–4.0
[39]
[14,45]
NAD(P)Hbound NAD(P)H—τ2 = 1.9–5.7[46,47,48,49,50]
Green–orange
510–590 nm
FADbound FAD—τ1 = 0.25
free FAD—τ2 = 1.4
[39]
FMN5.0[39]
Red
610–670 nm
PpIXmonomer, τ1 = 12.8–17.8
aggregates, τ2 = 3.5–3.9
[51]
Uro-porphyrin I1.7[52]
Uroporphyrin IIIτ1 = 8.4
τ2 = 16.5
[53]
PpIX’ photoproducts1.5–6, 2.6[54]
Publisher’s Note: MDPI stays neutral with regard to jurisdictional claims in published maps and institutional affiliations.