Abstract
The bonding structure is affected by environmental loads during use, causing internal stress in the adhesive layer, which leads to the debonding and expansion of the bonding layer. Therefore, it is important to accurately measure the stress distribution of the bonding layer to assess the life of the bonding structure. In this study, based on the transmission and reflection terahertz time-domain spectroscopy (THz-TDS) technique, the stress optical coefficients of a silicone adhesive were measured, and the calculation models of the transmission and reflection stress optical coefficients were derived. In the reflection calculation model, the caliper THz thickness measurement method was proposed to compensate for the thickness change of the silicone adhesive, under tensile stress. Under the transmission THz-TDS stress optical coefficient calculation model, the stress optical coefficient C of the silicone adhesive is 0.1142 ± 0.0057 MPa−1, and the stress optical coefficient C of the reflective system is 0.1135 ± 0.0051 MPa−1. The test results show that the reflective THz-TDS can also be used to measure the optical stress coefficient of the material, which compensates for the shortcomings of the traditional transmission measurement method, and lays a foundation for the characterization of the internal stress of the adhesive layer of the adhesive structure.
1. Introduction
Compared with traditional mechanical connections, bonding structures have the advantages of high connection efficiency, small stress concentration, and wide applicability, especially in lightweight structures [1,2]. Therefore, bonding structures are widely used in aerospace, shipbuilding, automotive, and other engineering fields [3,4]. Silicone adhesives have excellent heat resistance and aging resistance properties, and are indispensable high-performance materials in the field of modern high-tech engineering [5]. The internal stress in the adhesive layer is caused by microstructural evolution and environmental loading [6]. Internal and interfacial stresses may lead to the generation and expansion of debonding defects in the bonded structure, failing the entire bonded structure, which seriously threatens its safety. Therefore, to ensure the safe use of the bonding structure, it is important to characterize the residual stress of the adhesive using a non-destructive and accurate method.
Traditional non-destructive testing techniques for material stress characterization include X-ray diffraction (XRD), micro Raman spectroscopy (μRS), and photoluminescence spectroscopy (PL). The stress measurement method of XRD technology [7] was used to measure the change in crystal plane spacing in different directions on the sample surface. This change is shown by the movement of the position of each diffraction peak angle, which has high measurement accuracy. μRS [8] has proven to be an effective method for studying the vibration characteristics of crystals. This concept has been applied to stress-mapping semiconductor devices on the microscale, especially silicon-based semiconductor devices. However, XRD and μRS technology cannot calculate the internal stress of materials, and their measurement efficiency is low. PL technology [9] is used only to measure the stress at a certain depth of the material surface and cannot measure the stress of the entire material layer. Therefore, traditional non-destructive testing methods for material stress characterization cannot meet the testing requirements, and new non-destructive testing methods need to be developed.
The use of the principle of photoelasticity to measure the internal stress of materials has become the preferred experimental technique for stress analysis. The objective was to obtain the optical coefficient of the stress of the materials [10,11]. The traditional photoelastic stress measurement is in the visible light band; however, visible light cannot penetrate the organic silicone material, and internal stress characterization becomes difficult. THz has a more substantial penetration, negligible scattering, and higher resolution than microwave and other electromagnetic frequencies [12,13,14]. It is widely used in communication, non-destructive testing, biomedicine, and other fields [15,16]. Therefore, the application of terahertz technology in photoelastic stress measurements can satisfy the detection requirements of more materials. However, there has been little research on the application of the stress optical law in the terahertz band. Zhang et al. [17] presented a terahertz (THz) imaging method with a birefringent material that is sensitive to THz wave polarization. The anisotropy of the industrial sprayed-on-foam insulation (SOFI) is characterized by measuring its azimuthal angle-dependent THz polarization response. Schemmel et al. [18] measured the birefringence of ceramic sample yttria partially stabilized zirconia (YTZP) under stress loading and measured the stress optical coefficients of polytetrafluoroethylene (PTFE) at 260–380 GHz, using a transmission system. The feasibility of the terahertz band for stress measurements was verified. Moriwaki et al. [19] reported a transmissive polarization-sensitive terahertz time-domain spectroscopy (PS-THz-TDS) method for measuring the internal strain of transparent styrene-butadiene rubber. Song [20] studied the effect of uniaxial tensile stress on THz transmission through PTFE samples. The phase delay of transmitted THz radiation in PTFE under different stress states was measured by THz time-domain spectroscopy (THZ-TDS). Wang [21] used an improved transmission THz-TDS system to determine the plane stress state of optically opaque materials. The proposed method was experimentally verified, and the plane stress state of the PTFE specimen was obtained. The above studies focused on the measurement of the birefringence effect of materials and verified the feasibility of measuring the stress optical coefficient of materials, using a transmission terahertz system. However, the silicone adhesive was mostly inside the bonding structure, and the transmission system was difficult to sample. In particular, when the bonding structure has materials that the terahertz wave cannot penetrate, the transmission method cannot meet the detection requirements, and the reflective system becomes more practical.
In this study, a transmission and reflection PS-THz-TDS system was used to detect the stress optical coefficients of the silicone adhesive under uniaxial tensile stress. The calculation models for the two detection methods were also discussed. By comparing the measurement results of the two methods, the feasibility of reflective THz-TDS in measuring the optical stress coefficients of the materials was verified. Simultaneously, the caliper THz thickness measurement method was used to compensate for the thickness change of the silicone adhesive under tensile stress, which made the measurement results more accurate. The measurement of the optical stress coefficient provides a basis for the internal stress analysis of the organic silicone-bonded structure by THz-TDS.
2. Materials and Experiments
Figure 1a shows a schematic of the stress measurement system, which is an all-fiber PS-THz-TDS system. A mode-locked Ti sapphire femtosecond laser was used to generate a laser pulse with a central wavelength of 810 nm. The laser pulse was divided into a pump pulse and probe pulse through a beam splitter. The pump pulse is incident on a terahertz emitter, comprising a photoconductive antenna (PCA) to generate terahertz radiation. The probe pulse sampled the terahertz signal collected by the PCA detector. Figure 1b shows the transmission-detection system. The sample was placed between two linear grid polarizers, which generated and received polarized THz radiation in the bright-field path structure. Figure 1c shows the reflective detection system. Terahertz was vertically incident, focused on the sample, and then reflected onto the terahertz receiver. The effective terahertz spectral width of the system is 0.2–1.5 THz, spectral resolution is 3.1 GHz, signal-to-noise ratio is greater than 70 dB, fast scanning range is 160 ps, and time resolution is 0.1 ps.
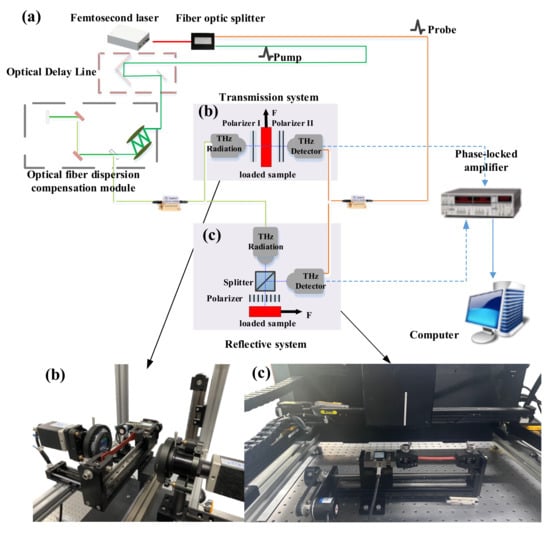
Figure 1.
Experimental installation for the measurement of the stress optical coefficient (a) Optical path diagram of stress measurement system; (b) Transmission measurement system; (c) Reflective measurement system.
RTV560 silicone rubber compound was used in the experiment, and the dibutyltin dilaurate (DBT) curing agent was configured at a ratio of 1000:1. The configured silicone adhesive was poured into the mold, as shown in Figure 2, and cured at a normal temperature of 25–30 °C for three days to obtain the test film. The physical parameters of the organic silica gel are listed in Table 1.
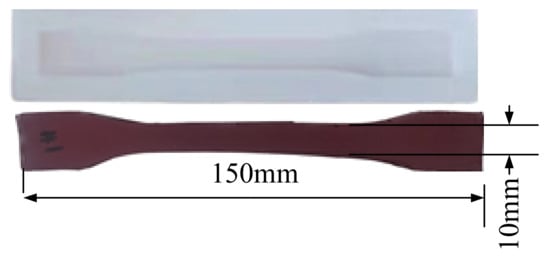
Figure 2.
Silicone adhesive film.

Table 1.
Physical parameters of organic silica adhesive.
Figure 3 shows the refractive index and extinction coefficient curve of the silicone adhesive in the range of 0.2–1 THz. It can be found that the refractive index and extinction coefficient change little with frequency and can be regarded as a constant. Therefore, the actual refractive index of the film can be characterized by calculating the equivalent refractive index in the calculation model.
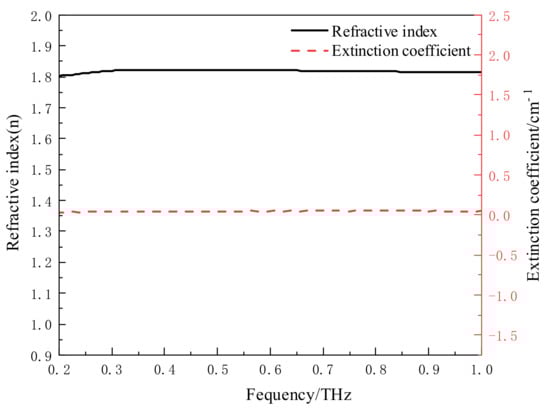
Figure 3.
Refractive index and extinction coefficient of silicone adhesive in terahertz band.
After obtaining the adhesive film sample, it was clamped into a self-developed uniaxial stress loading device, as shown in Figure 4, and tensile stress was applied to the sample. The device can provide 0–1 KN tensile stress with an accuracy of 0.01 N, and can read the real-time loading stress of the sample through the stress sensor.
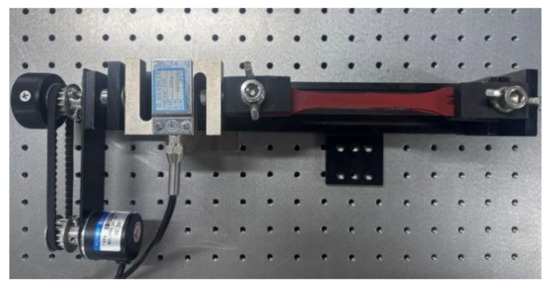
Figure 4.
Uniaxial stress loading device.
3. Methods and Models
3.1. Model of Stress Measurement
The stress optical law indicates that some isotropic materials exhibit optical anisotropy when subjected to a stress load [22,23]. Polarized terahertz waves exhibit birefringence when they pass through the loaded material. The incident terahertz wave in the material is decomposed into two mutually perpendicular plane-polarized terahertz waves, along the direction of the principal stress, and propagates at different speeds. There is a quantitative relationship between internal stress and the refractive index of the material. For linear elastic materials, the relationship between the change in the refractive index and the change in the principal stress should be proportional. Maxwell [24] established the following relationship:
where represents the refractive index of the material without stress and and are the principal refractive indices of the THz wave that vibrates along the principal stresses and , respectively. The principal stress applied in this study is uniaxial tensile stress; therefore, ; A and B are absolute stress optical coefficients, and their values are related to the material properties.
By subtracting Equation (2) from Equation (1), the relationship between the refractive index change of two beams of plane polarized light and the principal stress is obtained, as shown in Equation (3). C is the absolute stress optical coefficient of the sample, .
3.2. Calculation Model of Stress Optical Coefficient of Transmission THz-TDS
When the terahertz wave passes through the optical path, it is assumed that the initial amplitude of the terahertz wave , detected by the receiving antenna, is A0 and the initial phase is , when there is no sample in the optical path, and is used as the reference terahertz signal. The expression is:
When the sample is not loaded into the optical path, a phase delay of the terahertz wave received by the receiving antenna occurs. The terahertz expression detected by the receiving antenna is:
The expression of the phase delay can be expressed as:
where is the refractive index of air, which defaults to 1, d is the thickness of the specimen, c is the speed of light in a vacuum, and f is the frequency of the terahertz wave.
When a uniaxial tensile load is applied to the test piece, the phase difference between the terahertz wave , obtained by receiving antenna and reference signals, also changes accordingly, as shown in Equation (7).
The expression of phase delay is shown in Equation (8). Because the silicone adhesive belongs to elastomer, the thickness change of adhesive film under tensile stress cannot be ignored, and thickness change is introduced in the Equation.
where is the refractive index of the material under tensile stress.
The phase difference between the sample after and before loading is calculated as shown in Equation (9).
According to Poisson’s effect [20], as shown in Equation (10), the thickness change of the sample after being subjected to tensile stress can be calculated.
where is the Poisson ratio of the material and E is the elastic modulus of the material. Bringing Equation (10) into Equation (9), the relationship between the refractive index difference and the stress before and after loading is shown in Equation (11).
On the right side of Equation (11), the phase difference before and after loading can be obtained by THz-TDS, the tensile stress can be read by the loading device, and the remaining variables are constants. Therefore, can be calculated by obtaining the phase difference of the sample before and after the loading. The stress optical coefficient C of the material in the terahertz band can be obtained using Equation (3).
3.3. Calculation Model of Stress Optical Coefficient of Reflection THz-TDS
When the THz wave is reflected and transmitted at the material interface, the reflected echo of each interface exhibits a time difference. The THz time-domain waveform of the multilayer structure was obtained by detecting the interface-reflected echo of the THz wave at different flight times. As shown in Figure 5, the THz time-domain waveform of a certain point of the sample, peaks 1 and 2 reflect the echoes of interfaces I and II, respectively, where denotes the flight time difference.
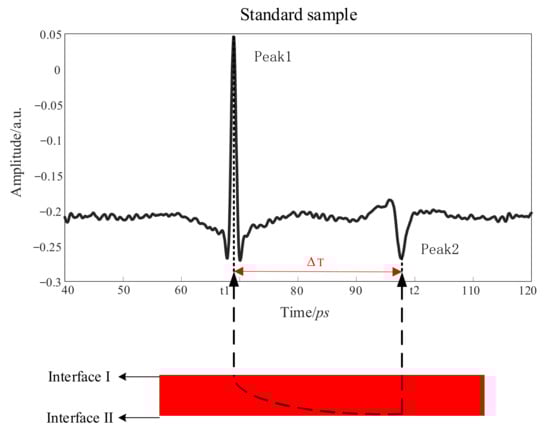
Figure 5.
Reflection terahertz time-domain waveform of sample.
The thickness information of the structure can be obtained by calculating the flight time difference between different peaks. The calculation formula is shown in Equation (12), where d is the sample thickness, and are the flight times corresponding to peaks 1 and 2, respectively, is the equivalent refractive index of the material in the terahertz band, and c is the propagation speed of light in a vacuum.
The silicone adhesive deforms under the action of uniaxial tensile stress, and its thickness becomes thinner, affecting the final calculation results. To obtain the real-time thickness of the adhesive film under stress, a caliper thickness measurement model was proposed. The thickness of the sample can be obtained without knowing the refractive index of the sample. As shown in Figure 6a, is the time-of-flight difference between the upper surface echo of metal plate peak3 and the lower surface echo of quartz plate peak2, under the condition of no adhesive film.` The silicone adhesive film was placed between the quartz plate and metal plate and kept parallel to each other, as shown in Figure 6b. is the time-of-flight difference, between the upper surface echo of the metal plate peak8 and the lower surface echo of the quartz plate peak5. is the time-of-flight difference, between the lower surface echo of the adhesive film peak7 and the upper surface echo of the adhesive film peak6. Using Equation (13), the thickness d of the adhesive film can be calculated. The refractive index of the silicone adhesive under different stress states can be obtained by substituting the calculated film thickness into Equation (12), and the stress optical coefficient C of the silicone adhesive can be obtained using Equation (3).
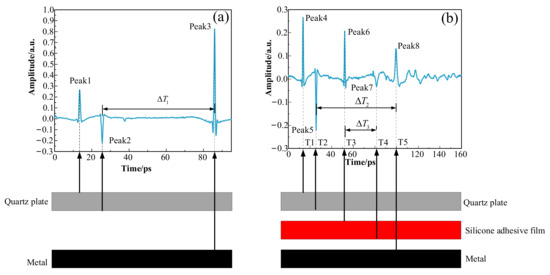
Figure 6.
THz caliper thickness measurement principle.
4. Results and Discussion
4.1. Measurement of Stress Optical Coefficient of Silicone Adhesive in Transmission System
In the experiment, seven groups of THz time-domain signals of the silicone adhesive film were recorded under different stress states, one of which was the THz time-domain signal when the film was not loaded. The phase difference between the loaded and unloaded samples was obtained using Fourier transform, which applied 0.25, 0.50, 0.75, 1.00, 1.25, and 1.50 MPa stresses to the adhesive film by using the uniaxial stress loading device. Figure 7a shows the phase-difference curve for the six loading environments. It can be observed from the figure that the phase difference is approximately linear with the frequency. Figure 7b shows the curve after linear fitting. According to Equation (11), the refractive index difference of the adhesive film can be obtained by calculating the slope of the curve. The slope and linear goodness of the fitted curve are shown in Table 2.
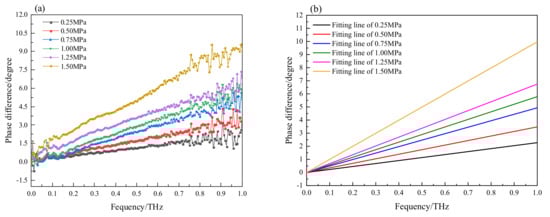
Figure 7.
Phase differences in the transmitted radiations of the unload and loaded samples. (a) the phase-difference curve for the six loading environments. (b) phase-difference curve after linear fitting for the six loading environments.
Table 2.
Slope and linear goodness of linear fitting.
Figure 8 shows the relationship curve between refractive index difference and stress. The black square in the figure is the experimental data, and the red solid line represents the linear fitting. It can be observed that there is a good linear relationship between the refractive index difference and stress. The linear goodness of fit is 98.73%. It can be concluded that the organic silica adhesive shows a birefringence effect under uniaxial stress, and meets the stress optical law. The slope of the line of the stress optical coefficient C of the organic silica adhesive is 0.1142 ± 0.0057 MPa−1.
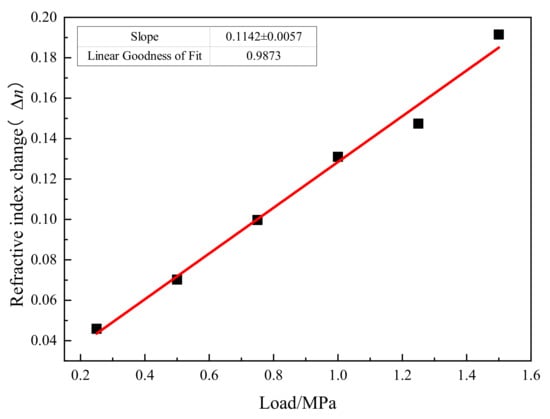
Figure 8.
Under different stress states .
4.2. Measurement of Stress Optical Coefficient of Silicone Adhesive in Reflection System
The organic silica adhesive film (materials are provided by GE Silicones company of America) was fixed onto the stress-loading device (the equipment is provided by Jing-Wang Testing Machine Manufacturing Co, Ltd. from Changchun, China.) using a wedge-shaped fixture, and the lower surface of the film was placed on the focal length of the reflective THz time-domain system. A two-dimensional scanning platform was used to drive the terahertz probe, and the terahertz time-domain spectra of the organic silica adhesive film under different tensile stresses were recorded point-by-point. The scanning area is shown in the black box selection area in Figure 9. Its area is , scanning step is 1 mm, and the sample is loaded to 1.25 MPa at a step of 0.25 MPa.
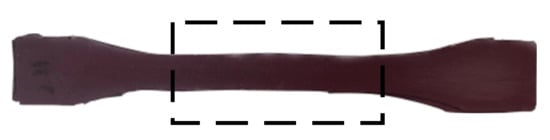
Figure 9.
Adhesive film scanning area.
Figure 10 is the thickness distribution imaging of organic silica adhesive film under different tensile loads. It can be observed that the thickness of the film decreases with the increase of tensile stress, and the thickness of the film in different regions changes evenly.
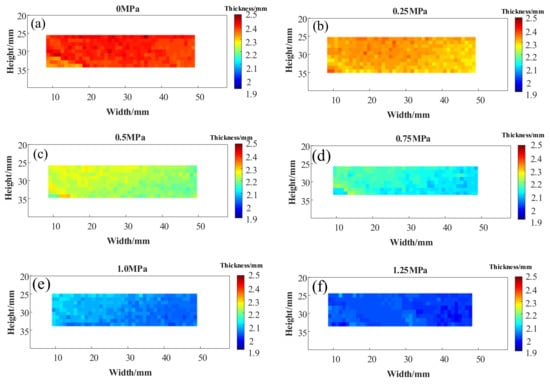
Figure 10.
Thickness distribution of adhesive film under different tensile stress. (a) the thickness distribution under 0 Mpa tensile loads. (b) the thickness distribution under 0.25 Mpa tensile loads. (c) the thickness distribution under 0.5 Mpa tensile loads. (d) the thickness distribution under 0.75 Mpa tensile loads. (e) the thickness distribution under 1.0 Mpa tensile loads. (f) the thickness distribution under 1.25 Mpa tensile loads.
After obtaining the adhesive film thickness under different tensile stresses, the equivalent refractive index distribution of the film under different stresses was obtained using Equation (12), as shown in Figure 11. The chromaticity value in this figure represents the equivalent refractive index of the film. It can be observed that with an increase in tensile stress, the refractive index of the film increases, and the refractive index of the film in different regions changes evenly. This shows that the silicone adhesive has a birefringence effect under the action of stress and that the refractive index changes.
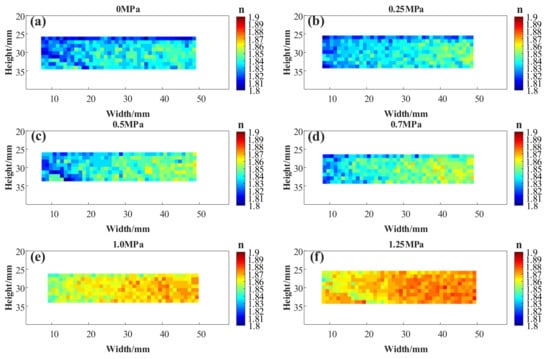
Figure 11.
Refractive index distribution of adhesive film under different tensile stress. (a) the refractive index distribution under 0 Mpa tensile loads. (b) the refractive index distribution under 0.25 Mpa tensile loads. (c) the refractive index distribution under 0.5 Mpa tensile loads. (d) the refractive index distribution under 0.75 Mpa tensile loads. (e) the refractive index distribution under 1.0 Mpa tensile loads. (f) the refractive index distribution under 1.25 Mpa tensile loads.
To avoid measurement error of the single-point refractive index, the refractive index of the adhesive film under different tensile stresses in Figure 11 was statistically analyzed. As shown in Figure 12, the abscissa in the figure shows six groups of loading stress values; the left axis is the refractive index of the silicone adhesive, under the measurement of the reflective system, and the right axis is the refractive index difference of the silicone adhesive, under the measurement of the transmission system. The black squares in the figure represent the mean values of the refractive index of the film under different tensile stresses. By linearly fitting the mean refractive index of the silicone adhesive under six groups of stresses, the results shown by the red line in the figure were obtained. The slope of the linear fitting line is the stress optical coefficient of the silicone adhesive, C = 0.1135 ± 0.0051 MPa−1 and linear goodness of fit was 0.9902. Compared with the calculation result of the transmission formula, as shown by the black line (the fitting results in Figure 8) in the figure, the relative error of the C value was 0.0007 MPa−1. The feasibility of the reflective calculation model for calculating the optical stress coefficient of the silicone adhesive was verified.
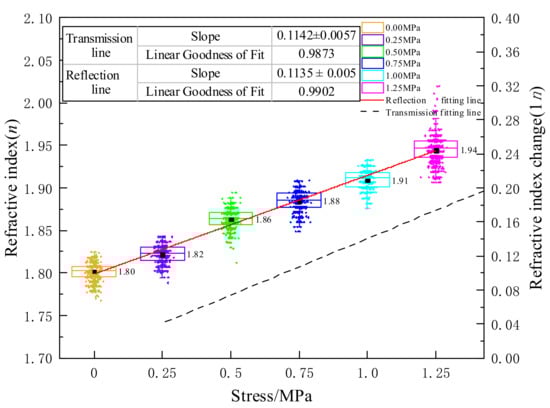
Figure 12.
Relation between the refractive index and stress.
5. Conclusions
In this study, the optical stress coefficient of the silicone adhesive was calibrated using terahertz time-domain spectroscopy. The terahertz time-domain spectra of the samples under different uniaxial stress tensile loads were obtained using an improved transmission terahertz time-domain spectroscopy system and reflection terahertz time-domain spectroscopy system. In the reflective stress optical coefficient calculation model, a gauge terahertz thickness measurement method, which compensates for the thickness change of organic silicone under load, and makes the measurement results more accurate, is proposed. According to the test, under the traditional transmission terahertz time-domain spectroscopy stress optical coefficient calculation model, the stress optical coefficient C of the silicone adhesive was 0.1142 ± 0.0057 MPa−1 and the measurement result of the stress optical coefficient of the silicone adhesive in the reflective system was 0.1135 ± 0.0051 MPa−1. The difference in the refractive index increased linearly with the applied stress. The results show that it is feasible to calculate the stress optical coefficient of materials using a reflection terahertz time-domain spectroscopy system, and they also provide a new method for measuring the stress optical coefficient of materials. The determination of the stress optical coefficient also lays the foundation for the internal stress characterization of the bonding interface of the silicone adhesive structure.
Author Contributions
Conceptualization, Y.-F.Z.; data curation, Y.-F.Z. and J.-J.R.; formal analysis, Y.-F.Z.; funding acquisition, L.-J.L.; investigation, J.-J.R. and L.-J.L.; methodology, Y.-F.Z. and J.-Y.Z.; project administration, J.-J.R., D.-D.Z. and Q.C.; resources, L.-J.L.; software, Y.-F.Z. and J.G.; supervision, J.-J.R., L.-J.L., D.-D.Z. and J.-W.X.; validation, Y.-F.Z., J.-J.R. and D.-D.Z.; visualization, Y.-F.Z.; writing—original draft, Y.-F.Z.; writing—review & editing, J.-Y.Z. and J.-W.X. All authors have read and agreed to the published version of the manuscript.
Funding
This research was funded by the Jilin Province Science and Technology Development Plan Project (Grant No. 20220508032RC), as well as the second batch of social welfare and basic research projects in Zhongshan (Grant No. 2022B2012).
Acknowledgments
This research was supported by the science and technology research project of the Jilin Province Science and Technology Development Plan Project (Grant No. 20220508032RC), as well as the second batch of social welfare and basic research projects in Zhongshan (Grant No. 2022B2012). We thank Changchun University of Science and Technology for using their equipment.
Conflicts of Interest
This manuscript has not been published or presented elsewhere in part or entirety and is not under consideration by another journal. We have read and understood your journal’s policies, and we believe that neither the manuscript nor the study violates any of these. The authors declare no conflict of interest.
References
- Yang, S.; Gu, L.; Gibson, R.F. Nondestructive detection of weak joints in adhesively bonded composite structures. Compos. Struct. 2001, 51, 63–71. [Google Scholar] [CrossRef]
- Romano, M.G.; Guida, M.; Marulo, F.; Giugliano Auricchio, M.; Russo, S. Characterization of adhesives bonding in aircraft structures. Materials 2020, 13, 4816. [Google Scholar] [CrossRef] [PubMed]
- Abdel-Monsef, S.; Renart, J.; Carreras, L.; Maimí, P.; Turon, A. Environmental effects on the cohesive laws of the composite bonded joints. Compos. Part A 2022, 155, 106798. [Google Scholar] [CrossRef]
- Amancio-Filho, S.T.; dos Santos, J.F. Joining of polymers and polymer–metal hybrid structures: Recent developments and trends. Polym. Eng. Sci. 2009, 49, 1461–1476. [Google Scholar] [CrossRef]
- Giese-Hinz, J.; Kothe, C.; Louter, C.; Weller, B. Mechanical and chemical analysis of structural silicone adhesives with the influence of artificial aging. Int. J. Adhes. Adhes. 2021, 117, 103019. [Google Scholar] [CrossRef]
- Zhong, Y.-F.; Ren, J.J.; Li, L.-J.; Zhang, J.; Zhang, D.; Gu, J.; Xue, J.; Chen, Q. Terahertz data analytics-based bonding interface damage characterization in a multilayer structural composites under cyclic loading. Polym. Test. 2022, 116, 107785. [Google Scholar] [CrossRef]
- Matejícek, J.; Sampath, S.; Dubsky, J. X-ray residual stress measurement in metallic and ceramic plasma sprayed coatings. J. Therm. Spray Technol. 1998, 7, 489–496. [Google Scholar] [CrossRef]
- Loechelt, G.H.; Cave, N.G.; Menéndez, J. Measuring the tensor nature of stress in silicon using polarized off-axis Raman spectroscopy. Appl. Phys. Lett. 1995, 66, 3639–3641. [Google Scholar] [CrossRef]
- Jiang, P.; Fan, X.L.; Sun, Y.L.; Wang, H.T.; Su, L.C.; Wang, T.J. Thermal-cycle dependent residual stress within the crack-susceptible zone in thermal barrier coating system. J. Am. Ceram. Soc. 2018, 101, 4256–4261. [Google Scholar] [CrossRef]
- James, D.F.; Phillips, J. Manual on Experimental Stress Analysis; Society for Experimental Mechanics: Bethel, CT, USA, 1989. [Google Scholar]
- Dally, J.; Riley, W. Experimental Stress Analysis; McGraw-Hill: New York, NY, USA, 1978. [Google Scholar]
- Zhang, D.D.; Ren, J.J.; Gu, J.; Li, L.J.; Zhang, J.; Xiong, W.; Zhong, Y.; Zhou, T. Nondestructive testing of bonding defects in multilayered ceramic matrix composites using THz time domain spectroscopy and imaging. Compos. Struct. 2020, 251, 112624. [Google Scholar] [CrossRef]
- Beiranvand, B.; Sobolev, A.S.; Larionov, M.Y.; Kuzmin, L.S. A Distributed Terahertz Metasurface with Cold-Electron Bolometers for Cosmology Missions. Appl. Sci. 2021, 11, 4459. [Google Scholar] [CrossRef]
- Behrokh, B.; Sobolev, A.S.; Anton, V.; Kudryashov, A.V. Composite right/left-handed transmission line with array of thermocouples for generating terahertz radiation. Appl. Phys. 2020, 92, 20502. [Google Scholar] [CrossRef]
- Han, C.; Wang, Y.; Li, Y.Q.; Chen, Y.; Abbasi, N.A.; Kurner, T.; Molisch, A.F. Terahertz Wireless Channels: A Holistic Survey on Measurement, Modeling, and Analysis. IEEE Commun. Surv. Tutor. 2022, 24, 1670–1707. [Google Scholar] [CrossRef]
- Akyildiz, I.F.; Han, C.; Hu, Z.; Nie, S.; Jornet, J.M. Terahertz Band Communication: An Old Problem Revisited and Research Directions for the Next Decade. IEEE Trans. Commun. 2022, 70, 4250–4285. [Google Scholar] [CrossRef]
- Zhang, L.L.; Zhong, H.; Deng, C.; Zhang, C.L.; Zhao, Y.J. Terahertz polarization imaging with birefringent materials. Opt. Commun. 2010, 283, 4993–4995. [Google Scholar] [CrossRef]
- Schemmel, P.; Diederich, G.; Moore, A.J. Direct stress optic coefficients for YTZP ceramic and PTFE at GHz frequencies. Opt. Express 2016, 24, 8110–8119. [Google Scholar] [CrossRef] [PubMed]
- Moriwaki, A.; Okano, M.; Watanabe, S. Internal triaxial strain imaging of visibly opaque black rubbers with terahertz polarization spectroscopy. APL Photonics 2017, 2, 106101. [Google Scholar] [CrossRef]
- Song, W.; Li, L.-A.; Wang, Z.; Wang, S.; He, M.; Han, J.; Cong, L.; Deng, Y. Experimental verification of the uniaxial stress-optic law in the terahertz frequency regime. Opt. Lasers Eng. 2014, 52, 174–177. [Google Scholar] [CrossRef]
- Wang, Z.; Kang, K.; Wang, S.; Li, L.; Xu, N.; Han, J.; He, M.; Wu, L.; Zhang, W.; Jia, G.; et al. Determination of plane stress state using terahertz time-domain spectroscopy. Sci. Rep. 2016, 6, 36308. [Google Scholar] [CrossRef] [PubMed]
- Sotta, P.; Albouy, P.A.; Abou Taha, M.; Moreaux, B.; Fayolle, C. Crosslinked elastomers: Structure–property relationships and stress-optical law. Polymers 2021, 14, 9. [Google Scholar] [CrossRef] [PubMed]
- Muller, R.; Vergnes, B. Validity of the stress optical law and application of birefringence to polymer complex flows. Rheol. Ser. 1996, 5, 257–284. [Google Scholar] [CrossRef]
- Decruppe, J.; Humbert, C. Stress Optical Coefficient of Viscoelastic Solutions; Steinkopff: Heidelberg, Germany, 1998. [Google Scholar]
Publisher’s Note: MDPI stays neutral with regard to jurisdictional claims in published maps and institutional affiliations. |
© 2022 by the authors. Licensee MDPI, Basel, Switzerland. This article is an open access article distributed under the terms and conditions of the Creative Commons Attribution (CC BY) license (https://creativecommons.org/licenses/by/4.0/).