Article

Instantaneous Frequency Measurement with Reasonable Resolution and Simple Structure

1
College of Electronic and Information Engineering, Shandong University of Science and Technology, 579 Front Bay Harbour Road, Qingdao 266590, China
2
School of Information Science and Engineering, Shandong University, 72 Binhai Road, Jimo District, Qingdao 266237, China
*
Author to whom correspondence should be addressed.
Photonics 2022, 9(10), 685; https://doi.org/10.3390/photonics9100685
Submission received: 8 August 2022 / Revised: 18 September 2022 / Accepted: 20 September 2022 / Published: 23 September 2022

Abstract

:
Microwave signals carry important intelligence information in electronic warfare. Hence, the measurement of microwave signals plays a very important role. Traditional electronic microwave measurement systems are not appropriate for the instantaneous frequency measurement (IFM) of high-speed signals. A simple and low-cost photonic approach to the IFM based on frequency-to-power mapping is proposed and demonstrated with a reasonable resolution. The measurement is performed on account of a double Mach–Zehnder modulator (MZM), single-mode fiber (SMF), photodetector (PD), and signal processing. The scheme using four wavelengths achieves resolutions of ±0.1 and ±0.09 GHz respectively for the 15.8–18.4 and 18.4−21.2 GHz frequency measurement ranges. Therefore, the scheme is a broad prospects method for high-resolution IFM. Moreover, it is of great importance for applications in electronic warfare and high-resolution sensor systems.

1. Introduction

Modern electronic warfare (EW) and wireless communication systems need an efficient tool to analyze microwave signals [1]. The frequency measurement of a microwave signal is very important in modern EW applications and wireless communication systems [2,3]. Although traditional electronic microwave measurement solutions are well established, it is not suitable for the signals of high-frequency because of the weakness of electronic devices [4]. Microwave frequency measurement in the microwave photonics domain offers many advantages such as small volume, high flexibility, and fast speed [5]. Therefore, the microwave photonics methods have been considered a promising scheme suitable for IFM systems. In recent years, some IFM schemes have been proposed [6,7,8,9,10,11,12,13,14,15,16,17,18,19,20,21,22,23,24,25,26,27]. In these schemes, the frequency measurements of the microwave signals are achieved by methods based on frequency-to-space mapping [6,7,8,9], frequency-to-time mapping [10,11,12,13,14,15,16,17], and frequency-to-power mapping [18,19,20,21,22,23,24,25,26,27].
For the frequency-space mapping techniques, the optical signal is modulated with a microwave signal, and then split into multiple channels by an optical domain. The space channel can be implemented by a Fiber Bragg Grating (FBG) [6,7] an arrayed-waveguide grating [8], or a diffraction grating [9]. Most of these solutions [6,7,8,9] can measure multiple frequencies, but the accuracy of frequency measurement is low. On the other hand, thanks to the large photodiode array required, the systems usually have a high cost and low resolution. The advantage of the system [10] is that the multiple frequencies can be measured simultaneously. But the measurement range and resolution are affected by the optical ON-OFF switching and the sampling rate of the oscilloscope. Although a broad measurement range is achieved [11], it causes an obvious delay as well as increases the complexity of the system because of a large number of circulations. To improve the rate of measurement, Fourier transform-based scheme is proposed [12,13,14,15]. The advantage of these systems is the high measurement resolution, the disadvantage is that they do not offer a large measurement range and high resolution simultaneously. Another solution is the photonics-based frequency scanning measurement [16,17]. The schemes improve the rate of frequency measurement. However, the systems usually have high complexity and poor continuity.
The fundamental principle of the frequency-power mapping techniques is to construct a uniquely determined relationship between frequency and power. This relationship is called amplitude comparison function (ACF) [18]. Under normal conditions, a system with high resolution and a large measurement range is hard to achieve at the same time. However, IFM schemes with variable frequency range and resolution can deal with this problem. The schemes are implemented by using a dual-parallel MZM (DPMZM) [19], varying the wavelength [20,21,22], or using the Stimulated Brillouin Scattering (SBS) effect [23]. This problem can also be solved by increasing the slope of the ACF [24,25,26,27,28]. The systems reach the results of measurement frequency in the shortest time and do not cause a constraint on the system structure. The scheme uses both intensity modulation and phase modulation [29]. SBS-based IFM [30] can achieve ultra-high resolution, on the other hand, it can run on a very wide bandwidth. Although many IFM schemes are available, these schemes increase the complexity of the system while improving its performance. Therefore, high-resolution IFM schemes with simple structures are still a problem that needs to be solved.
In this paper, the IFM scheme is a simple and flexible approach with high resolution. The dual-source structure is beneficial to ensure the stability of the light source and improve resolution. In addition, the single-mode fiber has less dispersion ripple than multi-channel chirped fiber Bragg gratings, which is good for improving resolution. And the system is less costly than the frequency-to-space mapping scheme.

2. Principle

The rationale of the scheme is as follows: firstly, an optical signal and a microwave signal enter the Mach–Zehnder modulator (MZM) to perform intensity modulation at the same time. The modulated signal is then sent to the single-mode fiber and detects the microwave power at the photodetector. This makes it possible to measure the frequency by measuring the power.
As described in Figure 1, we deployed a continuous wave laser, a microwave signal generator, a Mach–Zehnder modulator, a single-mode fiber, and a photodetector. The microwave signal is as follows
V i n = V m sin ( w m t ) w m = 2 π f m
where V m is the amplitude of the microwave signal, f m is the frequency of the microwave signal, and w m is the angular frequency of the microwave signal. The optical signal can be written as
E i n ( t ) = E e j w 0 t
where E is the amplitude of the optical signal, and w 0 is the angular frequency of the optical signal. In the experimental, optical phase and intensity noise is zero or very small due to the optical signal is stable. We think that the phase and intensity noise of optical signal has little influence on the results. Hence, Equation (2) not consider the impact of optical phase and intensity noise. The signal of modulation completion is as follows
E o u t = ( 1 + J 0 2 ) cos ( w 0 t ) J 1 cos ( w 0 + w m ) t J 1 cos ( w 0 w m ) t
where J n ( ) is the nth-order Bessel function of the first kind. The signal [28] turns out as follows after going through a single-mode fiber
E o u t = ( 1 + J 0 2 ) cos ( w 0 t + φ 0 ) + J 1 [ cos ( w 0 + w m ) t + φ 1 ] J 1 cos ( w 0 w m + φ 1 ) t φ 0 = β 0 ( w 0 ) L φ 1 = β 0 ( w 0 ) L β 1 ( w 0 ) w m L + 1 2 β 2 ( w 0 ) w m 2 L φ 1 = β 0 ( w 0 ) L + β 1 ( w 0 ) w m L + 1 2 β 2 ( w 0 ) w m 2 L
where φ n is the additional phase, β n is the nth-order dispersion coefficient, and L is the length of the single-mode fiber. After the signal passes through the PD, ignoring the DC and frequency multiplier signals, the current of the output signal is as follows
i ( t ) = 4 J 1 ( 1 + J 0 2 ) cos ( w m t + φ 1 + φ 1 2 ) cos ( φ 1 + φ 1 2 φ 0 )
Therefore, the power value [29] of the PD output signal is as follows
P = i 2 ( t ) = α cos 2 [ π DL λ i 2 f m 2 c ] .
where D is the dispersion coefficient, λ i , i = 1 , 2 are the two wavelengths, c is the speed of light, and α indicates the loss of energy in the link.
Given the loss of the frequency, the measurement link is ignored, and the parameters D , L and λ are determined. The maximum measured frequency value is also determined. Hence, the power value obtained from the data processing can be used to inverse solve the maximum measured frequency value. The maximum measured frequency value is derived according to Equation (6), and as follows
F max = c 2 DL λ 2
To avoid unnecessary interference in the accuracy of the scheme, we make the losses of the signal in the two branches equal during their respective transmission. In obtaining the final microwave power ratio, it makes the measurement of the system more accurate. Consequently, we have α 1 = α 2 . The ACF is given by
A C F = P o u t 1 P o u t 2 = α 1 cos 2 [ π DL λ 1 2 f m 2 c ] α 2 cos 2 [ π DL λ 2 2 f m 2 c ] = cos 2 [ π DL λ 1 2 f m 2 c ] cos 2 [ π DL λ 2 2 f m 2 c ]
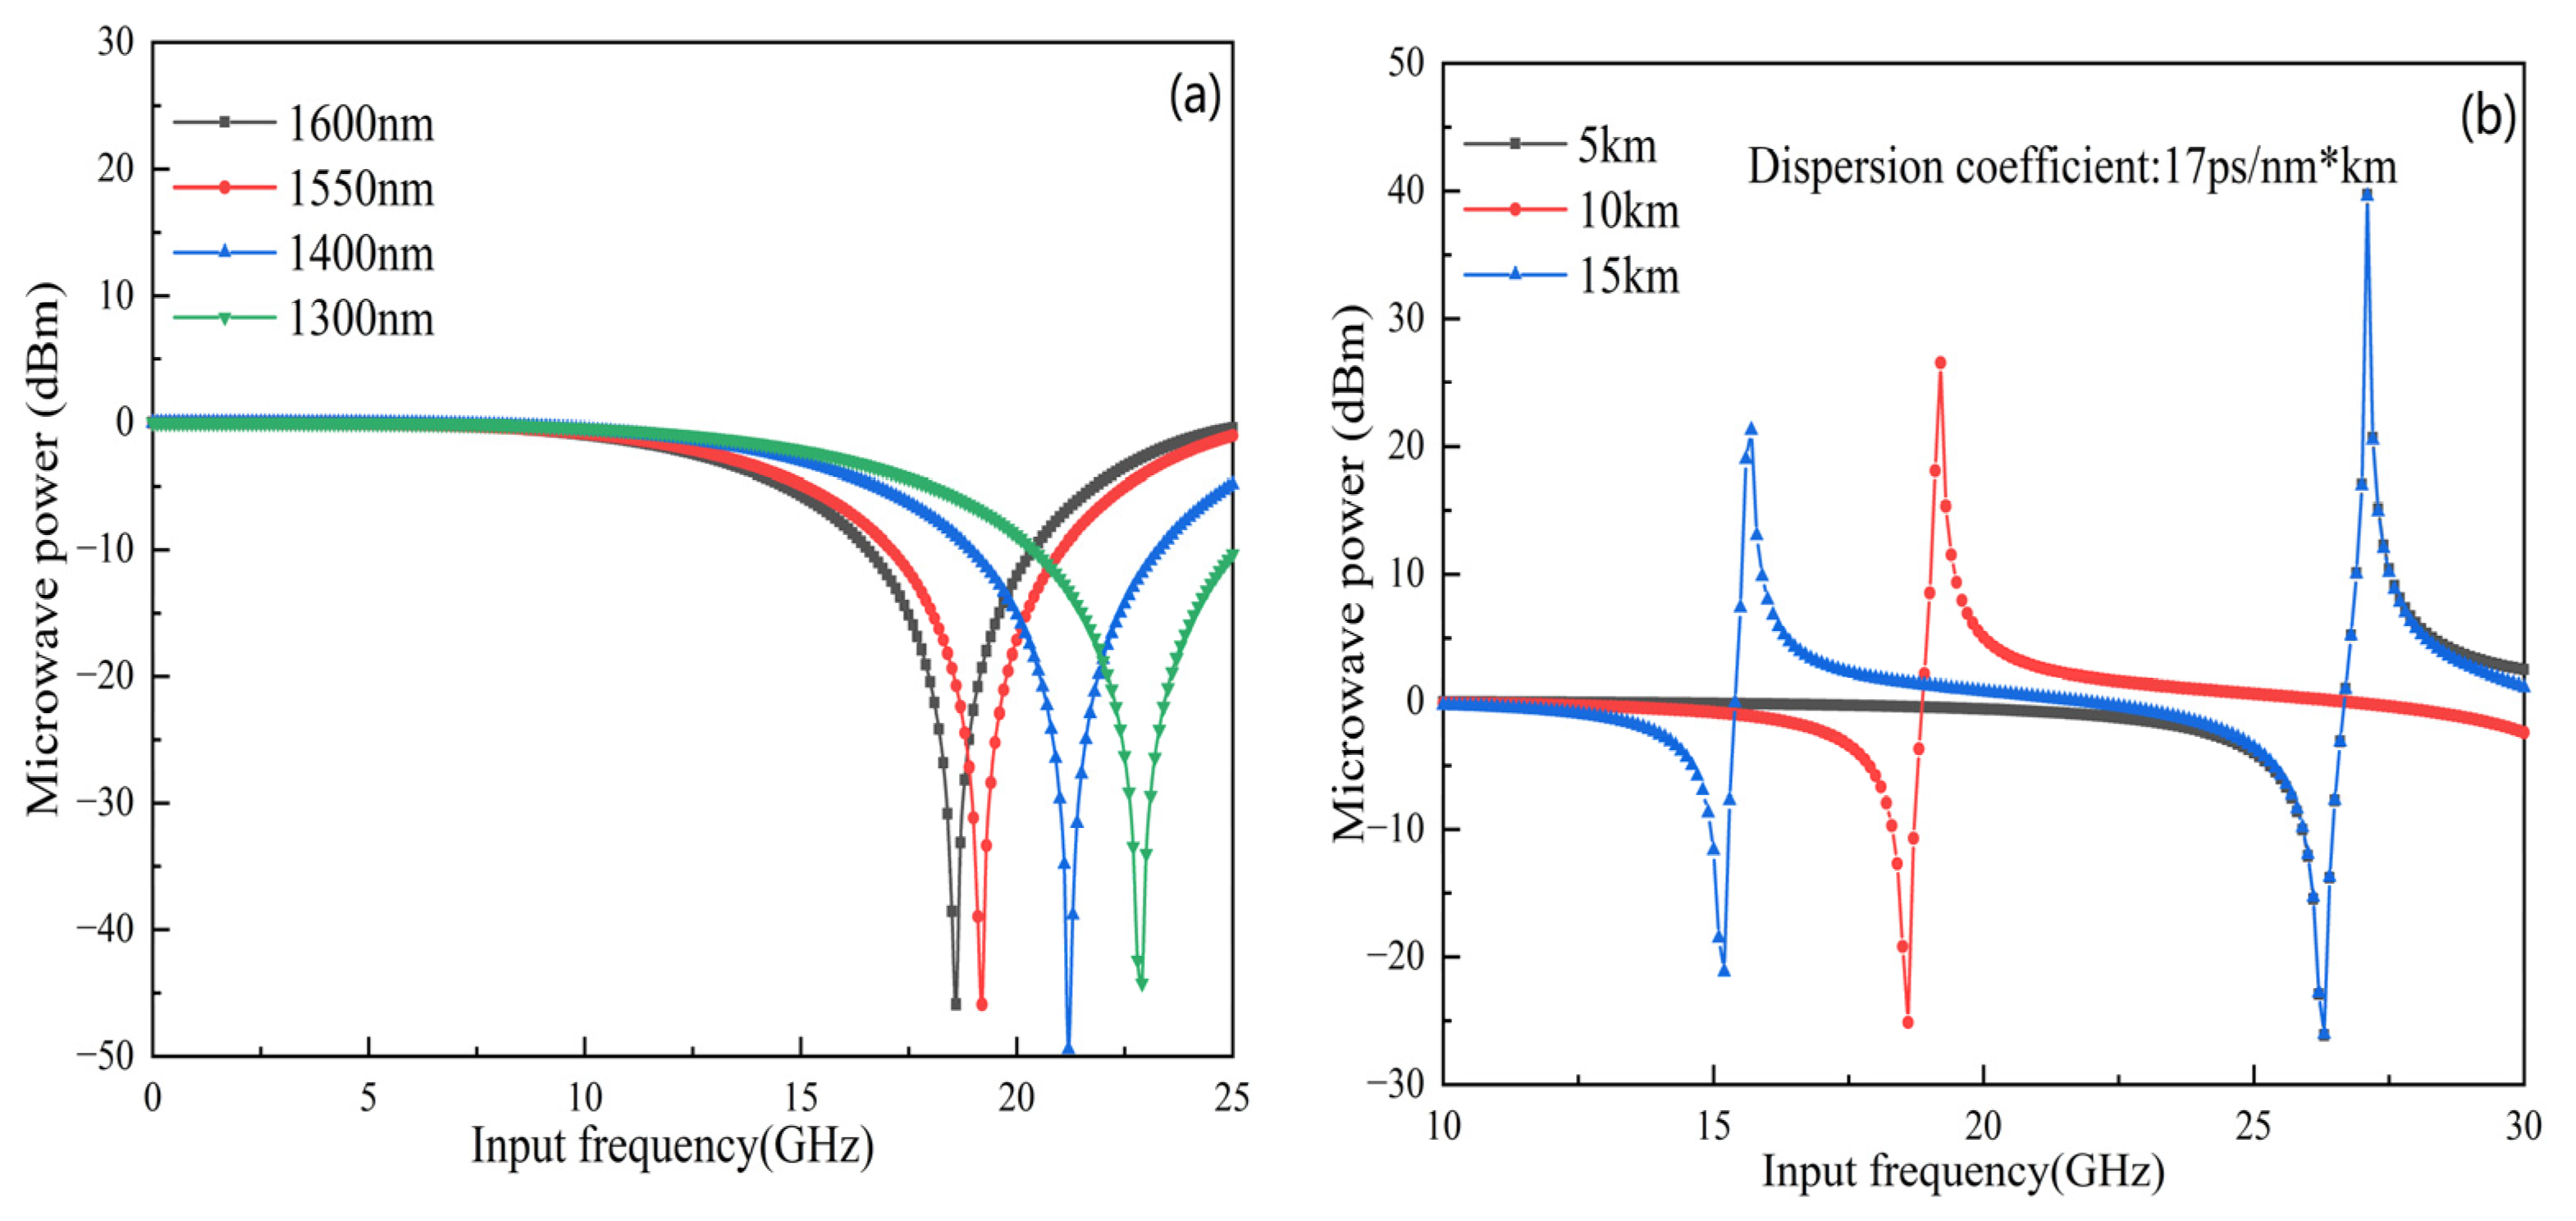
Figure 2a shows the relationship between frequency and microwave power at different wavelengths. As shown in Figure 2a, the wavelengths are 1300 nm, 1400 nm, 1550 nm, and 1600 nm respectively. The microwave power curve has two monotonic intervals. The first monotonic interval is selected for estimating the microwave frequency without ambiguity. The range of the first monotonic interval decreases with increasing wavelength. It shows that the frequency measurement ranges are reducing with enhancing wavelength. The maximum value of the frequency of the first monotonic interval is called the notch point. In this paper, the dispersion coefficient of fiber is 17 ps / nm * km . The longer the fiber length, the greater the influence of dispersion on the results. Figure 2b shows the microwave power curves for different fiber lengths. The range of measurement outcomes is decreasing with increasing fiber length. When the fiber length is 5 km, the frequency measurement range is wide, the microwave power curve changes flat in the early stage, leading to a large error. When the fiber length is 15 km, the range of frequency measurement is small. Therefore, to balance the measurement range and error, the fiber length is chosen as 10 km.

3. Experimental Demonstration

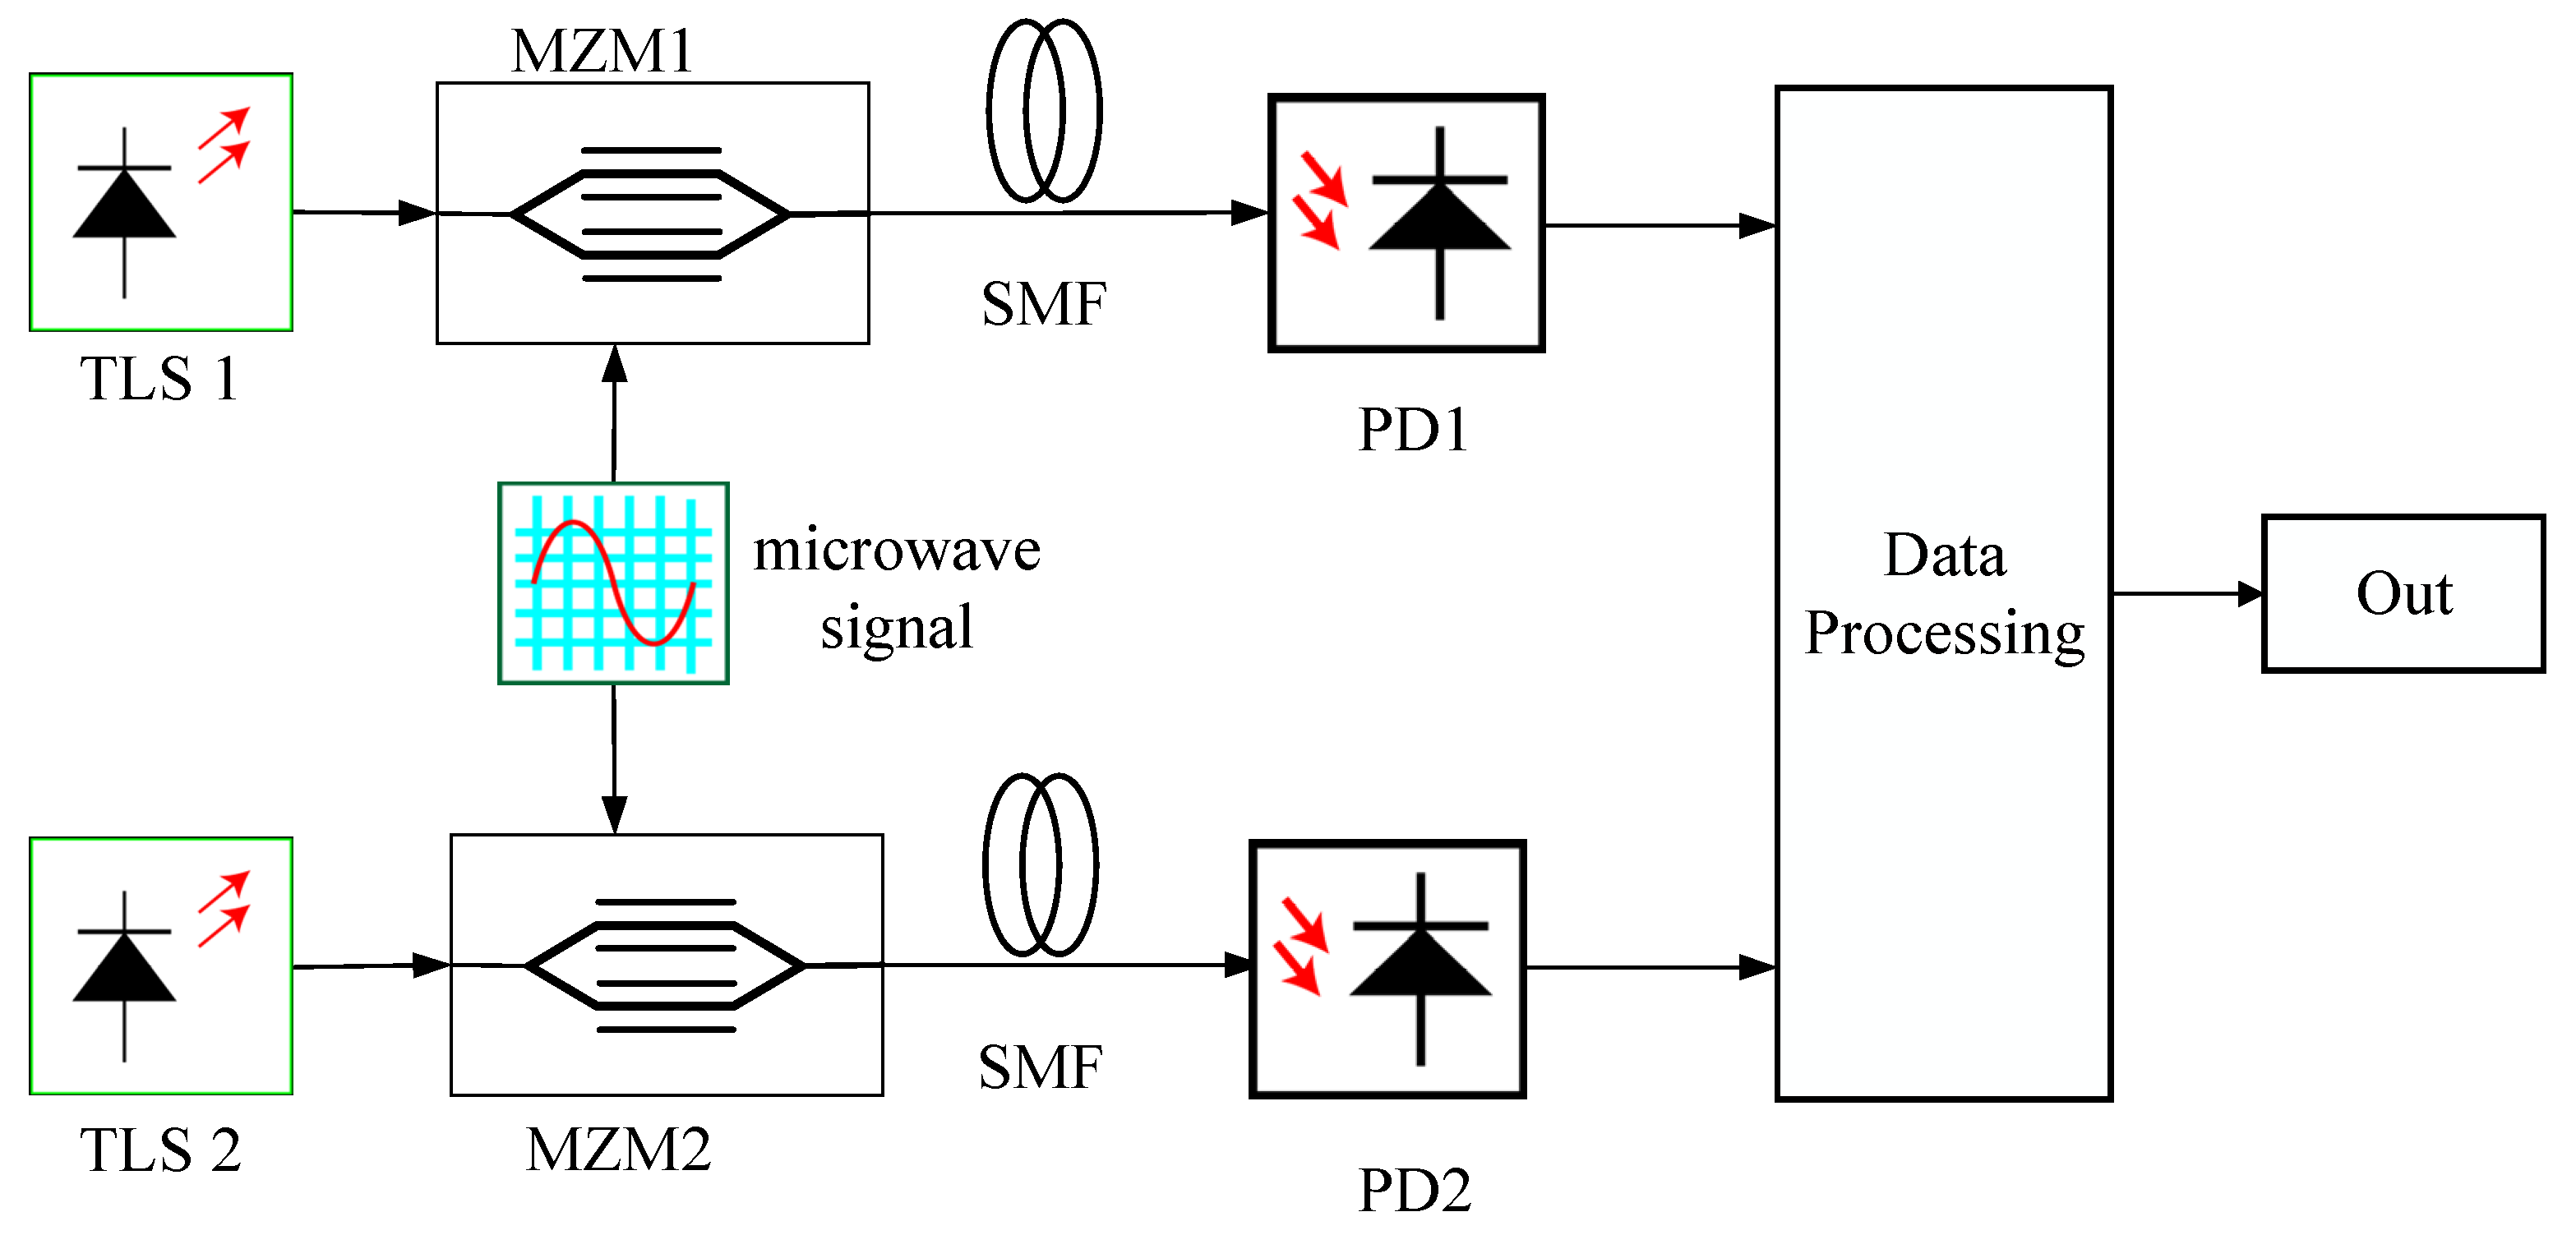
As shown in Figure 3, two tunable lasers are used to input different wavelengths. Then the microwave signal enters the MZM for intensity modulation. After the intensity modulation, the signal reaches the photodetector through the SMF to complete the microwave power detection. Finally, the ACF is constructed using two output microwave power values. This experiment uses some simple devices, such as lasers, SMF, MZM, and PD.
In the experiment, the two wavelengths are set at 1600 nm and 1550 nm. The length of the SMF is set to 10 km. The microwave frequency is scanned between 0 GHz and 25 GHz.
As shown in Figure 4a, the maximum value of the frequency measurement decreases with increasing wavelength. Figure 4b shows the theoretical value and measured value of the microwave power ratio. The microwave power ratio is the constructed ACF. The first monotonic interval of the microwave power ratio is from 0 GHz to 18.4 GHz. In the first monotonic interval, the curve of the microwave power ratio in the range of 0 GHz to 15 GHz changes little with a quite low measurement resolution and a large measurement error. Extremely high measurement resolution and quite small errors occur when the microwave frequency is very close to the notch point. Therefore, the curve close to the notch point is analyzed in the range of 15.8 GHz to 18.4 GHz.
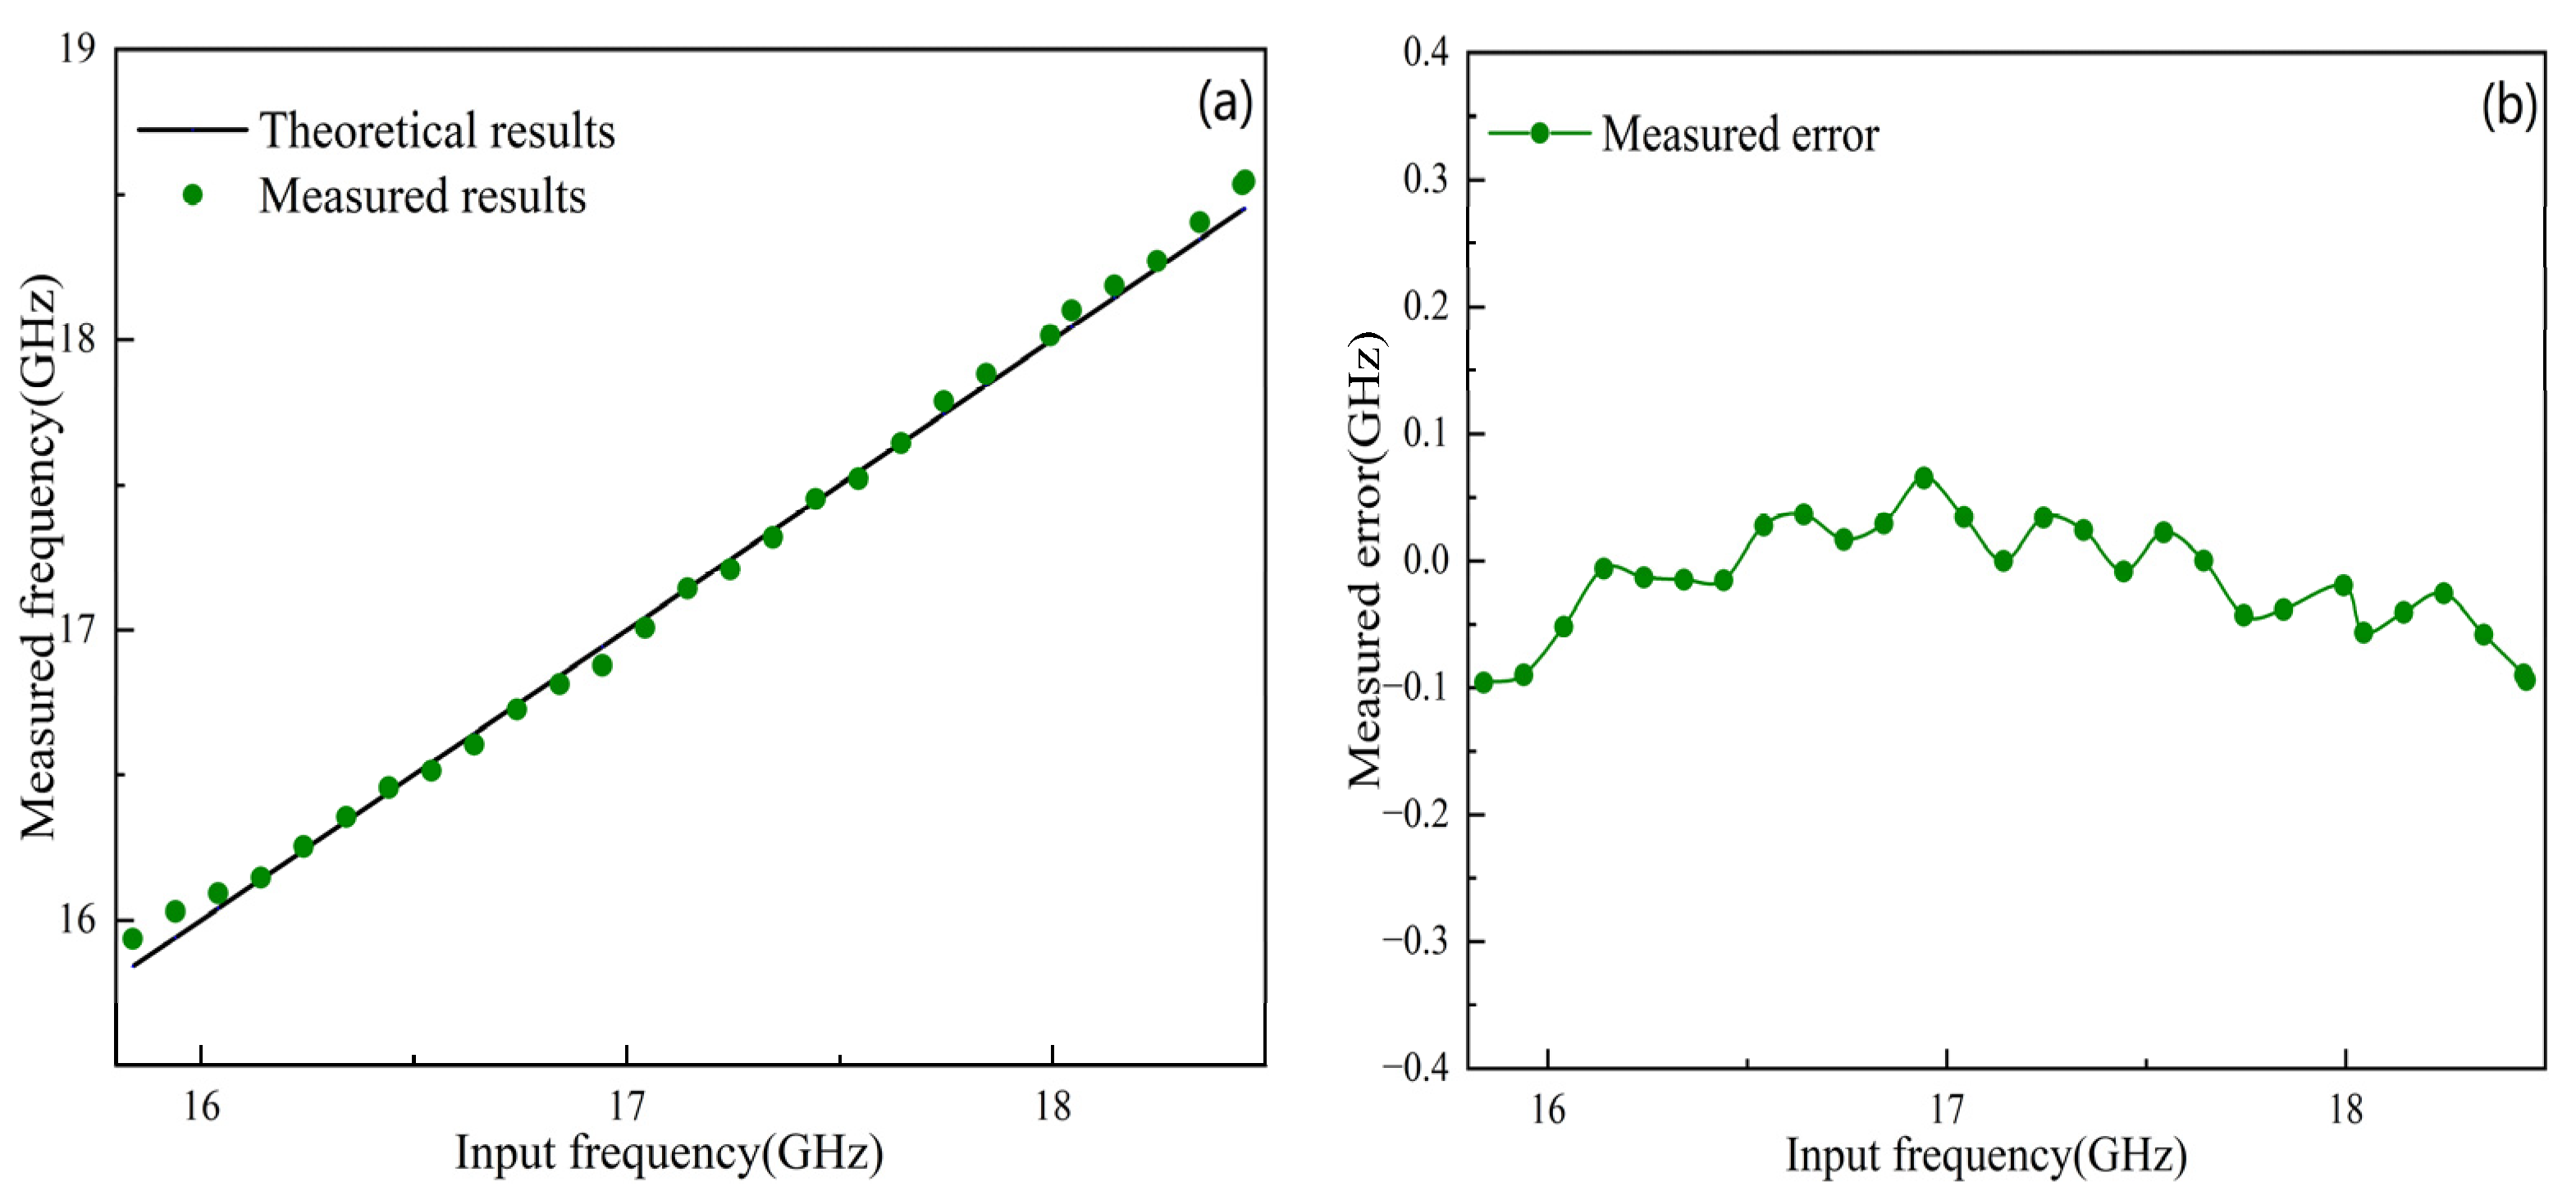
In Figure 5a the measured values of the frequencies near the notch point fit well with the theoretical values. Figure 5b shows the results of the error analysis, and the error is within ±0.1 GHz. The results of the error analysis illustrate the applicability of this method for frequency measurements from 15.8 GHz to 18.4 GHz. Generally, the high resolution and large measurement range of the system are difficult to achieve simultaneously. Increasing the number of wavelengths is a viable scheme, where multiple wavelengths are used to generate multiple different measurement ranges and resolutions.
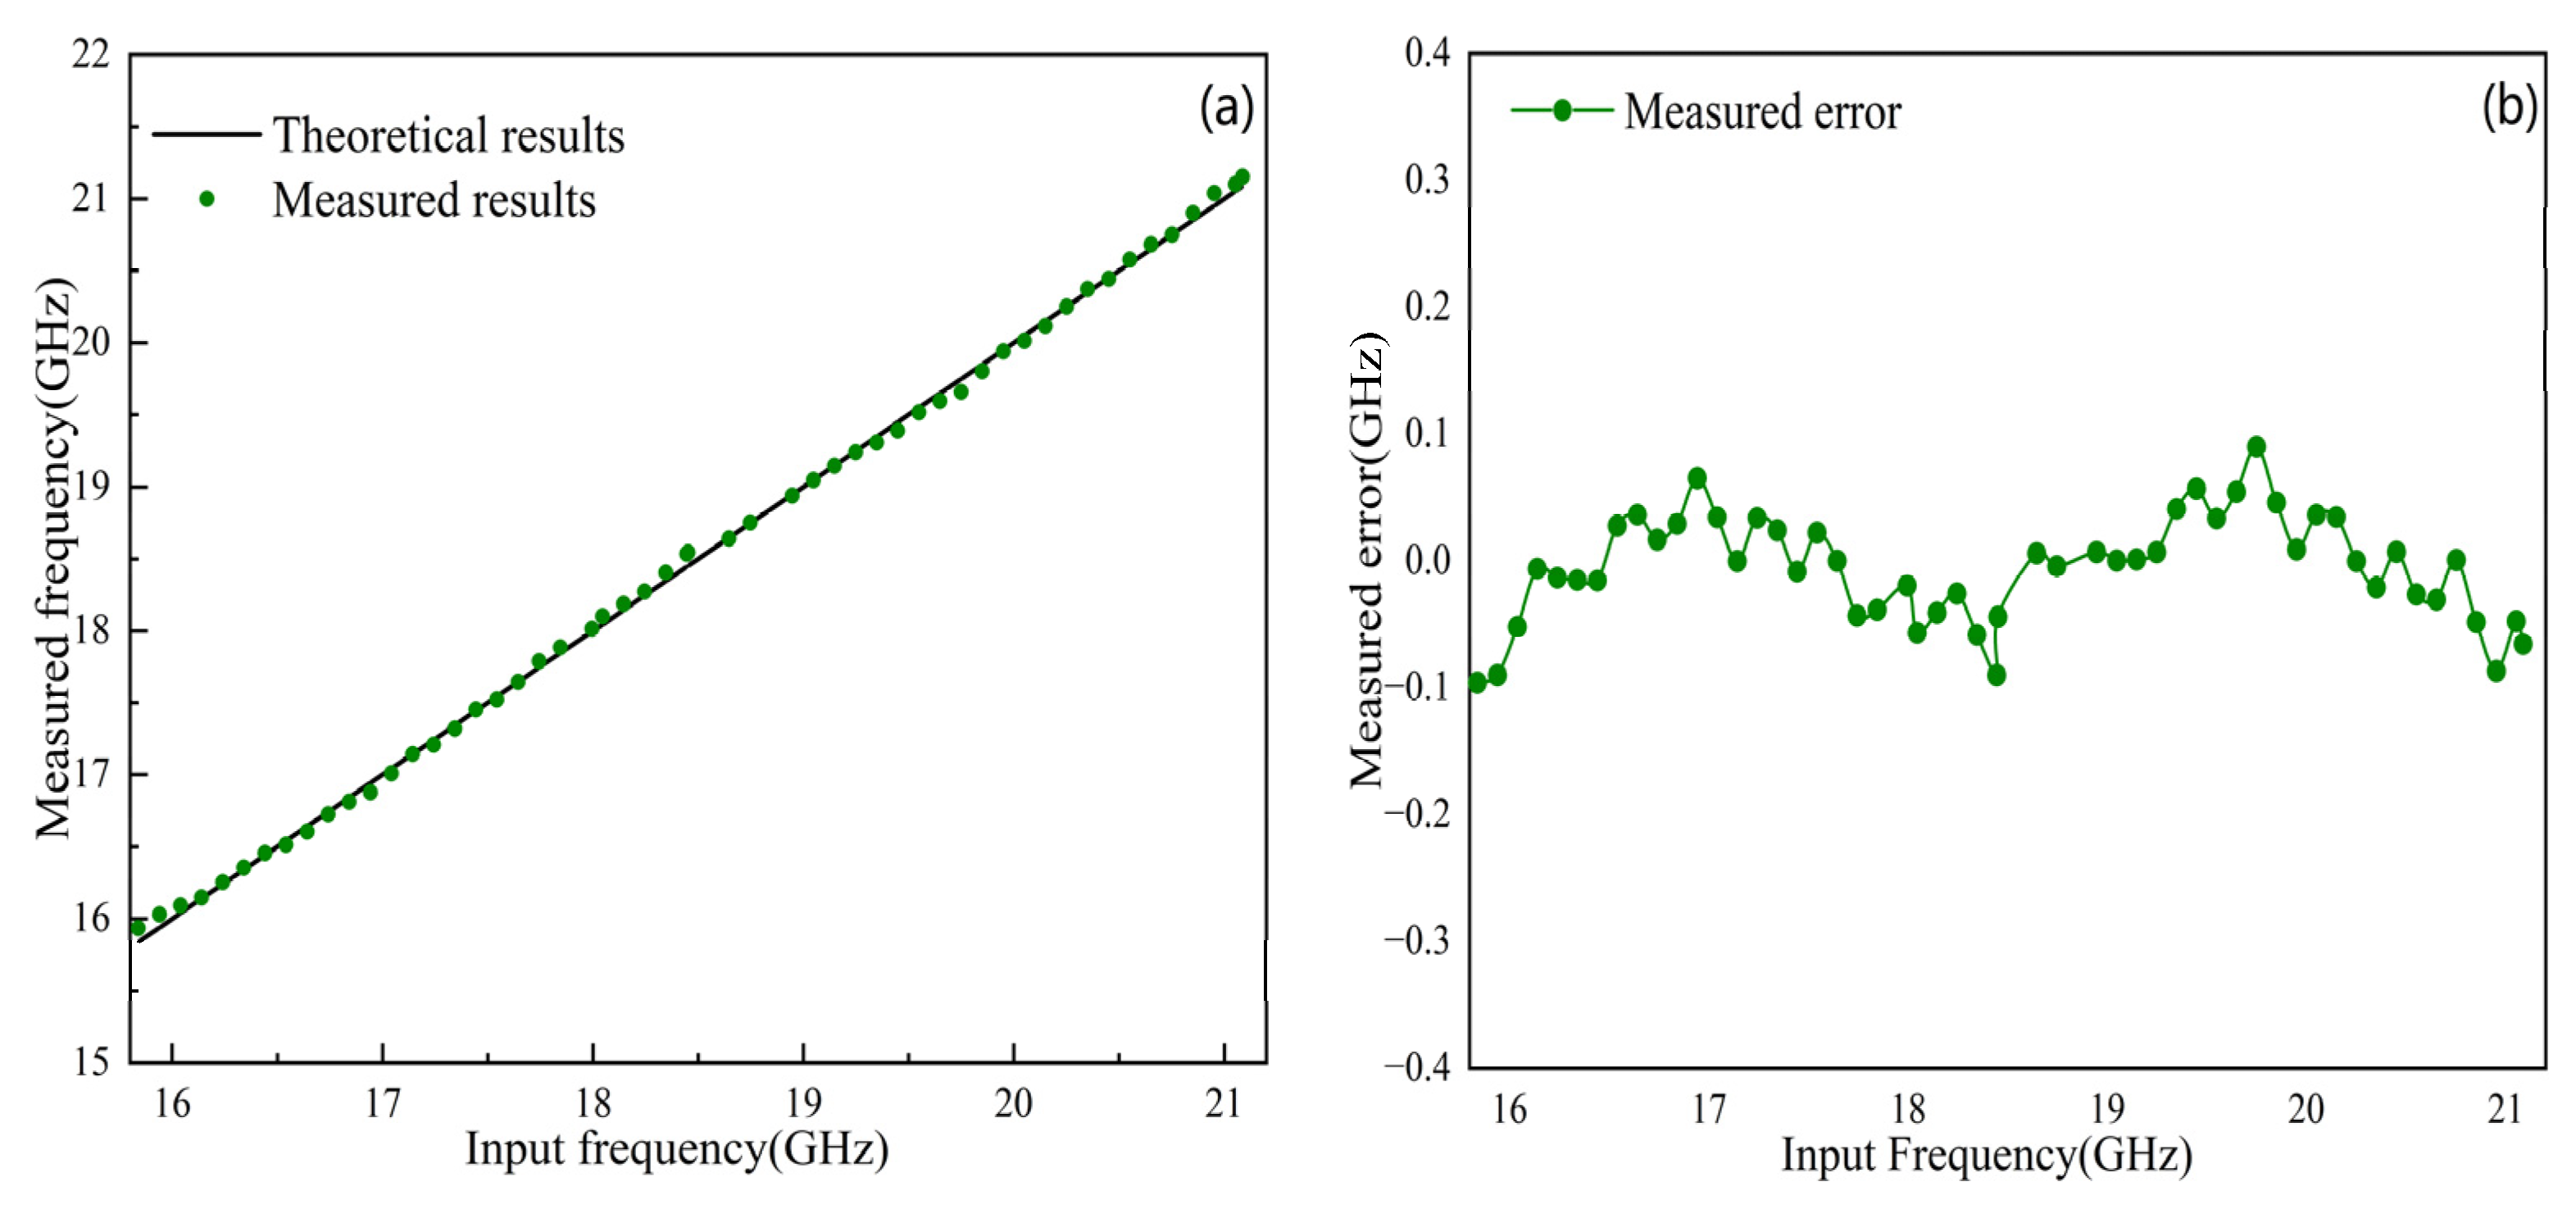
Figure 6 shows the experimental results after only modifying the wavelengths from 1600 nm and 1550 nm to 1400 nm and 1300 nm. As shown in Figure 6a, in the frequency range of 18.4 GHz to 21.2 GHz, the difference between the measured value and the theoretical value is very small. Figure 6b shows the results of the error analysis between the theoretical and measured values, and the error is within ±0.09 GHz. Moreover, the experimental results show that the system can accomplish the measurement of microwave signal frequency with a small measurement error.

4. Discussion

Table 1 lists a comparison between the proposed IFM system and previously reported photonics-based IFM systems, where the measurement range and the measurement error are considered. It can be seen from the results in Table 1, the frequency measurement range of the proposed IFM system is not as wide as other frequency measurement systems, but the measurement resolution has been greatly improved to ±0.1 GHz. Therefore, this system is significant for improving the resolution of the IFM.
In addition, this system has other advantages. First, the systems that make use of frequency-to-time mapping suffer from bandwidth limitation by the speed of the optical ON–OFF switching and the sampling rate of the oscilloscope [10], or the measurement time [11]. The IFM system proposed in this paper contains a dual-source structure, which helps to enlarge the range of frequency measurements. Containing single-mode fiber with less dispersion, the IFM system can improve the resolution of frequency measurements. Second, compared with the systems [8] applying frequency-to-space mapping, the proposed system is low cost and simple in structure. Finally, compared with the systems [22,23,24,25,26,27], the error is smaller.
In conclusion, this system contains a dual-source structure, which helps to enlarge the range of frequency measurements. The wavelengths are set to 1600 nm, 1550 nm, 1400 nm, and 1300 nm, and the final frequency measurement results are shown in Figure 7. Two wavelengths, 1600 and 1550 nm provide a range of 15.8–18.4 GHz with a measurement error of ±0.1 GHz. And the wavelengths at 1400 and 1300 nm offer another range of 18.4 GHz to 21.2 GHz with a ±0.09 GHz measurement error. Thus, the combination of these two measurement ranges will enlarge the measurement range while maintaining better measurement resolution. Figure 7a shows the total measurement range of 15.8 GHz to 21.2 GHz. The trend of the measured results and the trend of the theoretical results are consistent. Figure 7b shows the error between the total measured value and theoretical value, and the error is within ±0.1 GHz.

5. Conclusions

An IFM method based on frequency-to-power mapping is proposed in this paper. The system in the experiment is simple in structure and low in cost. The total measurement range of microwave signal is from 15.8 GHz to 21.2 GHz with an error within 0.1 GHz. The trend of the measured results is consistent with the trend of the theoretical results. This method provides an important solution for instantaneous frequency measurement of microwave signal which can find applications in modern electronic warfare and wireless communication systems.

Author Contributions

Supervision, Q.-A.D. and A.L.; Writing—original draft, J.L. (Junkai Li); Writing—review & editing, H.L., X.C., L.D., L.Z., Z.D., Q.Y. and J.L. (Jun Li). The authors contributed equally to this work. All authors have read and agreed to the published version of the manuscript.

Funding

This work is supported by Shandong Natural Science Foundation, China (No. ZR2017MF070); The National Natural Science Foundation for Young Scholars of China (No. 61801267); The National Natural Science Foundation of China (No. 61471224); Scientific Research Foundation of Shandong University of Science and Technology for Recruited Talents (No. skr-D-0104060540915); Shandong Natural Science Foundation, China (No. ZR2020MF014); Scientific Research Foundation of Shandong University of Science and Technology for Recruited Talents (No. skr20-1-008).

Institutional Review Board Statement

Not applicable.

Informed Consent Statement

Not applicable.

Data Availability Statement

Not applicable.

Acknowledgments

The authors are also grateful who have participated in this research work.

Conflicts of Interest

The authors declare no conflict of interest.

References

  1. Pan, S.; Fu, J.; Yao, J. Photonic approach to the simultaneous measurement of the frequency, amplitude, pulse width, and time of arrival of a microwave signal. Opt. Lett. 2012, 37, 7–9. [Google Scholar] [CrossRef] [PubMed]
  2. Wiley, R.G. Electronic Intelligence: The Analysis of Radar Signals; Artech House: Boston, MA, USA, 1993. [Google Scholar]
  3. Spezio, A.E. Electronic warfare systems. IEEE Trans. Microw. Theory Tech. 2002, 50, 633–644. [Google Scholar] [CrossRef]
  4. Pan, S.; Yao, J. Photonics-Based Broadband Microwave Measurement. J. Light. Technol. 2016, 35, 3498–3513. [Google Scholar] [CrossRef]
  5. Pan, S.; Yao, J. Instantaneous photonic microwave frequency measurement with a maximized measurement range. In Proceedings of the 2009 International Topical Meeting on Microwave Photonics, Valencia, Spain, 14–16 October 2009. [Google Scholar]
  6. Winnall, S.T.; Lindsay, A.C.; Austin, M.W.; Canning, J.; Mitchell, A. A microwave channelizer and spectroscope based on an integrated optical Bragg-grating Fabry-Perot and integrated hybrid Fresnel lens system. IEEE Trans. Microw. Theory Tech. 2006, 54, 868–872. [Google Scholar] [CrossRef]
  7. Heaton, J.M.; Watson, C.D.; Jones, S.B.; Bourke, M.M.; Boyne, C.M.; Smith, G.W.; Wight, D.R. 16-channel (1- to 16-GHz) microwave spectrum analyzer device based on a phased array of GaAs/AlGaAs electro-optic waveguide delay lines. In Proceedings of the International Society for Optical Engineering, San Jose, CA, USA, 28–30 January 1998; pp. 245–251. [Google Scholar]
  8. Wang, L.X.; Zhu, N.H.; Li, W.; Wang, H.; Zheng, J.Y.; Liu, J.G. Polarization division multiplexed photonic radio-frequency channelizer using an optical comb. Opt. Commun. 2013, 286, 282–287. [Google Scholar] [CrossRef]
  9. Wang, W.; Davis, R.L.; Jung, T.J.; Lodenkamper, R.; Lembo, L.J.; Brock, J.C.; Wu, M.C. Characterization of a coherent optical RF channelizer based on a diffraction grating. IEEE Trans. Microw. Theory Tech. 2001, 49, 1996–2001. [Google Scholar] [CrossRef]
  10. Nguyen, L.V.T. Microwave photonic technique for frequency measurement of simultaneous signals. IEEE Photonics Technol. Lett. 2009, 21, 642–644. [Google Scholar] [CrossRef]
  11. Nguyen, T.A.; Chan, E.H.W.; Minasian, R.A. Instantaneous high-resolution multiple-frequency measurement system based on frequency-to-time mapping technique. Opt. Lett. 2014, 39, 2419–2422. [Google Scholar] [CrossRef]
  12. Zhang, B.; Zhu, D.; Lei, Z.; Xu, Z.; Zhou, T.; Zhong, X.; Chen, Z.; Pan, S. Impact of dispersion effects on temporal-convolution-based real-time Fourier transformation systems. J. Light. Technol. 2020, 38, 4664–4676. [Google Scholar] [CrossRef]
  13. Salem, R.; Foster, M.A.; Gaeta, A.L. Application of space–time duality to ultrahigh-speed optical signal processing. Adv. Opt. Photonics 2013, 5, 274–317. [Google Scholar] [CrossRef]
  14. Wang, C. Dispersive Fourier transformation for versatile microwave photonics applications. Photonics. Multidiscip. Digit. Publ. Inst. 2014, 1, 586–612. [Google Scholar] [CrossRef]
  15. De Chatellus, H.G.; Cortés, L.R.; Azaña, J. Optical real-time Fourier transformation with kilohertz resolutions. Optica 2016, 3, 1–8. [Google Scholar] [CrossRef]
  16. Shi, J.; Zhang, F.; Ben, D.; Pan, S. Simultaneous radar detection and frequency measurement by broadband microwave photonic processing. J. Light. Technol. 2020, 38, 2171–2179. [Google Scholar] [CrossRef]
  17. Hao, T.; Tang, J.; Shi, N.; Li, W.; Zhu, N.; Li, M. Multiple-frequency measurement based on a Fourier domain mode-locked optoelectronic oscillator operating around oscillation threshold. Opt. Lett. 2019, 44, 3062–3065. [Google Scholar] [CrossRef]
  18. Nguyen, L.V.T.; Hunter, D.B. A photonic technique for microwave frequency measurement. IEEE Photonics Technol. Lett. 2006, 18, 1188–1190. [Google Scholar] [CrossRef]
  19. Li, W.; Zhu, N.H.; Wang, L.X. Reconfigurable instantaneous frequency measurement system based on dual-parallel Mach–Zehnder modulator. IEEE Photonics J. 2012, 4, 427–436. [Google Scholar] [CrossRef]
  20. Attygalle, M.; Hunter, D.B. Improved photonic technique for broadband radio-frequency measurement. IEEE Photonics Technol. Lett. 2008, 21, 206–208. [Google Scholar] [CrossRef]
  21. Zou, X.; Yao, J. An optical approach to microwave frequency measurement with adjustable measurement range and resolution. IEEE Photonics Technol. Lett. 2008, 20, 1989–1991. [Google Scholar]
  22. Li, J.; Fu, S.; Xu, K.; Zhou, J.Q.; Shum, P.; Wu, J.; Lin, J. Photonic-assisted microwave frequency measurement with higher resolution and tunable range. Opt. Lett. 2009, 34, 743–745. [Google Scholar] [CrossRef]
  23. Li, W.; Zhu, N.H.; Wang, L.X. Brillouin-assisted microwave frequency measurement with adjustable measurement range and resolution. Opt. Lett. 2012, 37, 166–168. [Google Scholar] [CrossRef]
  24. Zou, X.; Chi, H.; Yao, J. Microwave frequency measurement based on optical power monitoring using a complementary optical filter pair. IEEE Trans. Microw. Theory Tech. 2009, 57, 505–511. [Google Scholar]
  25. Chi, H.; Zou, X.; Yao, J. An approach to the measurement of microwave frequency based on optical power monitoring. IEEE Photonics Technol. Lett. 2008, 20, 1249–1251. [Google Scholar] [CrossRef]
  26. Zou, X.; Pan, S.; Yao, J. Instantaneous microwave frequency measurement with improved measurement range and resolution based on simultaneous phase modulation and intensity modulation. J. Light. Technol. 2009, 27, 5314–5320. [Google Scholar]
  27. Pan, S.; Yao, J. Instantaneous microwave frequency measurement using a photonic microwave filter pair. IEEE Photonics Technol. Lett. 2010, 22, 1437–1439. [Google Scholar] [CrossRef]
  28. Yang, C.; Wang, L.; Liu, J. Photonic-assisted instantaneous frequency measurement system based on a scalable structure. IEEE Photonics J. 2019, 11, 1–11. [Google Scholar] [CrossRef]
  29. Zhou, J.; Fu, S.; Aditya, S.; Shum, P.P.; Lin, C. Instantaneous microwave frequency measurement using photonic technique. IEEE Photonics Technol. Lett. 2009, 21, 1069–1071. [Google Scholar] [CrossRef]
  30. Bui, L.A. Recent advances in microwave photonics instantaneous frequency measurements. Prog. Quantum Electron. 2020, 69, 100237. [Google Scholar] [CrossRef]
Figure 1. Structure diagram of IFM method. CW laser: continuous-wave laser; MZM: Mach–Zehnder modulator; SMF: single-mode fiber; PD: photodetector.
Photonics 09 00685 g001
Figure 2. (a) The relationship between frequency and microwave power at different wavelengths. (b) Microwave power curves of different fiber lengths.
Photonics 09 00685 g002
Figure 3. Schematic diagram of the proposed IFM system. TLS: tunable laser source.
Photonics 09 00685 g003
Figure 4. (a) The relationship between the maximum measured frequency value and wavelength. (b) The microwave power ratio of the measured and theoretical results.
Photonics 09 00685 g004
Figure 5. (a) Theoretical and measured results of frequency measurements. (b) measurement error.
Photonics 09 00685 g005
Figure 6. (a) Theoretical and measured results of frequency measurements. (b) measurement error.
Photonics 09 00685 g006
Figure 7. (a) Theoretical and measured results of frequency measurements. (b) measurement error.
Photonics 09 00685 g007
Table 1. Performance Comparison.
Measurement
Range (GHz)
Measurement
Error (GHz)
This work15.8–21.2±0.1
Ref [8]1–18±1
Ref [10]15–45±1.56
Ref [11]0.1–20±0.25
Ref [22]0–12.7±0.2
Ref [23]0–12±0.25
Ref [24]1–26±0.2
Ref [25]1–20±0.2
Ref [26]2–19±0.2
Ref [27]0.5–36±0.2
Publisher’s Note: MDPI stays neutral with regard to jurisdictional claims in published maps and institutional affiliations.