Communication

High Sensitivity Fiber Refractive Index Sensors Based on Asymmetric Supermodes Interference in Tapered Four Core Fiber

1
School of Physics Sciences and Information Technology, Liaocheng University, Liaocheng 252000, China
2
College of Engineering Physics, Shenzhen Technology University, Shenzhen 518000, China
3
School of Optoelectronic Engineering and Instrumentation Science, Dalian University of Technology, Dalian 116024, China
*
Author to whom correspondence should be addressed.
Photonics 2022, 9(1), 45; https://doi.org/10.3390/photonics9010045
Submission received: 25 December 2021 / Revised: 12 January 2022 / Accepted: 13 January 2022 / Published: 14 January 2022

Abstract

:
We demonstrate high sensitivity fiber refractive index (RI) sensor based on asymmetric supermode interferences in tapered four core fiber (TFCF). To make TFCF-based RI sensors, the whitelight was launched into any one of the cores to define the excitation orientation and is called a vertex-core excitation scheme. When the four-core fiber (FCF) was gradually tapered, the four cores gathered closer and closer. Originally, the power coupling occurred between its two neighboring cores first and these three cores are grouped to produce supermodes. Subsequently, the fourth diagonal core enters the evanescent field overlapping region to excite asymmetric supermodes interferences. The output spectral responses of the two cores next to the excitation core are mutually in phase whereas the spectral responses of the diagonal core are in phase and out of phase to that of the excitation core at the shorter and longer wavelengths, respectively. Due to the lowest limitation of the available refractive index of liquids, the best sensitivity can be achieved when the tapered diameter is 10 μm and the best RI sensitivity S is 3249 nm/RIU over the indices ranging from 1.41–1.42. This is several times higher than that at other RI ranges due to the asymmetric supermodes.

1. Introduction

In-line fiber interferometric sensors are featured with high accuracy, high bandwidth, high signal capacity, high environmental stability, in situ and real-time monitoring for measuring various kinds of physical, chemical, and biological measurands [1,2,3,4,5]. To satisfy the giant demands of the bandwidth for telecommunications or sensing purposes, many different kinds of active and passive multicore fibers (MCF) have been extensively investigated over the past few years to enlarge the signal capacity based on space division multiplexing [6,7,8,9,10,11]. In addition, the MCF can also provide multi-parameter sensing [12,13,14] or high power lasing based on coherent beam combination [15,16,17], ascribing to the multicore structures. However, most of the MCFs are very different from the traditional singlemode fibers (SMF), not only in the physical core distributions but also in their fundamental optical properties. For example, the MCFs are incompatible with the standard SMF in their core sizes, the numerical apertures (NA), and the core configurations. Therefore, the fan-in/fan-out couplers are always required to conquer the power/signal transmission issues for linking up the MCF and SMF. Besides, the evanescent power coupling may occur when the MCF is heavily bent [18]. Moreover, it is noted that the supermodes are excited to give rise to interferences when the MCF is substantially tapered [19,20,21,22]. With this interesting phenomenon, it brings new physical findings and applications for MCF. Except for the excited supermodes, the split evanescent field distribution as well as the evanescent optical trapping force have also been observed in the tapered seven core MCF [23]. In contrast to the large amount of the literature related to the seven core MCF, there have been only a few works reported using FCF for curvature, strain, temperature, pressure, and RI sensing applications [24,25,26,27,28]. Among them, the RI sensing is important to realize the refractive indices of the liquids under tests for the applications in food security, medical care, industrial and environmental monitoring [29,30,31]. However, for those RI sensors using FCF, the laser lights were launched into the center of FCF, namely the central silica area surrounded by the four cores, and then tapered [32]. This structure can be treated as a segment of TFCF sandwiched between two multimode fibers. Because there is no clearly defined core boundary for the launching lights right after the splicing point between the FCF and SMF. One more important issue, the excited modes are overall concentrically symmetric. On the other hand, if the lights are launched into one of four cores in the FCF, the optical characteristics of the fiber sensors are very different from the above-mentioned excitation method from the silica center. However, these sensors using FCFs were not tapered to excite the supermodes to investigate the interferences.
In contrast, in this work, the fiber RI sensing using TFCF via the vertex-core excitation scheme, shown in Figure 1a, was demonstrated. Though many different kinds of fiber sensors using MCF or special fibers have been reported [14,26,32,33,34,35,36,37,38], the excited modes are generally axially concentric and the sensitivity is therefore limited. On the contrary, the asymmetric modes are distributed very differently from the symmetric modes due to their wider field distributions. This implies that the interaction between the asymmetric modes and the external materials under tests can be substantially enhanced to improve the sensitivity. However, there have been several kinds of well-known methods to excite the asymmetric modes like core misalignment transversely or the asymmetric cladding structures or asymmetric RI profile along the radial direction. Basically, these methods are expensive due to the special physical designs or not reproducible due to accurate alignment needed. Straightforwardly, the asymmetric modes in the TFCF can be easily achieved by launching the lights into one of the cores. Due to the strong power coupling among the grouped cores in the TFCF, the excited supermodes are intrinsically asymmetric. The advantages of this excitation method are fulfilled in a commercially available FCF without the labor-intensive and time-consuming alignment works. Moreover, the excited asymmetric supermodes can be precisely and easily controlled by fine tuning the tapered diameter through the mature fiber tapering technique. By carefully controlling the tapered diameter, the desired asymmetric supermodes as well as the spectral responses can be available. For RI sensing in this work, the D and the uniformed tapered length L are 10 μm, shown in Figure 1b, and 2.1 mm, respectively. The S was measured to be 535 nm/RIU, 884 nm/RIU, and 3249 nm/RIU over the index’s intervals over 1.334–1.342, 1.37–1.38, and 1.41–1.42, respectively. The best S is 3249 nm/RIU and the corresponding extinction ratio is about 13 dB. The achieved S is significantly improved, compared with other RI sensors using FCF, ascribing to the asymmetric supermodes via the vertex-core excitation scheme. This has not yet been investigated and reported to our knowledge. Clearly, the most important advantages of this RI sensor is the ability to investigate the influence of the asymmetric supermodes in the TFCF on the enhancement of S due to the vertex-core excitation scheme. The achieved S is much higher than the S of all kinds of RI sensors using FCFs [26,32,33,34,35,36]. Moreover, it is also superior to most of the RI sensors using other kinds of special fibers [14,37,38]. This asymmetric supermode interference based on the vertex-core excitation scheme was found to be helpful in improving the S and exploring the underlying physics for developing TFCF interferometric sensors. It is also highly promising for fiber sensors with multi-parameters monitoring simultaneously.

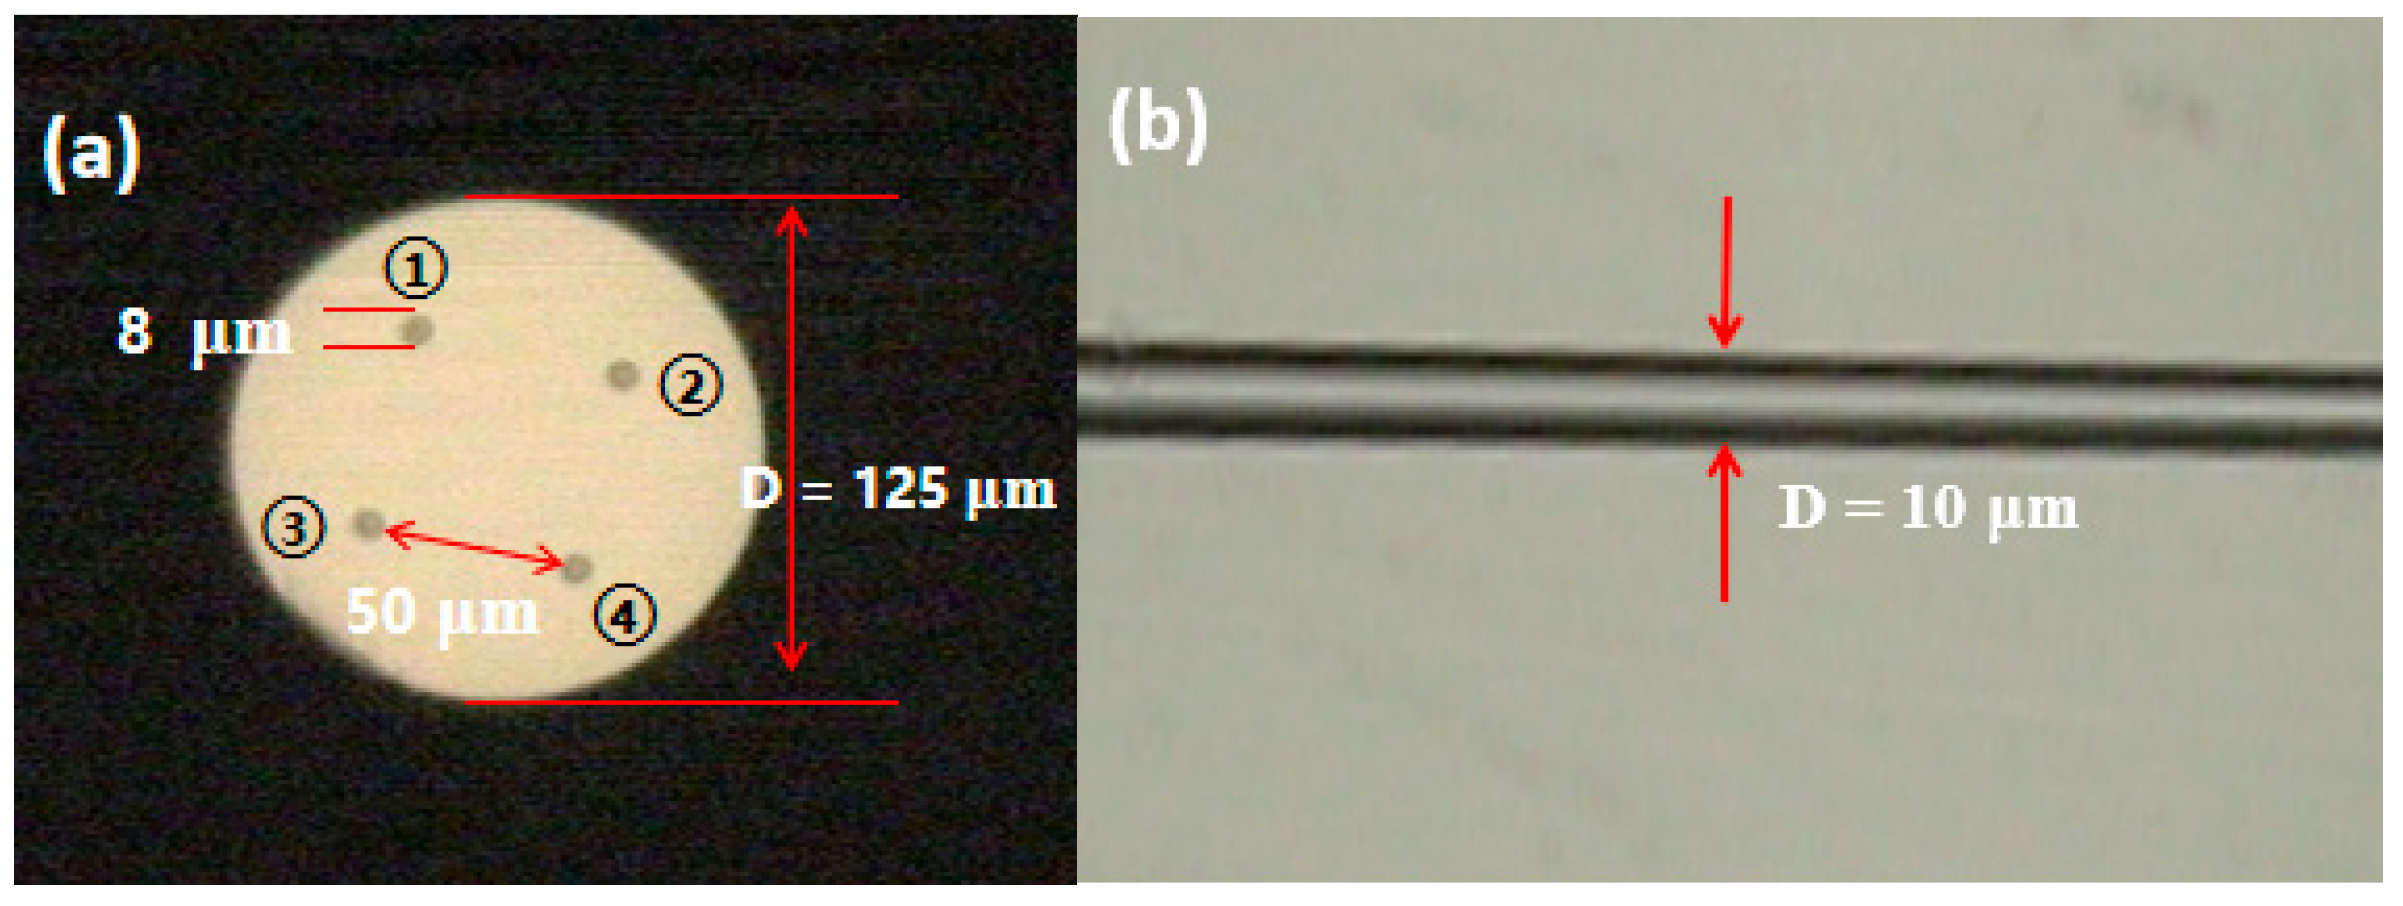
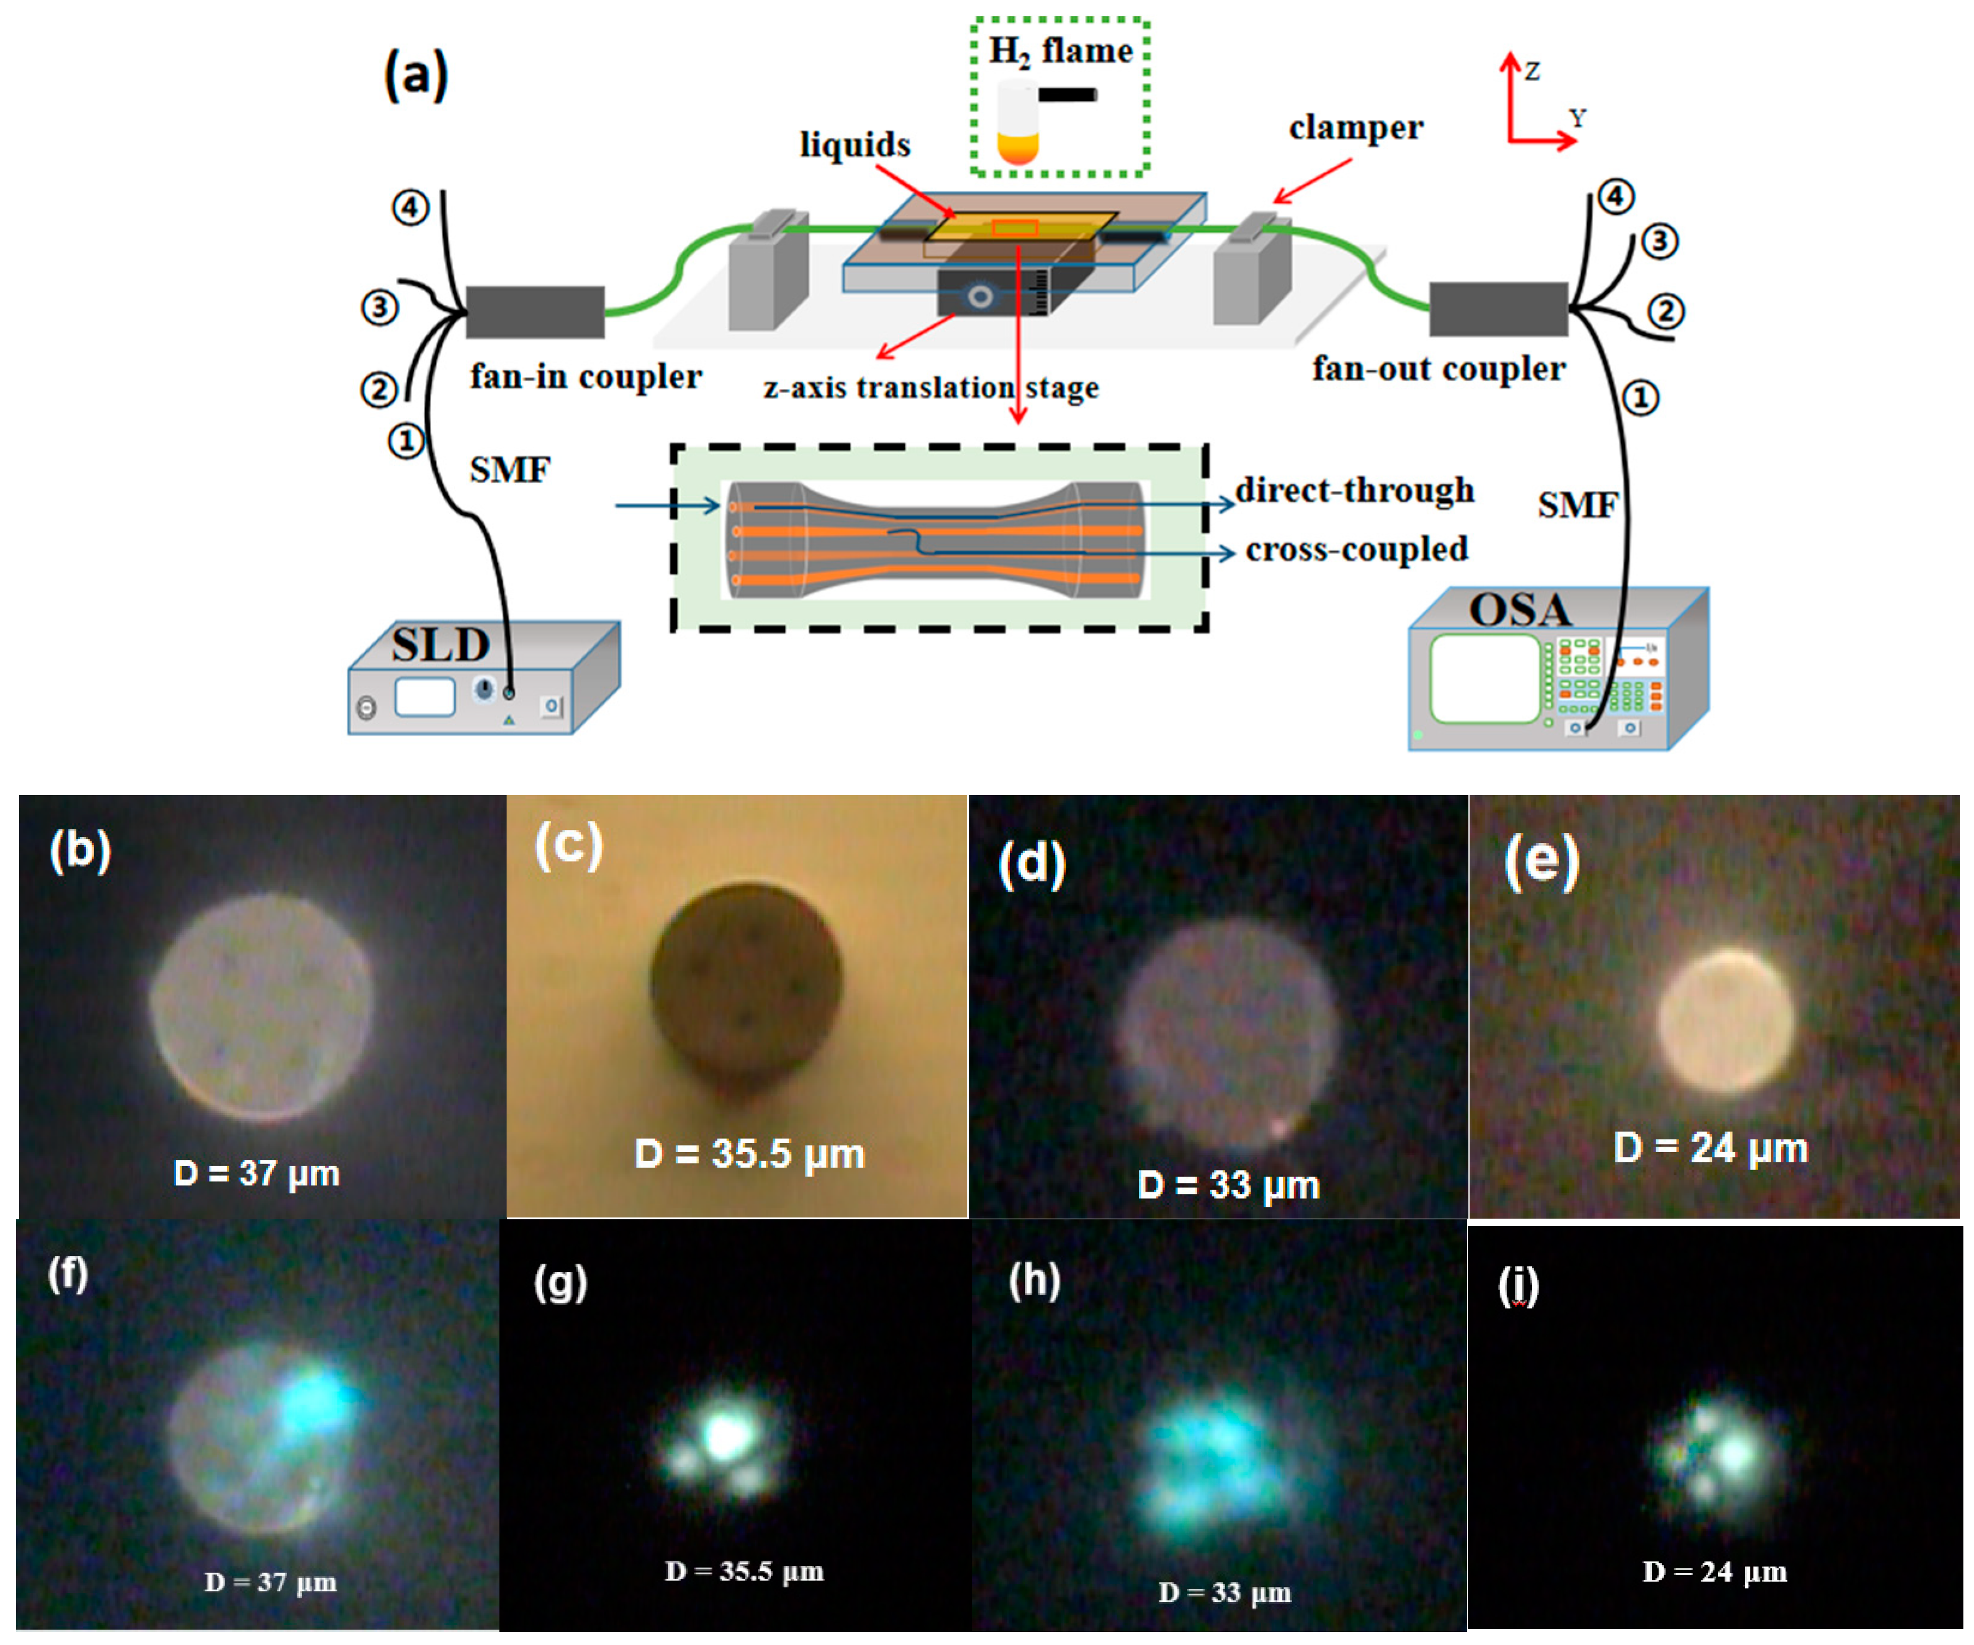
2. Fabrication, Experimental Set-Up and Working Principle

In fabrication, a FCF (Chiral Photonics: SM-4C1500) with the 4 Ge-doped cores arranged in a square shape, shown in Figure 1a. Typically, the NA for each core is 0.157 and the core diameter is 8 μm. The shortest distances between two neighboring cores and the diagonal cores are 50 μm and 74 μm, respectively. The insertion loss and crosstalk for the individual 4 cores are ranging over 1.1~1.7 dB and −46.8~−55 dB, respectively, due to weak power coupling. In order to combine or to separate the four core channels to individually link up to the SMF, the fan-in/fan-out couplers, made from the same FCF, are essential components. However, a small core misalignment between the fan-in/fan-out couplers and the FCF due to core dislocations from different batches of the manufactured FCF may occur to excite some unwanted higher order modes to give rise to noises in spectral responses. To make the TFCF RI sensors, a segment of the uncoated FCF was fixed on the fiber taper station, shown in Figure 2a. The FCF was heated using hydrogen flame and then elongated to thin down the D. During tapering, the boundary of the 4 Ge-doped cores gradually becomes blurred under a 1000× CCD microscope, as can be seen from Figure 2b–e with D = 37, 35.5, 33, 24 μm, respectively, due to the Ge ions diffusion. In addition, the mode field distributions for different cores gradually expand to overlap with each other. The SLD lights were launched into the core c#1 and an optical spectrum analyzer (OSA) was used to individually monitor and record the spectral responses at the output ends of cores for the power coupling c#1-#4. When D is less than 30 μm, the direct-through, namely from the input core c#1 to output core c#1, spectral responses start to vary, which reflects that the supermodes based on the tri-core structure were excited to produce interferences. The extinction ratios (ER) of the spectral responses increase with a decreasing D. Moreover, the excited supermodes based on the tri-core structure also rapidly transit to the quadruple-core structure with decreasing D. The corresponding cross-coupled, namely from the input core c#1 to output core c#2/3/4, spectral responses were also recorded by an OSA. To make RI sensors, the liquids with different indices were prepared using DI water and glycerin at different mixing ratios. The indices of the liquid samples were measured by an Abbe refractometer working at the nD wavelength (589.3 nm). From all of the output spectra, the direct-through type were found to be the most sensitive route to the external index variations since the mode field of the excited asymmetric supermodes is mainly distributed surrounding the excitation core, as can be observed in Figure 2g–i, especially when the ambient index is close to the effective index of TFCF.
The working principle for the excited supermodes in the MCF with different core configurations has been extensively studied [26,32,33,34,35,36]. Due to the vertex-core excitation, the laser lights are well-confined to propagate in the core right after the splicing point. When FCF was gradually tapered, the four cores gathered closer and the evanescent fields of the excitation core, c#1, increasingly overlap with the two neighboring cores, c#2 and c#3, first, shown in Figure 2f, and then came along with the supermodes, shown in Figure 2g, based on this three-core structure, c#1-#3. With continuous tapering, the fourth core, #4, at the diagonal position with respect to the excitation core gradually enters the evanescent fields overlapping region to excite new supermodes, Figure 2h,i, based on the four-core structure, c#1-#4. Figure 2f–i were the far field mode patterns using whitelight spanning 1250–1650 nm from superluminescent diodes (SLD) under a 1000× CCD microscope. Partial guiding lights from SLDs near the 1310 nm wavelengths can be observed by the CCD microscope [23]. From the three-core to four-core structure, the excited supermodes are highly determined by the tapered diameter D of the TFCF and are intrinsically asymmetric due to the vertex-core excitation scheme. Consequently, the output interference fringes will be in phase when the output spectral responses are individually measured from the two cores, c#2 and c#3, next to the excitation core, after using a fan-out coupler. Due to the supermode interferences, the output spectral characteristics for the excitation core become highly wavelength dependent. However, the output spectral responses from core c#2 and c#3 are very different from the c#1. Ambiguously, the output spectral responses from the diagonal core c#4 are somehow in phase and out of phase relative to the spectral characteristics from the core c#1 at the shorter wavelength and longer wavelength side of the 1450 nm, respectively.
In this work, the evanescent power overlapping was experimentally observed to begin when D is approaching 30 μm where the supermodes are produced based on a tri-core structure, namely the grouped cores c#1-#3. However, it is found that when D = 26 μm, the diagonal core, c#4, the supermodes at the wavelengths longer than 1450 nm are initially generated. The details about the supermodes evolutions will be further discussed later in this work. In accordance with the couple mode theory for the strong coupling MCF, the supermodes are excited when the distance between cores is small enough to start the effective evanescent power coupling. The superposed electric-field intensity for the interferences can be expressed as follows:
I = i = 1 n I i + 2 i = 1 n 1 j = i + 1 n I i I j c o s [ 2 π ( n i n j )   l / λ ]
the I i and I j are the intensity of the ith and jth supermodes, the n i and n j are the effective index for ith and jth supermodes, l is the length of MCF, and λ is the operating wavelength.
The OPD between two supermodes is defined as
ϕ = ( 2 m + 1 ) π
and the wavelengths for the interference peaks can be expressed as:
λ m = 2 Δ n e f f l 2 m + 1  
the Δ n e f f is the effective index difference between the cores and m is the order of interferences. From Formula (3), the FSR can be written as:
FSR = Δ λ m = | λ m λ m 1 | = 4 Δ n e f f l ( 2 m + 1 ) ( 2 m 1 )     λ m 2 Δ n e f f l  
Thus, from Formula (4), it is known that the FSR increases with a decreasing l or Δ n e f f whereas the FSR decreases with a decreasing λ [39]. These formulas can help explain the working principles for RI sensors.

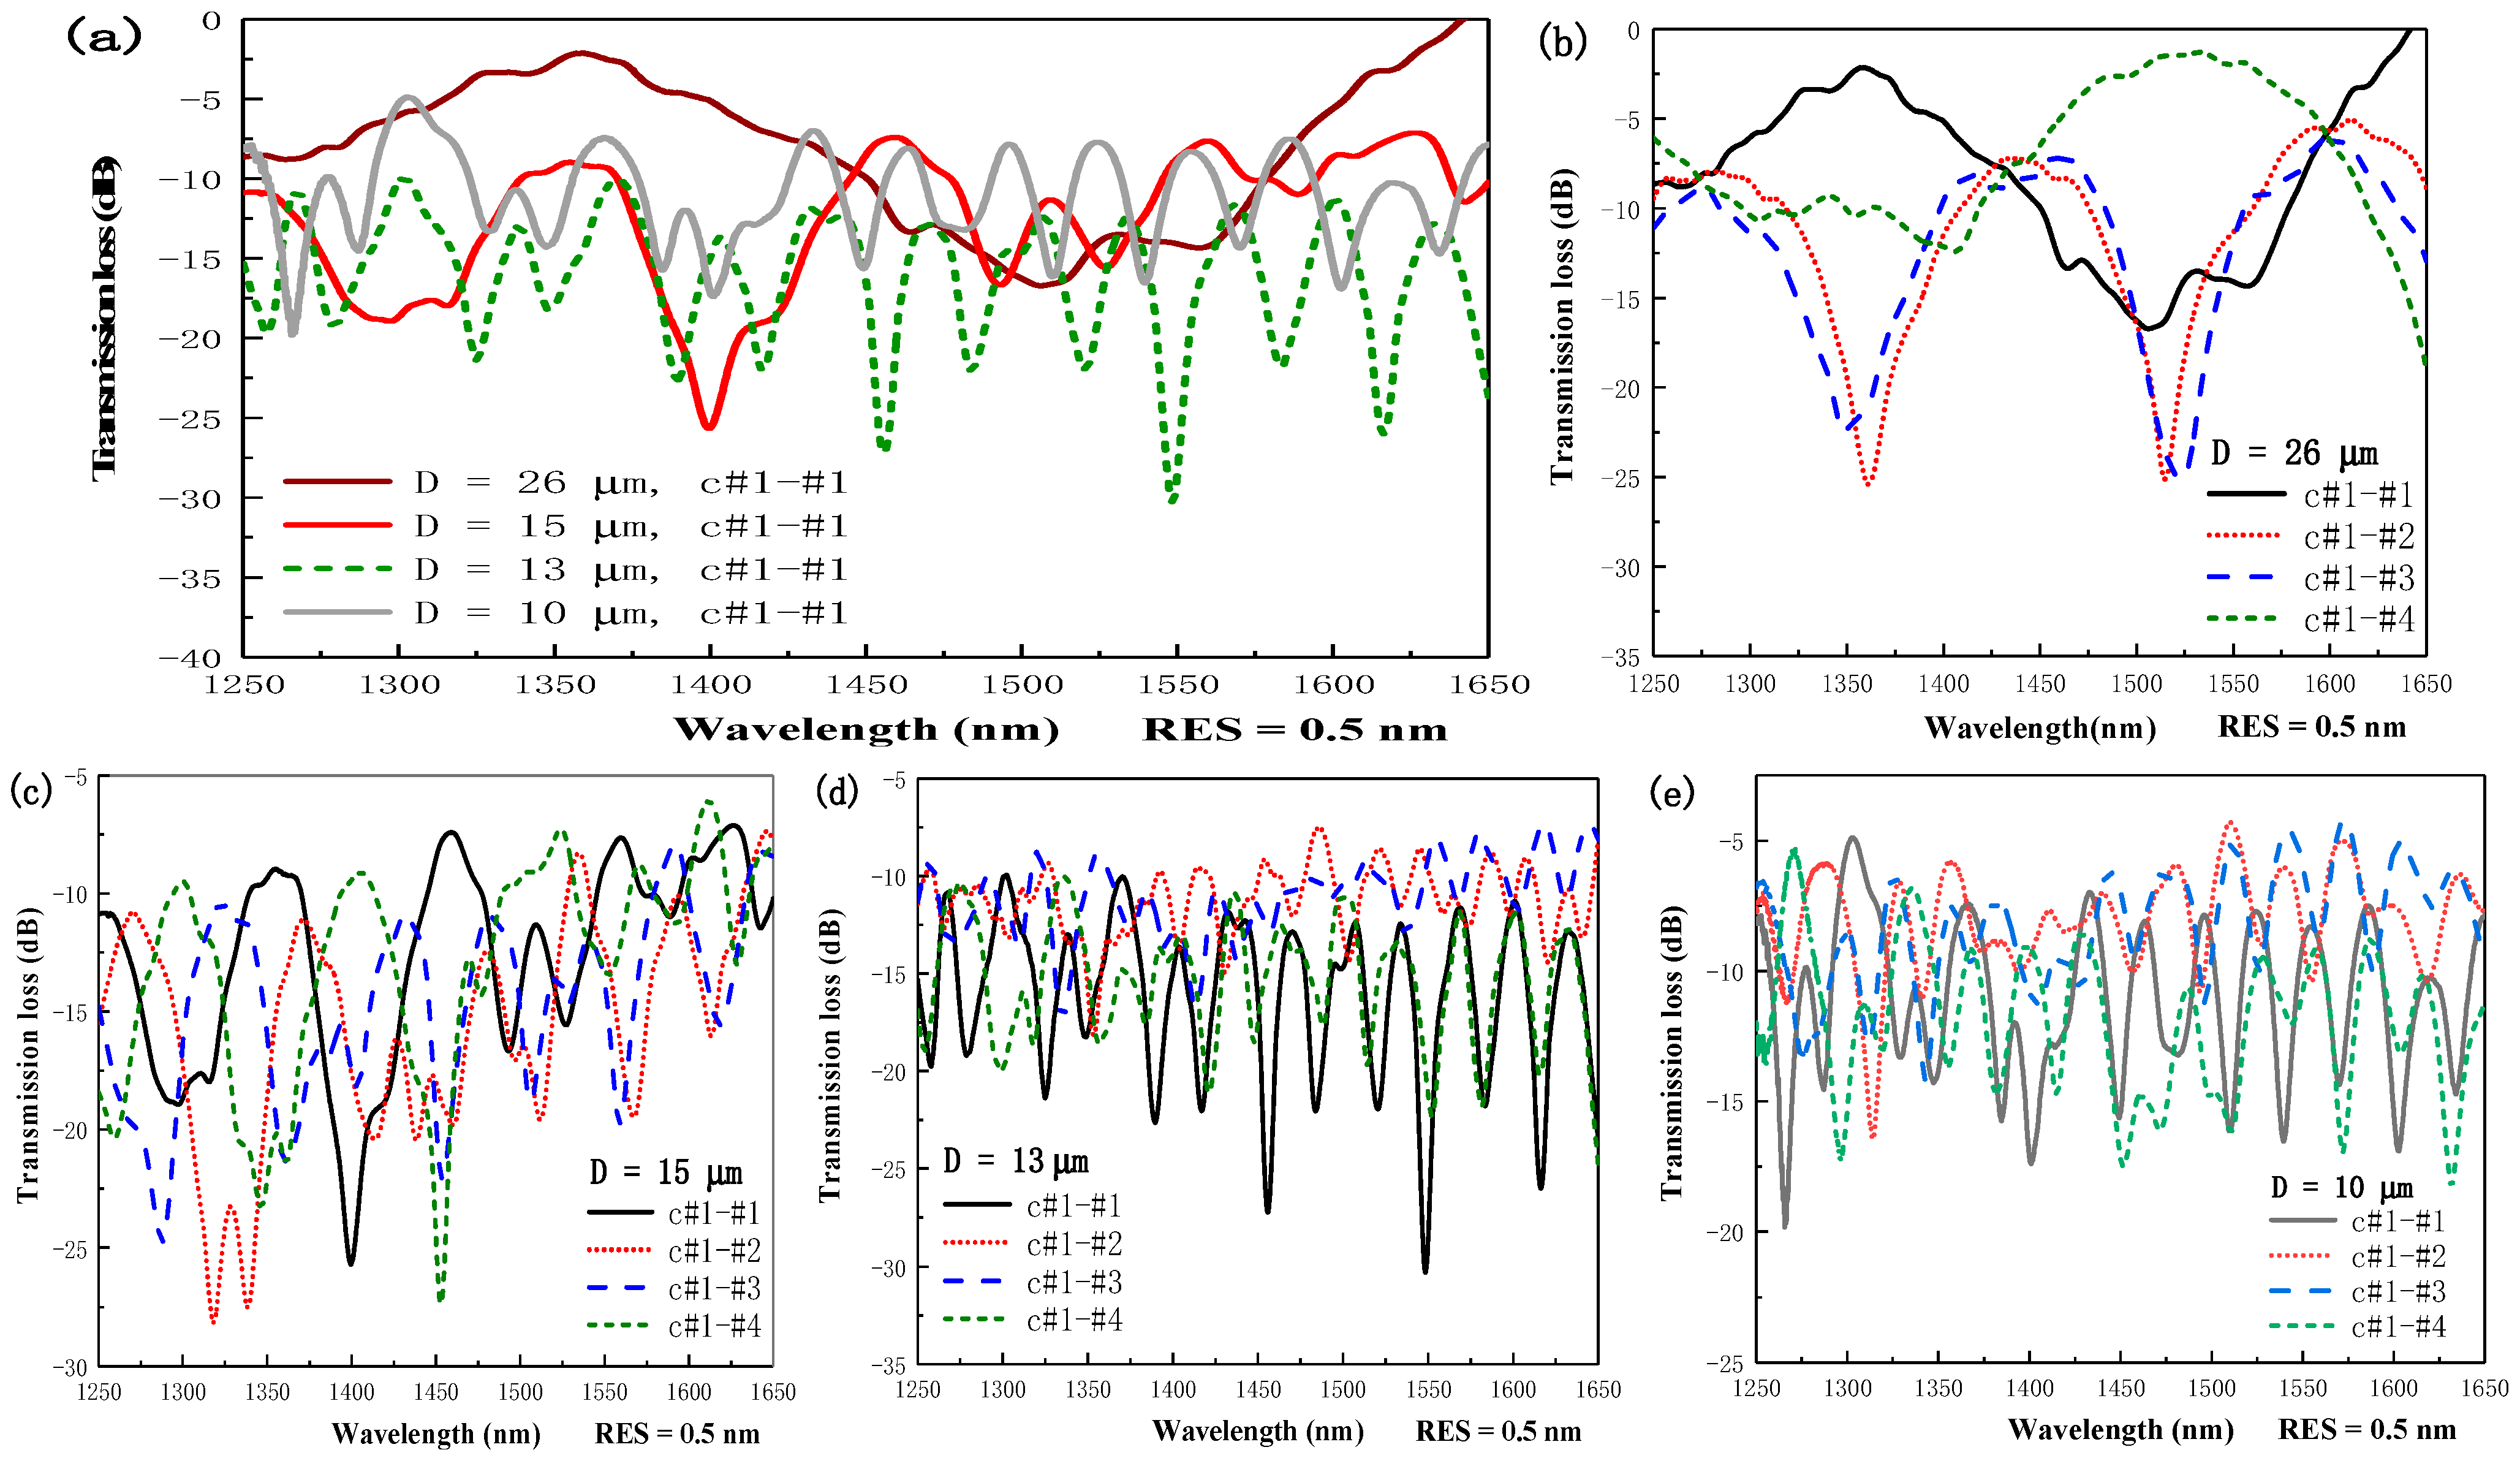
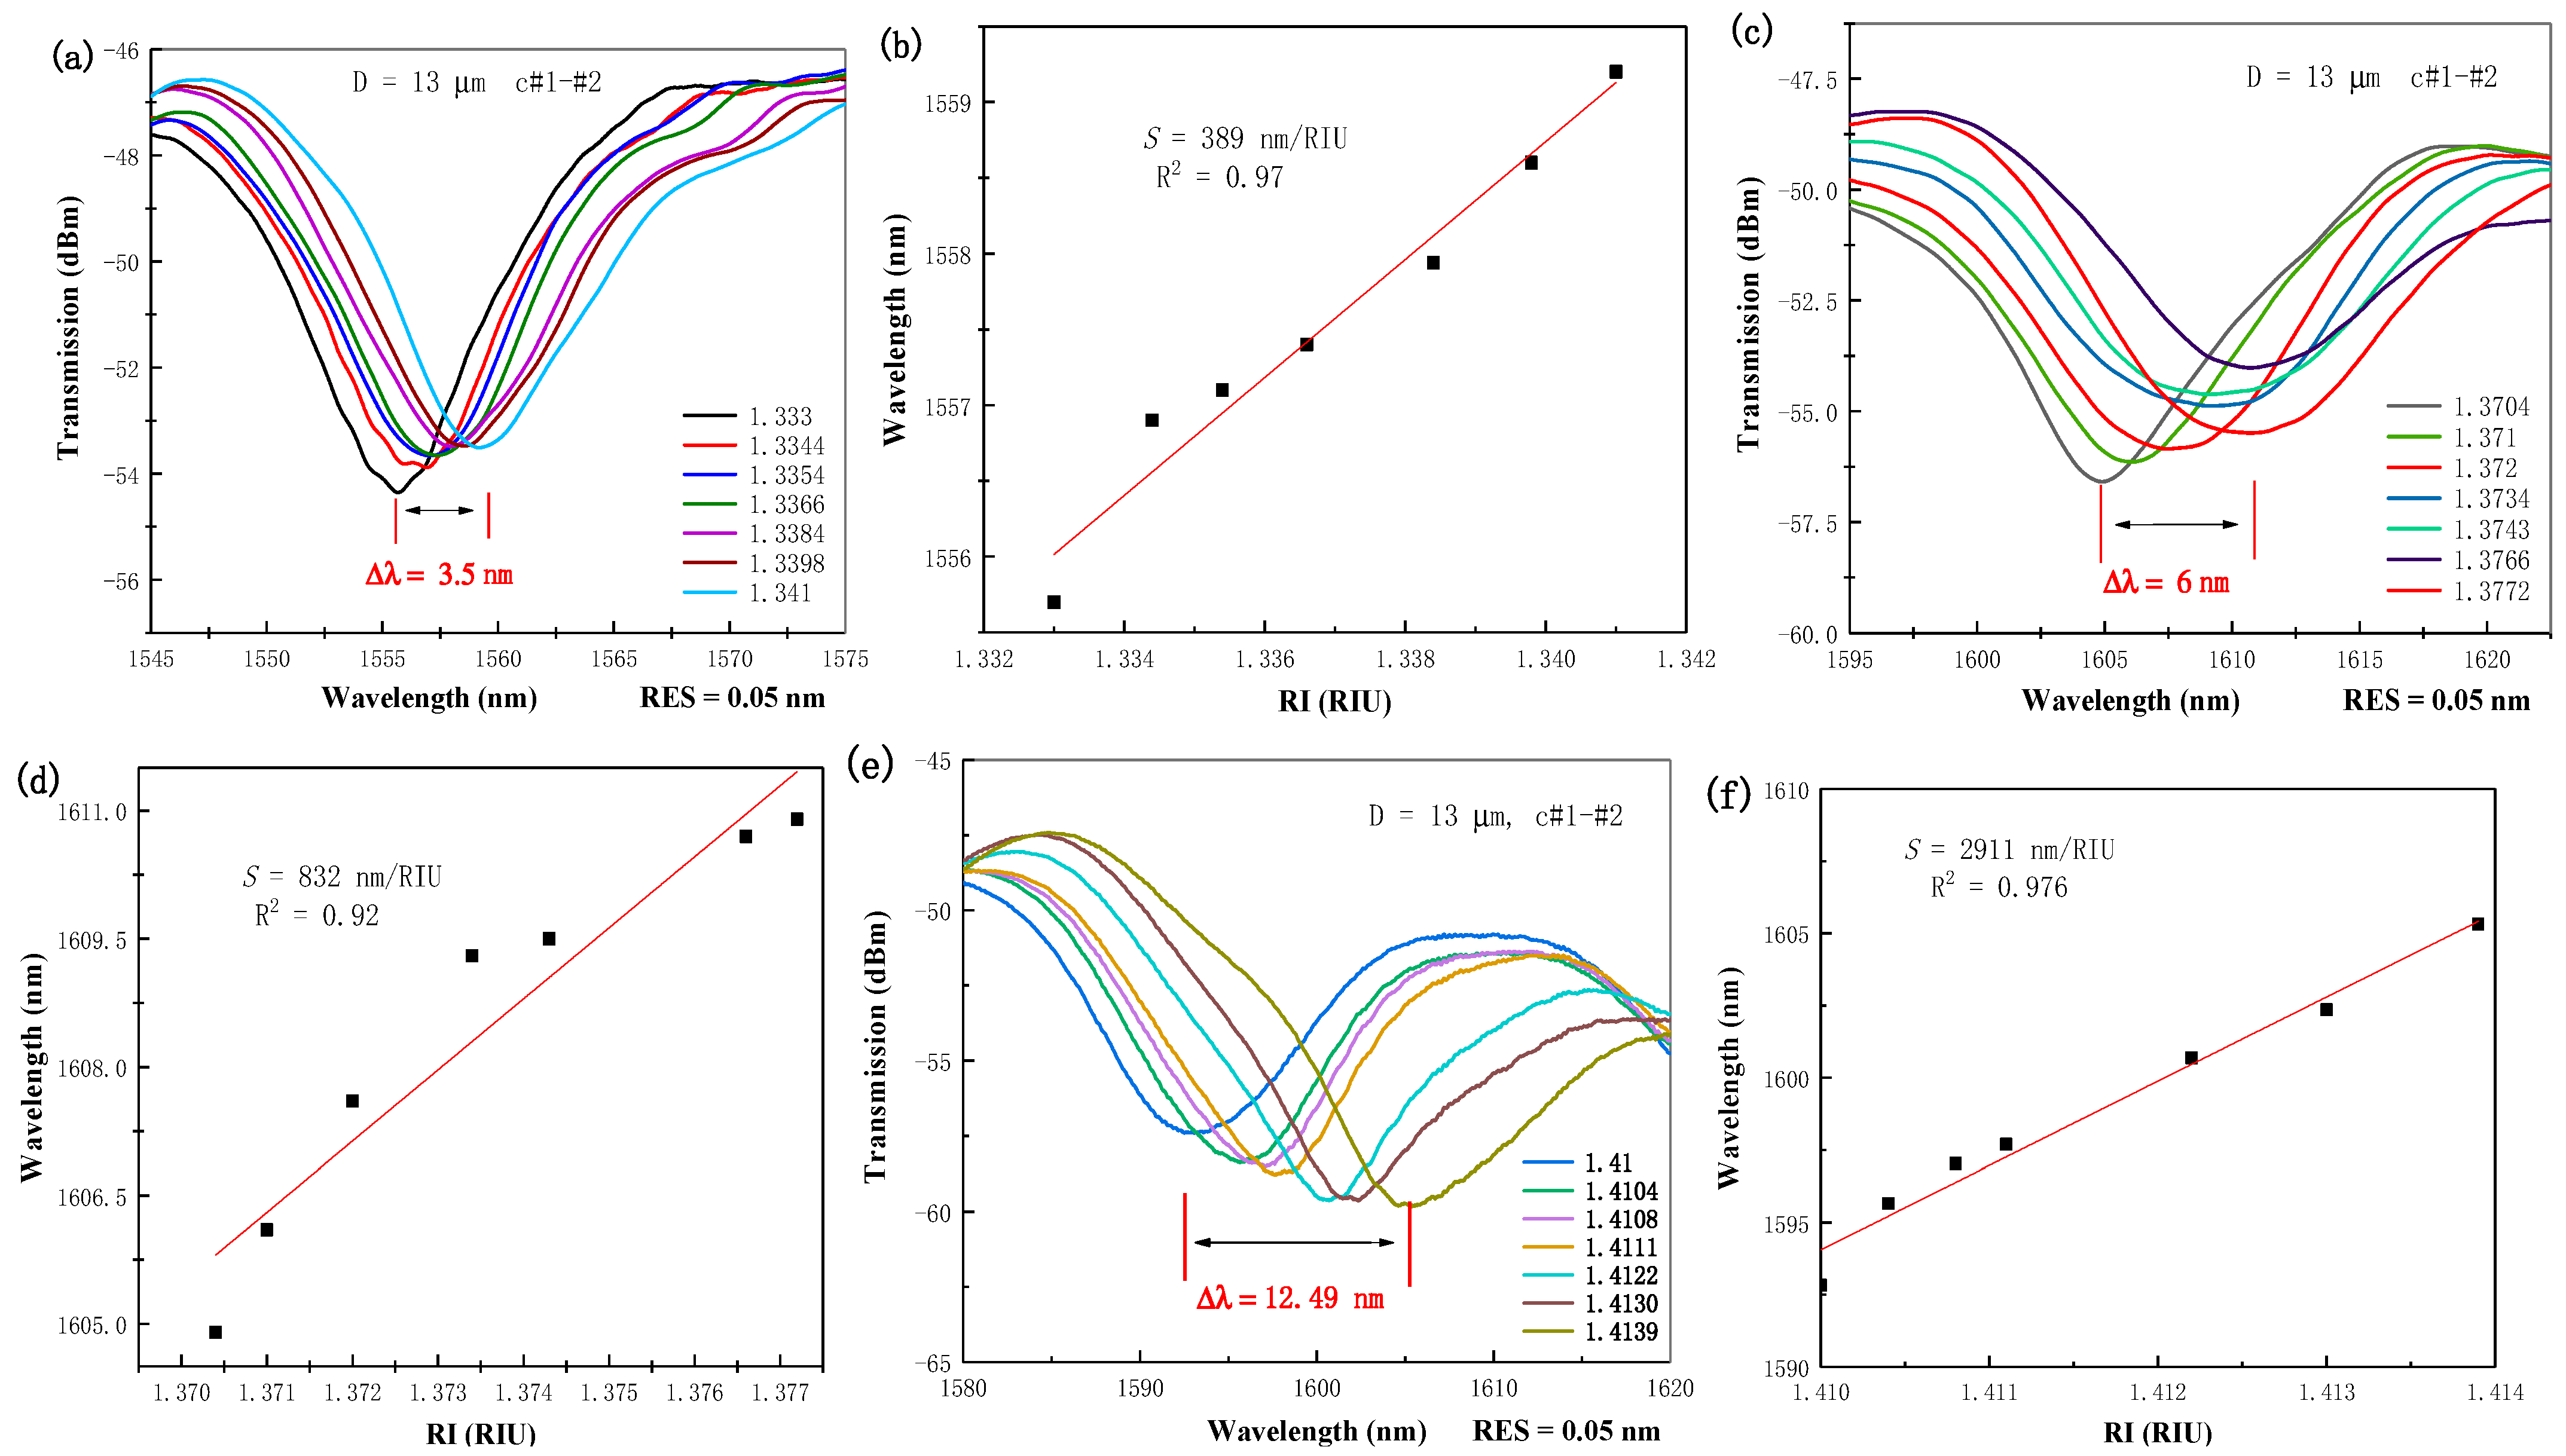
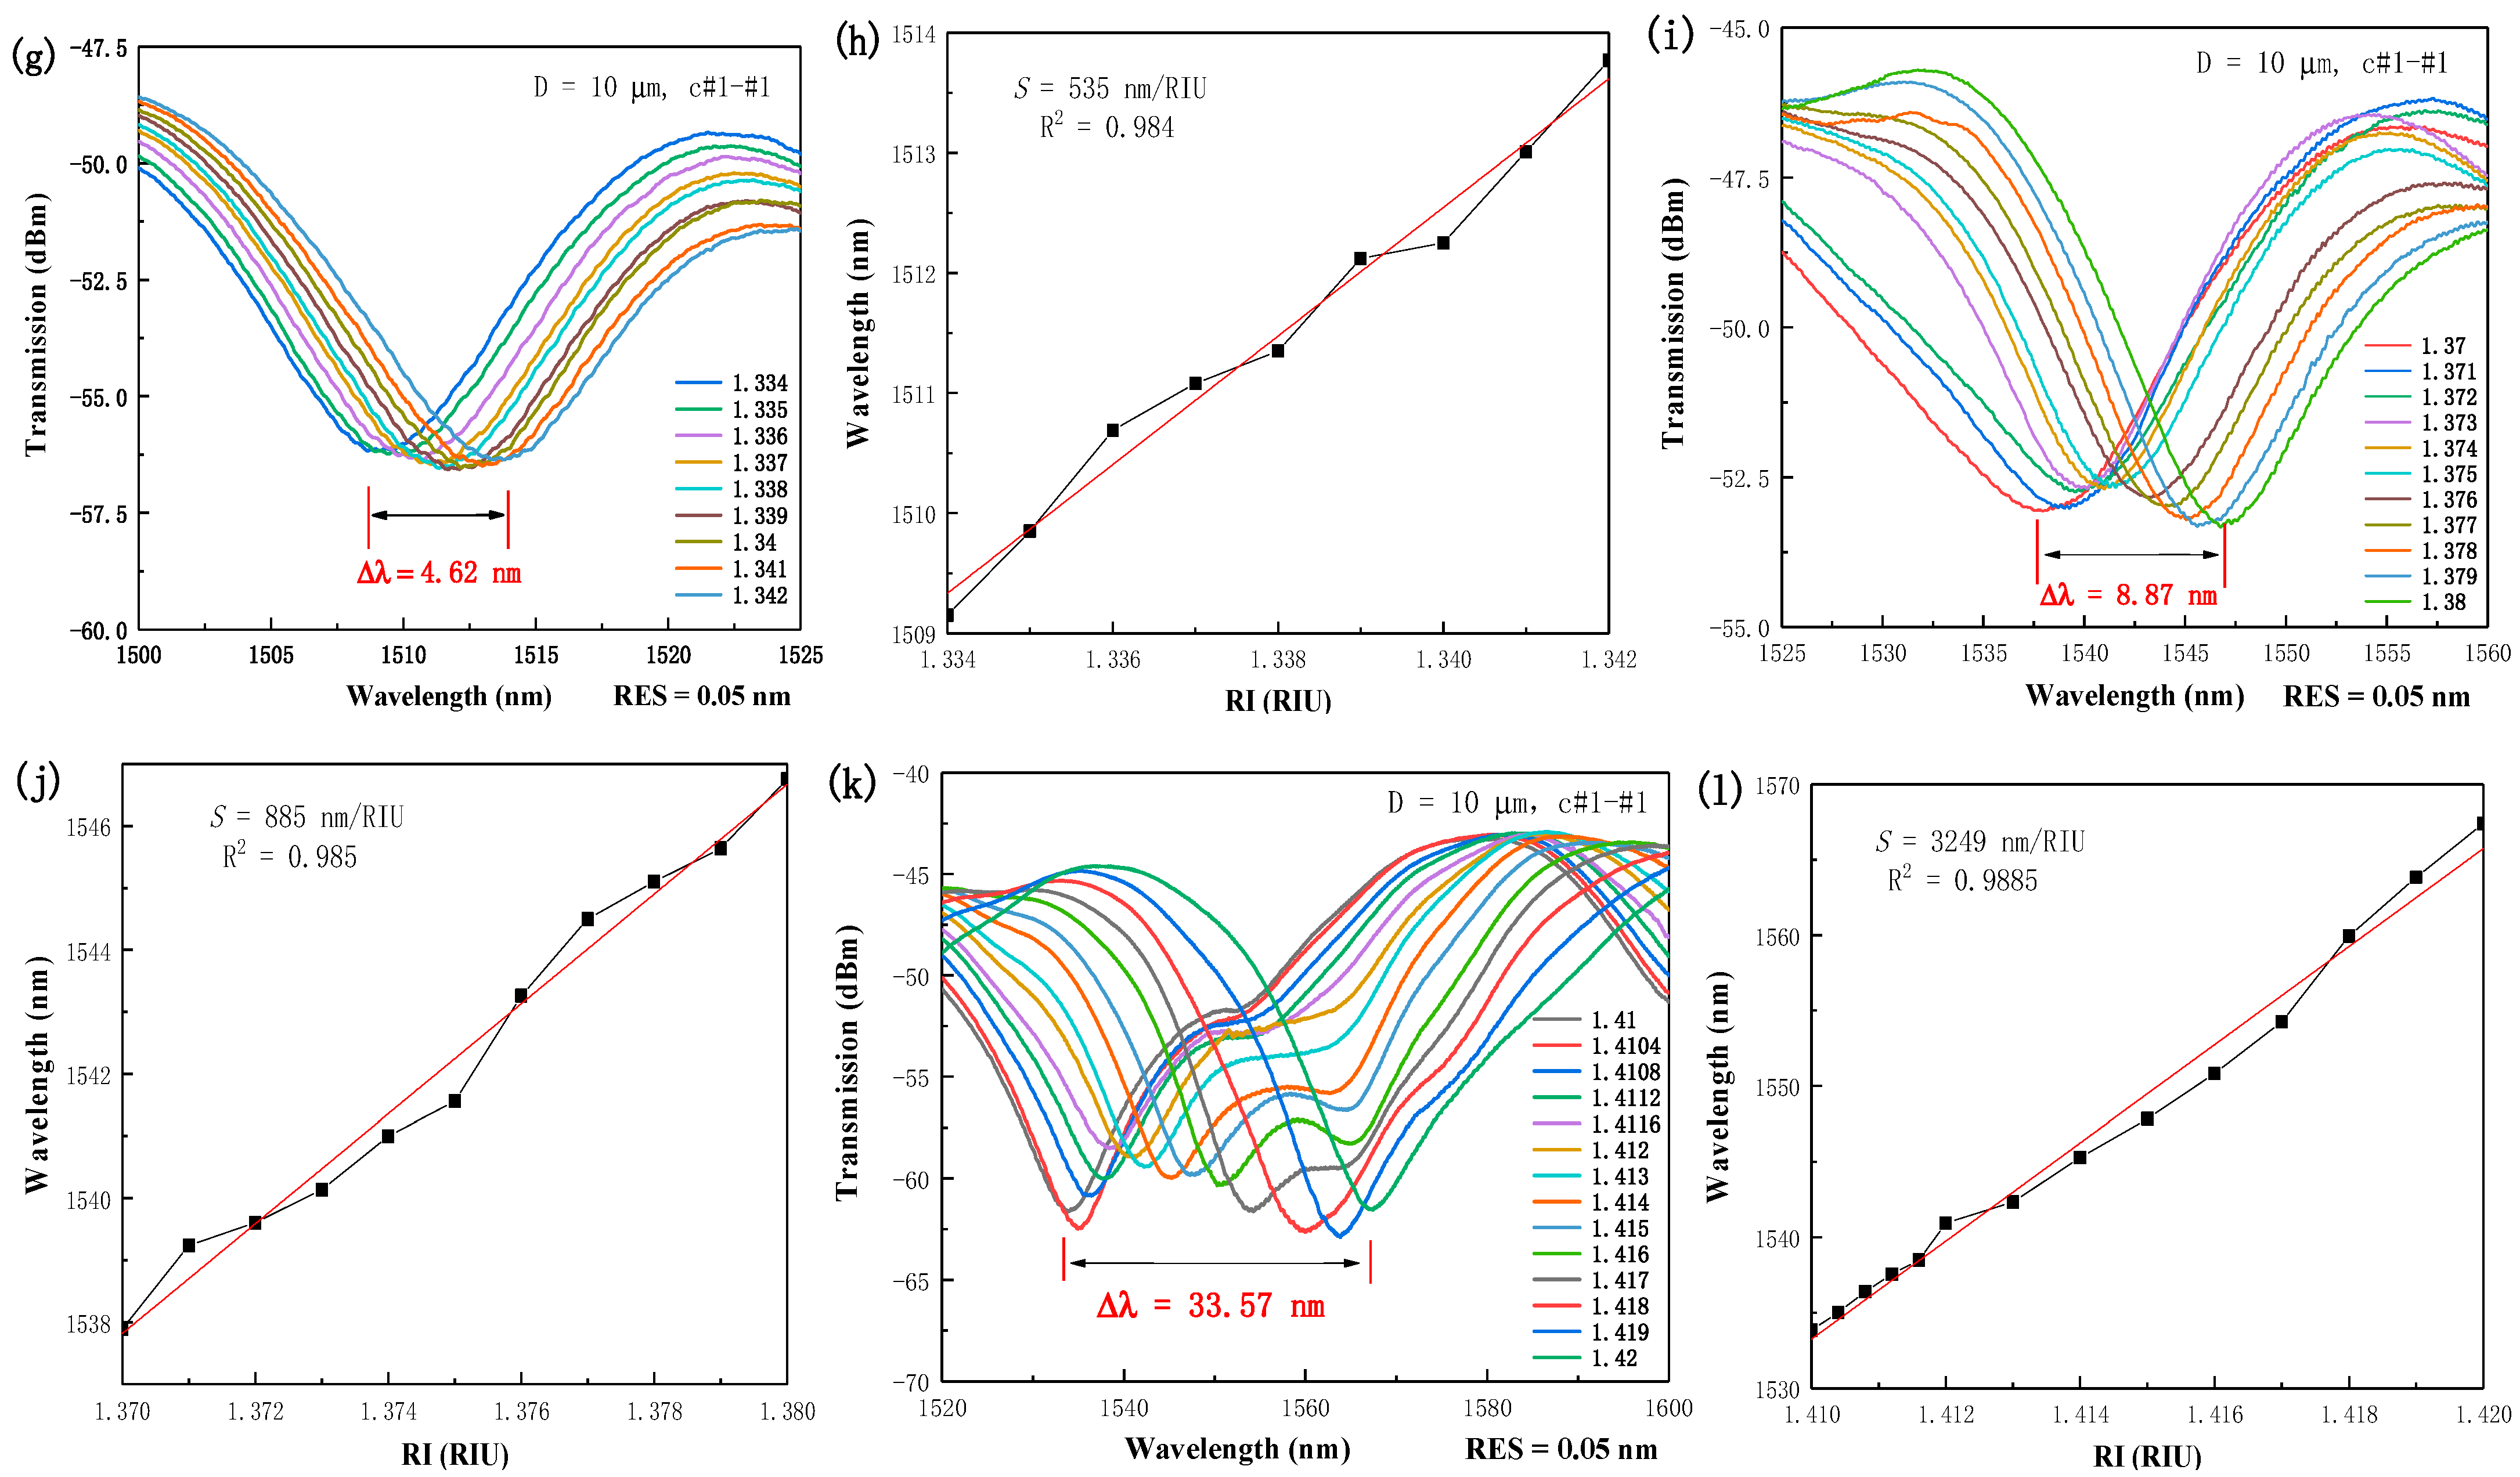
3. Measurements and Discussions

In measurement, four TFCF samples, A1, A2, A3, A4 with the D of 26 μm, 15 μm, 13 μm, and 10 μm, respectively, were prepared to investigate their spectral characteristics. The optical resolution (RES) of OSA was set at 0.05 nm or 0.5 nm, contingent upon the spectral spanning range. To investigate the spectral responses for the power coupling ports between input/output cores, denoted as c#-#, the power coupling condition from input core 1 to output core 1, namely c#1-#1, is called the direct-through state. On the other hand, the conditions from input core 1 to output core 2/3/4, namely c#1-#2/3/4, are defined as the cross-coupled states. The spectral responses of the samples A1, A2, A3, A4 with the states of c#1-#1 in air can be found in Figure 3a. From which, the normalized transmission loss was observed with oscillating power variations at the very beginning tapering stage at D = 26 μm. When D continuously decreases, the spectral curves come along with more and more oscillations and the free spectral range (FSR) decreases accordingly. In Figure 3b, the spectral responses of the sample A1 with its all power coupling states c#1-#1/2/3/4 in air were recorded and shown there. Explicitly, it is very interesting to note that the oscillating spectral curves for c#1-#2 and c#1-#3 are highly similar to each other since core #2 and #3 are neighboring cores with the same distance with respect to the excitation core #1. On the contrary, the spectral curve for c#1-#4 is somehow in phase and out of phase relative to the shorter and longer wavelength side of 1450 nm of c#1-#1. In fact, D = 30 μm was experimentally found to be close to the critical point to start the excitation of the supermodes. Thus, for D = 26 μm, the core c#1,2,3 are grouped together to produce the tri-core-based supermodes first, whereas the evanescent power overlapping only occurs at the longer wavelengths for core c#4 to generate the quadruple-core-based supermodes. This is the reason why the oscillating spectral curve for c#1-#4 is partially in phase to that of c#1-#1. However, this phenomenon disappears rapidly soon after D increasingly decreases. The spectral curves for all power coupling start when D = 15 μm, 13 μm, and 10 μm are respectively shown in Figure 3c–e. As predicted, along with the decreasing D, the FSR decreases. The relationships between different c#-# are quite chaotic and no strong regular manners can be found due to the asymmetric supermodes based on the vertex-core excitation scheme. However, when D = 13 μm and 10 μm, the power oscillations become highly overlap with each other for the curves c#1-#1 and c#1-#4 at the longer wavelengths, shown in Figure 3d,e.
For RI sensing, the two TFCFs with D of 13 μm and 10 μm were selected due to their better performances. The prepared liquids were ranging over the index 1.334–1.342, 1.37–1.38, 1.41–1.42 [40]. Each of them was individually applied into a U-groove and then lifted to a right position by a precision translation stage to make the TFCF entirely immersed. After each time of measurement at room temperature, the samples were thoroughly cleaned using DI water and alcohol to complete the experiments. The refractive indices of the liquids were accurately measured using an Abbe refractometer and the step of the index increment was from 0.0003 to 0.001 contingent upon the fiber samples. At the beginning, the spectral responses with the best interferences at some specific wavelengths were intentionally searched and observed from OSA. Subsequently, the refractive indices of the liquids were finely tuned around there. When the RI gradually increases, the resonant wavelengths red-shift. However, the extinction ratio downgrades slowly with increasing RI since the phase-matching conditions are no longer well-satisfied. Hence, the RI sensitivity was measured at some specifically selected wavelengths and at some RI intervals over 1.334–1.42. The spectral responses of the samples A3 and A4 for the direct-through and cross-coupled states were all recorded at the wavelengths around 1500—1600 nm as well as the S are shown in Figure 4a–l. In Figure 4e,g, the D, L, maximum wavelength shift Δλ, index variations, and c#-# are (13 μm, 1.8 mm, 12.49 nm, 1.41–1.4139, cross-coupled c#1-#2) and (10 μm, 2.1 mm, 4.62 nm, 1.334–1.342, direct-through c#1-#1), respectively. Figure 4g,i,k are the spectral responses of the sample A4 on the c#1-#1 states over different index ranges while Figure 4h,j,l are their corresponding sensitivity. Explicitly, the different index liquids give rise to different resonant wavelengths and the sensitivity gradually increases with an increasing external index, shown in Figure 4g,i,k. This is because an external index closing to the effective index of the TFCF can expand the mode fields much more to extend to the outside of TFCF to increase the index sensitivity. From Figure 4e,k, the resonant wavelengths red-shift with an increasing index and the maximum S can be found to be 2911 nm/RIU, shown in Figure 4f, and 3249 nm/RIU, shown in Figure 4l, respectively. It is worthy to note that the S has been shown to be significantly improved compared with the reported fiber interferometers using FCF [26,32,33]. In addition, the coefficients of determination R2 of linear fitting are 0.976 and 0.9885, respectively, and which reflects the 0394λ exhibits high linearity. In Figure 4k, it is interesting to note that when the ambient index gradually goes up, the resonant wavelength red-shifts. On the other hand, when the tapered diameter is as small as 10 μm and the ambient index is higher than 1.41, two resonant wavelengths can be generated and clearly observed around the refractive index range 1.41–1.417. This is because when a silica tapered fiber is surrounded by the liquid with a refractive index closing to its effective refractive index, more high order supermodes can be excited and survived. This is why the two resonant wavelengths can be observed. However, when the ambient refractive index continuously increases, the phase-matching conditions are no longer well-satisfied. Thus, one of the resonant wavelengths disappears. To simplify the comparisons among samples A2, A3, A4, the best measured working parameters including D, L, ER, FSR, Δλ, S, and c#-# are listed in Table 1. Obviously, a smaller D can lead to the larger Δλ and S since the higher order supermodes were excited when the four cores are tightly gathered. Moreover, by selecting the proper tapered diameter and RI liquids, the desired spectral responses as well as the S can be achieved. However, in terms of the best S, the D as small as 10 μm would be the best option over the low RI range near 1.334.

4. Conclusions

In this work, the asymmetric supermode interferences based on the TFCF in the vertex-core excitation scheme were demonstrated to achieve high sensitivity RI sensors. The best sensitivity can be as high as 3249 nm/RIU over the index range 1.41–1.42 and the best extinction ratio is 15.5 dB while the tapered diameter is 10 μm. When the tapered diameter is approaching 30 μm, the supermodes excitations were started to produce. Initially, the supermodes are exited based on a tri-core structure and then gradually transitioned to a quadruple-core structure. This can be verified to explain that the spectral responses of the diagonal core c#4 are in-phase and out-of-phase relative to that of the excitation core c#1 at the short- and long-wavelength side of 1450 nm, respectively. When the tapered diameter gradually decreases, the phases of the cross-coupled and the direct-through spectra become less correlated due to over-coupling. The best sensitivity is achieved when the tapered diameter and tapered length are 10 μm and 2.1 mm, respectively. The measured index sensitivity for fiber sample A4 is 535 nm/RIU, 884 nm/RIU, and 3249 nm/RIU over the indices ranging from 1.334–1.342, 1.37–1.38, and 1.41–1.42, respectively. The best sensitivity of the TFCF-based RI sensor is 3249 nm/RIU. The excited asymmetric supermodes in TFCF based on a vertex-core excitation are very different from the mode characteristics of the symmetric supermodes in tapered MCF. This RI sensor can also be used to measure the variations of temperature, humidity, blood glucose concentration, and many other applications in biochemical and biomedical fields. It is thus highly promising for developing high sensitivity fiber interferometric sensors.

Author Contributions

Conceptualization, N.-K.C. and L.S.; methodology, L.S. and H.-C.C.; validation, H.Z.; formal analysis, Y.-P.P.; investigation, Y.-P.P. and L.S.; resources, N.-K.C.; data curation, F.Y.; writing—original draft preparation, L.S.; writing—review and editing, Y.-P.P.; supervision, N.-K.C.; project administration, N.-K.C.; funding acquisition, N.-K.C. All authors have read and agreed to the published version of the manuscript.

Funding

This research was funded by National Natural Science Foundation of China, grant number 61875247. It was also supported by Liaocheng University under Grants 31805180101, and 319190301.

Institutional Review Board Statement

Not applicable.

Informed Consent Statement

Not applicable.

Data Availability Statement

The data that support the findings of this study are available on request from the corresponding author. The data are not publicly available due to privacy or ethical restrictions.

Acknowledgments

Partial financial supports from National Natural Science Foundation of China and Liaocheng University, Shandong, China are highly appreciated.

Conflicts of Interest

The authors declare no conflict of interest.

References

  1. Leung, C.K.Y.; Wan, K.T.; Inaudi, D.; Bao, X.; Habel, W.; Zhou, Z.; Ou, J.; Ghandehari, M.; Wu, H.C.; Imai, M. Review: Optical fifiber sensors for civil engineering applications. Mater. Struct. 2015, 48, 871–906. [Google Scholar] [CrossRef] [Green Version]
  2. Barrera, D.; Finazzi, V.; Villatoro, J.; Sales, S.; Pruneri, V. Packaged optical sensors based on regenerated fifiber Bragg gratings for high temperature applications. IEEE Sens. J. 2012, 12, 107–112. [Google Scholar] [CrossRef]
  3. Yadav, T.K.; Narayanaswamy, R.; Abu Bakar, M.H.; Kamil, Y.M.; Mahdi, M.A. Single mode tapered fiber-optic interferometer based refractive index sensor and its application to protein sensing. Opt. Express 2014, 22, 22802–22807. [Google Scholar] [CrossRef]
  4. Liehr, S.; Lenke, P.; Wendt, M.; Krebber, K.; Seeger, M.; Thiele, E.; Metschies, H.; Gebreselassie, B.; Munich, J.C. Polymer optical fiber sensors for distributed strain measurement and application in structural health monitoring. IEEE Sens. J. 2009, 9, 1330–1338. [Google Scholar] [CrossRef]
  5. Tsiminis, G.; Klarić, T.S.; Schartner, E.P.; Warren-Smith, S.C.; Lewis, M.D.; Koblar, S.A.; Monro, T.M. Generating and measuring photochemical changes inside the brain using optical fifibers: Exploring stroke. Biomed. Opt. Express 2014, 5, 3975–3980. [Google Scholar] [CrossRef] [Green Version]
  6. Macho, A.; Morant, M.; Llorente, R. Experimental evaluation of nonlinear crosstalk in multi-core fiber. Opt. Express 2015, 23, 18712–18720. [Google Scholar] [CrossRef]
  7. Silva-Lopez, M.; Macpherson, W.N.; Li, C.; Moore, A.J.; Barton, J.S.; Jones, J.D.C.; Zhao, D.; Zhang, L.; Bennion, I. Transverse load and orientation measurement with multicore fiber Bragg gratings. Appl. Opt. 2005, 44, 6890–6897. [Google Scholar] [CrossRef] [Green Version]
  8. Luís, R.S.; Rademacher, G.; Puttnam, B.J.; Eriksson, T.A.; Furukawa, H.; Ross-Adams, A.; Gross, S.; Withford, M.; Riesen, N.; Sasaki, Y.; et al. 1.2 Pb/s throughput transmission using a 160 μm cladding, 4-core, 3-mode fiber. J. Lightwave Technol. 2019, 37, 1798–1804. [Google Scholar] [CrossRef]
  9. Hayashi, T.; Tamura, Y.; Hasegawa, T.; Taru, T. Record-low spatial mode dispersion and ultra-low loss coupled multi-core fiber for ultra-long-haul transmission. J. Lightwave Technol. 2017, 35, 450–457. [Google Scholar] [CrossRef]
  10. Diamantopoulos, N.P.; Shikama, K.; Nishi, H.; Fujii, T.; Kishi, T.; Takeda, K.; Abe, Y.; Matsui, T.; Kakitsuka, T.; Fukuda, H.; et al. 400-Gb/s DMT-SDM transmission based on membrane DML-array-on-silicon. J. Lightwave Technol. 2019, 37, 1805–1812. [Google Scholar] [CrossRef]
  11. Hayashi, T.; Tamura, Y.; Hasegawa, T.; Taru, T. 125-µm-cladding coupled multi-core fiber with ultra-low loss of 0.158 dB/km and record-low spatial mode dispersion of 6.1 ps/km1/2. In Proceedings of the Optical Fiber Communication Conference (OFC), Anaheim, CA, USA, 20–24 March 2016; Available online: https://ieeexplore.ieee.org/xpl/conhome/7518994/proceeding (accessed on 18 December 2021).
  12. Chen, W.; Chen, Z.; Qiu, Y.; Kong, L.; Lin, H.; Jia, C.; Chen, H.; Li, H. Highly sensitive optical fiber curvature sensor based on a seven-core fiber with a twisted structure. Appl. Opt. 2019, 58, 8776–8784. [Google Scholar] [CrossRef]
  13. Zhang, S.; Zhou, A.; Guo, H.; Zhao, Y.; Yuan, L. Highly sensitive vector curvature sensor based on a triple-core fiber interferometer. OSA Contin. 2019, 2, 1953. [Google Scholar] [CrossRef]
  14. Li, H.; Li, H.; Meng, F.; Lou, X.; Zhu, L. All-fiber MZI sensor based on seven-core fiber and fiber ball symmetrical structure. Opt. Lasers Eng. 2019, 112, 1–6. [Google Scholar] [CrossRef]
  15. Kochanowicz, M.; Dorosz, D.; Zmoyda, J. Coherent beam combining of active multicore optical fiber. Proc. SPIE 2009, 7502, 750225. [Google Scholar] [CrossRef]
  16. Prevost, F.; Lombard, L.; Primot, J.; Ramirez, L.P.; Bigot, L.; Bouwans, G.; Hanna, M. Coherent beam combining of a narrow-linewidth long-pulse Er3+-doped multicore fiber amplifier. Opt. Express 2017, 25, 9528–9534. [Google Scholar] [CrossRef] [Green Version]
  17. Shirakawa, A.; Saitou, T.; Sekiguchi, T.; Ueda, K. Coherent addition of fiber lasers by use of a fiber coupler. Opt. Express 2002, 10, 1167–1172. [Google Scholar] [CrossRef] [PubMed]
  18. Delgado, G.S.; Newkirk, A.V.; Lopez, J.E.A.; Rios, A.M.; Schulzgen, A.; Correa, R.A. Compact fiber-optic curvature sensor based on super-mode interference in a seven-core fiber. Opt. Lett. 2015, 40, 1468–1471. [Google Scholar] [CrossRef]
  19. Xia, C.; Bai, N.; Ozdur, I.; Zhou, X.; Li, G. Supermodes for optical transmission. Opt. Express 2011, 19, 16653–16664. [Google Scholar] [CrossRef]
  20. Jiang, Y.; Wang, T.; Liu, C.; Feng, D.; Jiang, B.; Yang, D.; Zhao, J. Simultaneous measurement of refractive index and temperature with high sensitivity based on a multipath fiber Mach-Zehnder interferometer. Appl. Opt. 2019, 58, 4085–4090. [Google Scholar] [CrossRef] [PubMed]
  21. Villatoro, J.; Arrizabalaga, O.; Antonio-Lopez, E.; Zubia, J.; Ocariz, R.S. Multicore Fiber Sensors; OFC: Los Angeles, CA, USA, 2017; Available online: https://ieeexplore.ieee.org/xpl/conhome/7932337/proceeding (accessed on 18 December 2021).
  22. Xia, C.; Eftekhar, M.A.; Correa, R.A.; Antonio-Lopez, J.E.; Schulzgen, A.; Christodoulides, D. Supermodes in coupled multi-core waveguide structures. IEEE J. Sel. Top. Quantum Electron. 2016, 22, 196–207. [Google Scholar] [CrossRef]
  23. Yan, D.; Tian, Z.; Chen, N.K.; Zhang, L.; Yao, Y.; Xie, Y.; Shum, P.P.; Garttan, K.T.V.; Wang, D. Observation of split evanescent field distributions in tapered multicore fibers for multiline nanoparticle trapping and microsensing. Opt. Express 2021, 29, 9532–9543. [Google Scholar] [CrossRef]
  24. Barrera, D.; Gasulla, I.; Sales, S. Multipoint two-dimensional curvature optical fiber sensor based on a nontwisted homogeneous four-core fiber. J. Lightwave Technol. 2015, 33, 2445–2450. [Google Scholar] [CrossRef]
  25. Askins, C.G.; Miller, G.A.; Friebele, E.J. Bend and twist sensing in a multiple-core optical fiber. In Proceedings of the 2008 Conference on Optical Fiber Communication/National Fiber Optic Engineers Conference (OFC/NFOEC), San Diego, CA, USA, 24–28 February 2008; IEEE: Piscataway, NJ, USA, 2008. [Google Scholar] [CrossRef]
  26. Li, C.; Ning, T.; Zhang, C.; Li, J.; Zhang, C.; Wen, X.; Lin, H.; Pei, L. All-fiber multipath Mach-Zehnder interferometer based on a four-core fiber for sensing applications. Sens. Actuator A Phys. 2016, 248, 148–154. [Google Scholar] [CrossRef]
  27. Shao, Z.; Qiao, X.; Rong, Q. Compact gas refractometer based on a tapered four-core fiber. Appl. Opt. 2018, 57, 10198–10206. [Google Scholar] [CrossRef]
  28. Bao, W.; Sahoo, N.; Sun, Z.; Wang, C.; Liu, S.; Wang, Y.; Zhang, L. Selective fiber Bragg grating inscription in four-core fiber for two-dimension vector bending sensing. Opt. Express 2020, 28, 26461–26469. [Google Scholar] [CrossRef]
  29. Wang, J.; Shen, C.; Lu, Y.; Chen, D.; Zhong, C.; Chu, J.; Dong, X.; Chan, C.C. Liquid refractive index sensor based on a polarization-maintaining fiber loop mirror. IEEE Sens. J. 2013, 13, 1721–1724. [Google Scholar] [CrossRef]
  30. Lee, K.J.; Liu, X.; Vuillem, N.; Lwin, R.; Saval, S.J.L.; Argyros, A.; Kuhlmey, B.T. Refractive index sensor based on a polymer fiber directional coupler for low index sensing. Opt. Express 2014, 22, 17497–17507. [Google Scholar] [CrossRef] [PubMed]
  31. Ran, Z.; Rao, Y.; Zhang, J.; Liu, Z.; Xu, B. A miniature fiber-optic refractive-index sensor based on laser-machined Fabry-Perot interferometer tip. J. Lightwave Technol. 2009, 27, 5426–5429. [Google Scholar] [CrossRef]
  32. Zhang, C.; Ning, T.; Li, J.; Pei, L.; Li, C.; Lin, H. Refractive index sensor based on tapered multicore fiber. Opt. Fiber Technol. 2017, 33, 71–76. [Google Scholar] [CrossRef]
  33. Yang, R.; Yu, Y.S.; Chen, C.; Xue, Y.; Zhang, X.; Guo, J.C.; Wang, C.; Zhu, F.; Zhang, B.; Chen, Q.; et al. S-tapered fiber sensors for highly sensitive measurement of refraAllive index and axial strain. J. Lightwave Technol. 2012, 30, 3126–3132. [Google Scholar] [CrossRef]
  34. Sakamoto, T.; Mori, T.; Wada, M.; Yamamoto, T.; Matsui, T.; Nakajima, K.; Yamamoto, F. Experimental and numerical evaluation of inter-core differential mode delay characteristic of weakly-coupled multi-core fiber. Opt. Express 2014, 22, 31966–31976. [Google Scholar] [CrossRef] [PubMed]
  35. Kokubun, Y.; Komo, T.; Takenaga, K.; Tanigawa, S.; Matsuo, S. Selective mode excitation and discrimination of four-core homogeneous coupled multi-core fiber. Opt. Express 2011, 19, B905–B914. [Google Scholar] [CrossRef] [PubMed]
  36. Macho, A.; Morant, M.; Llorente, R. Unified model of linear and nonlinear crosstalk in multi-core fiber. J. Lightwave Technol. 2016, 34, 3035–3046. [Google Scholar] [CrossRef]
  37. Shi, j.; Xiao, S.; Bi, M. Sensitivity-enhanced refractive index sensor by using tapered thin-core fiber based inline Mach-Zehnder interferometer. In Proceedings of the 2011 Asia Communications and Photonics Conference and Exhibition (ACP), Shanghai, China, 13–16 November 2011. [Google Scholar] [CrossRef]
  38. Yang, Z.; Sun, H.; Gang, T.; Liu, N.; Li, J.; Meng, F.; Qiao, X.; Hu, M. Refractive index and temperature sensing characteristics of an optical fiber sensor based on a tapered single mode fiber/polarization maintaining fiber. Chin. Opt. Lett. 2016, 14, 050604. Available online: https://oepn.opticsjournal.net/Articles/Abstract/col/14/5/050604.cshtml (accessed on 18 December 2021). [CrossRef]
  39. Zhang, L.; Zhang, W.; Chen, L.; Yan, T.; Wang, L.; Wang, B.; Zhou, Q. A fiber bending vector sensor based on M–Z interferometer exploiting two hump-shaped tapers. IEEE Photon. Technol. Lett. 2015, 27, 1240–1243. [Google Scholar] [CrossRef]
  40. Liu, D.; Mallik, A.K.; Yuan, J.; Yu, C.; Farrell, G.; Semenova, Y.; Wu, Q. High sensitivity refractive index sensor based on a tapered small core single-mode fiber structure. Opt. Lett. 2015, 40, 4166–4169. [Google Scholar] [CrossRef] [Green Version]
Figure 1. (a) Designation of the four cores ①, ②, ③, ④ in the TFCF interferometer in which c#1 represents the excitation core. (b) Microphotograph of the TFCF with D = 10 μm under a 1000× CCD microscope.
Photonics 09 00045 g001
Figure 2. (a) Experimental set-up for fabricating TFCF RI sensors based on the vertex-core excitation scheme. Cross-sectional views of the microphotographs of the TFCF when (b) D = 37 μm, (c) D = 35.5 μm, (d) D = 33 μm and (e) D = 24 μm under a 1000× CCD microscope. (f) Vertex-core excitation scheme (D = 37 μm). Far-field mode patterns of the excited supermodes for the (g) tri-core structure (D = 35.5 μm), (h) quadruple-core structure (D = 33 μm) and (i) quadruple-core structure (D = 24 μm).
Photonics 09 00045 g002
Figure 3. Spectral responses of the oscillating curves for (a) D = 26, 15, 13, 10 μm with the c#1-#1 states and for (b) D = 26 μm, (c) D = 15 μm (d) D = 13 μm, and (e) D = 10 μm with the c#1-#1/2/3/4 states.
Photonics 09 00045 g003
Figure 4. Spectral responses of the wavelength shift versus index variations for (a) sample A3 over the index range 1.333–1.341, (c) 1.3704–1.3772, (e) 1.41–1.4139 and for sample A4 over the index range (g) 1.334–1.342, (i) 1.37–1.38, and (k) 1.41–1.42, respectively. The measured index sensitivity is (b) 389 nm/RIU, (d) 832 nm/RIU, (f) 2911 nm/RIU for sample A3 and (h) 535 nm/RIU (j) 885 nm/RIU, and (l) 3249 nm/RIU for sample A4 using different index liquids.
Photonics 09 00045 g004aPhotonics 09 00045 g004b
Table 1. Working parameters for TFCF-based RI sensors.
ParametersSample A2Sample A3Sample A4
Tapered diameter (D)15 μm13 μm10 μm
Tapered length (L)2 mm1.8 mm2.1 mm
Extinction ratio (ER)15.31 dB14.76 dB15.5 dB
Free spectral range (FSR)56.3 nm 31.7 nm 28.5 nm
Wavelength shift (Δλ)3.8 nm12.49 nm33.57 nm
Maximum index sensitivity (S)
I/O Power coupling ports (c#-#)
1213 nm/RIU
c#1-#2
2911 nm/RIU
c#1-#2
3249 nm/RIU
c#1-#1
Publisher’s Note: MDPI stays neutral with regard to jurisdictional claims in published maps and institutional affiliations.

