1. Introduction
In the last few years, radio over fiber (RoF) systems have been of great interest in many applications, such as: sensor networks, broad-band wireless access networks, radar systems, and satellite communications [
1,
2]. RoF systems are used as optical solutions for a broadband optical transmission network thanks to their high capacity, low cost, and their simple architecture [
3]. Moreover, reduced size, light weight, wide bandwidth, low optical transmission loss, and immunity to electromagnetic interference offered by optical fibers are essential advantages of optically transmitting signals carrying data. However, restrictions in optical modulation and system efficiency result in high conversion loss for a single modulator as the frequency range increases.
Mixing with optical devices is one of the used techniques in optical transmission systems, with fiber-optic link, to up-convert the intermediate frequency (IF) signal frequency for downlink systems. Generally, the mixing is achieved by various optical mixers, such as Mach–Zehnder modulators (MZMs), photodiodes (PDs), and semiconductor optical amplifier Mach–Zehnder interferometers (SOA-MZIs). Several methods for mixing using all-optical components have been reported in [
4,
5,
6]. One of these methods consists in multiplying two input signals by cascading two external modulators biased at quadrature [
4,
5]. A MZM is an interferometric component used for modulating the amplitude of an optical light. The nonlinear transfer function enables the generation of mixing terms. The MZM driven by a local oscillator (LO) signal is employed for frequency mixing due to its nonlinearity. The resulting optical field at its output contains the mixing between the optical IF signal and the LO signal [
7]. The theoretical frequency response of the MZM up-converter of [
8,
9] clearly shows the up-converted signal at its output after a mixing of LO and IF signals. The frequency mixing is also implemented by cascading MZMs [
10,
11,
12]. An optical carrier is modulated by the first MZM driven by an IF signal. Then, the obtained modulated IF signal is modulated again with a LO signal by using the second MZM. The nonlinearity of the second MZM and the photo-detection operation generate the up-conversion mixing terms [
12]. Two passive solutions for 60 GHz applications, respectively based on cascaded electro-optic modulators (EOMs) and the direct modulation of a laser diode, associated in both cases to a photodiode, were compared in order to highlight the possibility to reduce the power fading as low as the optical fiber attenuation [
13]. In this work, sampling techniques [
14,
15,
16] were used, for the first time, to obtain frequency mixing based on a cascaded MZMs link in order to study and compare the performance of the electro-optical simulations and real-world communication systems.
Virtual Photonics Inc. (VPI) simulators are widely used to simulate a huge range of optical transmission systems. VPI transmissionMaker™ Optical Systems accelerate the design of new photonic systems, including short-range and long-haul optical transmission systems. Besides, these systems enable an efficient modeling of optical transmission systems, including bidirectional links, ring, and mesh networks. These systems are mainly used to investigate new technologies and to optimize the complexity of designed systems, such as coding, modulation, monitoring, compensation, mixing, or regeneration [
17].
Recently, we have used a single SOA-MZI or a cascaded SOA-MZIs link [
14,
15,
16] in order to achieve frequency mixing by all-optical sampling. Besides, the results of this optical transmission system based on the sampling method are well developed compared to other works without sampling. In this paper, we utilize the electro-optical sampling method, for the first time, in a cascaded MZMs link in order to achieve frequency up-conversion. In addition, an optical pulse source (OPS) has harmonics at frequencies
, where
is an integer. This source plays an important role for improving the up-converted signals to higher frequency ranges, which their replicas follow the harmonics of the sampling signal. This leads to ameliorate the efficiency and the quality of the optical transmission system.
The cascaded MZMs link, which consists of two stages, is used to achieve better performance of the optical transmission system compared to a single MZM link. In other words, we can demodulate the signal through the error vector magnitude (EVM) with a variety of bit rates (BRs) at a higher mixing frequency. Besides, we can also obtain positive conversion gains. The first stage is employed for amplification and modulation, while the second stage is utilized for up mixing. It is worth noting that both MZMs have the same operating point, structures, and static and dynamic characteristics. However, they are biased at different bias voltages. An IF signal is up-converted at mixing frequencies at the MZM2 output by using a VPI simulator, as well as real measurements. The benefits of using the cascaded MZMs link are a higher frequency range up to 78.5 GHz for up-conversion with significant characteristics of the optical transmission system due to the performance of the OPS. The cascaded MZMs link is well used in several applications, such as satellite communications and wireless access applications. These systems can avail from low loss and complexity and wide bandwidth of optical fibers. Furthermore, the electro-optical system of the cascaded MZMs link offers attractive advantages, such as optical amplification, wider bandwidth, and high conversion efficiency.
In this paper, we focus on the comparison of the experimental and simulation characterization of the sampling up-conversion technique based on a cascaded MZMs link to show its efficiency through the conversion gain and to identify its quality through EVM for the first time. In
Section 2, the principle of the cascaded MZMs link based on the sampling method is presented. Then, we analyze the MZM performance to identify the best operating point used in the frequency mixing. In
Section 3, advanced simulation and experimental setup of the frequency mixing in the cascaded MZMs link is reported. In
Section 4, we show that, based on a cascaded MZMs link controlled by a sampling signal at a repetition rate of 7.8 GHz, frequency up-conversion of IF signals can be performed up to 78.5 GHz for the simulation work and 39.5 GHz for the experimental one. Then, conversion gains are obtained to assess the quality of the system. In
Section 5, results are performed and evaluated through the EVM in the presence of quadrature phase shift keying (QPSK) data. Finally, in
Section 6, the conclusions reached through this work are provided.
2. Sampling Principle Based on the Cascaded MZMs Link
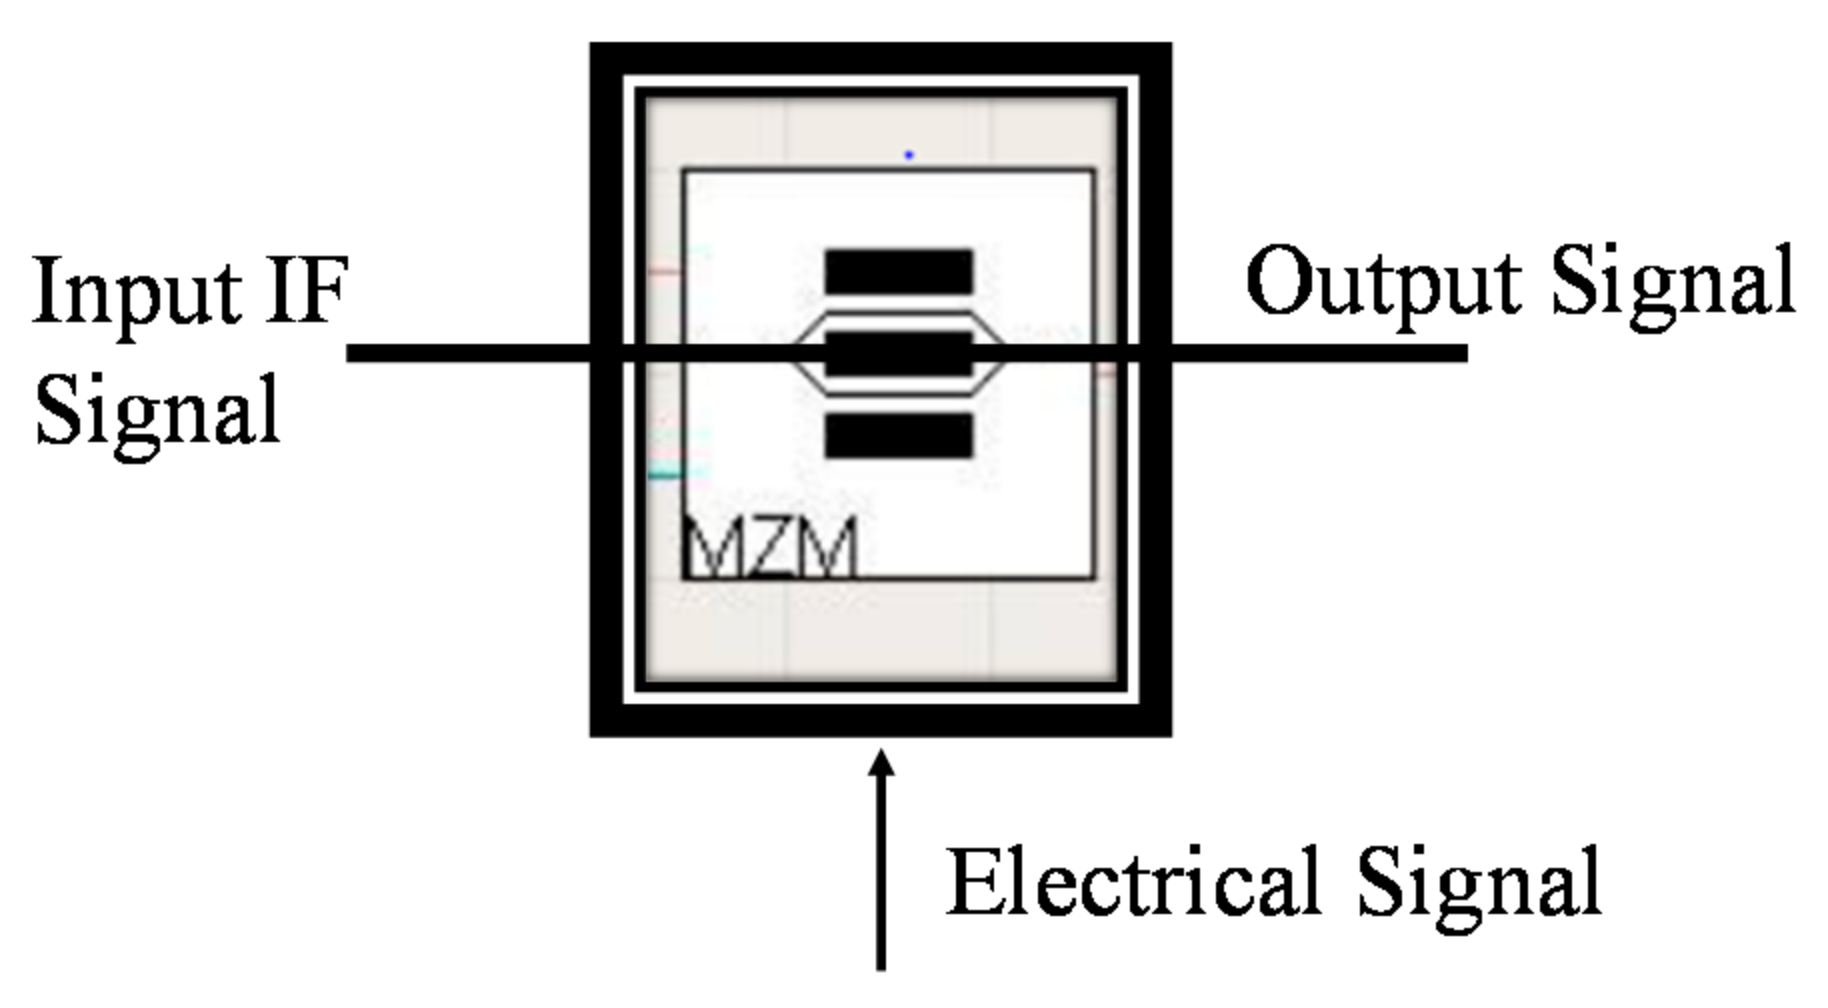
The Mach–Zehnder modulator (MZM) or electro-optic modulator (EOM) schematic diagram used in a VPI simulator is shown in
Figure 1. The MZM modulates the light resulted in a laser operating in continuous wave (CW) mode. Besides, the MZM has usually an IF input and another input for a DC bias. The MZM material has electro-optical properties, which is why it is also called EOM, by which the phase of the optical wave propagating inside it receives a phase modulation proportional to the applied electrical field. As a result, the optical output power of the MZM depends on the phase difference between the two arms of the modulator, which can be altered by adjusting the MZM bias.
The proposed up-conversion process is based on a cascaded MZMs link by using a sampling method. The first MZM is used as a modulator and the second one is used as an electro-optical sampling mixer, as shown in
Figure 2. Besides, there are two electrical inputs: an IF signal at the electrical port of MZM1 and a sampling signal at the electrical port of the MZM2 and optical output signals at the output for each MZM method. MZM: Mach–Zehnder Modulator and IF: Intermediate Frequency.
In this scheme, in the first stage of a cascaded MZMs link, the incoming data signal at the wavelength at the MZM1 input is intensity-modulated by an electrical subcarrier carrying complex modulated data at the intermediate frequency (IF) injected at the electrical port of MZM1. Hence, at the MZM1 output, the optical signal at is obtained after modulation. It is worth noting that MZM1 is biased at its linear region.
In the second stage of a cascaded MZM link, the sampling signal corresponding to ultra-short clock pulses with a sampling frequency is converted to the electrical signal after photo-detection and amplification and entered into the electrical port of the MZM2. As shown in the electrical spectrum of the sampling signal, the harmonics have different amplitudes, which slightly decrease with the harmonic rank . When a sampling signal is present at the MZM2 input, a phase shift is induced in the input signal. Thus, this results in the sampling of the data signal. As a result, the MZM2 was used as a sampling mixer because it is biased at its nonlinearity. This mixer was realized in order to exploit the sampling process to achieve a frequency up-conversion. As we can display from the electrical spectrum of the sampled signal obtained after photo-detection and amplification, replicas of the IF signal exist around the harmonics of the sampling signal. The replicas have various power levels relying on the harmonics of the sampling signal. Therefore, the IF signal was up-converted from to at the MZM2 output, where the harmonic rank of the sampling signal, , ranged from 1 to 10.
The up-mixing procedure based on a cascaded MZMs link by using the sampling method has some important merits, such as remote mixing, low weight, and miniature size. This electro-optical transmission system for producing the up-converted signal has been explored to upgrade the RoF system achievement and minimize the system expense.
The optical IF input power
was injected into the MZM2 input. It was constituted by a sum of a constant power
and a sinusoidal variation power
that consisted of the real and conjugate part of the complex power at a frequency
[
15] where:
where
is the modulation amplitude of the IF signal.
The optical clock input power, which was injected into the MZM2 input, was comprised of the sum of
harmonics. The harmonic power was noted
modulated as a sum of a constant power
and a sinusoidal variation power
that also consisted of the real and conjugate part of the complex power at a frequency
where:
where
is the modulation amplitude of the sampling signal.
In order to take into account the generation and the amplification of the second order terms, the small signal equations were written at the MZM2 output. Furthermore, the amplification of intermodulation terms that appeared on the optical signal at
could be taken into account. The optical power after filtering at the MZM2 output can be written as:
where
is the variation power of the sampled signal at
at the MZM2 output.
is the modulation amplitude of the sampled signal at
at the MZM2 output. As a result,
, which represents the optical power of the sampled signal at
that corresponds to the mixing frequencies
in the simulation and experimental works at the MZM2 output, was the up-conversion theoretical response calculated by small signal analysis. This power was converted to the electrical one in order to study the performance of the optical transmission system based on a cascaded MZMs link. Hence, the electrical spectrum of the sampled signal contained the amplified IF signal at
, the harmonics of the sampling signal at
, and replicas of the sampled signal at
, as was confirmed in the electrical spectrums of the experimental and simulation results.
The EOM was used to modulate the optical carrier carrying digital data modulated by a QPSK. The wavelength of the optical carrier was 1545 nm and its optical input power was 0 dBm. The EOM static characteristic is illustrated in
Figure 3. The extinction ratio of the EOM was equal to 32 dB for the simulations and 31 dB for the experimental work. The voltage
observed in
Figure 3 that is a voltage between the maximum transmission point and the minimum transmission one was 6.6 V. For modulation, the bias voltage (
) must be between the range of the maximum and minimum transmission points. In general, the MZM was optimally biased at
. For mixing, the MZM must be worked in its nonlinearity at the optimum transmission points.
In dynamic regimes,
Figure 4 shows the −3 dB bandwidth of EOM, which will be used in the simulation and experimental setups to obtain frequency mixing. In this case, the bandwidth was equal to 6.2 GHz for the simulation work and 6 GHz for the experimental one. The electrical IF power
injected into the EOM input, which is the electrical port of the MZM, was 10 dBm for both cases. The MZM has shown a dynamic characteristic similar to a low-pass behavior with a cutoff frequency of 6.2 GHz. This frequency is close to the one of 6 GHz obtained for the experimental work.
The best driving conditions for the two MZMs used in the simulation and experimental setups to obtain frequency up-conversion were chosen by using the IF input electrical power of 10 dBm to drive the electrical port of an EOM. It is worth noting that the cascaded MZMs link consisted in two stages. The first one consisted of the first MZM used for the modulation and was biased at a bias voltage of 6 V in the linear regime; the second one shaped from the second MZM was used for mixing and was biased at 3.6 V in the nonlinear regime at the minimum transmission point. As a result, we used two similar MZMs, which have been biased at different regimes to build a cascaded MZMs link.
3. Frequency Mixing Conditions
Figure 5 shows the configuration used for frequency mixing of an optical signal carrying the QPSK data signal using the direct modulation by the first MZM (MZM1). The optical signal was generated by a laser diode emitting at 0 dBm optical input power with the wavelength of 1545 nm. This signal was directly modulated by the MZM1, which was driven by an electrical subcarrier at the frequency
= 0.5 GHz with the electrical power of 10 dBm and was biased in its linear regime. Moreover, the second MZM (MZM2) was also modulated by a sampling signal at the wavelength of 1550 nm, driven by optical pulses after being photo-detected and amplified, at the sampling frequency
= 7.8 GHz, with an electrical power of 10 dBm and was biased at the minimum transmission point. The mixed signal at the MZM2 output was photo-detected using a 100 GHz bandwidth photodiode (PD) [
18,
19,
20], the responsivity of which was 0.85 A/W. The PD was followed by a low noise amplifier (LNA) of 33 dB gain used to amplify the up-converted signal before being displayed on an electrical spectrum analyzer (ESA).
In order to originate QPSK data at
= 0.5 GHz, we used a generation and detection module at the electrical port of the MZM1, as displayed in
Figure 5. The modulated optical carrier injected at the MZM2 input was driven by an electrical carrier carrying QPSK data at
= 0.5 GHz for frequency up-conversion. At the MZM2 output, a BER_EL-M-QAM module was used to digitalize and demodulate the QPSK data after the mixing, the photo-detection, and the amplification modules. The error vector magnitude (EVM) was evaluated using the bit error rate (BER) obtained by the latter module.
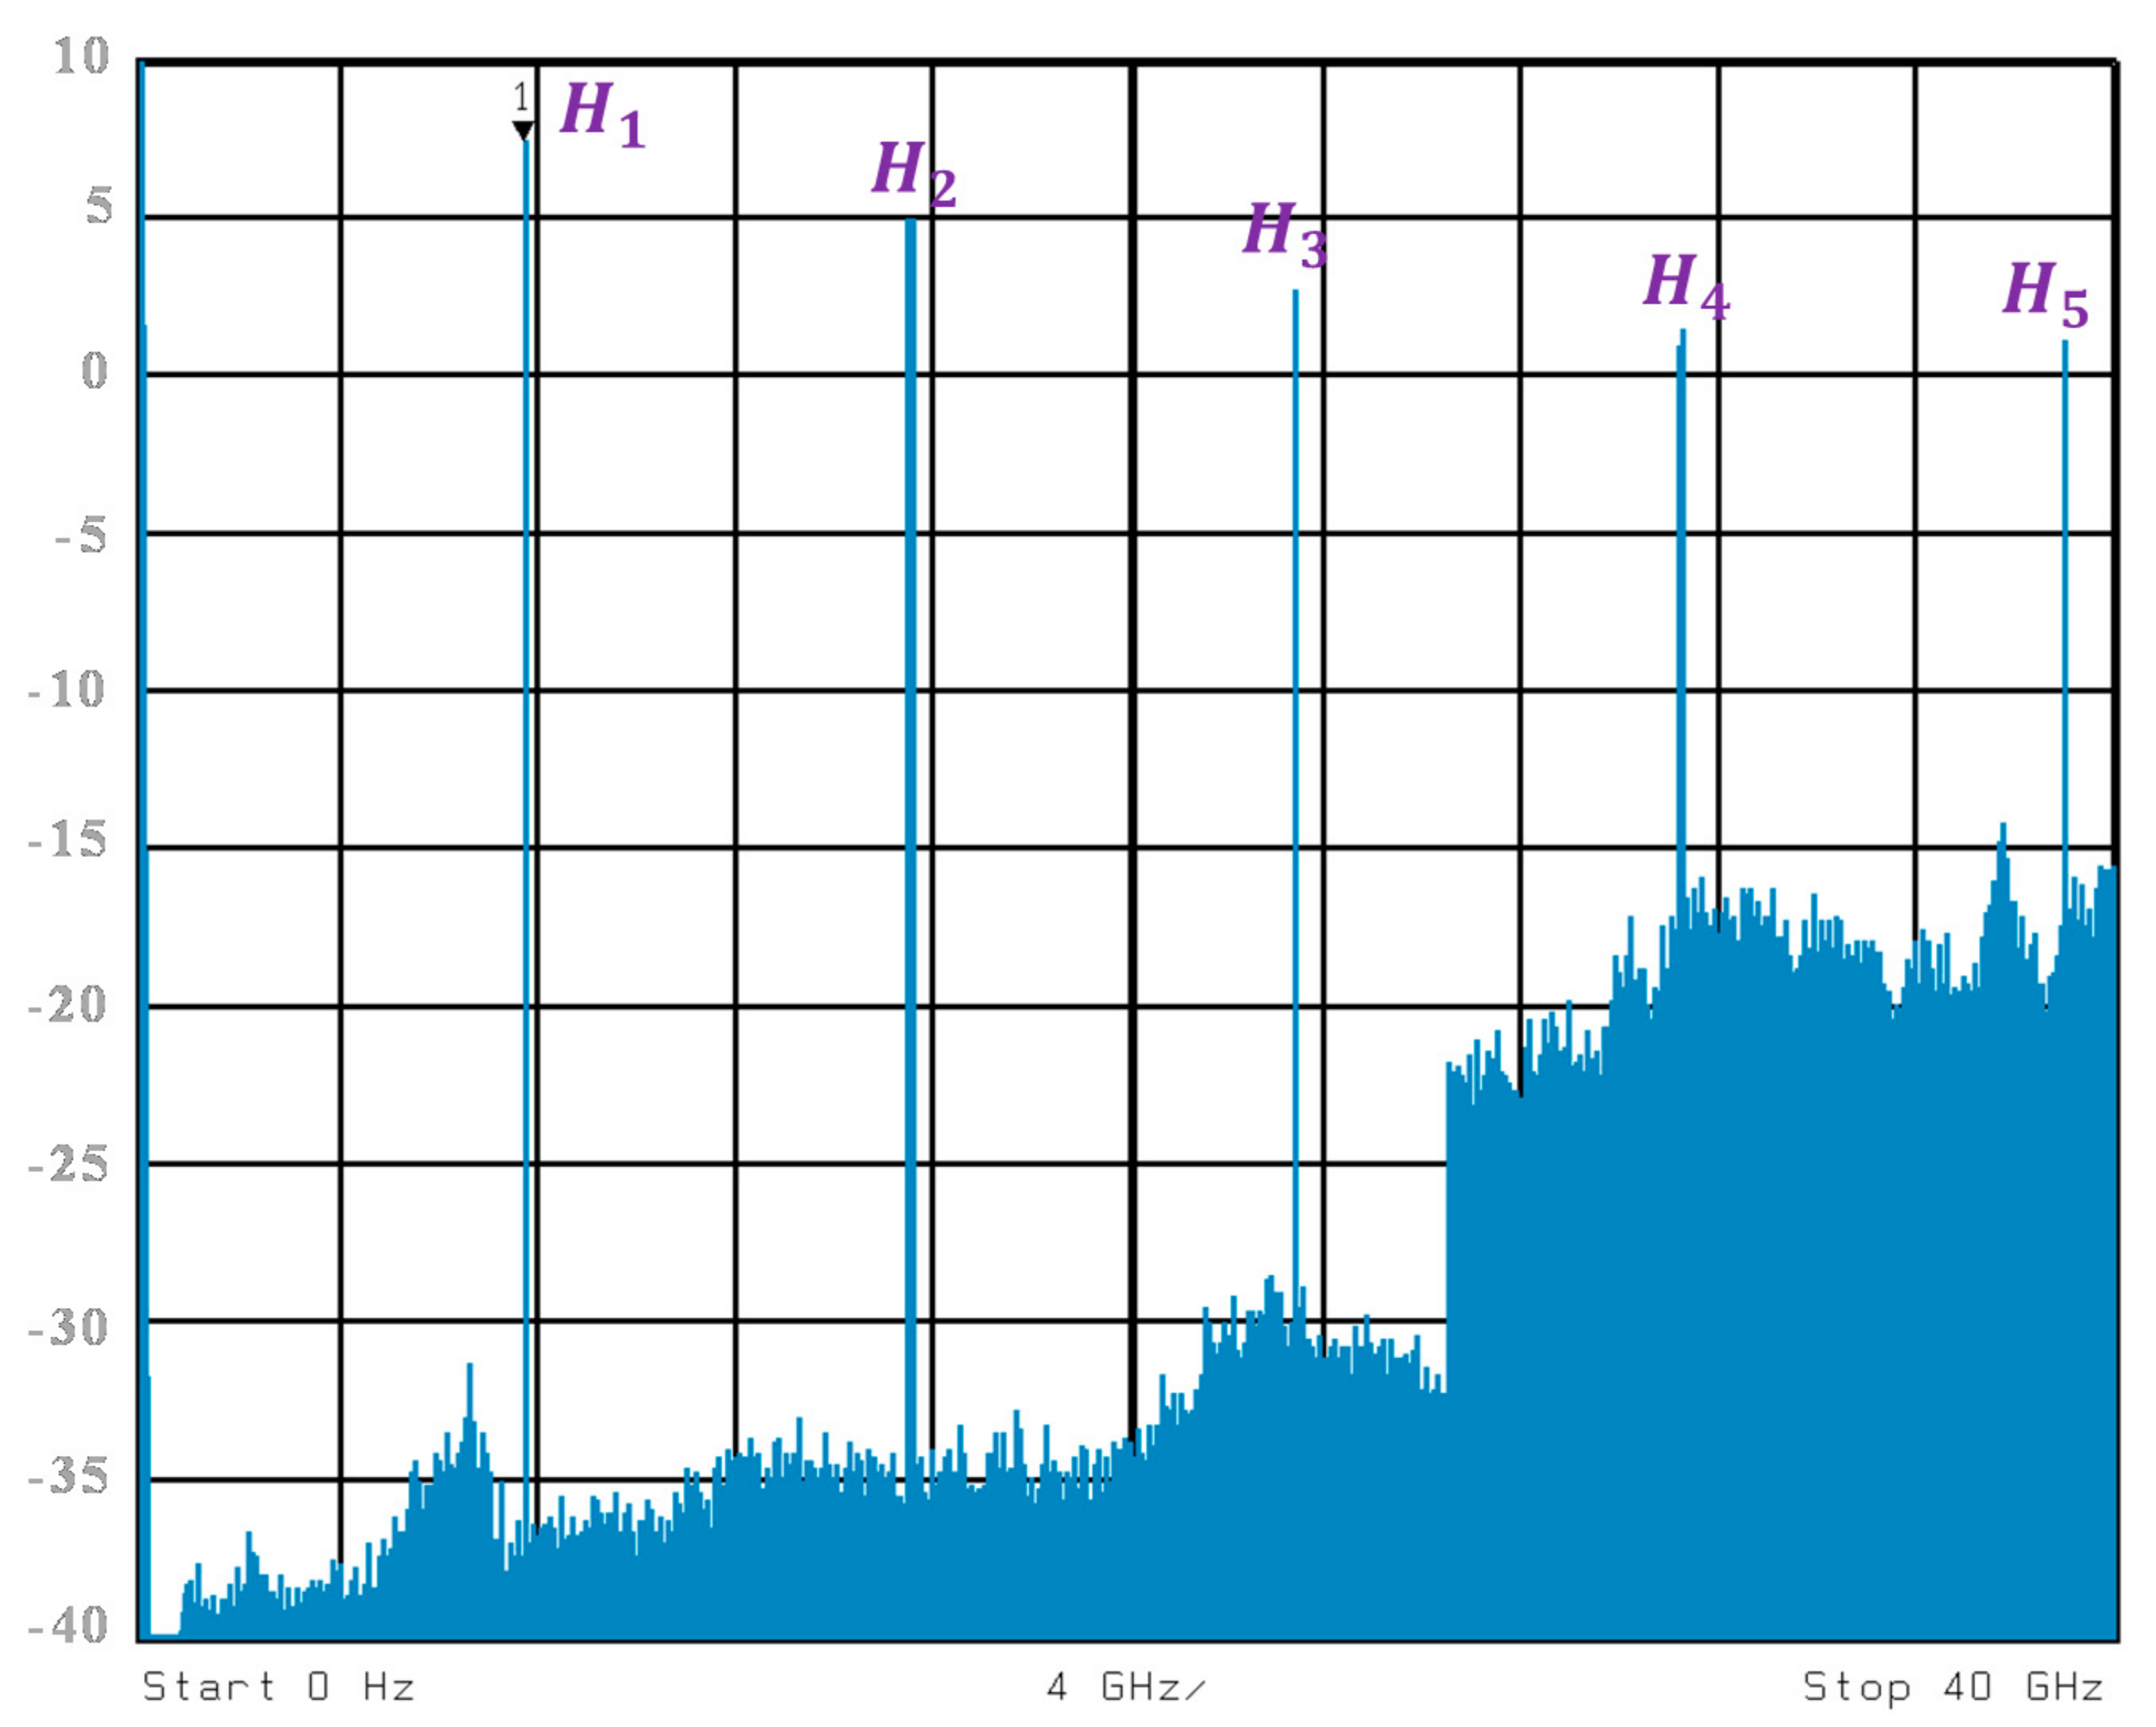
In the experimental setup shown in
Figure 6, the frequency up-conversion operating point based on a cascaded MZMs link was selected to be similar for both architectures in order to ensure a fair comparison between them. An optical pulse source (OPS) driven by an RF generator at a frequency of
= 7.8 GHz is an active mode-locked laser (Pritel model UOC-E-05-20), which provides an optical pulse train of 10 ps full-width at half-maximum pulses. This source generated the sampling signal injected at the electrical port of MZM2 after the photodetection and amplification. The electrical spectrum of the OPS is shown in
Figure 7. The harmonics at frequencies
are denoted by
, where
is an integer. The electrical power of the harmonics of the sampling signal measured on an ESA decreased with the frequency. The difference between the power of the fifth harmonic
of the sampling signal at the frequency of 39 GHz and the power of the first one
at 7.8 GHz of the OPS was about 7 dB.
The IF signal was produced by a CW laser source that was intensity-modulated by the MZM1, which is driven by an arbitrary waveform generator (AWG) at = 0.5 GHz. The wavelength of the optical band-pass filter (OBPF) placed at the EOM2 output was tuned at 1545 nm to select the sampled signal produced by the cascaded MZMs link. The OBPF bandwidth was chosen to be 0.7 nm for the 39.5 GHz up-conversion for the real measurements and 78.5 GHz for simulations. Then, the filtered optical signal was subsequently photo-detected by a PD. Then, the electrical output signal was amplified by a 33 dB low noise amplifier (LNA). The QPSK signal was generated by an AWG at the electrical port of MZM1. The analysis of the QPSK up-converted signal at the MZM2 output was digitalized by a real-time digital sampling oscilloscope (DSO), after which vector signal analyzer (VSA) software was used to demodulate the QPSK data.
4. Conversion Efficiency of a Cascaded MZMs Link
Virtual Photonics Inc. (VPI) Transmission Maker was used to simulate the frequency mixing based on a cascaded MZMs link by using a sampling technique. The optical carrier injected at the MZM1 input was intensity-modulated by a sine wave signal at = 0.5 GHz for both architectures. The mean optical power of this signal was dBm. The electrical power of the corresponding photo-detected signals at the MZM1 input was 22.5 dBm. The optical power of the sampling signal was adjusted to be 1 dBm. Its electrical spectrum had harmonics at multiple sampling frequencies ()
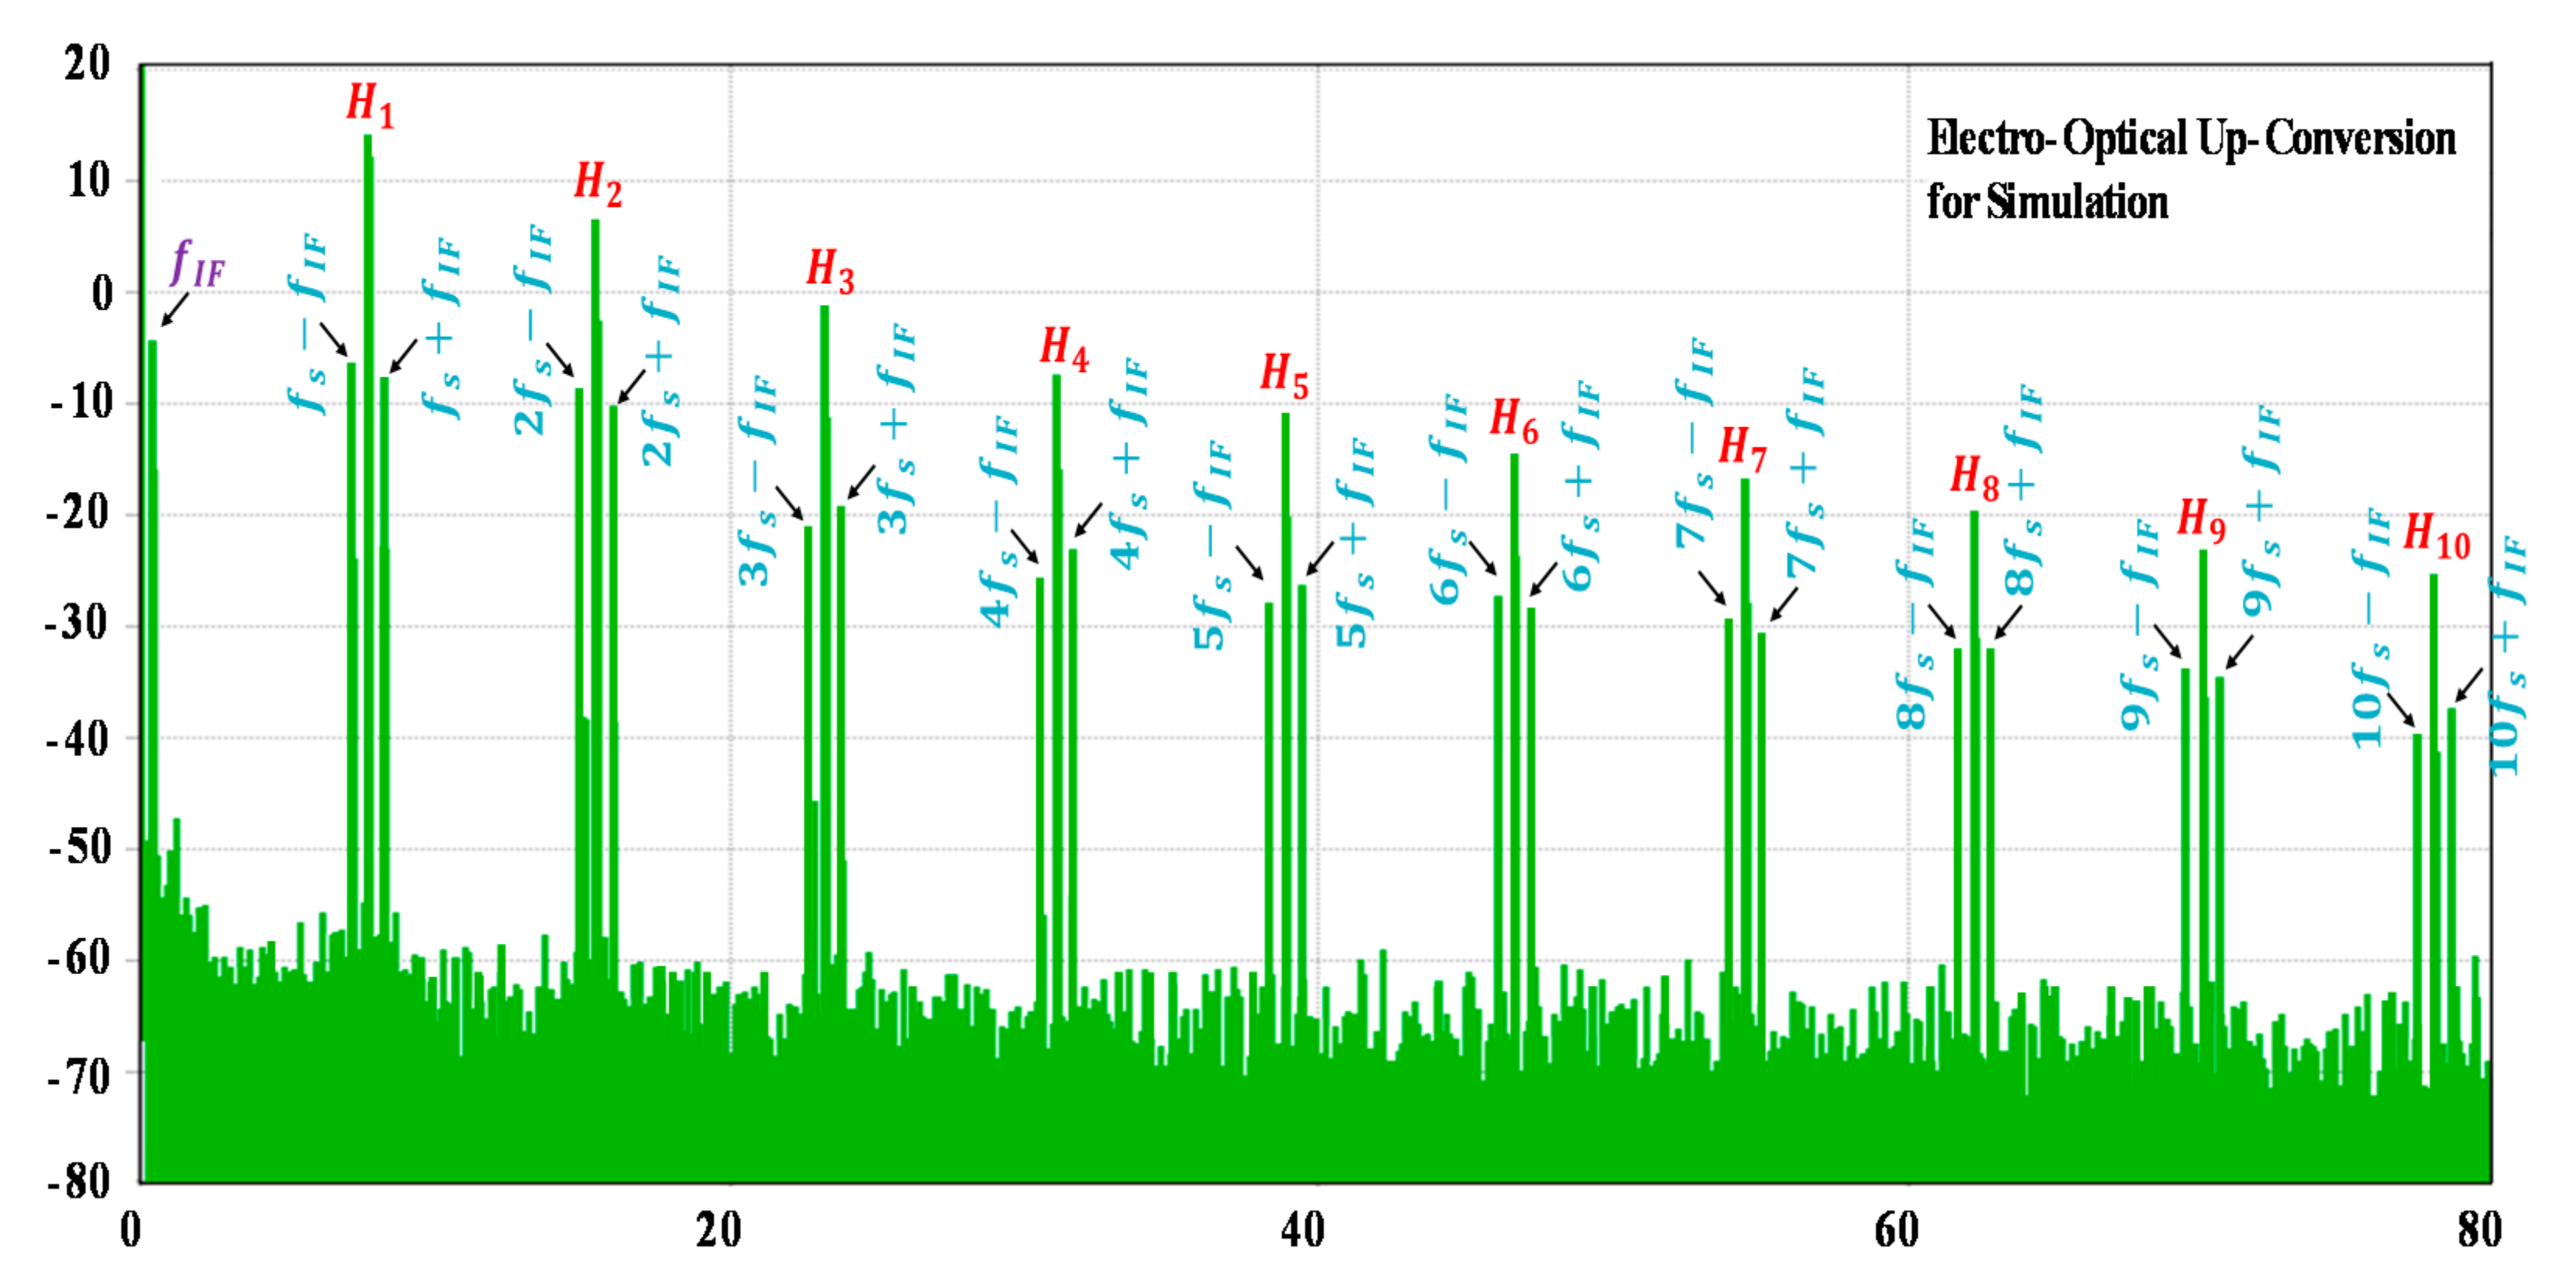
In order to validate the sampling principle of the up-conversion process based on a cascaded MZMs link, the electrical spectrum of the obtained sampled signal that represents the electrical power in dBm as a function of the mixing frequency in GHz at the EOM2 output is seen in
Figure 8.
Figure 8 shows that the IF signal had been up-converted at mixing frequencies
. The harmonics power of the sampling signal declines with the frequency because of the MZM frequency response. The disparity between the tenth and first harmonics was about 35 dB. Besides, the up-converted signal had a power level of
35 dBm at
related to the tenth harmonic of the sampling signal. As a result, the highest frequency range was up to 78.5 GHz for up-conversion.
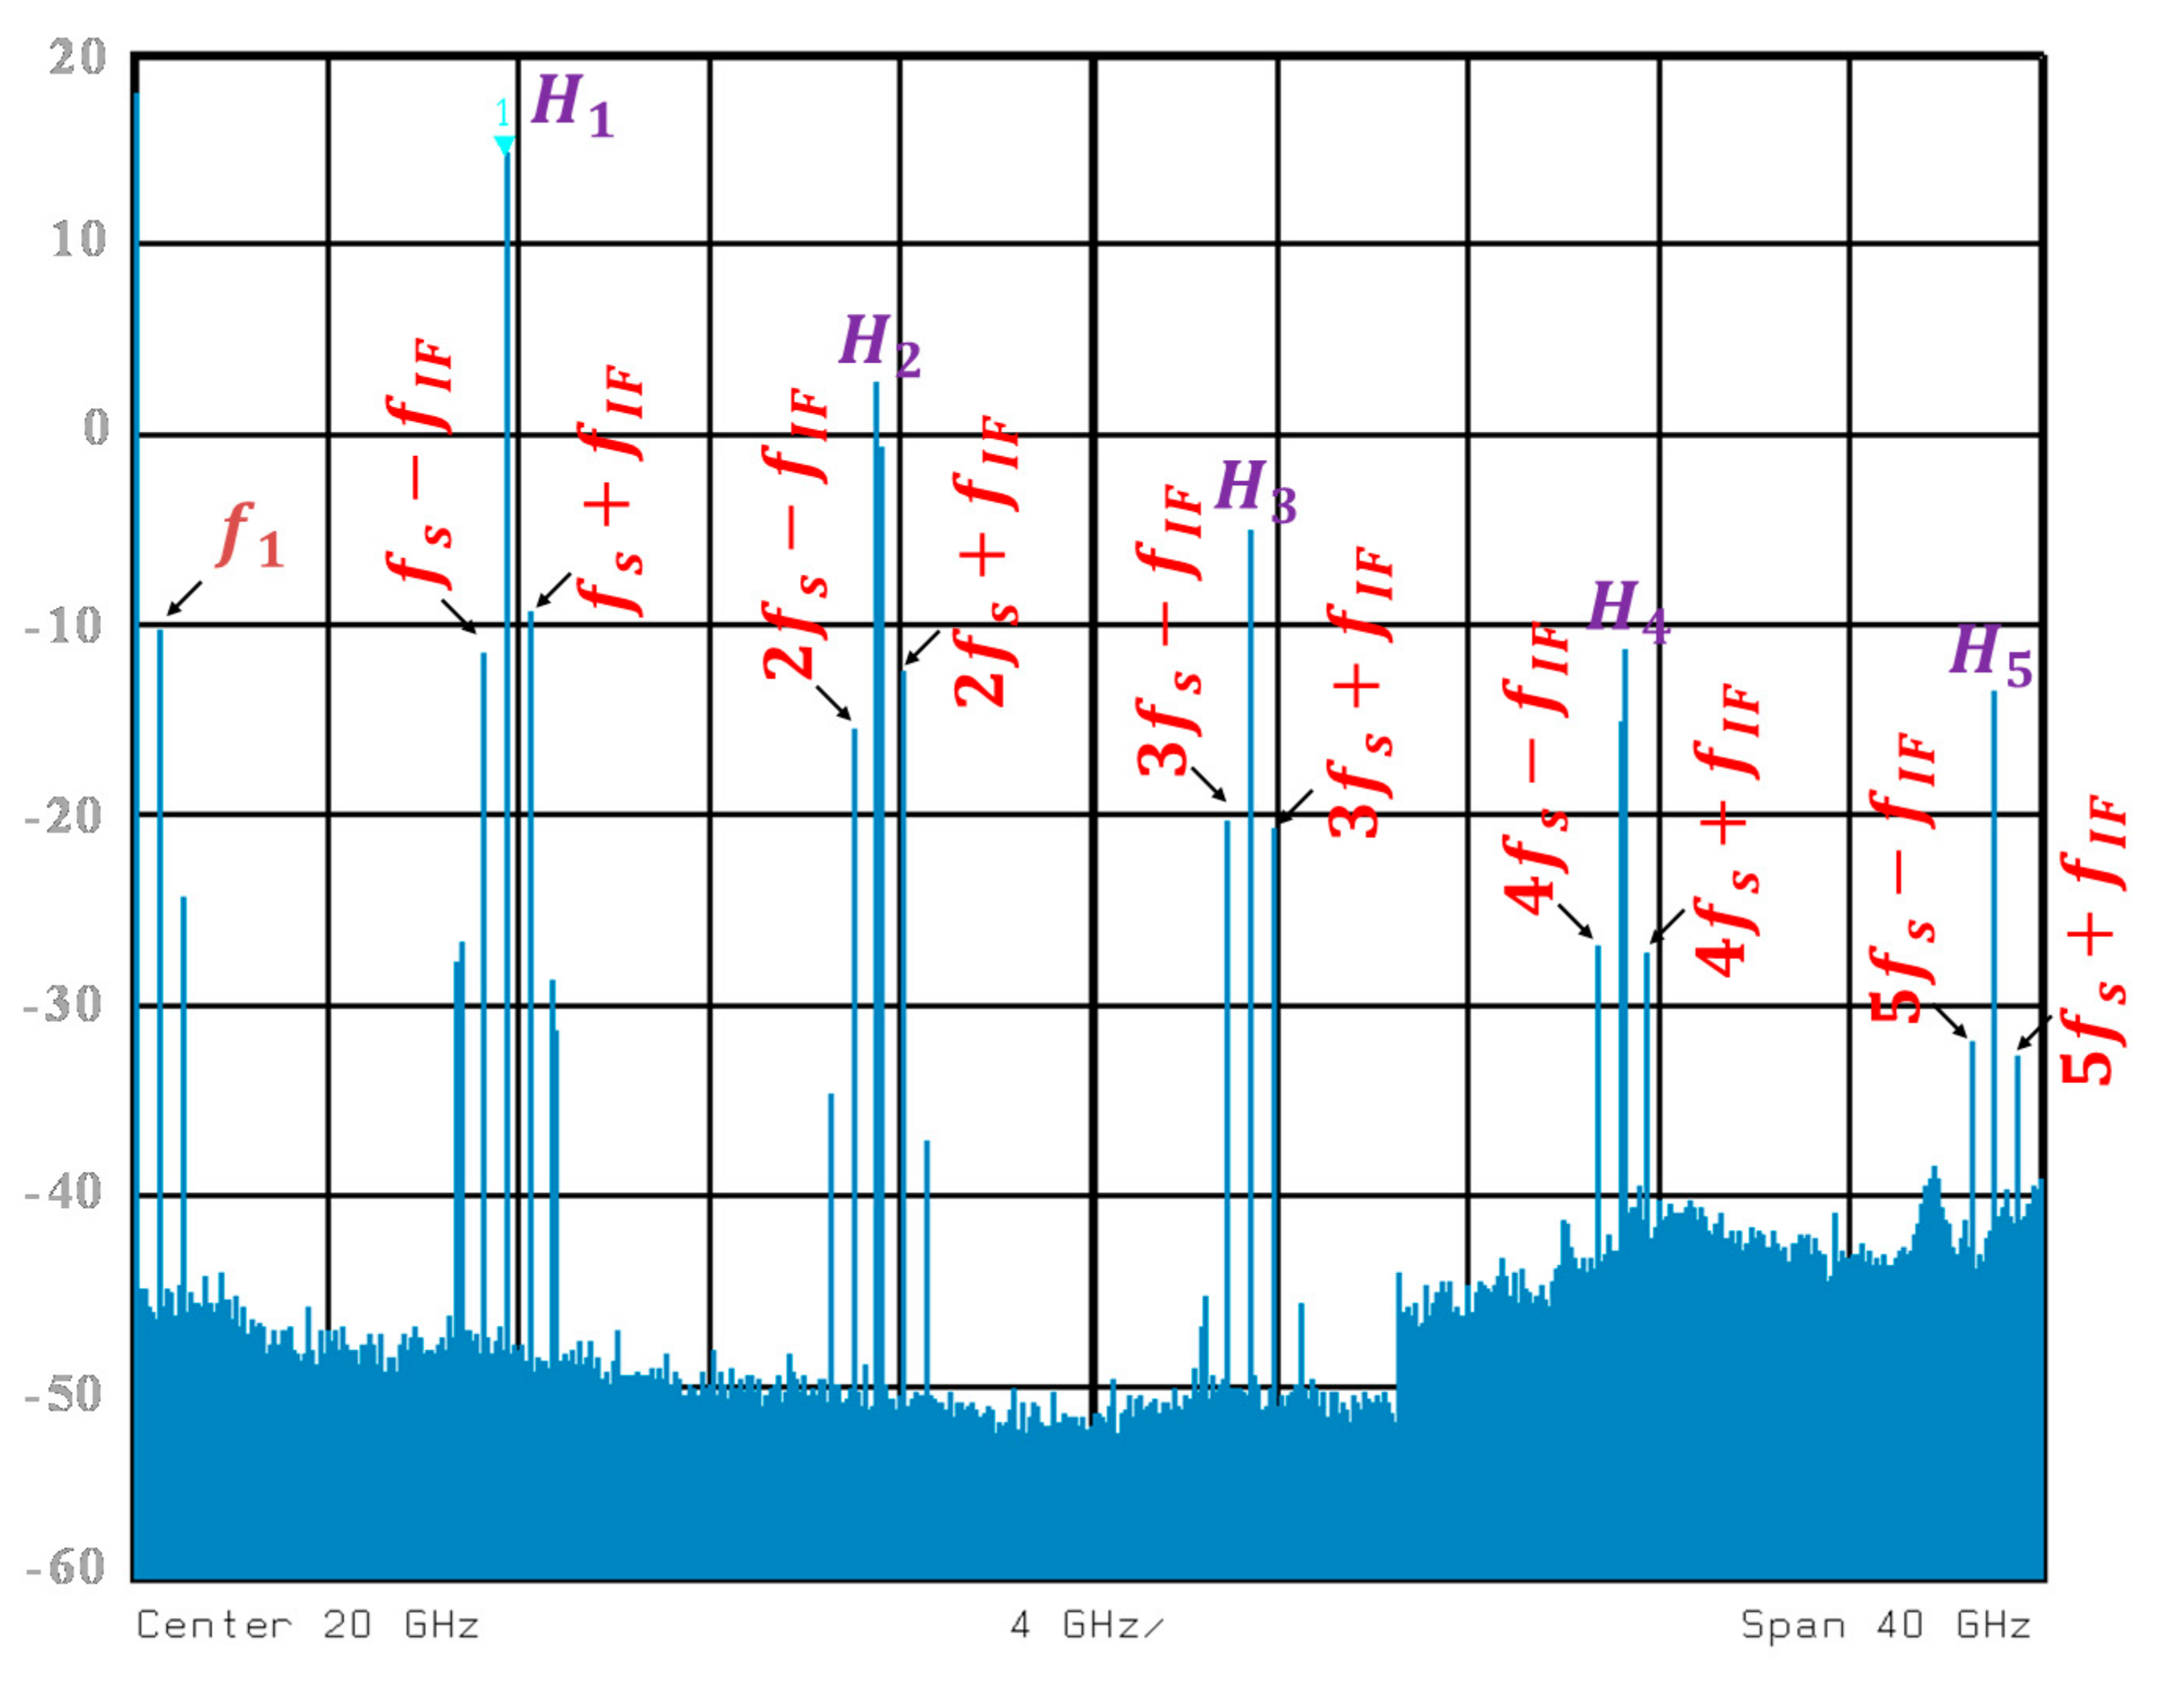
On the other hand, the electrical spectrum was also obtained at the EOM2 output for the experimental work, as displayed in
Figure 9. The frequency range was limited to 39.5 GHz due to limited bandwidth of the used ESA in the actual measurements. In order to match with the simulation work, the first five harmonics of the sampling signal, as well as the replicas of the mixed signal, were taken into account. Hence, the degradation of the replicas of the mixed signals was almost the same as the one done for simulations. In jointly situations, the mixed signals follow the regression of the harmonics of the sampling signal.
To describe the efficiency of the frequency up-conversion process, it is convenient to define the conversion gain as the ratio of the electrical power of the up-converted signals at mixing frequencies
to the one of an input IF signal computed at
. The up-conversion gain was obtained at different mixing frequencies
, where
was varied from 1 to 10, as plotted in
Figure 10. These target frequencies range from
= 8.3 GHz to
= 78.5 GHz for simulations, while they span from
= 8.3 GHz to
= 39.5 GHz for real measurements due to the limitation of the bandwidth of the ESA.
In our simulations, the conversion gain had a maximum value of 17.5 dB at = 8.3 GHz related to the first harmonic, , of the sampling signal. It reached 4.5 dB at = 39.5 GHz related to the fifth harmonic, . Then, this value attenuates 30 dB at = 78.5 GHz related to the tenth harmonic, compared to the first harmonic, . On the other hand, the experimental conversion gain downgrades around 1.5 dB over the entire mixing frequencies in comparison with the simulation work. The results are approximately the same and this degradation of 1.5 dB is due to the fluctuation of the up-converted signal during the measurements and the losses of the single mode fiber (SMF).
The conversion gains are influenced by the EOM frequency response and the attenuation of the harmonics
of the sampling signal with
. Positive conversion gains are achieved at the lowest mixing frequencies. Frequency up-conversion results based on a cascaded MZMs link by an electro-optical sampling have higher conversion gains compared to previous results based on the cascaded MZMs link without electro-optical sampling [
12,
21].
5. Frequency Conversion of QPSK Data
Frequency conversion of QPSK or 4-QAM (quadrature amplitude modulation) data carried by the electrical subcarrier at the electrical port of the MZM1 is evaluated for different bit rates (BRs). A generation and detection module or an AWG generates QPSK data at the central frequency of 0.5 GHz for up-conversion in simulations and real-world experiments, respectively. The quality of the frequency mixing system is evaluated through the EVM of the received signals [
22]. The BER_El-M-QAM module, or DSO and VSA software at the MZM2 output, is used to demodulate the up-converted signals. For simulation work, the same module is also used to assess the EVM of the received constellation. Hence, EVM values are computed from the BER. Besides, the real-time DSO is utilized to digitalize the received signal and the VSA software is used to obtain the EVM measurements. The passable limit is obtained when the BER reaches 0.0038, which guarantees an almost error free fulfillment after executing forward error correction (FEC) methods [
23]. The EVM limit of the QPSK data is 17.5% [
24,
25].
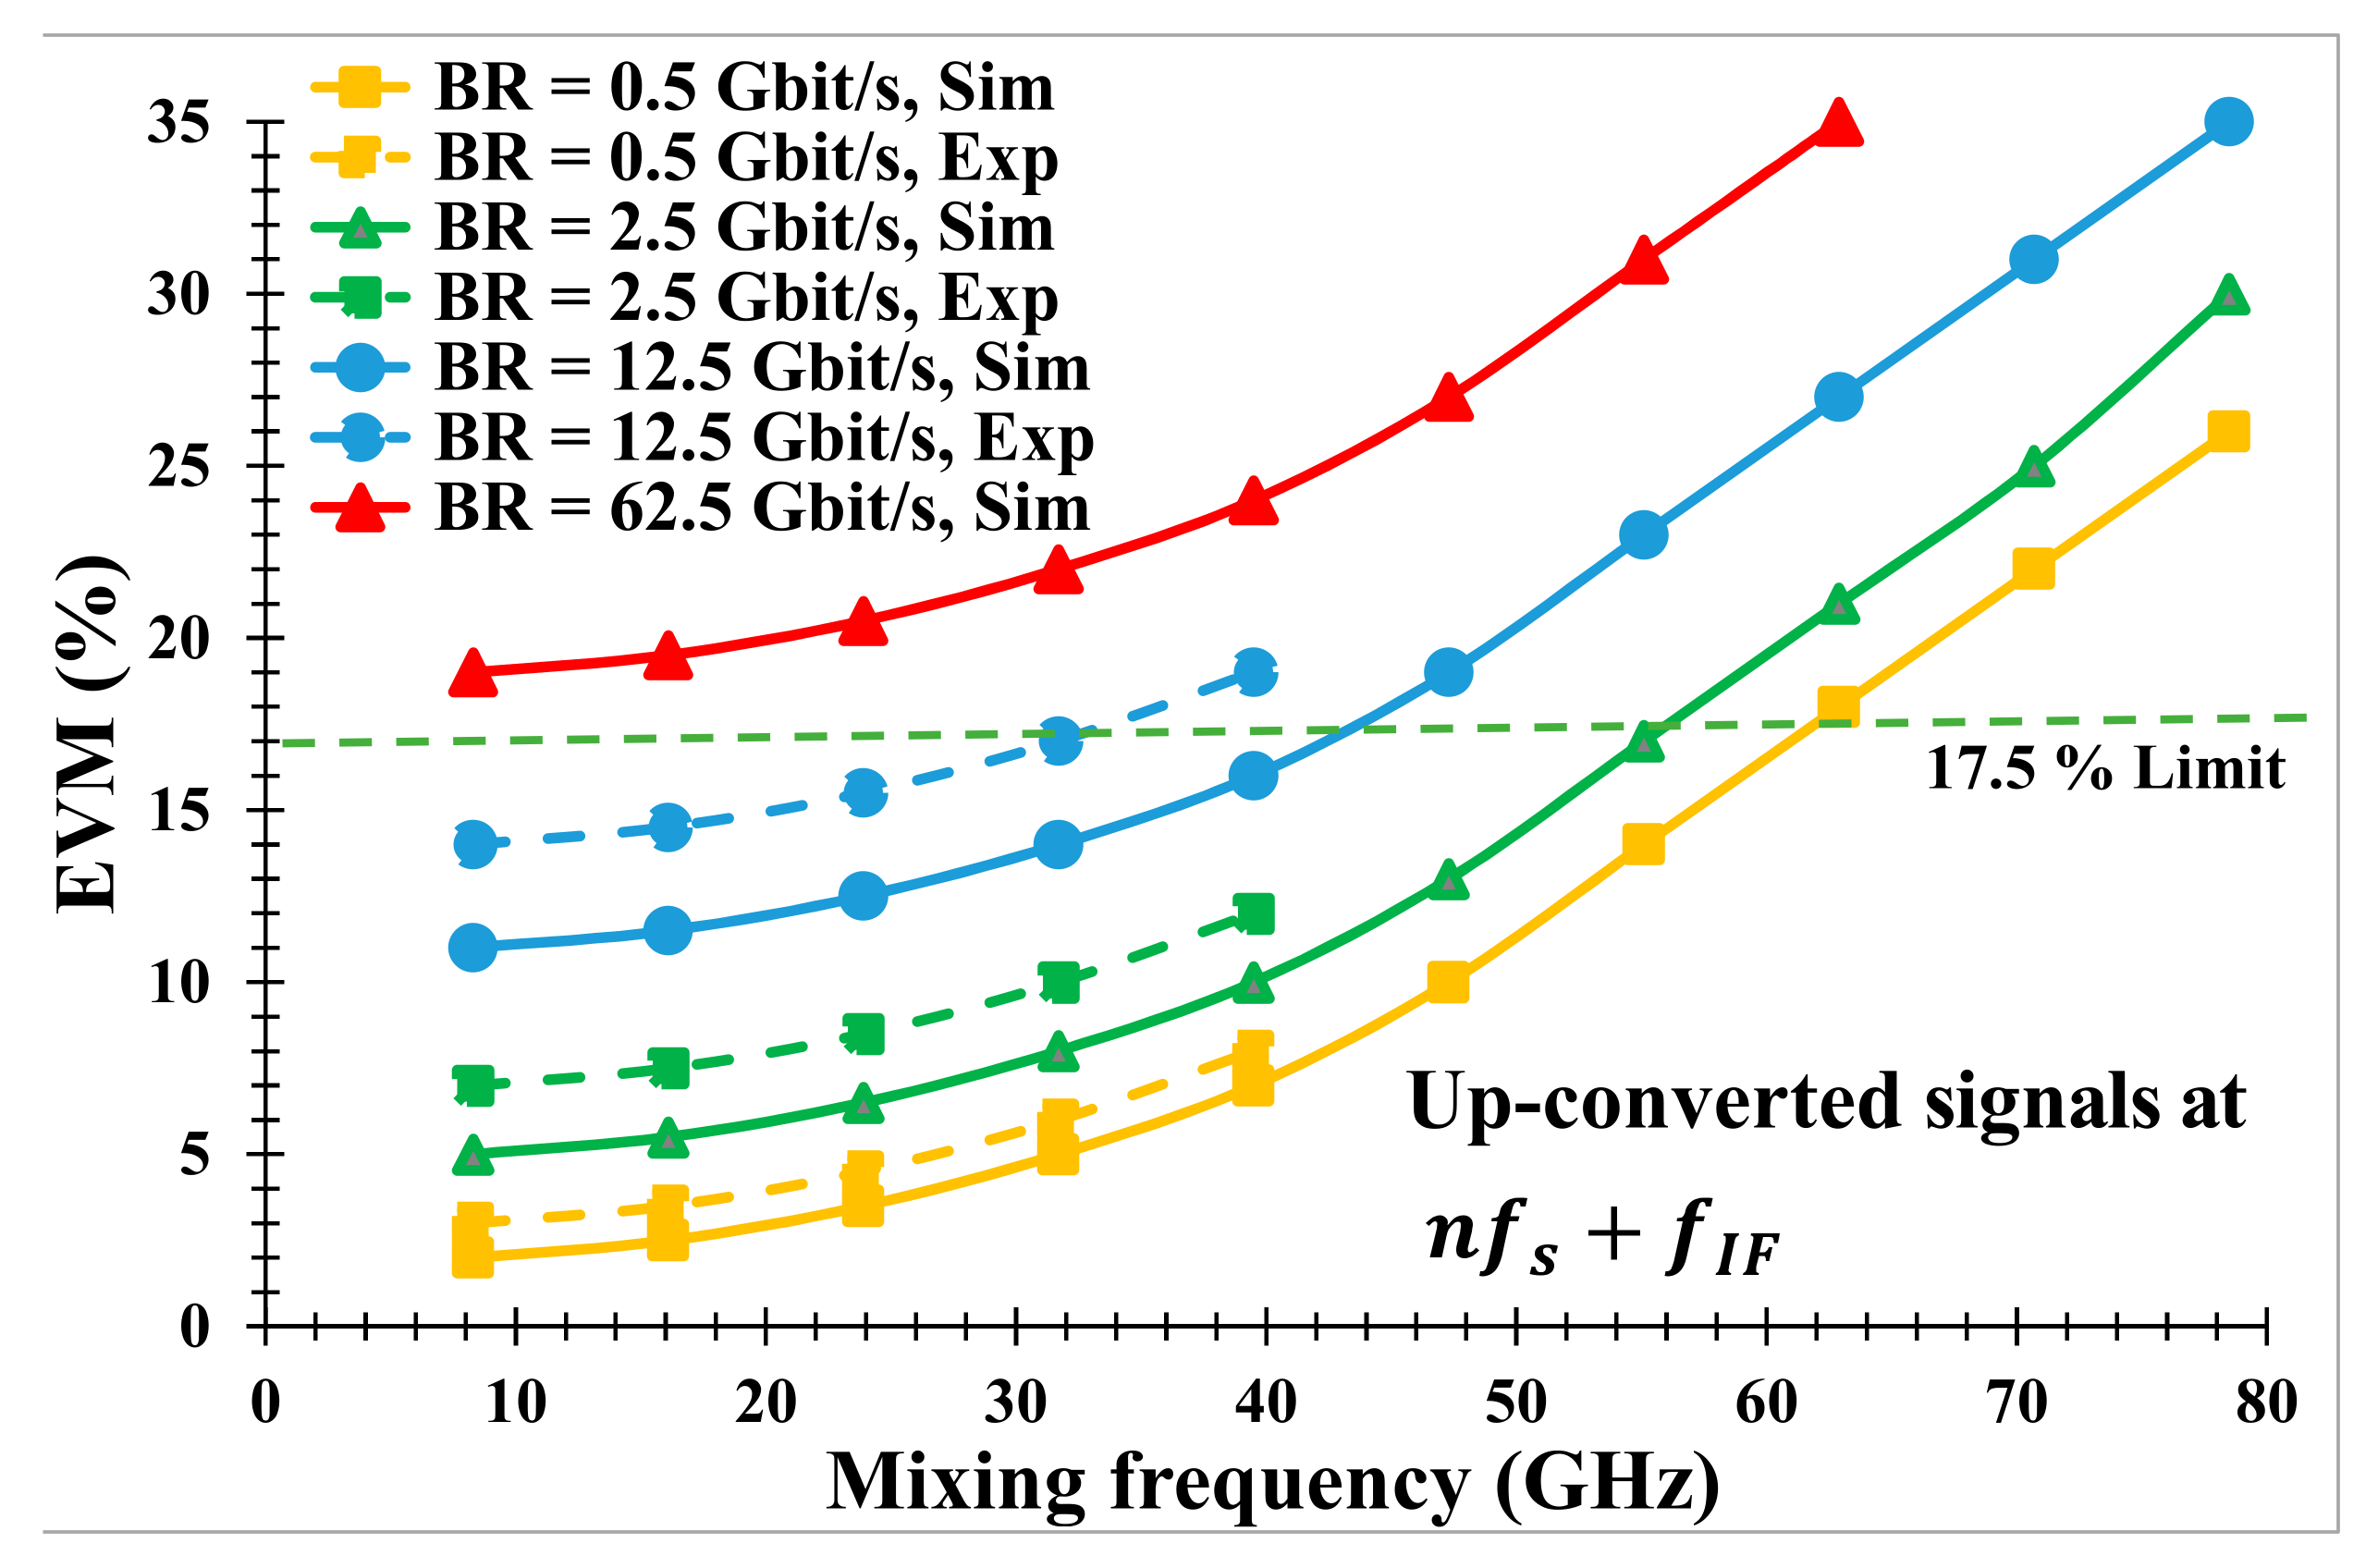
As displayed in
Figure 11, the EVM of the up-converted QPSK signals increases with the mixing frequency for both simulation and experimental setups. It also augments with the BR. The EVM raises from 11% at
= 8.3 GHz attached to the first harmonic of the sampling signal to 35% at
= 78.5 GHz relevant to the tenth harmonic with BR
12.5 Gbit/s for the simulation work. In the contrary, the EVM experimentally downgrades from 14% at
= 8.3 GHz pertinent to
to 19% at
= 78.5 GHz relevant to the fifth harmonic
with the same BR.
The BR can attain up to 62.5 Gbit/s, especially for the simulation work. However, the EVM over the entire mixing frequencies at the highest BR is above the EVM limit by 17.5%. The EVM at the higher mixing frequency degrades more than the one at the lower mixing frequency due to the MZM frequency response. For experimental measurements, the EVM values degrade more than the ones obtained through the VPI simulator at higher BRs due to a variety of noise, which happened at the receiver, especially the thermal and shot noise. For this reason, the experimental EVM becomes noisy at the BR higher than 12.5 Gbit/s.
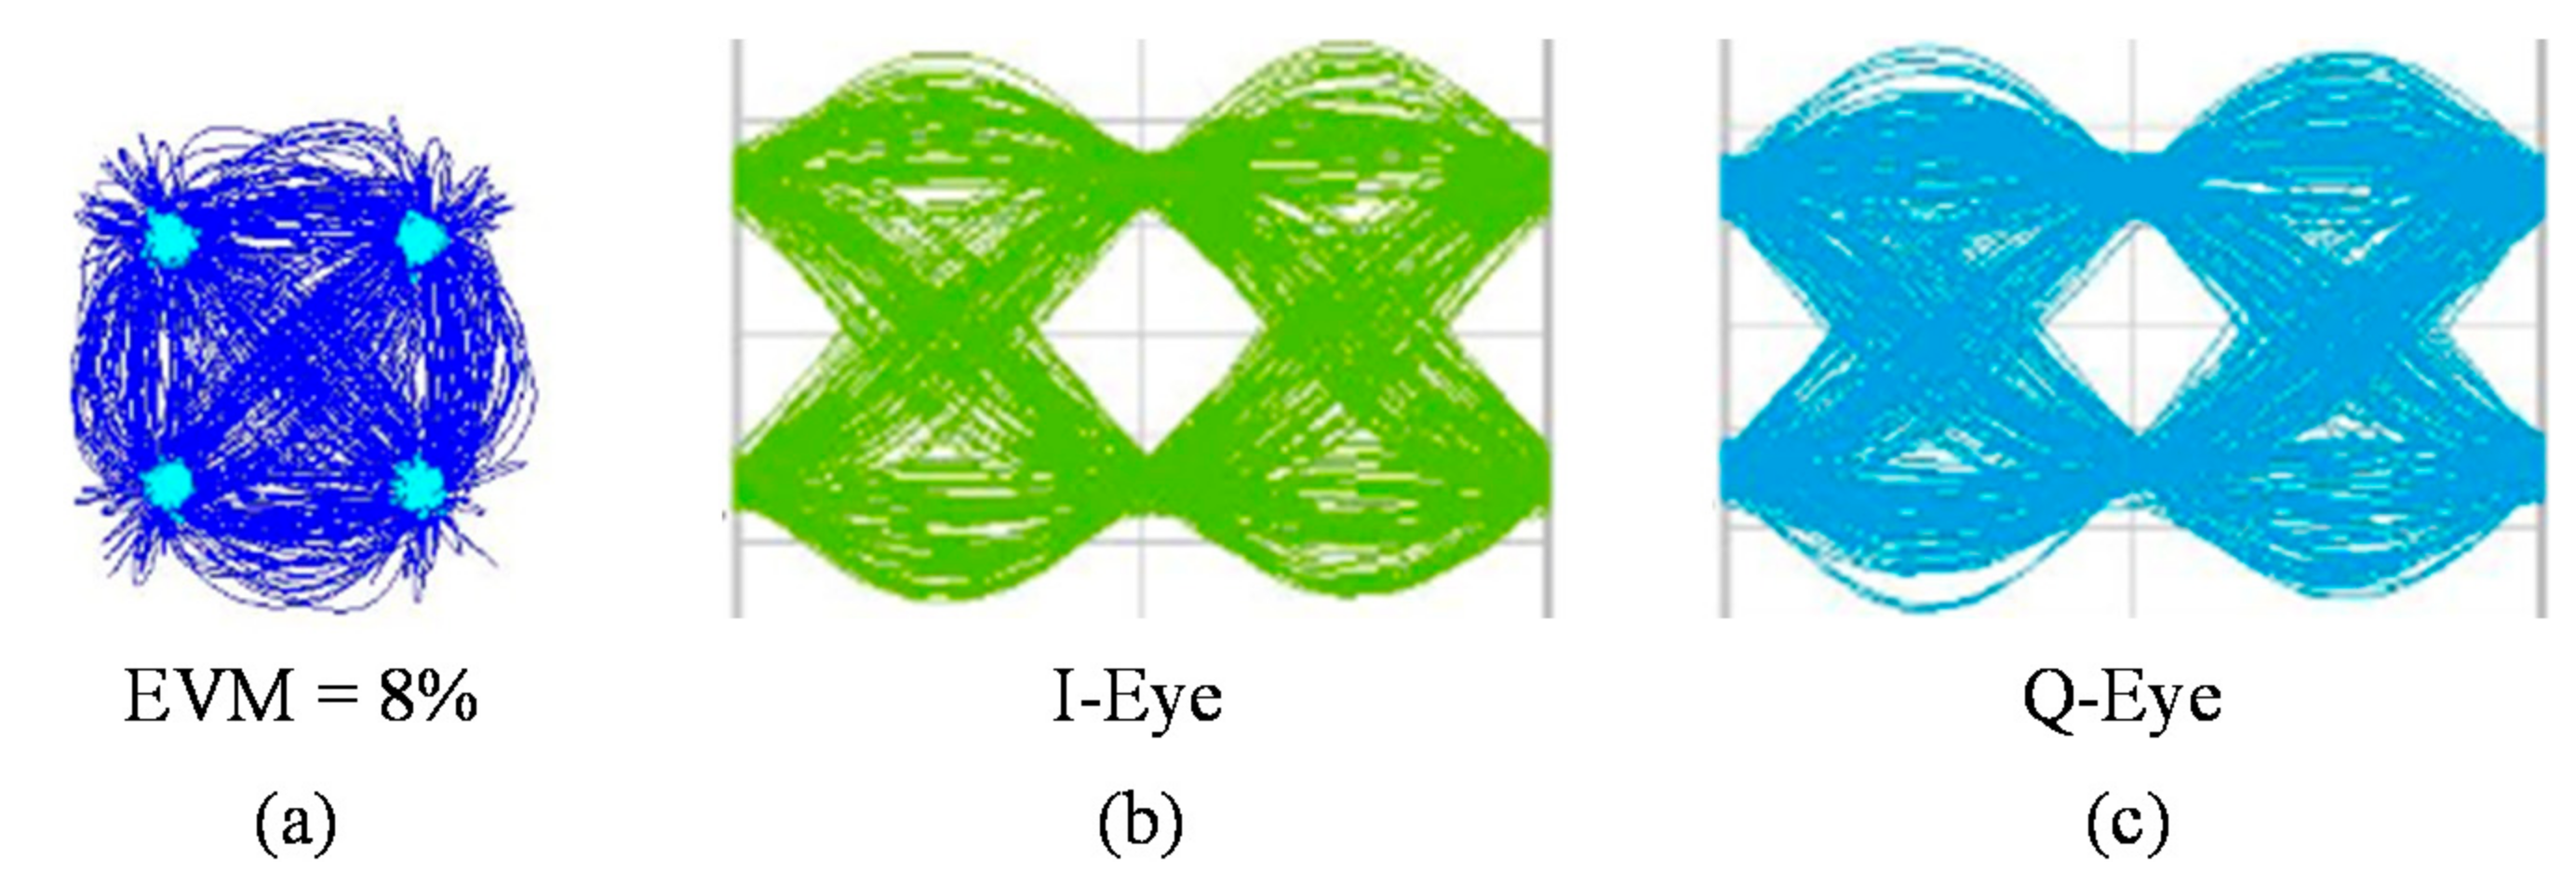
EVM, which is a figure-of-merit, was used in order to study the quality of the electro-optical transmission system based on the cascaded MZMs link, which is used in many applications, such as wireless channel networks and radar systems, due to its simple structure and better performance. The eye diagram for the in phase-quadrature component can be used to assess the quality of the up-conversion system based on the cascaded EOMs link. However, many QPSK up-converted signals are demodulated at different BRs and an eye diagram for each one is obtained. Hence, constellation and eye diagrams of the mixed signal at BR
0.5 Gbit/s at the mixing frequency of 39.5 GHz are presented as shown in
Figure 12. The eye opening corresponds to the opening in the middle, which measures the effect of noise on the signal.


