Abstract
Given that the current ultraviolet (UV) networking model is established in a regular circular area, this article studies the coverage of a UV non-line-of-sight (NLOS) communication network creatively in the arbitrary polygon area. In this paper, the UV communication model and the basic concepts of network coverage are introduced first. Then the influence parameters of the UV node communication radius are studied, and the changes of the communication radius under different work patterns are analyzed. Finally, the coverage of the square target area is simulated under different communication parameters (transmitted power, data rate and node density). The results illustrate that the smaller the transceiver elevation angles are, the better the network coverage performance is. Additionally, we numerically compare the UV network models of polygonal and circular regions, which can be used as a reference for actual networking.
1. Introduction
With the rapid development of communication technology, the communication system applied in the complex electromagnetic environment is gradually developed for the integration of communication and resistance. Traditional wireless communication has been unable to meet the requirements of the complex and changeable electromagnetic environment, and its problems such as low confidentiality and susceptibility to interference are gradually exposed. “Solar blind zone” ultraviolet (UV) communication has excellent characteristics rarely available in other signal sources such as low background light interference, non-line-of-sight (NLOS) scattering communication, strong anti-jamming ability and high confidentiality, showing its potential as a supplement to traditional radio communication means [1]. The integration of UV communication and the Ad hoc network can give full play to their unique advantages. In addition, the distance of UV communication has been greatly expanded with the multi-hop transmission performance of the Ad hoc network. Therefore it has broad application prospects in the field of wireless, secure communication in unmanned aerial vehicle (UAV) terminals. It should be noted that the high-power UV light source can cause some damage to the eyes and skin. Therefore, when it is used, the power of the light source should be strictly controlled according to safety regulations.
As early as the 1960s, the U.S. Navy began to pay attention to UV communication, hoping to realize NLOS scattered light communication [2,3]. Shen et al. proposed three improvement measures for the Monte Carlo method commonly used in UV scattering simulation [4]. In 2019, a UV scattering model applied in both strong and weak turbulence was proposed [5]. Kang et al. took the lead in using a UV source pumped by an electron beam to test and analyze the characteristics of the UV scattering link [6]. In 2020, the bit error rate of the system was reduced by using diversity technology at the receiver end of the UV communication system [7].
The UV network needs to cover the entire target area in order to achieve reliable communication. Vavoula et al. deduced the probability expression of isolated nodes in a circular area for UV network coverage and used a network model based on multi-hop nodes to expand its communication range [8]. The literature [8] simulated and analyzed the influence of transmitted power, node density, data rate and bit error rate on network coverage under OOK and PPM modulation modes but only discusses the working mode of vertical transmission and vertical reception. Zhao et al. took the lead in discussing the impact of various parameters on the performance of the UV network under different working modes, while the connected state under discussion is only a 1-connected network [9].
At present, the studies on the coverage of the UV network are all based on the circular area. In our previous research, the UV network connectivity in the circular area under different working modes also has been studied [10]. However, in reality, most distribution areas of the UV nodes are irregular shapes rather than the standard circle. This article creatively analyzes the UV coverage under the condition that the UV nodes are uniformly distributed in an arbitrary convex polygon area and mathematically discusses the influence of different parameters on network performance. The research on the connectivity of the UV network in an arbitrary polygon region can break the restriction of the regular circular distribution region and provide a higher reference value for practical network construction.
The rest of the paper is organized as follows. The UV communication model and the basic concepts of network coverage are introduced first in Section 2. Then the influence parameters of the UV node communication radius are studied. The mathematical expression of k-connectivity of UV network in an arbitrary convex polygon is derived in Section 3. Section 4 gives the mathematical analysis of the simulation results. The 2-connectivity of the UV nodes evenly distributed in the circular area and the arbitrary convex polygon area is compared, and the reasons for the difference are given. Finally, Section 5 presents a summary of this article.
2. Preliminaries
2.1. UV NLOS Scattering Model
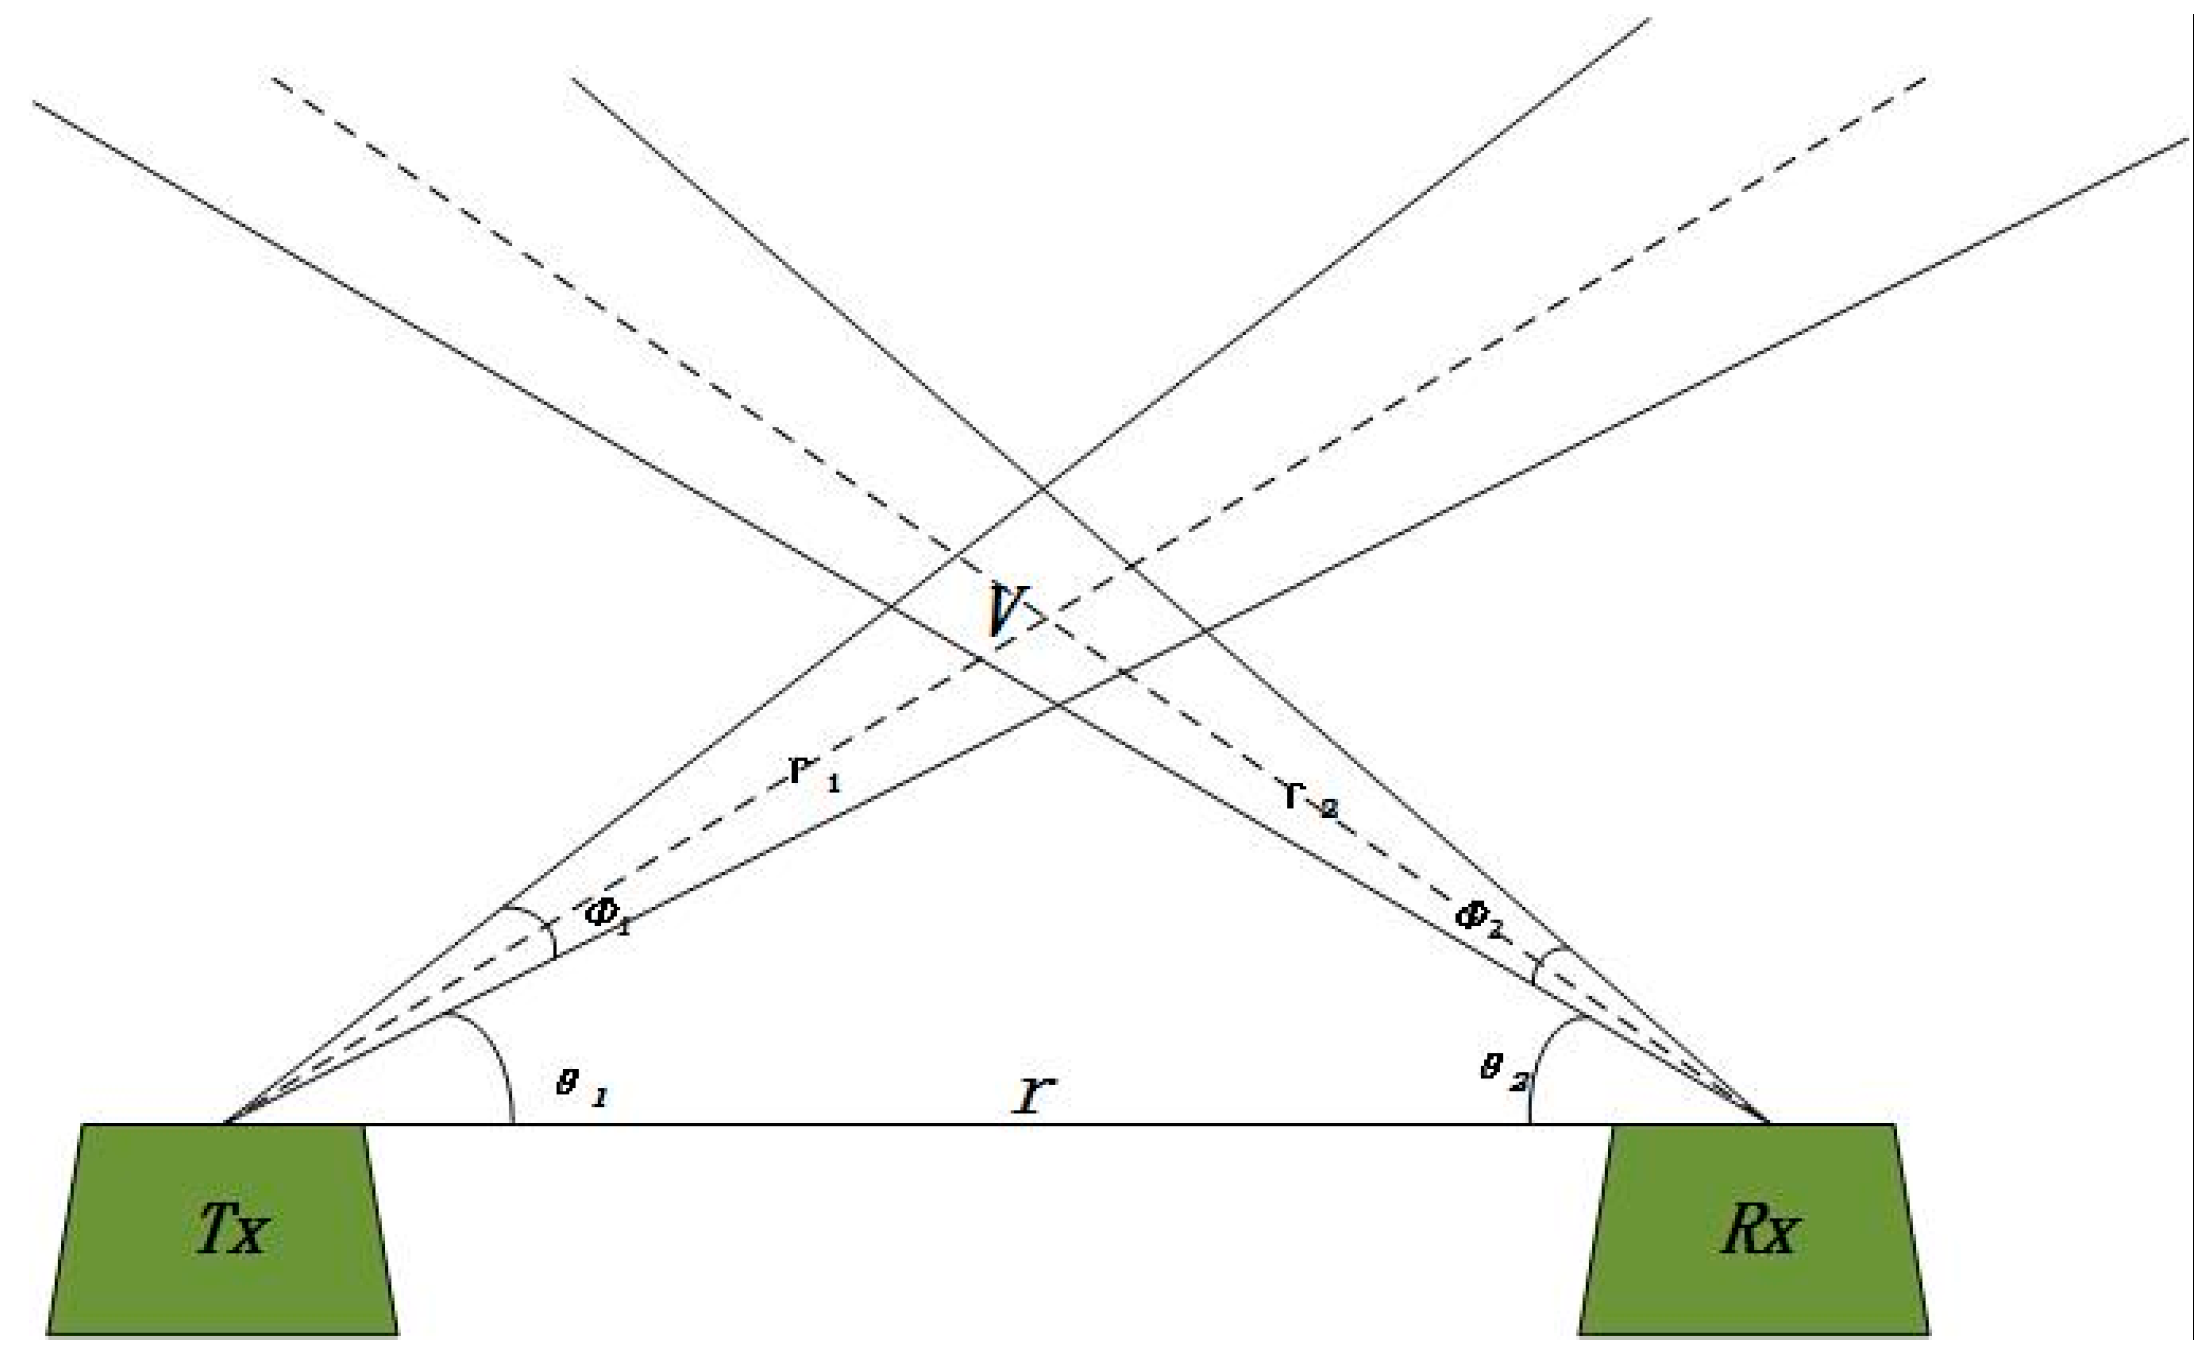
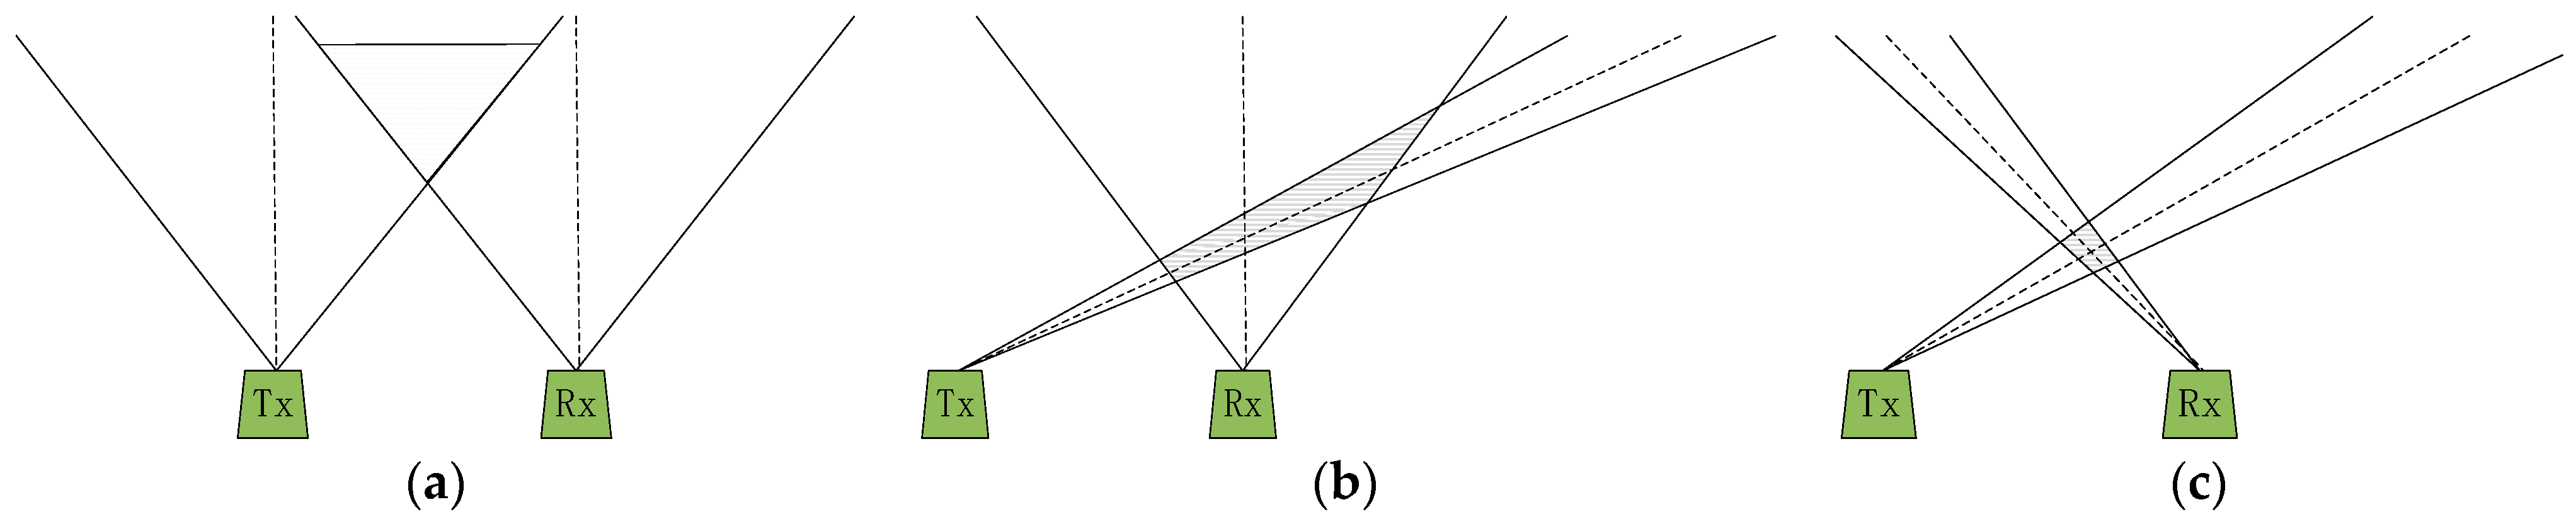
Figure 1 represents the schematic diagram of the UV scattering channel. The UV source at the transmitting end (TX) transmits a light signal into space at a beam divergence angle (Φ1) and a transmitting elevation angle (θ1), and the receiver (RX) receives the signal at the field of view (FOV) angle (Φ2) and the receiving elevation angle (θ2). The transmitting beam and the receiving FOV form an effective scatterer (V) in the overlapping area in the atmosphere. The emitted UV signal reaches the RX after being scattered by V. Thus, the NLOS transmission of the signal is completed. According to the transceiver elevation angles, UV communication can be divided into three work patterns, as shown in Figure 2: NLOS-a, NLOS-b and NLOS-c.

Figure 1.
The UV scattering channel [11].
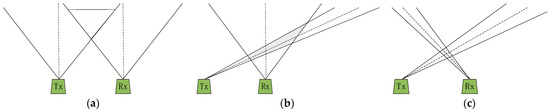
Figure 2.
(a) NLOS-a, (b) NLOS-b, (c) NLOS-c.
2.2. UV Node Communication Radius
The scattering and absorption of gas molecules and aerosol particles in the atmosphere make the UV signal seriously attenuated. After a large number of experimental tests, Chen et al. proposed a path loss model for UV communication [12]. In short-distance communication of hundreds of meters, the simplified expression of path loss is as [12]
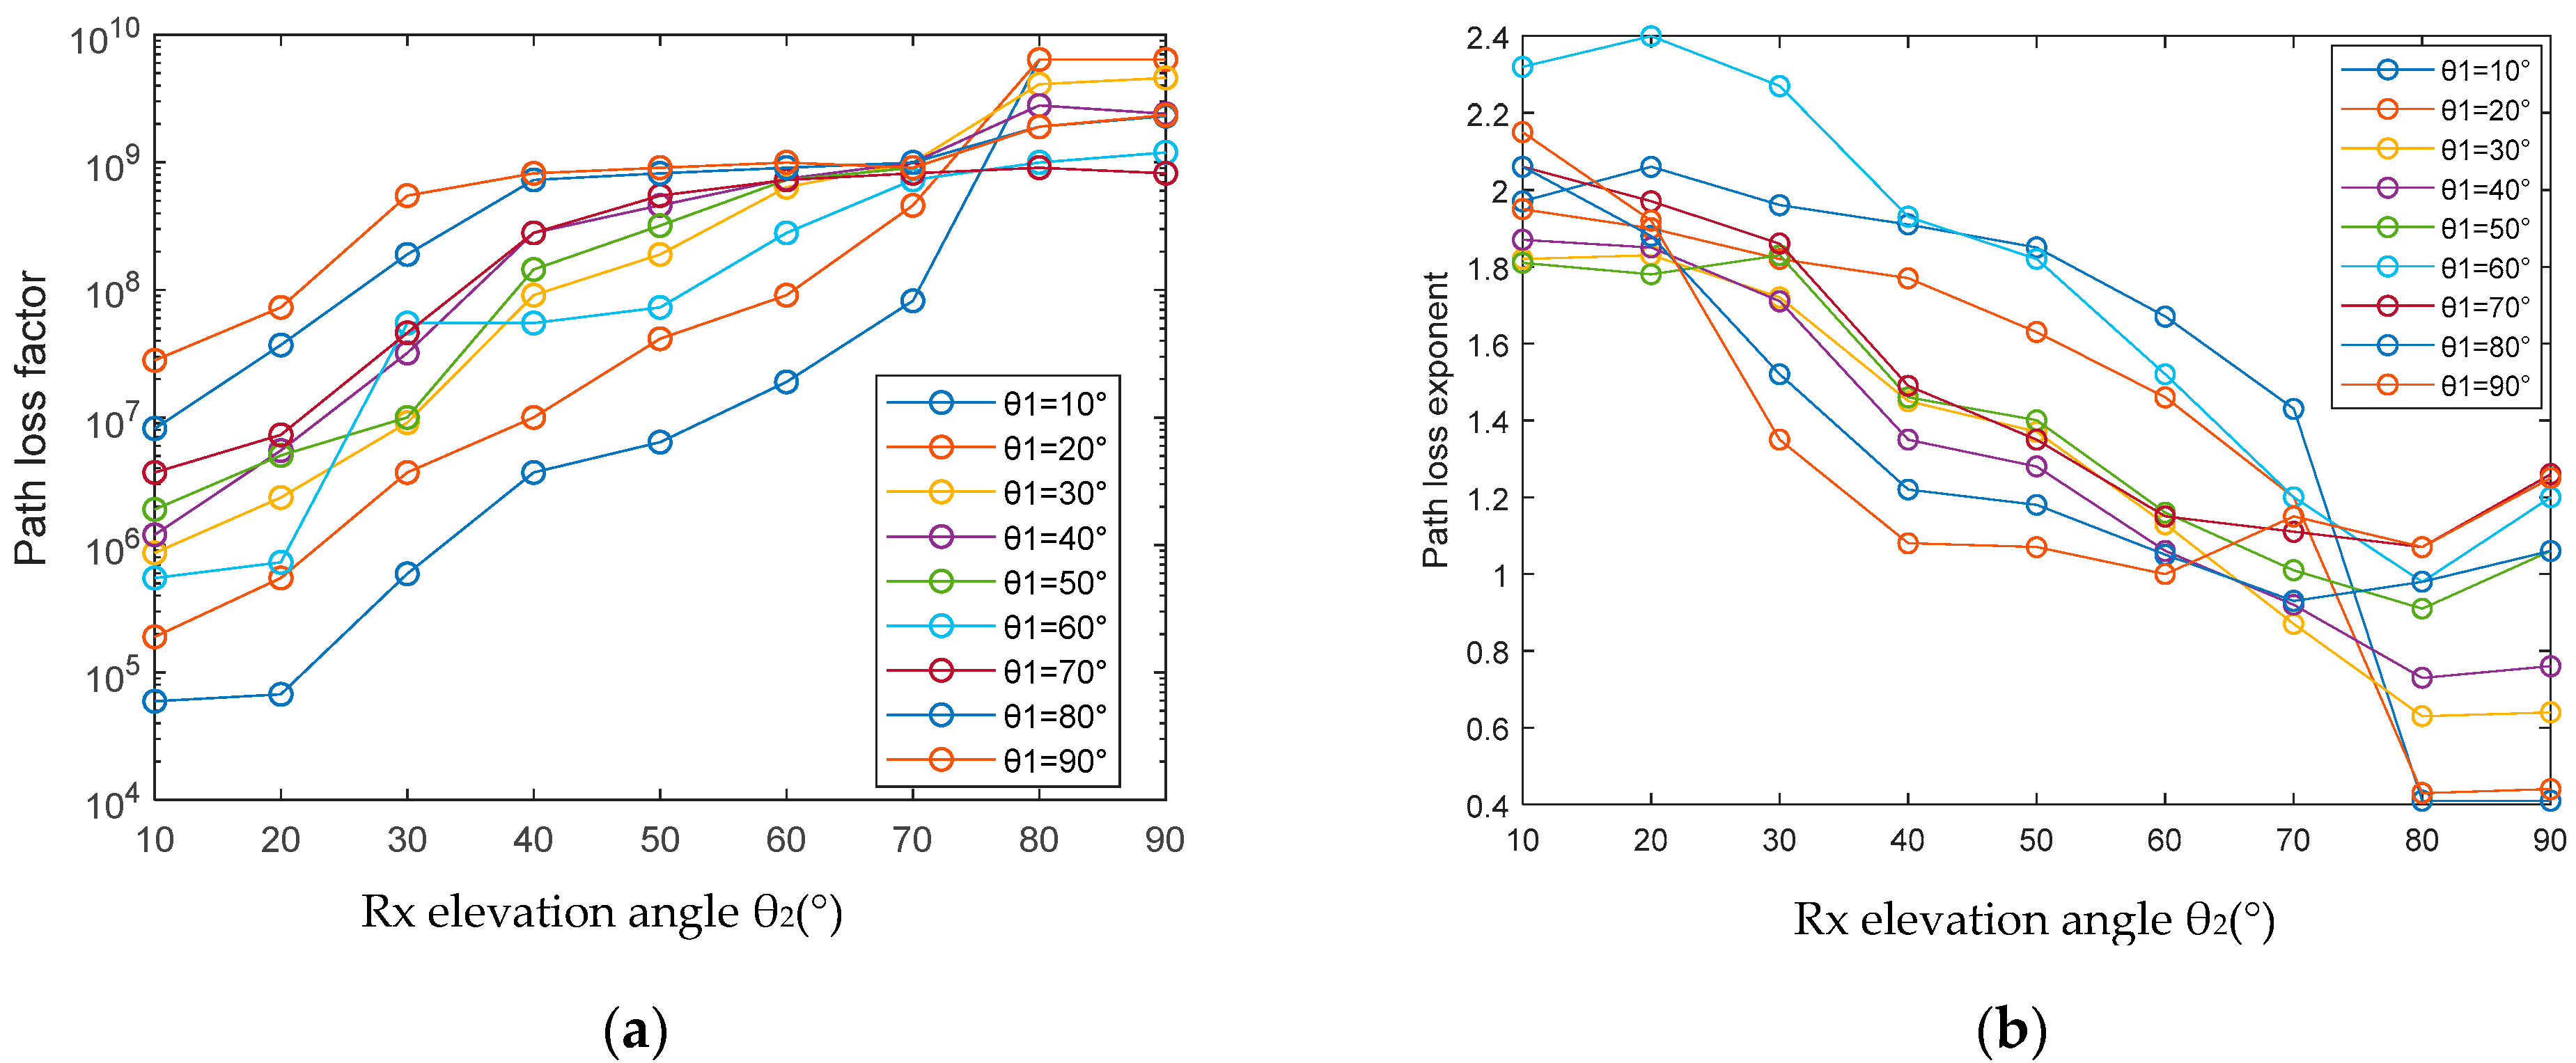
where L is the power attenuation, is the path loss factor, α is the path loss exponent and r is the communication radius. On the basis of Chen, we came to similar experimental conclusions after many Monte Carlo simulation experiments when Φ1 and Φ2 are fixed at 17° and 30°, respectively. Figure 3 shows the experimental results under the conditions of different transmit and receive elevation angles and a step length of 10°.
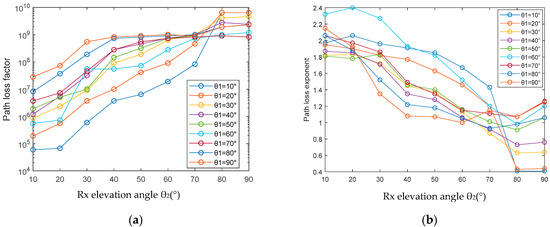
Figure 3.
(a) Path loss factor. (b) Path loss exponent.
This article chooses the on-off keying (OOK) modulation method, and the bit error rate (Pe) expression is [13]
λs-ooK, which is the arrival rate of photons per cycle, is expressed as [14]
By substituting Equations (1) and (3) into Equation (2), we get
2.3. UV Network Coverage
2.3.1. Basic Concept
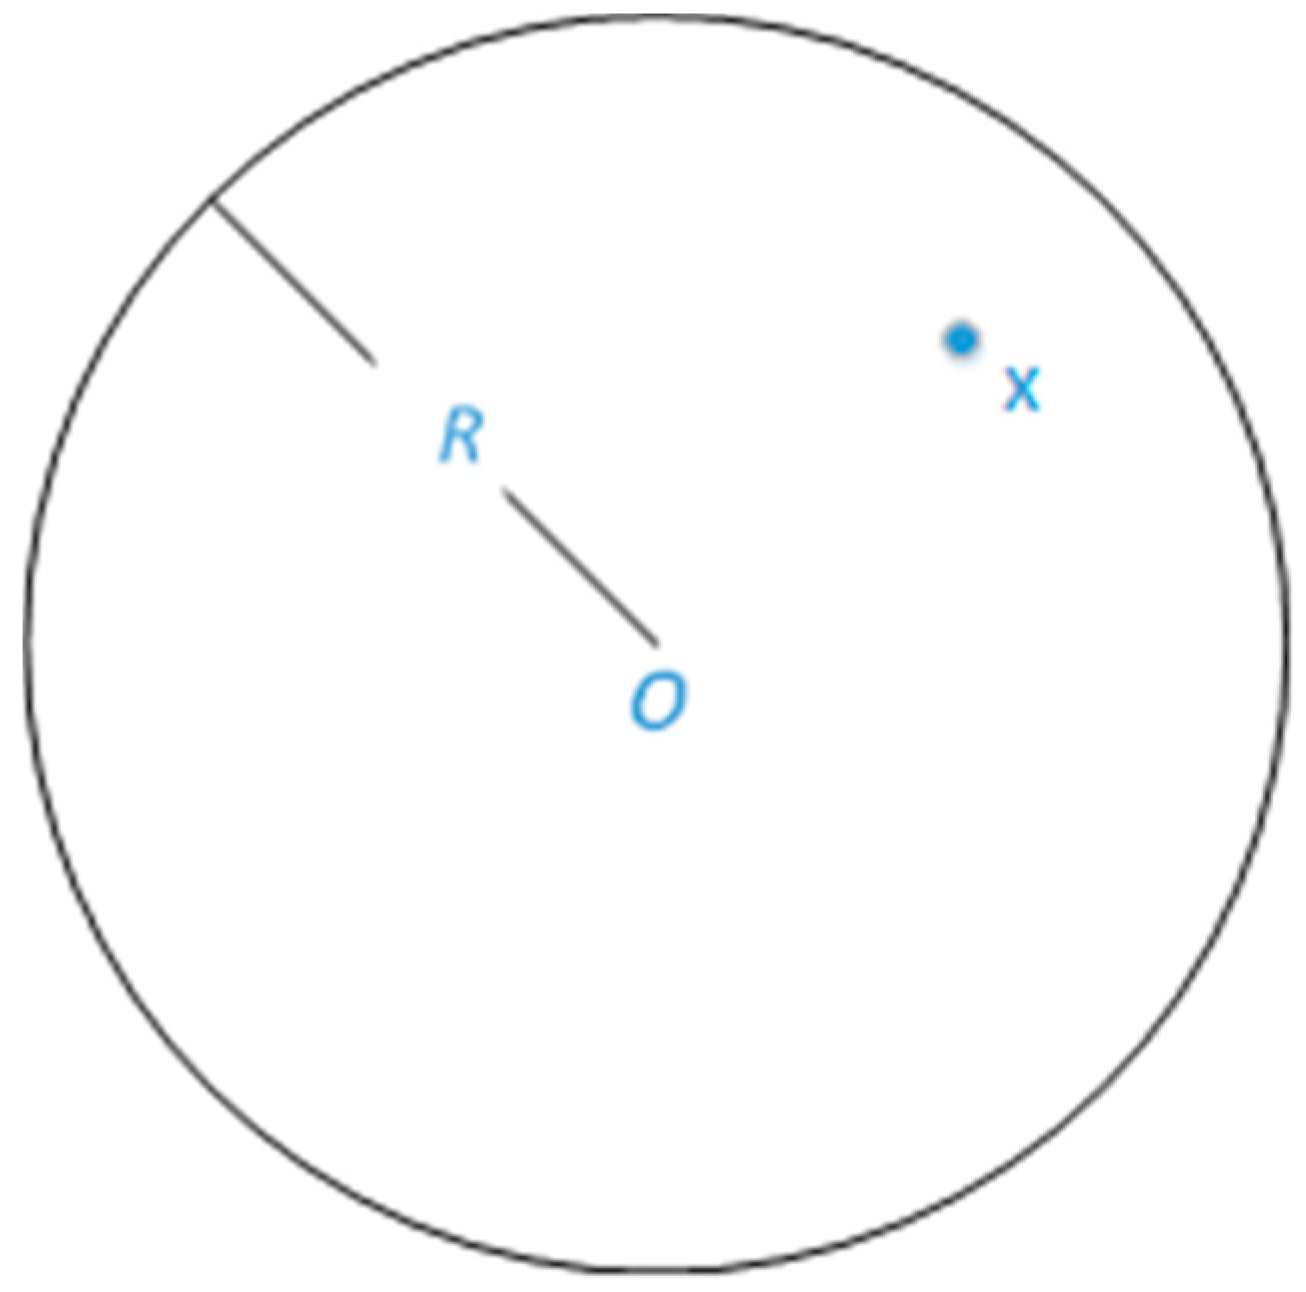
Network coverage is a reference standard that reflects the communication service quality provided by the UV communication network. In the UV NLOS communication network, network coverage means that each node achieves the coverage effect of the target area through cooperative communication. In this article, the Boolean coverage model is used, as shown in Figure 4. The Boolean perception model is an idealized model, ignoring the decreasing process from 0 to 1. Since this model has only two states of being covered and not being covered, it is also called the 0–1 model.
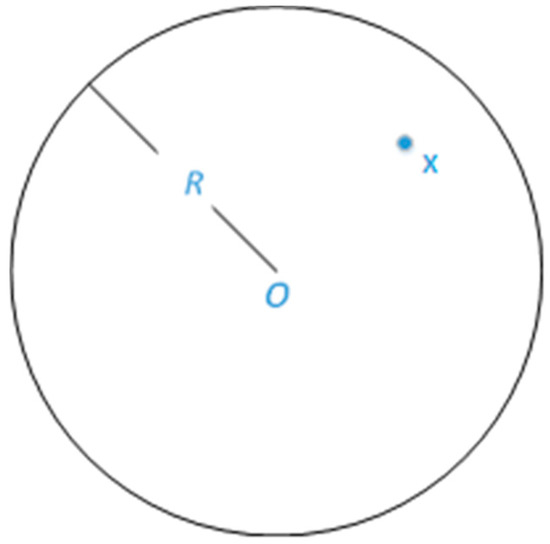
Figure 4.
The Boolean coverage model.
Assuming that the coverage radius of the node O is R, the coverage quality of node O at a certain point X is as [15]
where p(s) represents whether the point O can cover the point X, and d(o, x) represents the distance between the X and the O.
2.3.2. Evaluation Standard
The evaluation criteria of UV network coverage are mainly coverage rate and k-connectivity. Coverage rate (Cov) refers to the ratio of the total coverage of all nodes to the entire target area [15],
where Ncov represents the coverage area of all nodes, and TA represents the target area.
k-coverage means that any target is covered by at least k nodes in the network, and k-connectivity means that any node can communicate directly with at least k nodes in the network. In most cases, the coverage blind zone has a small impact on the overall performance of the network, and the interruption of the communication link causes more serious losses to the performance of the network. Thus the network needs to meet the requirements of 2-connectivity and 1-coverage.
In this manuscript, the distribution of nodes in the target area of an arbitrary polygon is a uniform random distribution. In the case of ensuring the 2-connectivity of the network, the communication scope of all nodes can cover the entire target area. Therefore, this manuscript focuses on the 2-connectivity of the UV network.
3. k-Connectivity
The analysis of the UV k-connectivity network is placed in a two-dimensional arbitrary convex polygon area E, and the area of E is A. The UV terminal nodes are evenly distributed in E, and the number of nodes is n. Therefore the probability density function is
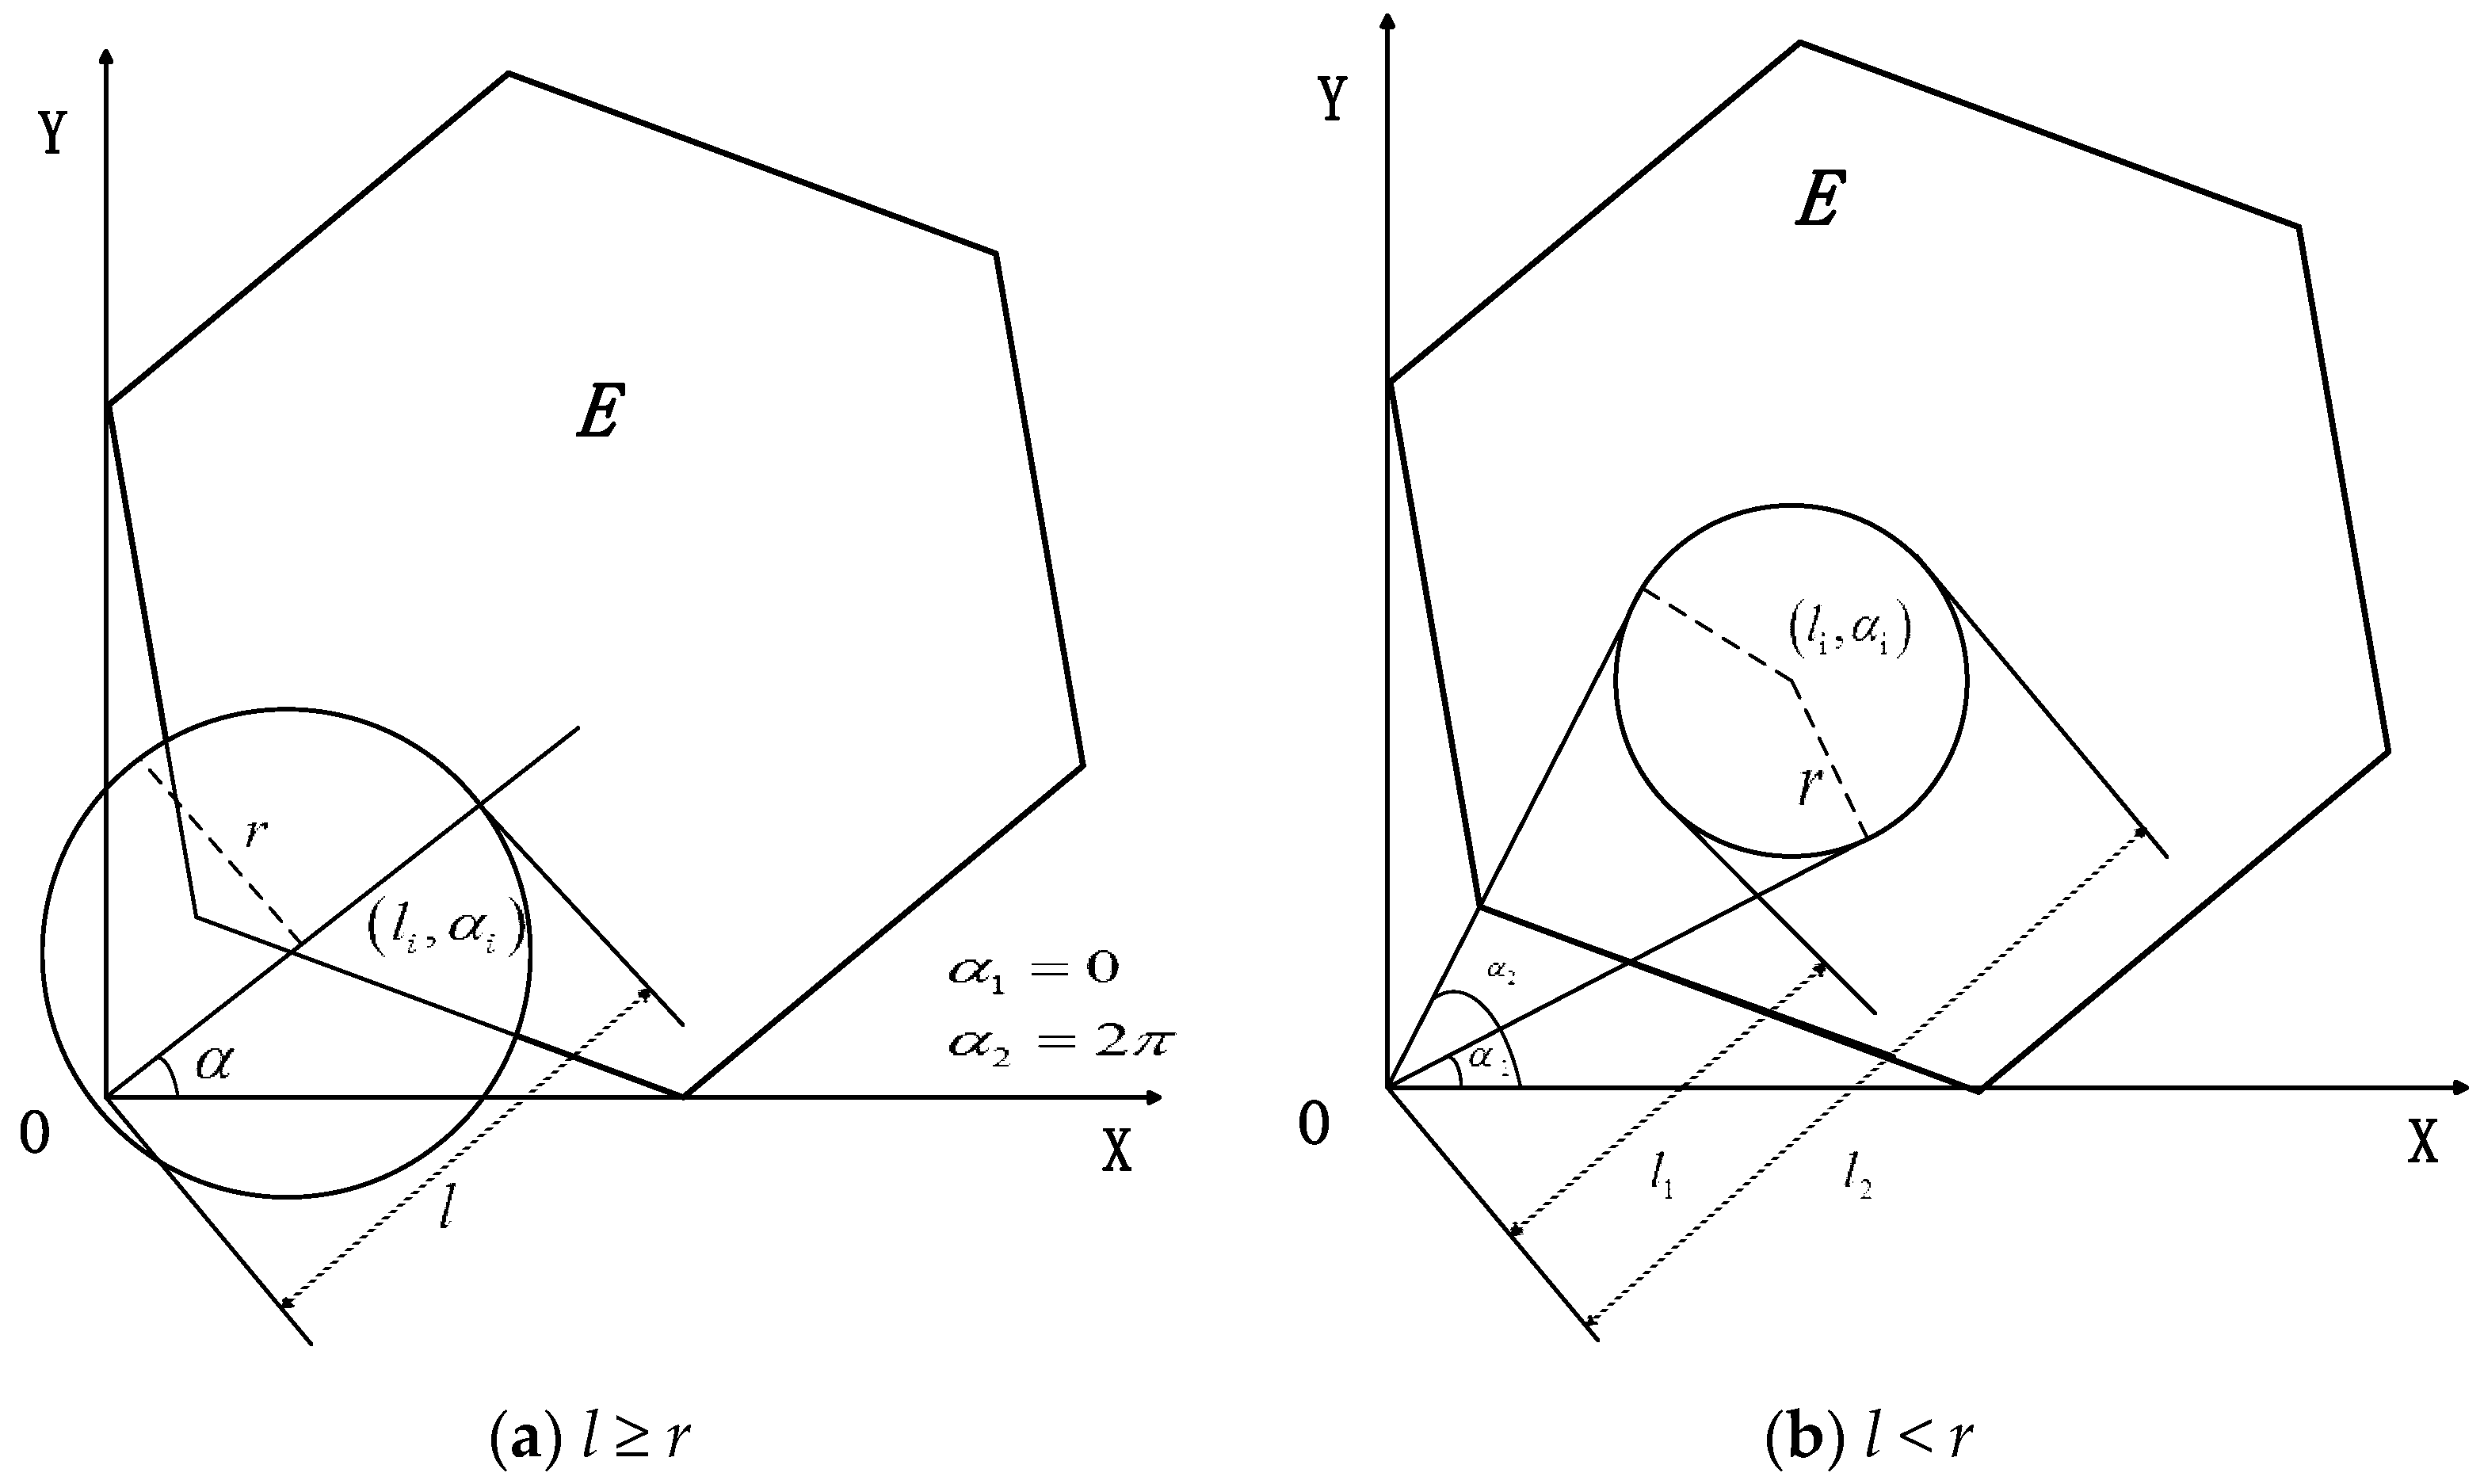
For the arbitrary node in area E, its communication coverage is a circle area with as its center and r as its radius. In the polar coordinate system, it can be expressed as
When the distance between and the pole O is greater than or equal to the communication radius r, l ≥ r as Figure 5a.
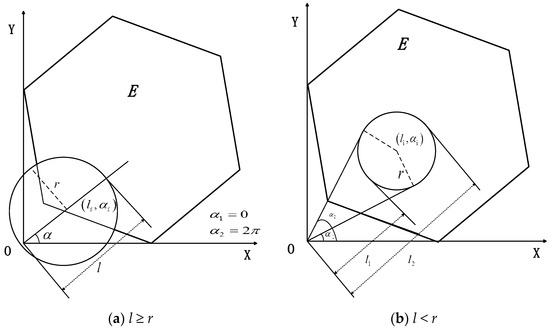
Figure 5.
Polygonal network model.
Elucidating Equation (8), we derive
α1 and α2, l1 and l2 represent the upper and lower bounds of the integral area in the polar coordinate system, respectively. When l < r, as in Figure 5b, the pole O is within the coverage of the node ,
The probability that the node has adjacent nodes is
The remaining arbitrary nodes within the coverage area of the node obey the binomial distribution , so the probability that has k adjacent nodes is
The number of nodes in the UV network is n. Thus, the probability that has at least k adjacent nodes is
We can derive the probability that an arbitrary node has at least k adjacent nodes using
The probability that each node has at least k neighbor nodes is used to express the probability of a k-connected network because there is no way to accurately calculate the k-connection probability of the network at present [16],
Therefore, the probability of a k-connected network is
4. Simulation and Analysis
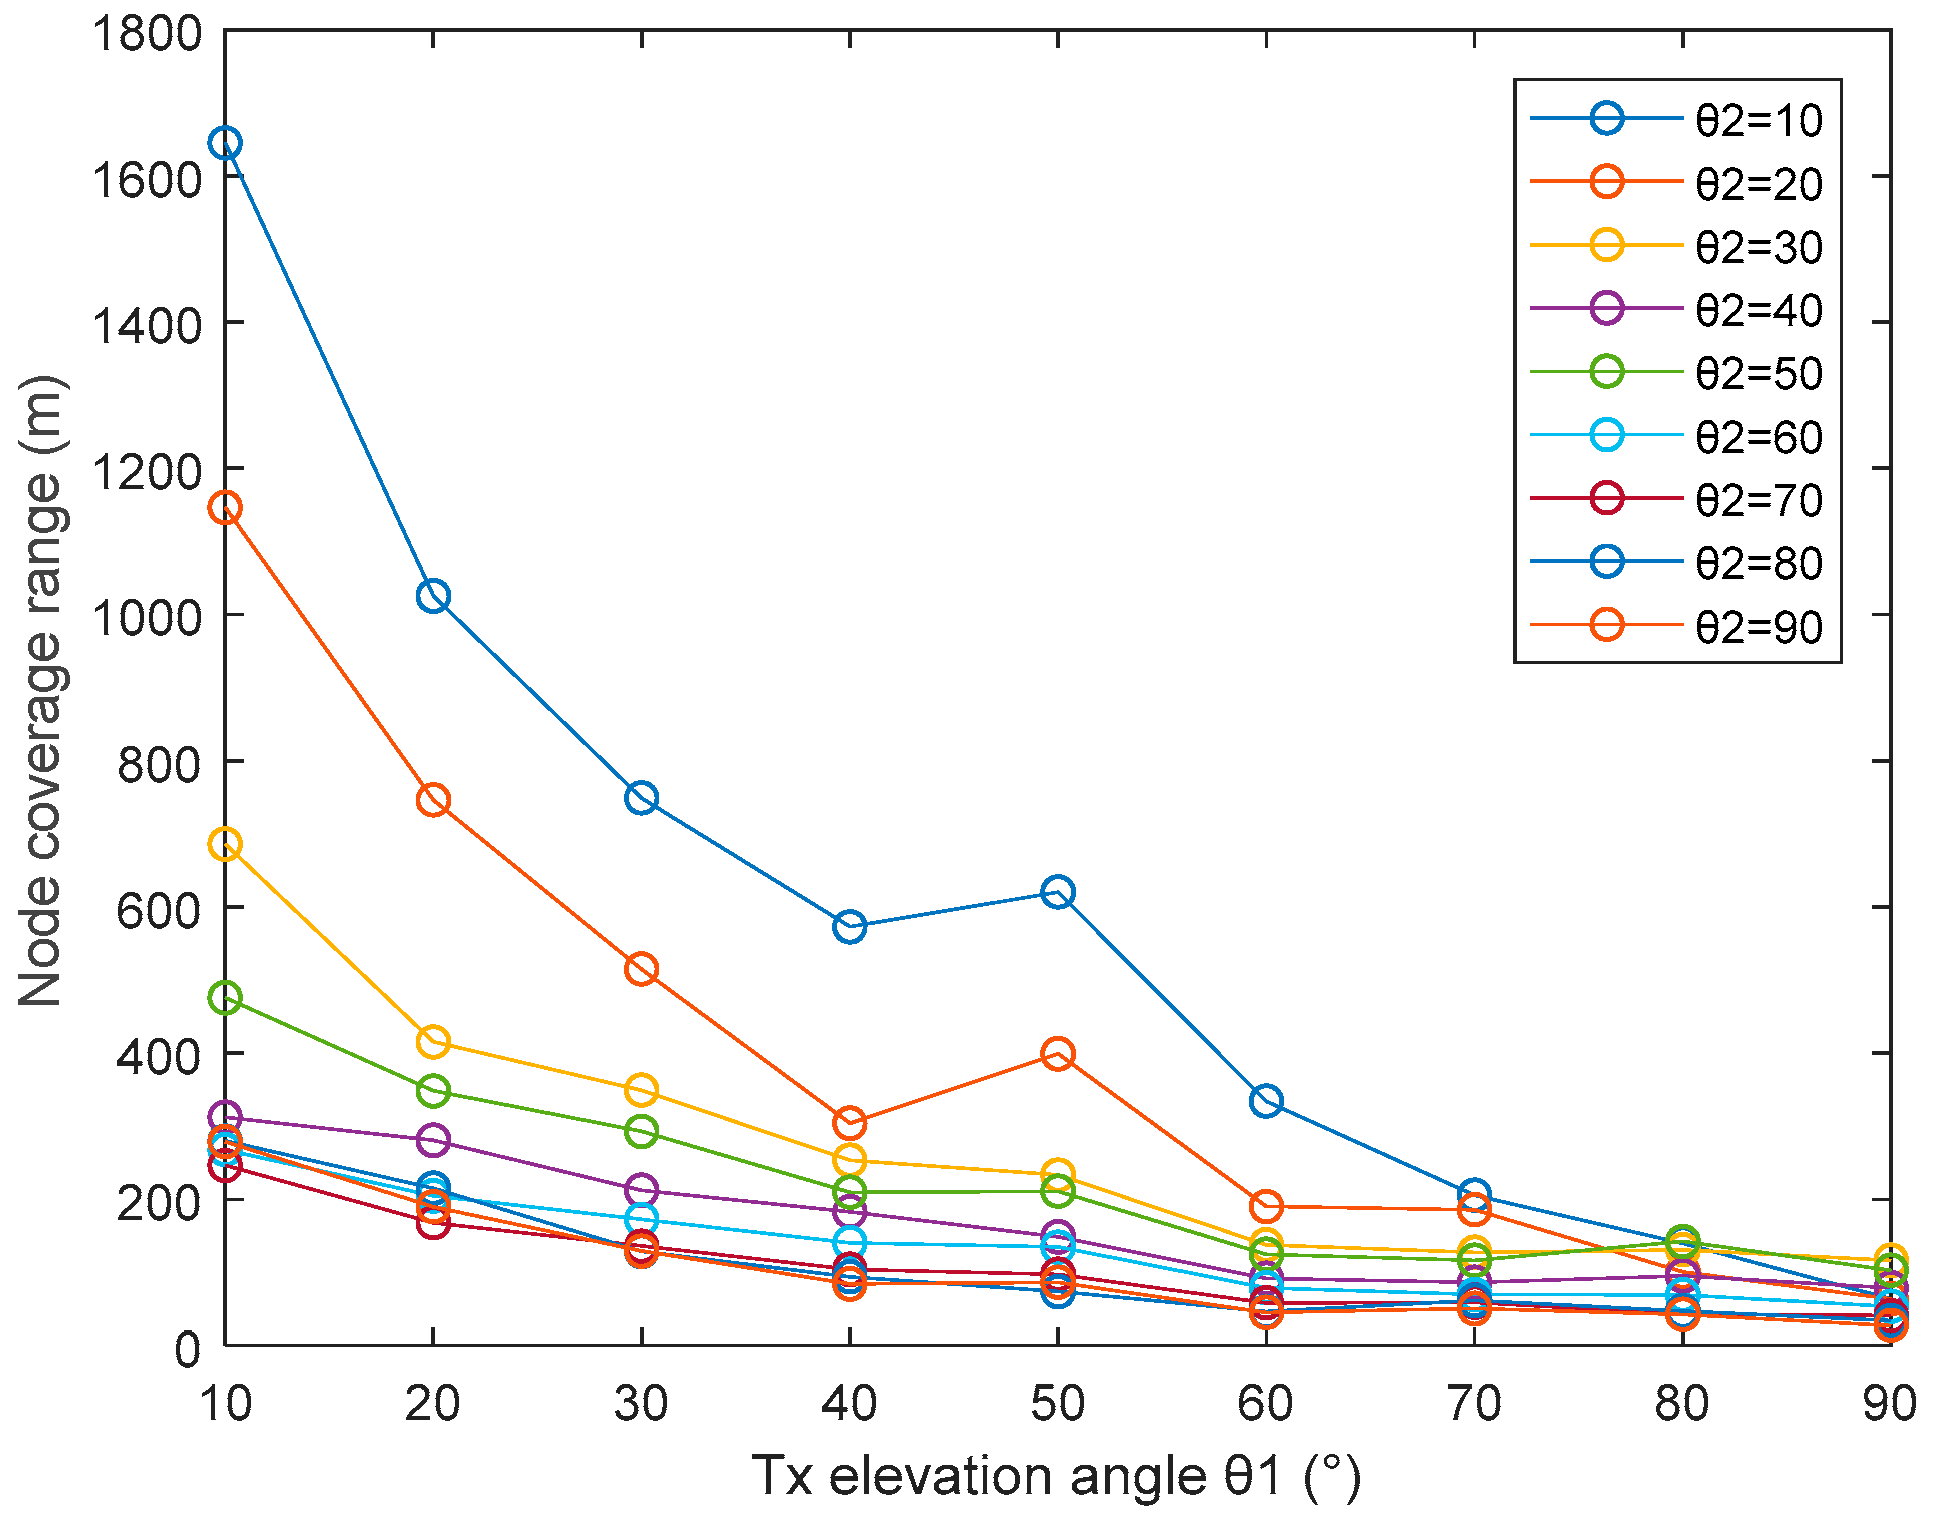
Based on Equation (4), we simulated the change of the node coverage range with the transmitting elevation angle under different receiving elevation angles. The communication parameter settings are shown in Table 1. Then the influence of different communication parameters (node density, data rate and transmitted power) on the UV k-connected network was analyzed. Finally, we numerically studied the UV network models of polygonal and circular regions, respectively, and analyzed the difference between them.

Table 1.
System model parameters.
4.1. Transceiver Elevation Angles and Node Coverage Range
Figure 6 shows how the node coverage range changes with the transmitting elevation angle (θ1) under different receiving elevation angles (θ2). We observe that as θ1 increases, the range gradually decreases. By contrast, we note that when θ1 is 50°, the coverage range is greater than that when θ1 is 40°. Since the volume of the effective scatterer (V) becomes larger as θ1 increases from 40° to 50°.
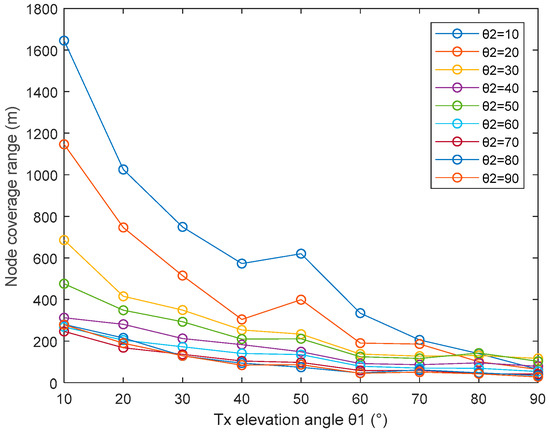
Figure 6.
The relationship between node coverage range and the transmitting elevation angle.
4.2. The Connectivity Properties
Five sets of elevation angle combinations are selected in the simulation process based on three working methods. This not only guarantees the diversity of work modes but also avoids work redundancy caused by too many angle combinations.
Without the loss of generality, a regular quadrilateral is selected as the simulation area, and the number of simulations is 100,000.
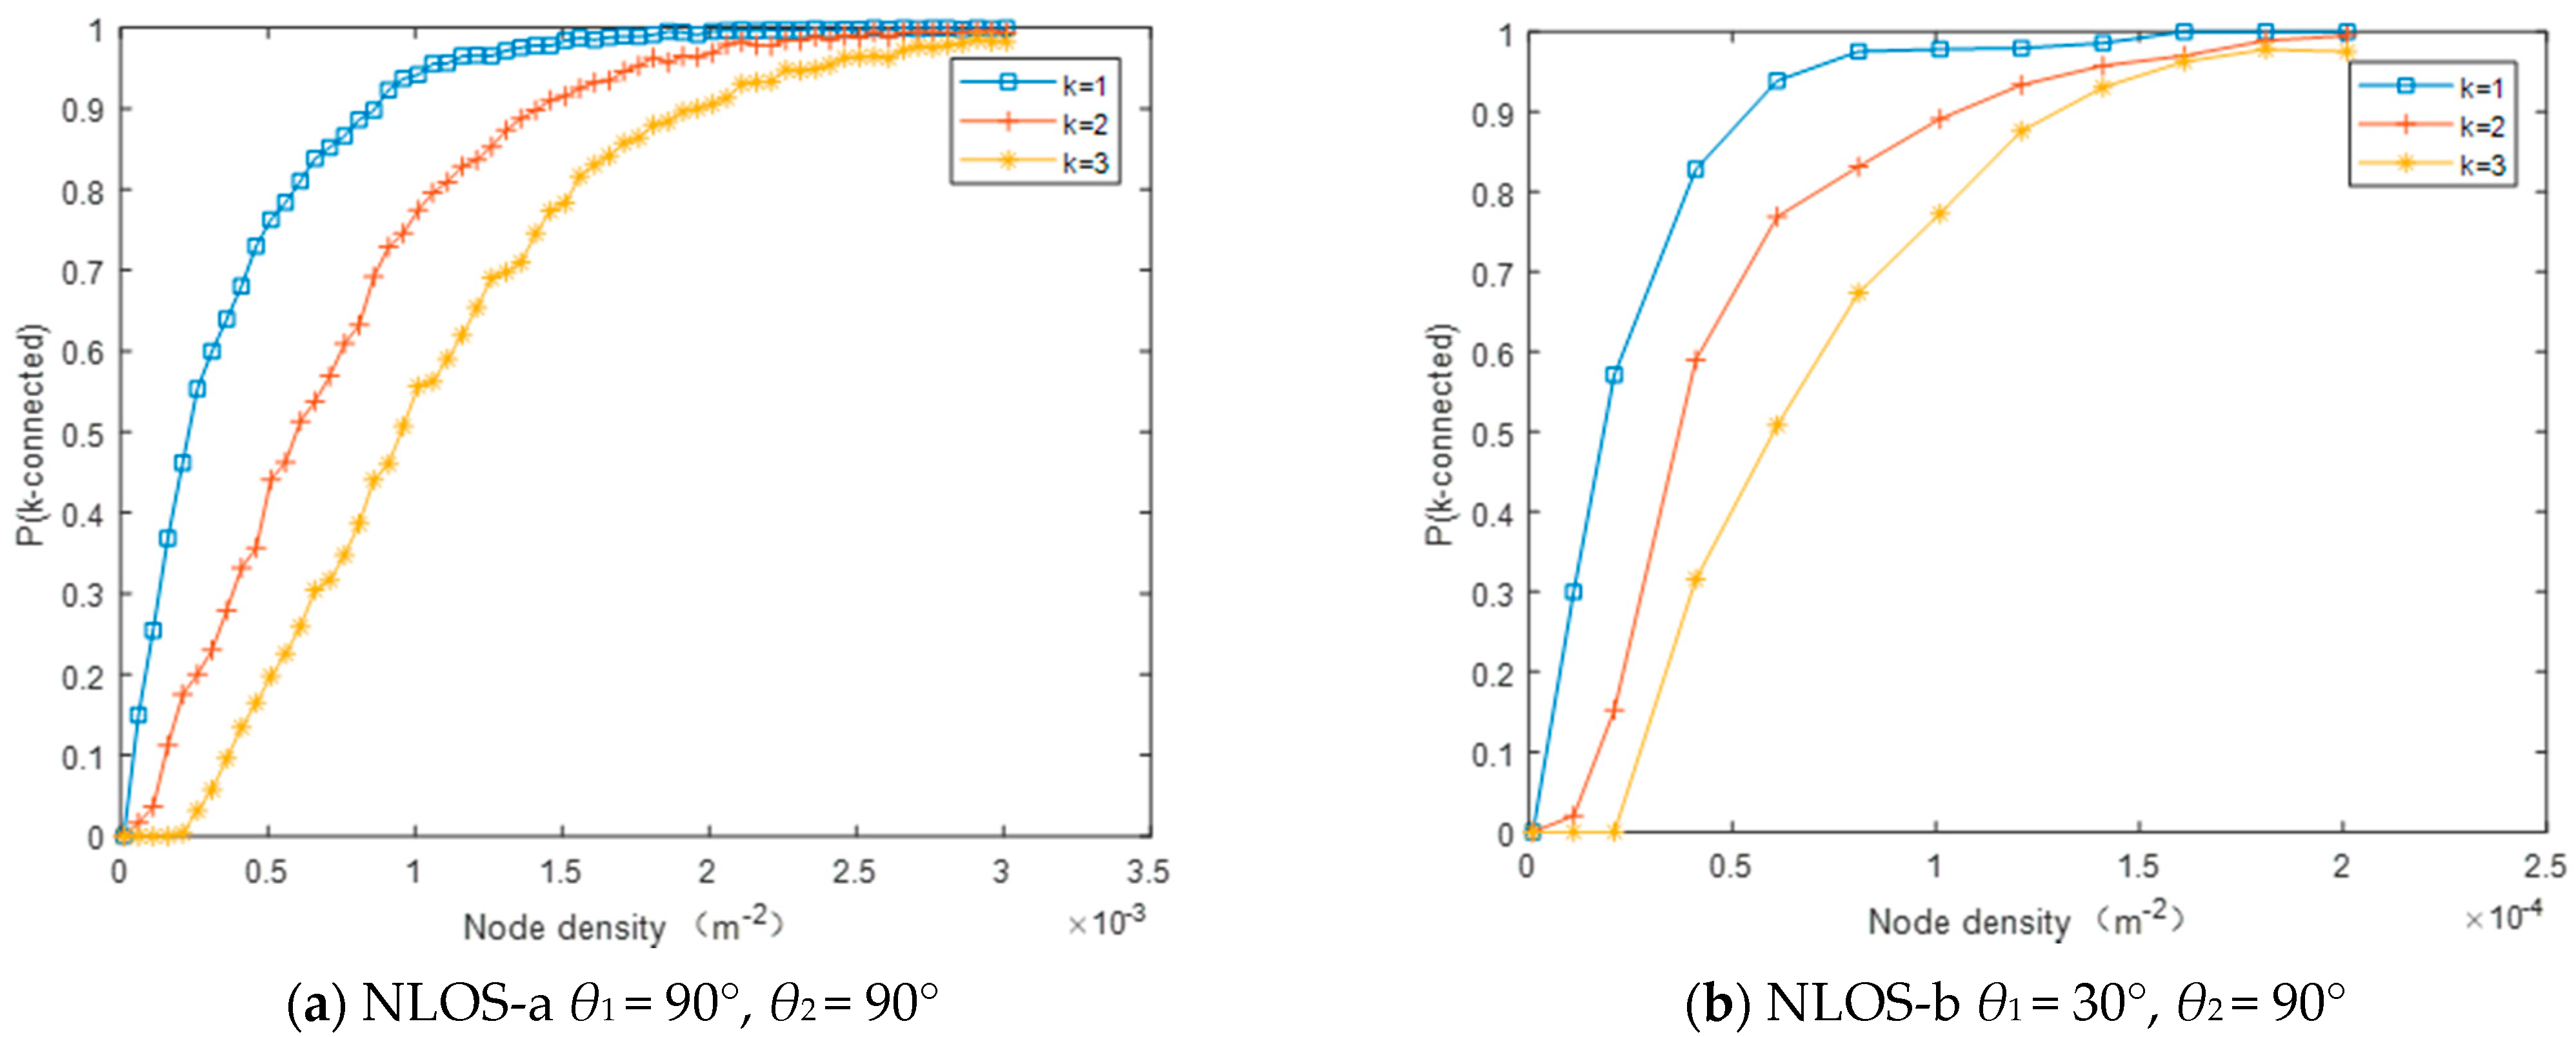
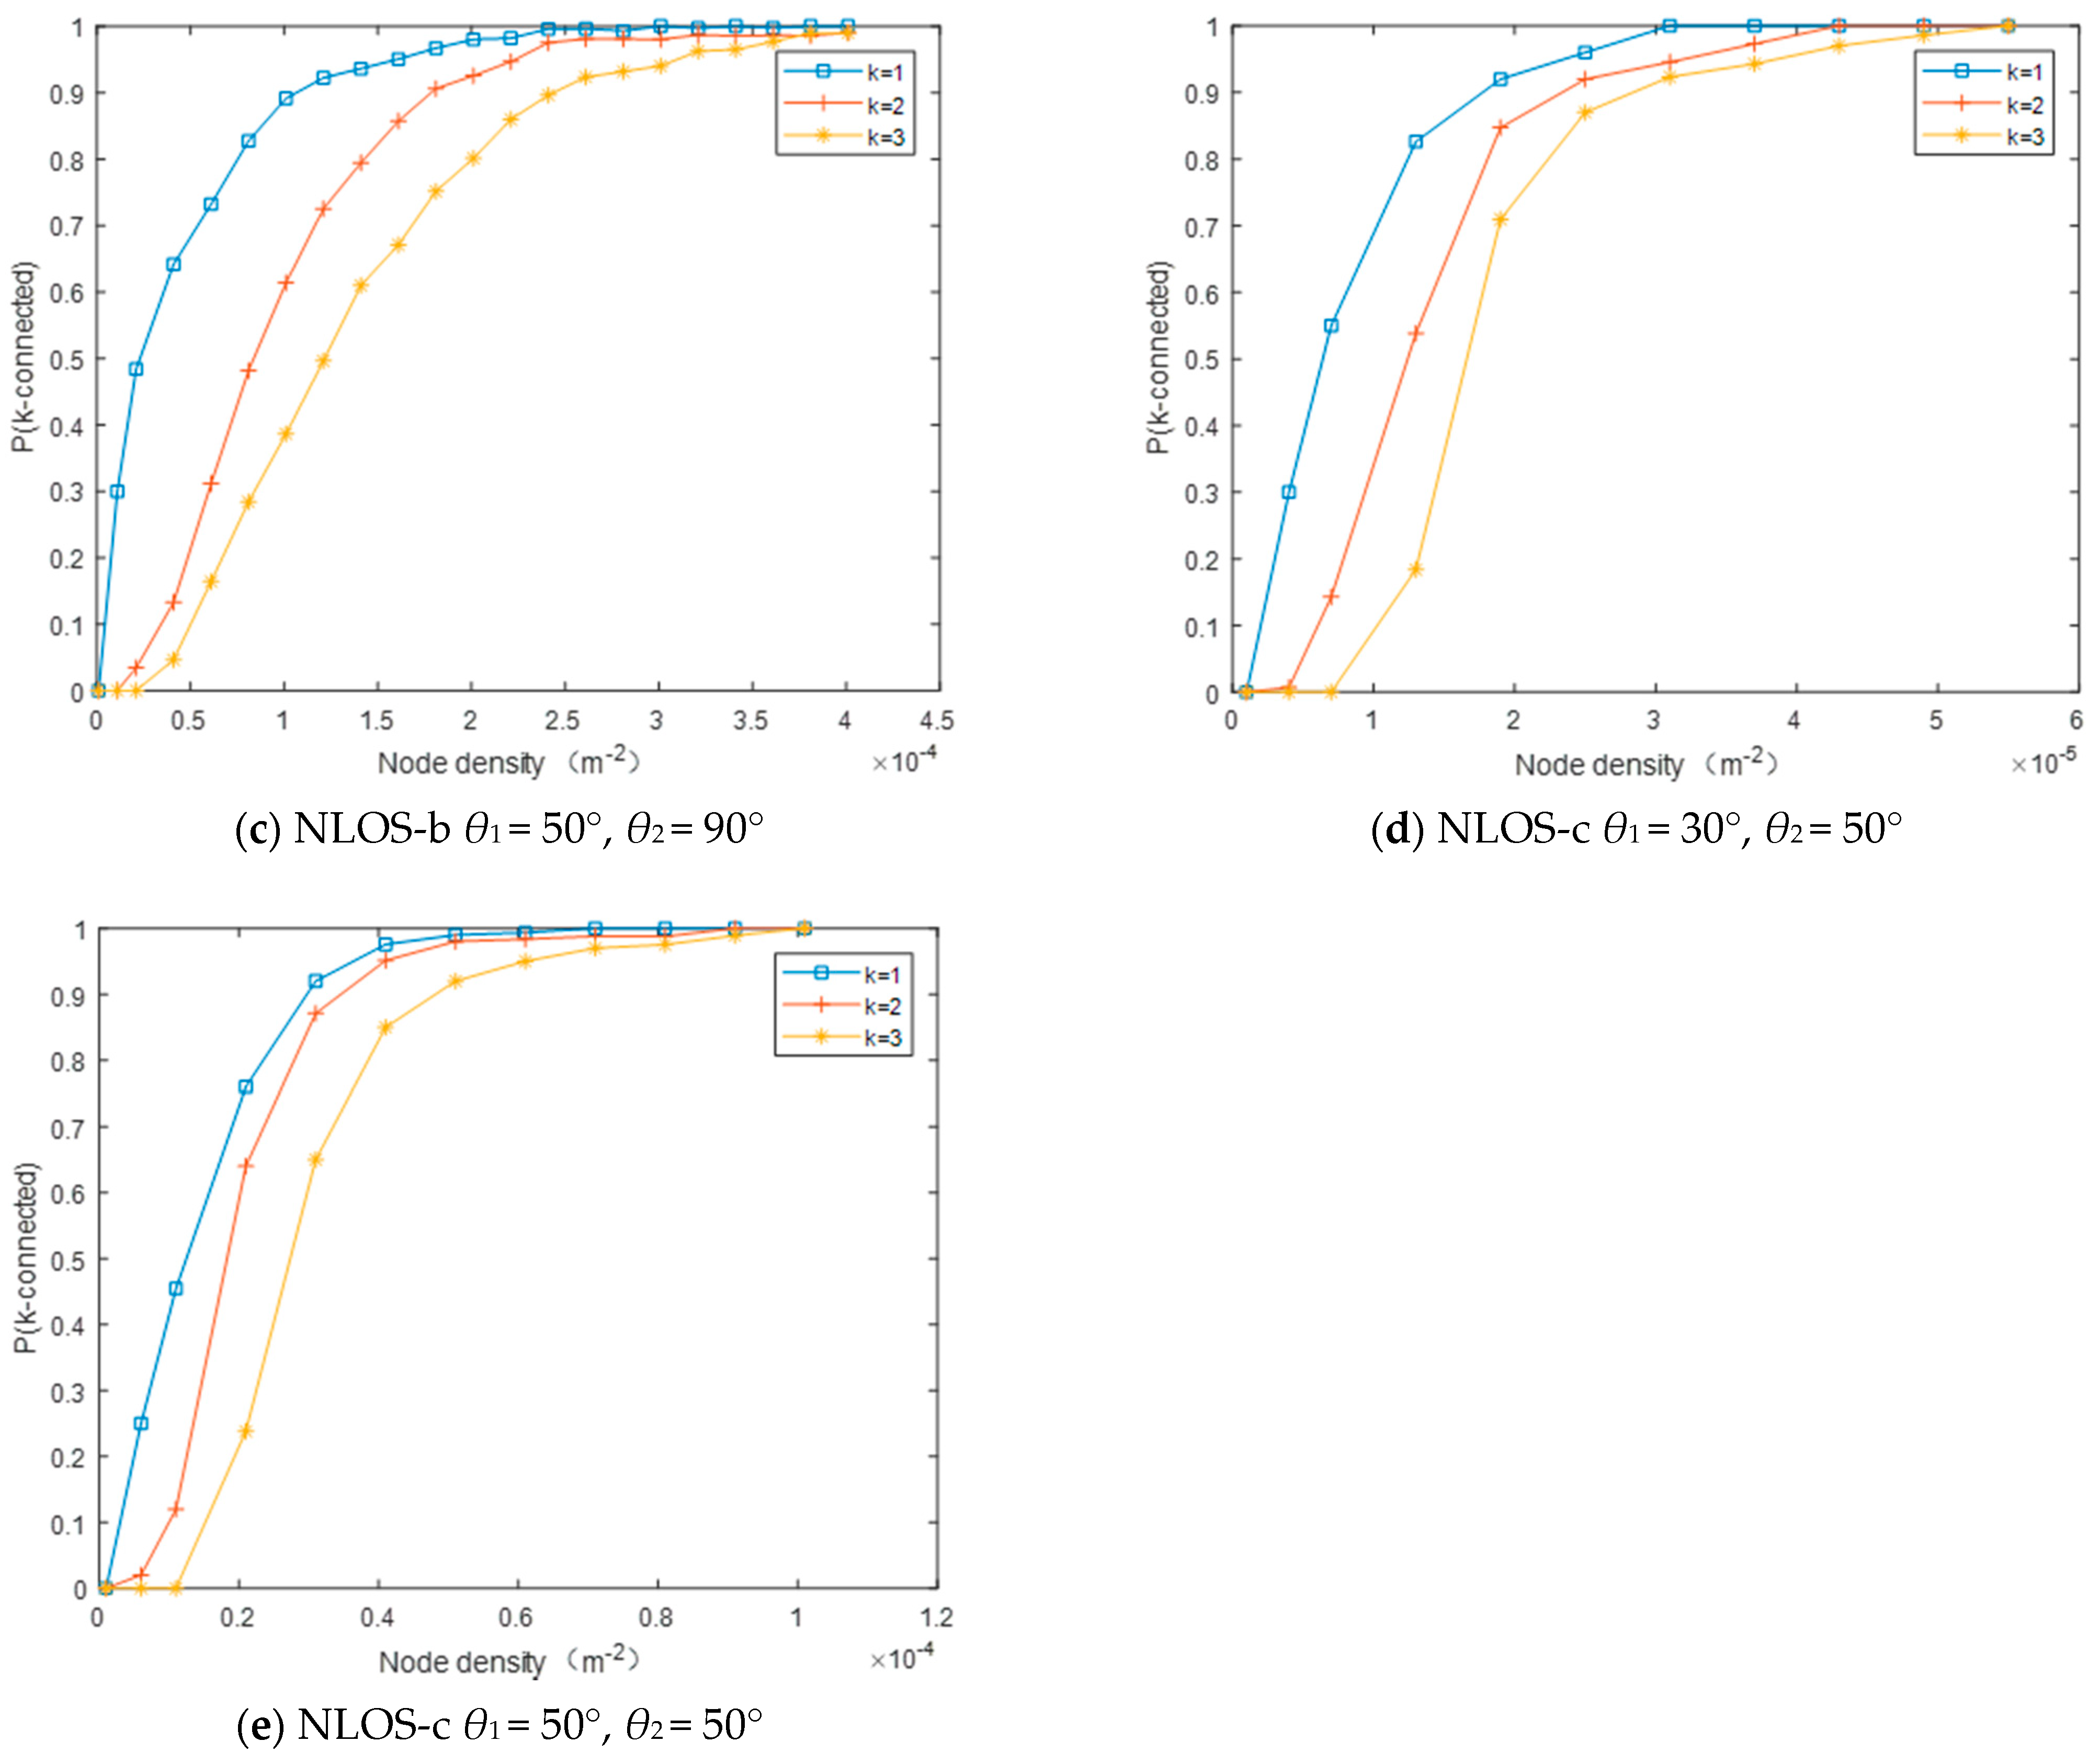
Figure 7 indicates the changing trend of P(k-connected) with the node density in different working modes (Rb = 10 kbps, Pt = 0.5 W). The results illustrate that the k-connection probability increases with the increase of node density, and there is a similar growth trend under different transceiver elevation angles.
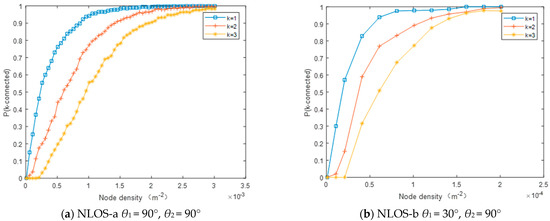
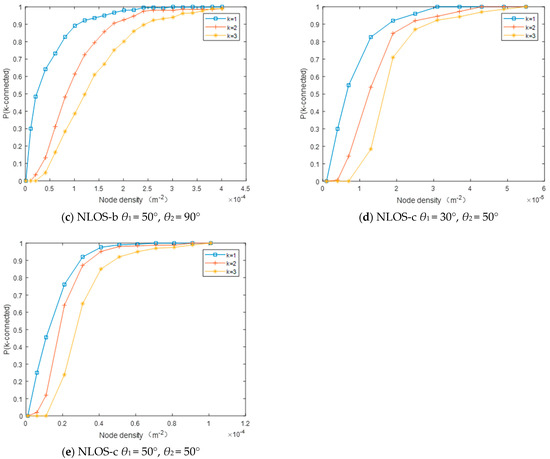
Figure 7.
The network connectivity changes with the node density: (a) θ1 = 90°, θ2 = 90°, (b) θ1 = 30°, θ2 = 90°, (c) θ1 = 50°, θ2 = 90°, (d) θ1 = 30°, θ2 = 50°, (e) θ1 = 50°, θ2 = 50°.
If the UV network needs to reach 2-connectivity, that is, the network connection rate reaches more than 95%, the node density under NLOS-a working mode is at least 1.71 × 10⁻³ m−2. The node density under NLOS-b (θ1 is chosen to be 50° and θ2 is unchanged) is at least 2.19 × 10⁻⁴ m−2, which is 12.8% of NLOS-a mode.
A horizontal comparison illustrates that the conditions for achieving a 3-connected network under the same communication parameters is more stringent. In NLOS-a mode, the node density needs to increase by 54.0% if the 1-connected network needs to reach the 2-connected network, and the node density increases by 116.9% to reach 3-connectivity.
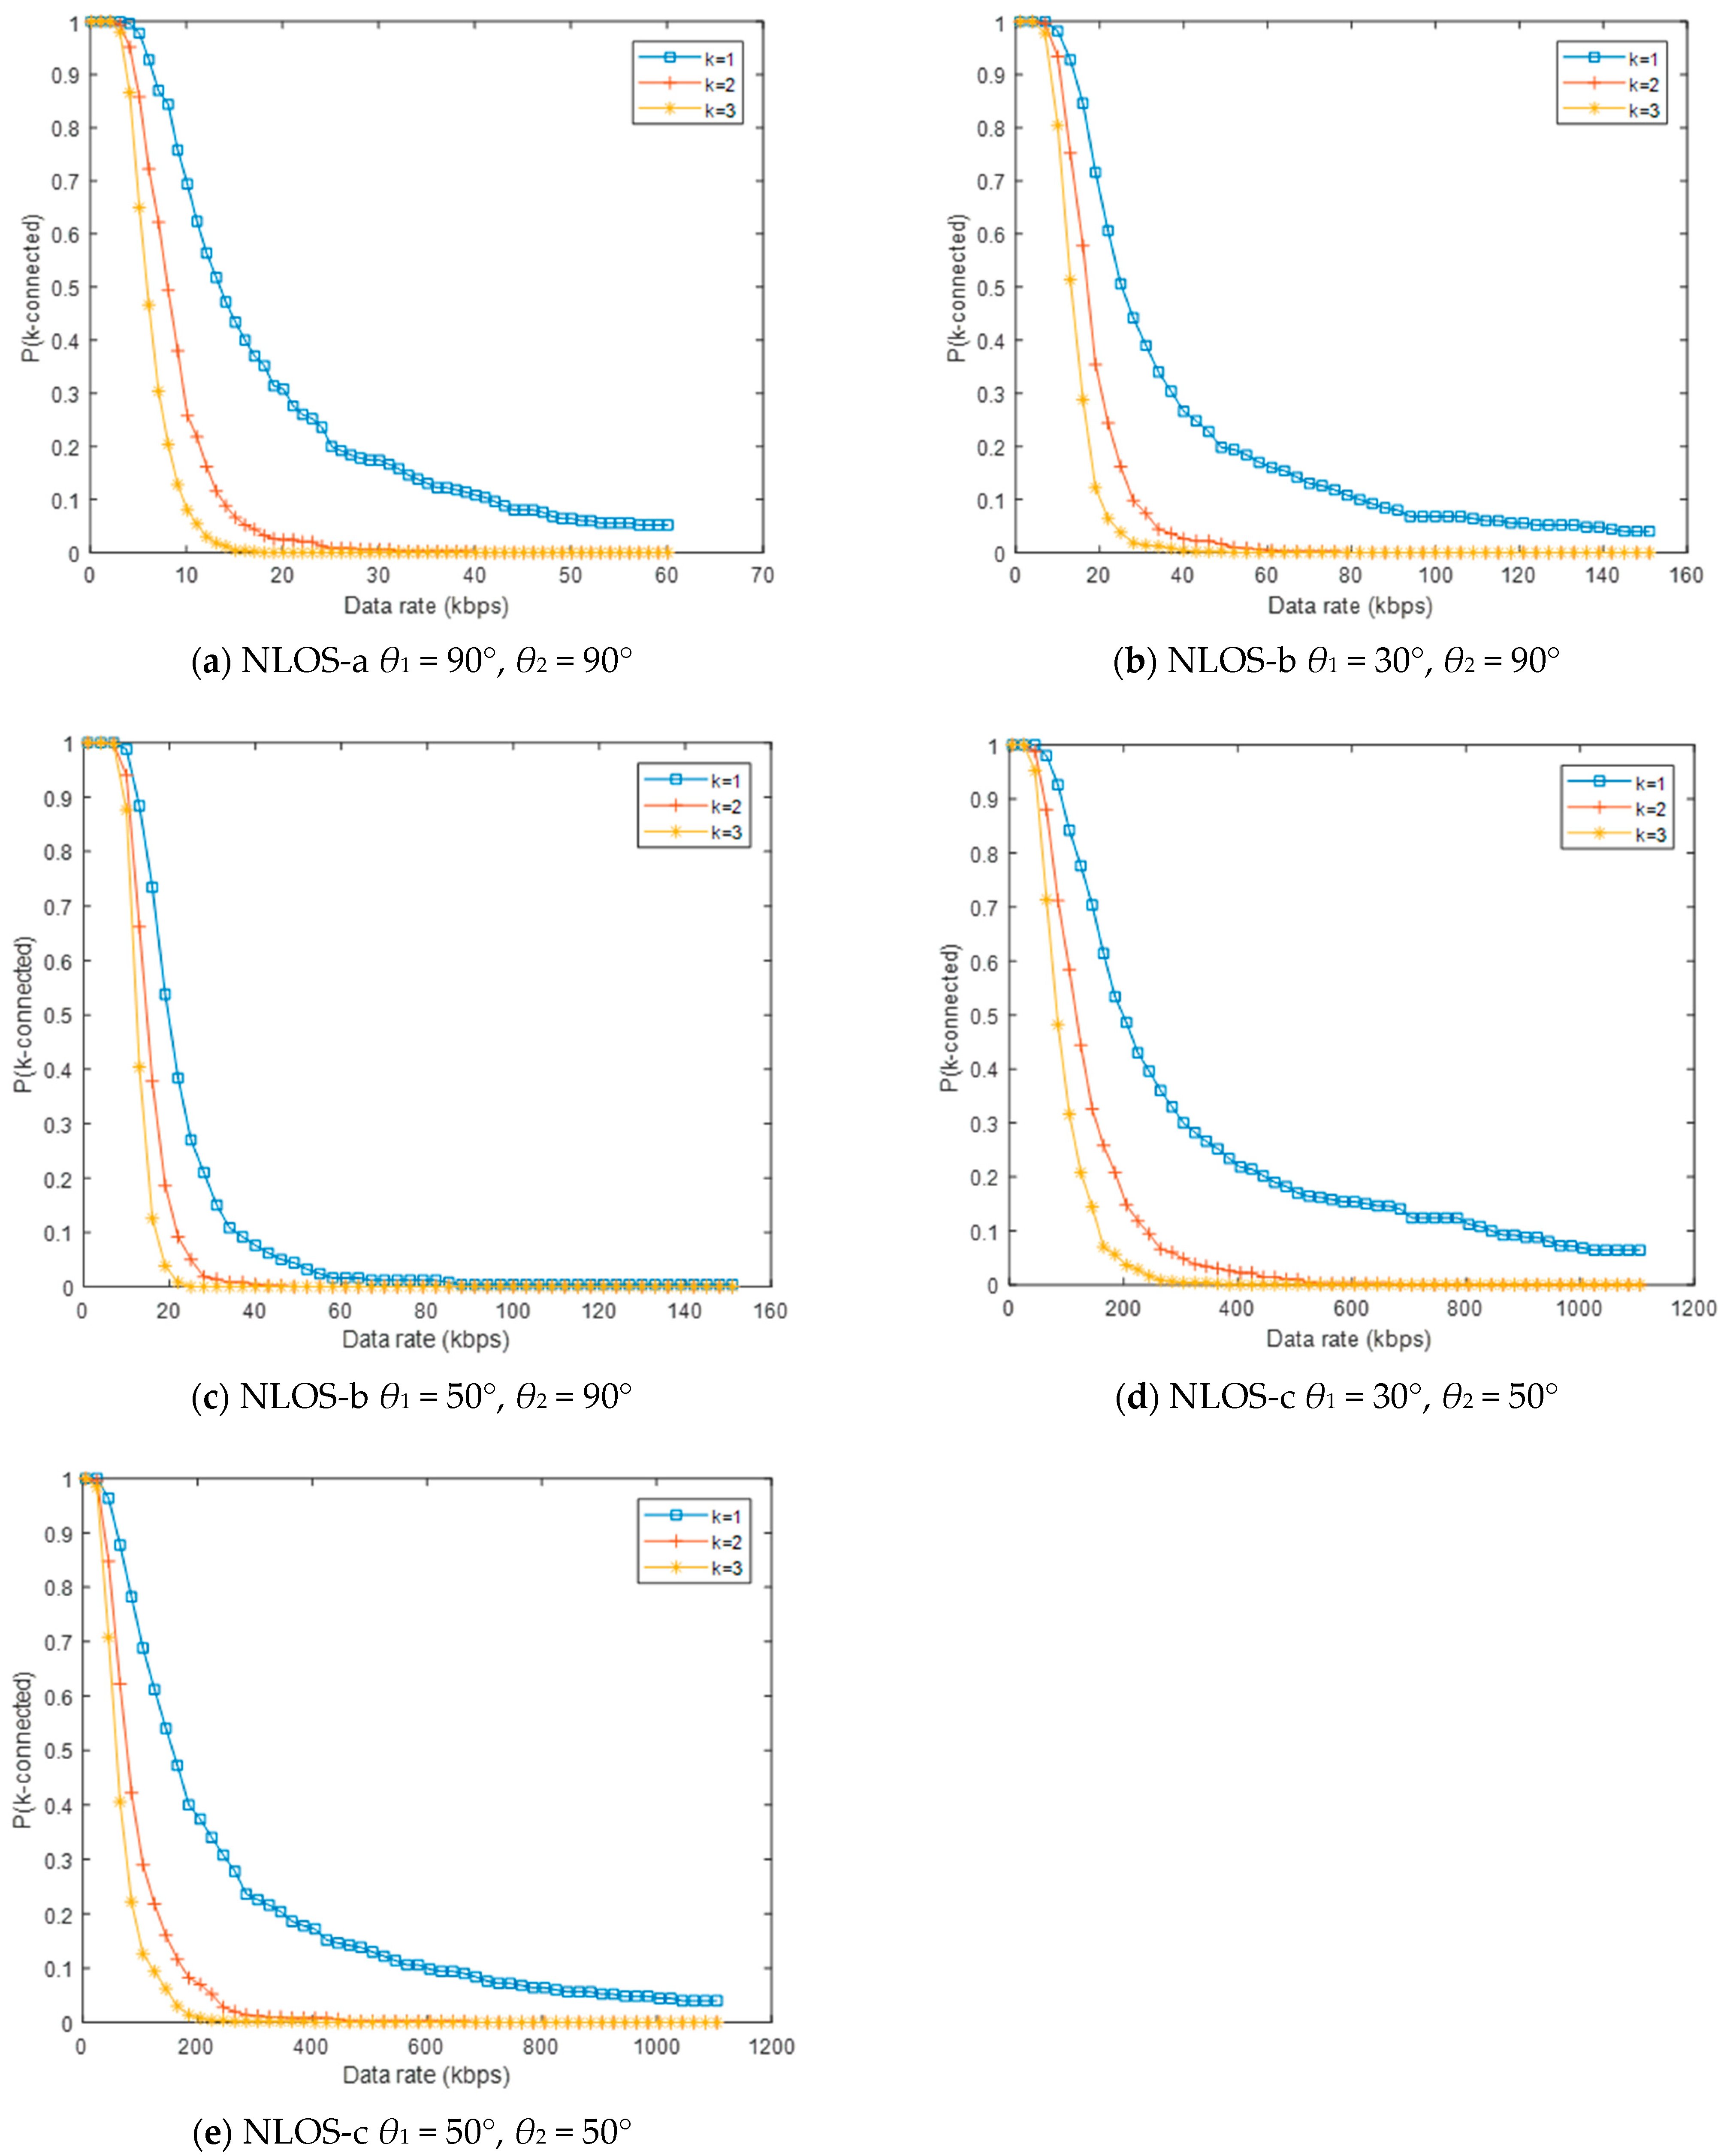
Figure 8 shows the changing trend of P(k-connected) with the data rate in different working modes ( = 5.0 × 10⁻⁴ m−2, Pt = 0.5 W). We know that the k-connection probability decreases with the increase of the data rate from Figure 8. When the working mode is NLOS-c, the data rate of the network from 1-connected state to 2-connected state needs to be reduced by 26%, and the data rate needs to be reduced by 39.4% to reach a 3-connected state, as shown in Figure 8e.
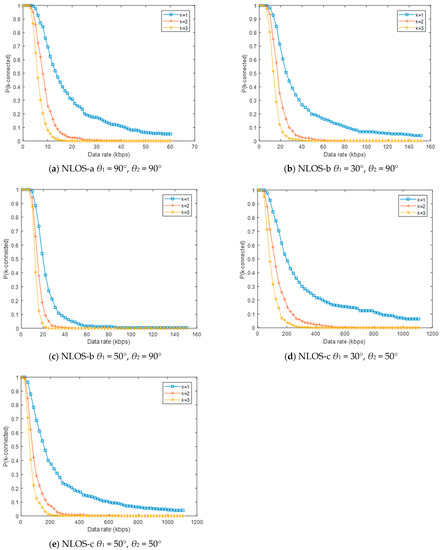
Figure 8.
The network connectivity changes with the data rate: (a) θ1 = 90°, θ2 = 90°, (b) θ1 = 30°, θ2 = 90°, (c) θ1 = 50°, θ2 = 90°, (d) θ1 = 30°, θ2 = 50°, (e) θ1 = 50°, θ2 = 50°.
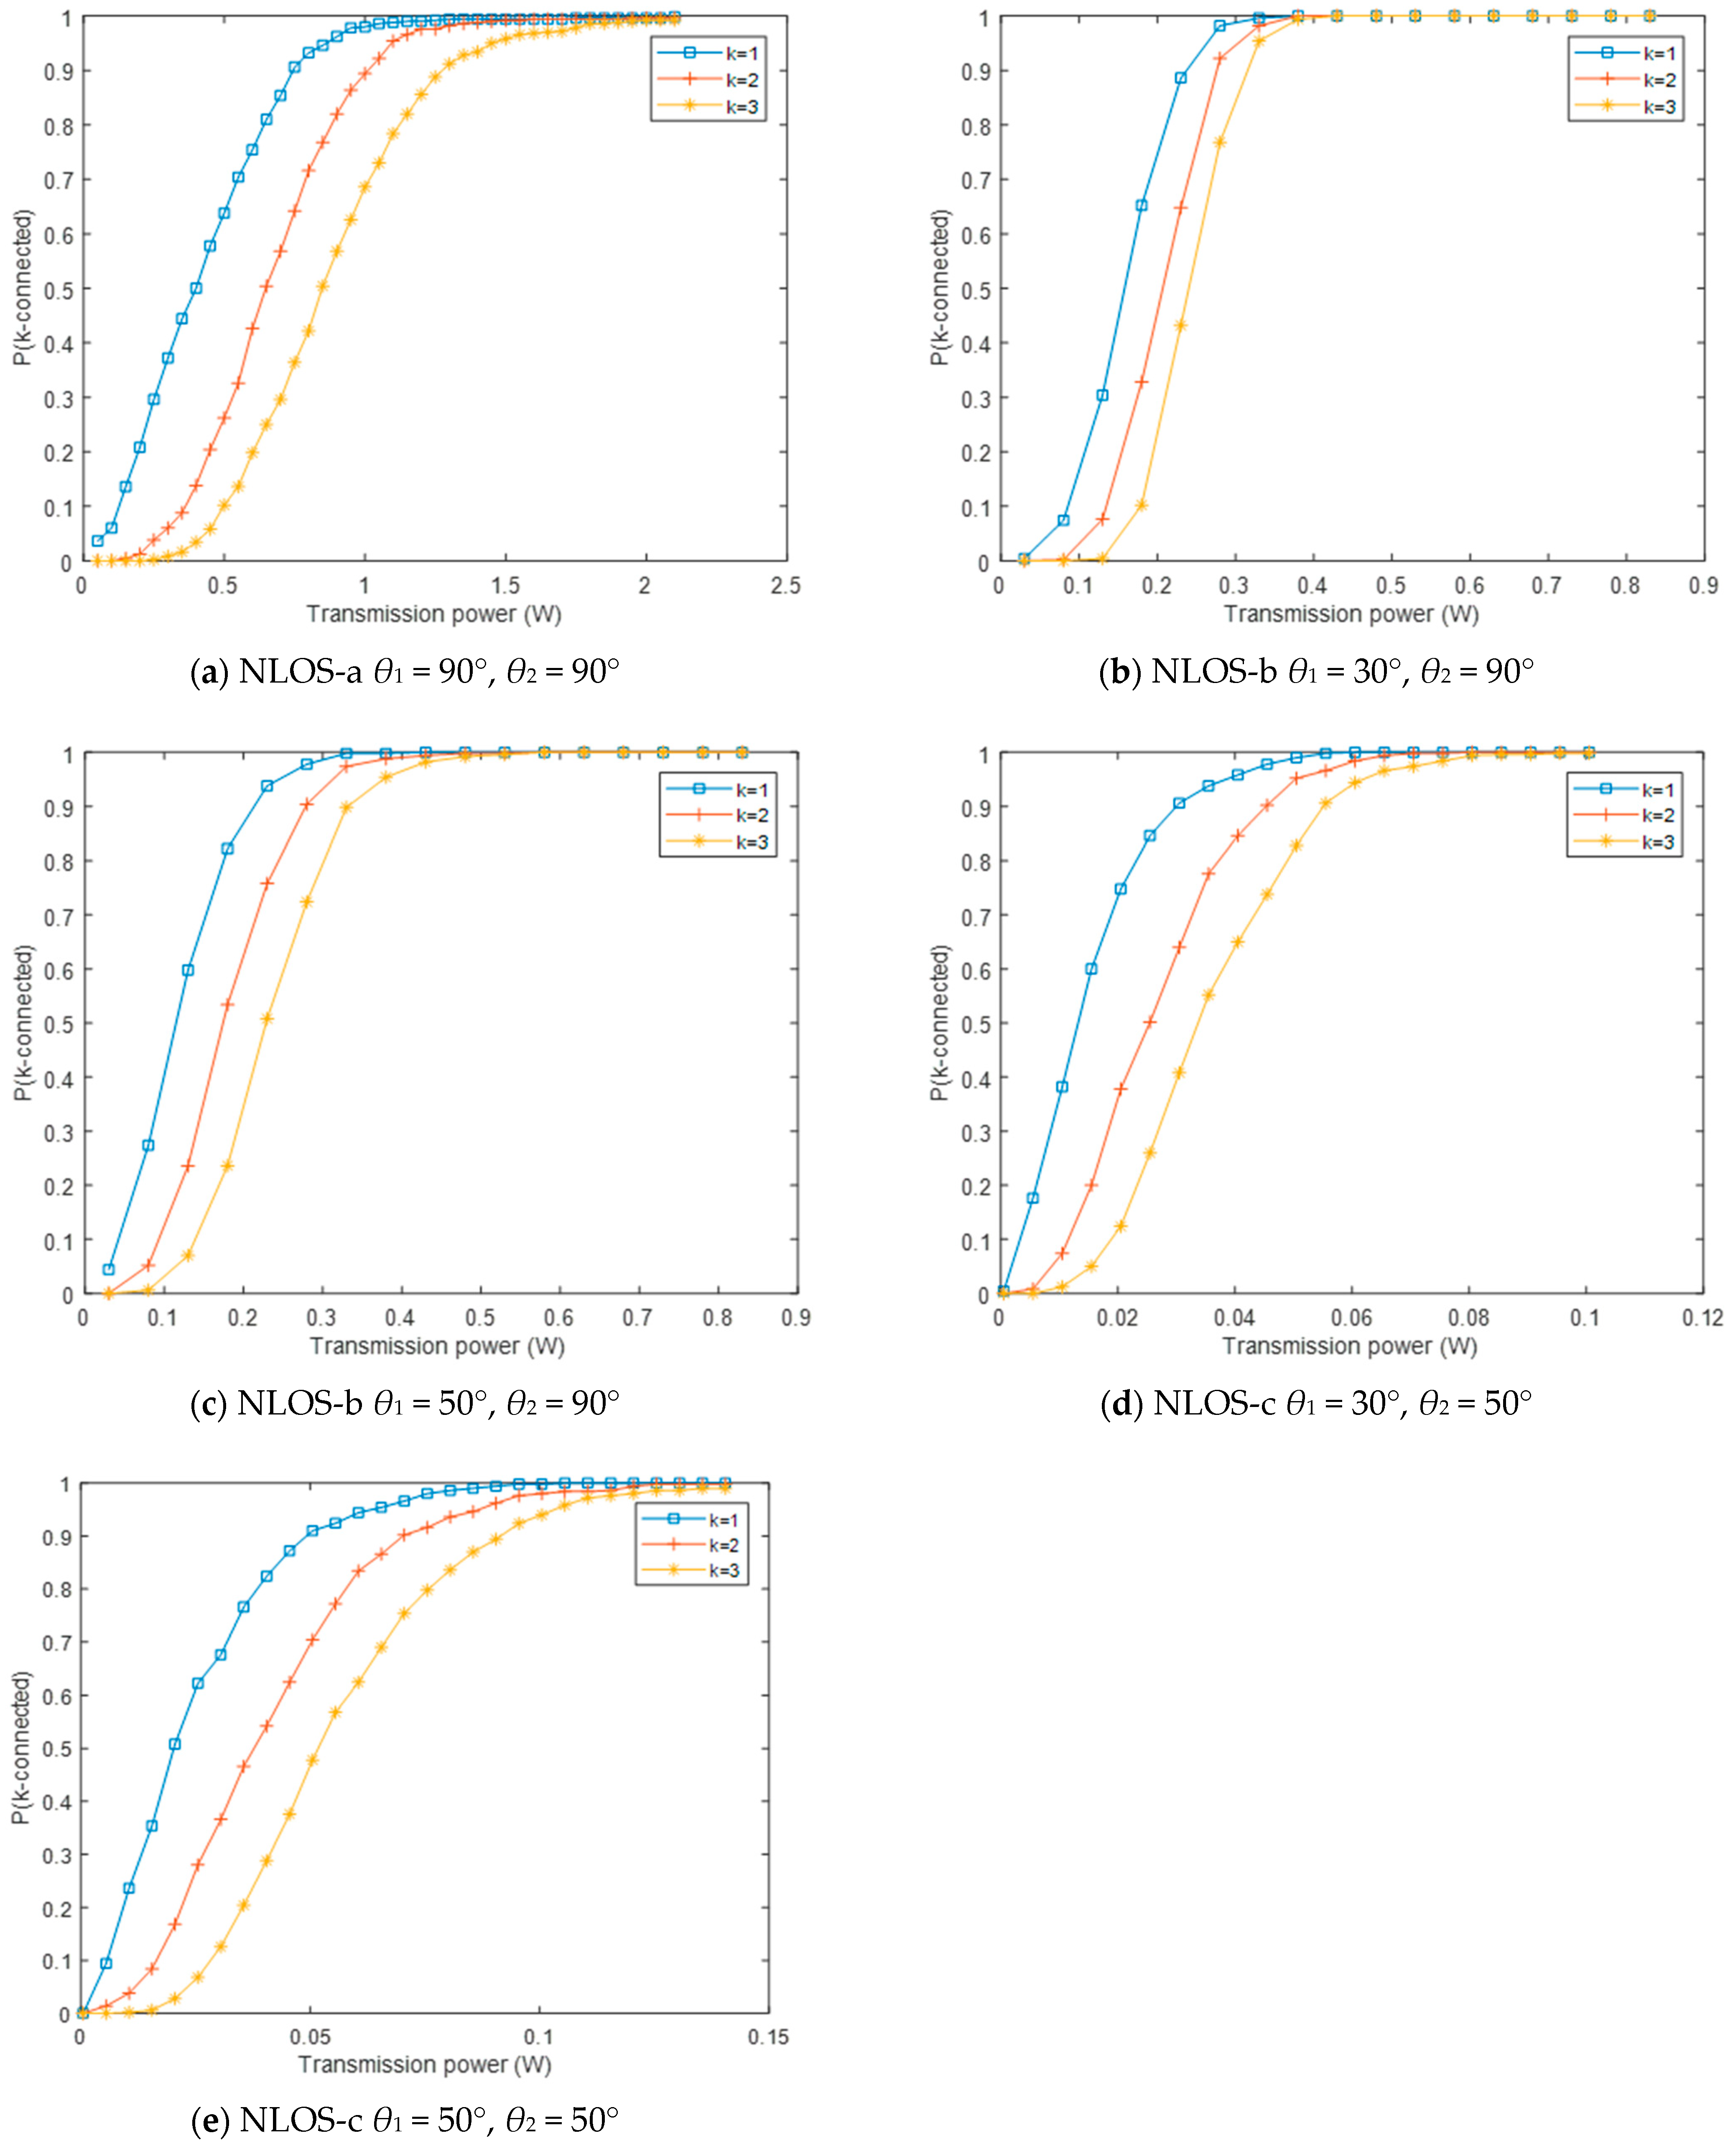
From Figure 9, the changing trend of P(k-connected) with the transmission power ( = 5.0 × 10⁻⁴ m−2, Rb = 10 kbps) can be found. That is, the P(k-connected) increases as the transmission power increases. When the working mode is NLOS-c, the transmission power of the network from 1-connected state to 2-connected state needs to increase by 27.0%, and the transmission power needs to increase by 53.7% to reach a 3-connected state, as shown in Figure 9e. By comparing Figure 7, Figure 8 and Figure 9, we notice that the smaller the transceiver elevation angles are, the better the network connectivity performance is.
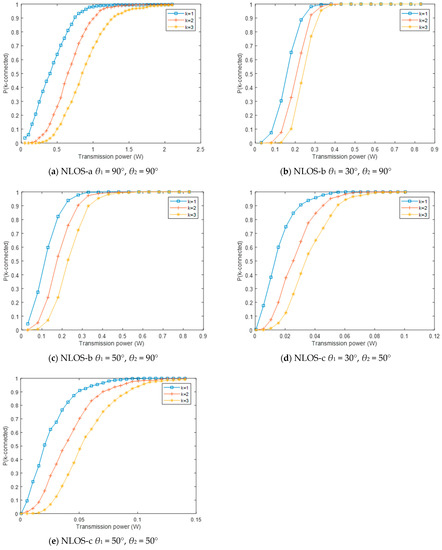
Figure 9.
The network connectivity changes with the transmission power: (a) θ1 = 90°, θ2 = 90°, (b) θ1 = 30°, θ2 = 90°, (c) θ1 = 50°, θ2 = 90°, (d) θ1 = 30°, θ2 = 50°, (e) θ1 = 50°, θ2 = 50°.
4.3. The 2-Connectivity Analysis for Two Distribution Regions
The 2-connected UV network has good robustness, which can meet the use of an actual UV network. In our previous research, the UV network connectivity in the circular area under different working modes has been studied [10]. We compared the model built in an arbitrary polygonal area with the model built in the circular area, and the numerical comparison results are shown in Table 2.
Table 2.
Numerical comparison of two regional models.
From Table 2, we find that the model of UV nodes evenly distributed in a circular area requires more stringent communication parameters than the model in a regular quadrilateral area. It requires higher , Pt and lower Rb to reach the 2-connected network. The “boundary effect” of the circular area is stronger, which leads to more terminals distributed on the boundary of the region, thereby reducing the connectivity of the model [17].
5. Conclusions
In this paper, the UV network model is creatively constructed in an arbitrary polygonal area, and the network coverage in a regular quadrilateral area is analyzed. The effects of different communication parameters on connectivity are simulated, and the results demonstrate that the smaller the transceiver elevation angles are, the better the network connectivity performance is. When θ1 is the same and θ2 is 50°, the connectivity performance of the network is more prominent. Finally, we numerically compared the UV network models of polygonal and circular regions. The analysis results can provide theoretical guidance for actual networking.
At present, we have begun to carry out the experiment of UV physical networking. In the next research, we will analyze and compare the simulation results and experimental results in order to realize the practical application of UV networking.
Author Contributions
Conceptualization, F.C. and Z.X.; Data curation, F.C.; Investigation, C.L.; Project administration, Z.X.; Writing—original draft, F.C. and C.L.; Writing—review & editing, Z.X. All authors have read and agreed to the published version of the manuscript.
Funding
This research received no external funding.
Conflicts of Interest
The authors declare no conflict of interest.
References
- Yong, Z.; Jian, W.; Houfei, X.; Jintong, L. Non-line-of-sight ultraviolet communication performance in atmospheric turbulence. China Commun. 2013, 10, 52–57. [Google Scholar] [CrossRef]
- Harvey, G.L. A Survey of Ultraviolet Communication Systems; Naval Research Lab: Washington, DC, USA, 1964. [Google Scholar]
- Sanderson, J.A. Optics at the naval research laboratory. Appl. Opt. 1967, 6, 2029–2043. [Google Scholar] [CrossRef]
- Shen, Z.; Ma, J.; Shan, T.; Su, P. Improved Monte Carlo Integration Models for Ultraviolet Communications. In Proceedings of the 2020 IEEE 20th International Conference on Communication Technology (ICCT), Nanning, China, 28–31 October 2020. [Google Scholar]
- Arya, S.; Chung, Y.H. A unified statistical model for Málaga distributed optical scattering communications. Opt. Commun. 2019, 463, 125402. [Google Scholar] [CrossRef]
- Kang, Y.; Zhao, J.; Wu, J.; Zhang, L.; Zhao, J.; Zhang, Y.; Zhao, Y.; Wang, X. Superior Deep-Ultraviolet Source Pumped by an Electron Beam for NLOS Communication. IEEE Trans. Electron Devices 2020, 67, 3391–3394. [Google Scholar] [CrossRef]
- Garg, K.K.; Bhatia, V. Performance Analysis of Cooperative NLOS UVC System with Receiver Diversity. In Proceedings of the 2020 National Conference on Communications (NCC), Kharagpur, India, 21–23 February 2020. [Google Scholar]
- Vavoulas, A.; Sandalidis, H.G.; Varoutas, D. Connectivity Issues for Ultraviolet UV-C Networks. IEEE/OSA J. Opt. Commun. Netw. 2011, 3, 199–205. [Google Scholar] [CrossRef]
- Zhao, T.F.; Wang, Y.; Gao, Y.Y. Connectivity performance analysis of UV-NLOS communication metwork. J. Optoelectron. Laser 2015, 26, 609–617. [Google Scholar]
- Li, C.; Li, J.; Xu, Z.; Wang, J. Study on the k-Connectivity of Ultraviolet Communication Network under Uniform Distribution of Nodes in a Circular Region. In Proceedings of the 2019 IEEE 5th International Conference on Computer and Communications (ICCC), Chengdu, China, 6–9 December 2020. [Google Scholar]
- Xu, Z. Approximate performance analysis of wireless ultraviolet links. In Proceedings of the 2007 IEEE International Conference on Acoustics, Speech and Signal Processing-ICASSP’07, Honolulu, HI, USA, 15–20 April 2007; pp. 577–580. [Google Scholar]
- Chen, G.; Xu, Z.; Ding, H.; Sadler, B.M. Path loss modeling and performance trade-off study for short-range non-line-of-sight ultraviolet communications. Opt. Express 2009, 17, 3929–3940. [Google Scholar] [CrossRef] [PubMed]
- Chen, G.; Abou-Galala, F.; Xu, Z.; Sadler, B.M. Experimental evaluation of LED-based solar blind NLOS communication links. Opt. Express 2008, 16, 15029–15068. [Google Scholar] [CrossRef]
- He, Q.; Sadler, B.M.; Xu, Z. Modulation and coding tradeoffs for non-line-of-sight ultraviolet communications. In Proceedings of the Free-Space Laser Communications IX. International Society for Optics and Photonics, San Diego, CA, USA, 2–5 August 2009; Volume 7464, pp. 74640H1–74640H12. [Google Scholar]
- Zhao, T.; Gao, Y.; Wu, P.; Xie, Y.; Song, P. A networking strategy for three-dimensional wireless ultraviolet communication network. Optik 2017, 151, 123–135. [Google Scholar] [CrossRef]
- Bettstetter, C. On the minimum node degree and connectivity of a wireless multihop network. In Proceedings of the 3rd ACM International Symposium on Mobile ad Hoc Networking & Computing, Lausanne, Switzerland, 9–11 June 2002; Volume 6, pp. 80–91. [Google Scholar]
- Bettstetter, C.; Krause, O. On border effects in modeling and simulation of wireless ad hoc networks. In Proceedings of the 3rd IEEE International Conference on Mobile and Wireless Communication Networks (WMAN), Stockholm, Sweden, 9–11 September 2001. [Google Scholar]
Short Biography of Authors
Fang Cao is a lecturer in Nanjing University of Science and Technology Zijin College. And her research direction is Photoelectric information processing.
Cheng Li is a master in Army Engineering University of PLA, College of Communication Engineering. And his research direction is wireless optical communication.
Zhiyong Xu is a professor in Army Engineering University of PLA, College of Communication Engineering. And his research direction is wireless optical communication.
Publisher’s Note: MDPI stays neutral with regard to jurisdictional claims in published maps and institutional affiliations. |
© 2021 by the authors. Licensee MDPI, Basel, Switzerland. This article is an open access article distributed under the terms and conditions of the Creative Commons Attribution (CC BY) license (https://creativecommons.org/licenses/by/4.0/).