Article

Modeling and Measurement of Thermal Effect in a Flashlamp-Pumped Direct-Liquid-Cooled Split-Disk Nd:LuAG Ceramic Laser Amplifier

1
Key Laboratory of High Power Laser and Physics, Shanghai Institute of Optics and Fine Mechanics, Chinese Academy of Sciences, Shanghai 201800, China
2
Center of Materials Science and Optoelectronics Engineering, University of Chinese Academy of Sciences, Beijing 100049, China
3
Key Laboratory of Materials for High Power Laser, Shanghai Institute of Optics and Fine Mechanics, Chinese Academy of Sciences, Shanghai 201800, China
*
Authors to whom correspondence should be addressed.
Photonics 2021, 8(4), 97; https://doi.org/10.3390/photonics8040097
Submission received: 28 February 2021 / Revised: 21 March 2021 / Accepted: 26 March 2021 / Published: 30 March 2021
(This article belongs to the Special Issue Laser Amplifiers)

Abstract

:
In this paper, a model to predict the thermal effects in a flashlamp-pumped direct-liquid-cooled split-disk Nd:LuAG ceramic laser amplifier has been presented. In addition to pumping distribution, the model calculates thermal-induced wavefront aberration as a function of temperature, thermal stress and thermal deformation in the gain medium. Experimental measurements are carried out to assess the accuracy of the model. We expect that this study will assist in the design and optimization of high-energy lasers operated at repetition rate.

Graphical Abstract

1. Introduction

High-energy repetitive rate solid-state lasers have been used in a wide range of applications, such as laser particle acceleration [1], industrial material processing [2,3] and inertial confinement fusion [4,5]. Current and previous high-energy lasers development projects include Mercury laser developed by Lawrence Livermore National Laboratory (LLNL) with an output energy of 65 J at 10 Hz using Yb:S-FAP as a gain medium [6], HAPLSE pump laser with 101 J at 3.3 Hz using Nd:phosphate glass [7], DiOPOLE100 with 105 J at 10 Hz using ceramic Yb:YAG [8], Premiumlite-YAG laser with 81 J at 10 Hz based on ceramic Nd:YAG. In the condition of high-repetition rate operation, split-disk gas/liquid-cooled amplifier designs are adopted in these laser systems to balance aperture and gain length scaling, which provides a long gain length while maintaining a high surface to volume ratio from which to remove residual heat. In addition, the choice of gain medium is also important. Compared to Nd:phosphate glass and Yb:S-FAP, transparent YAG ceramics have several advantages such as high thermal conductivity, high optical quality, robust mechanical strength and the ability to be made into large aperture sizes, which makes them perfect for use in high average power laser systems as laser gain media. Comparison of Nd:phosphate glass, ceramic/crystal Yb:YAG and crystal Yb:S-FAP has been discussed in detail in Ref. [9]. However, ceramic Yb:YAG needs to be cooled to the cryogenic temperature for efficient operation, while the saturation fluence of ceramic Nd:YAG is too low for energy storage at high density, thus a number of gain modules are needed to achieve high energy; for example, there are six gain modules utilized in a Premiumlite-YAG laser system.
Ceramic Nd:LuAG as a new generation of laser materials has attracted much attention. Its excellent properties, such as high thermal conductivity (8 W/m/K), long fluorescence life time (265 μs) and moderate saturation intensity (1.93 J/cm2), meet requirements for efficient, high-average-power operation. Recently, several kinds of high-energy Nd:LuAG ceramic laser amplifiers have been proposed and demonstrated [10,11,12,13]. In 2016, a diode-pumped active mirror ceramic Nd:LuAG amplifier produced an output energy of 1.52 J at 10 Hz in a 10 ns [14]. In 2019, their further work on a diode-pumped nanosecond distributed active mirror amplifier chain with 50-mm aperture ceramic Nd:LuAG and 10 J/10 Hz was demonstrated [10]. To date, all of the Nd:LuAG ceramic laser amplifiers are pumped by laser diode. Actually, for economic and industrial applicability, Xe-flashlamp as pumping source is another option, however, at a risk of severe thermal effects, which is the ultimate limitation for scaling average power.
In this paper, we propose a flashlamp-pumped direct-liquid-cooled split-disk Nd:LuAG ceramic laser amplifier and a simulation model to predict the thermal effect in the gain medium is presented. In addition to pumping distribution, the model calculates thermally induced wavefront aberration as a function of temperature, thermal stress and thermal deformation in the gain medium. Experimental measurements are carried out to access the accuracy of the model. Under the pump condition of 1500 V, the predicted total wavefront aberration is 2.08 λ, which is basically consistent with the measured result of 2.685 λ. We expect that this study will assist in the design and optimization of high-energy lasers operated at repetition rate.

2. Direct-Liquid-Cooled Split-Disk Laser Amplifier

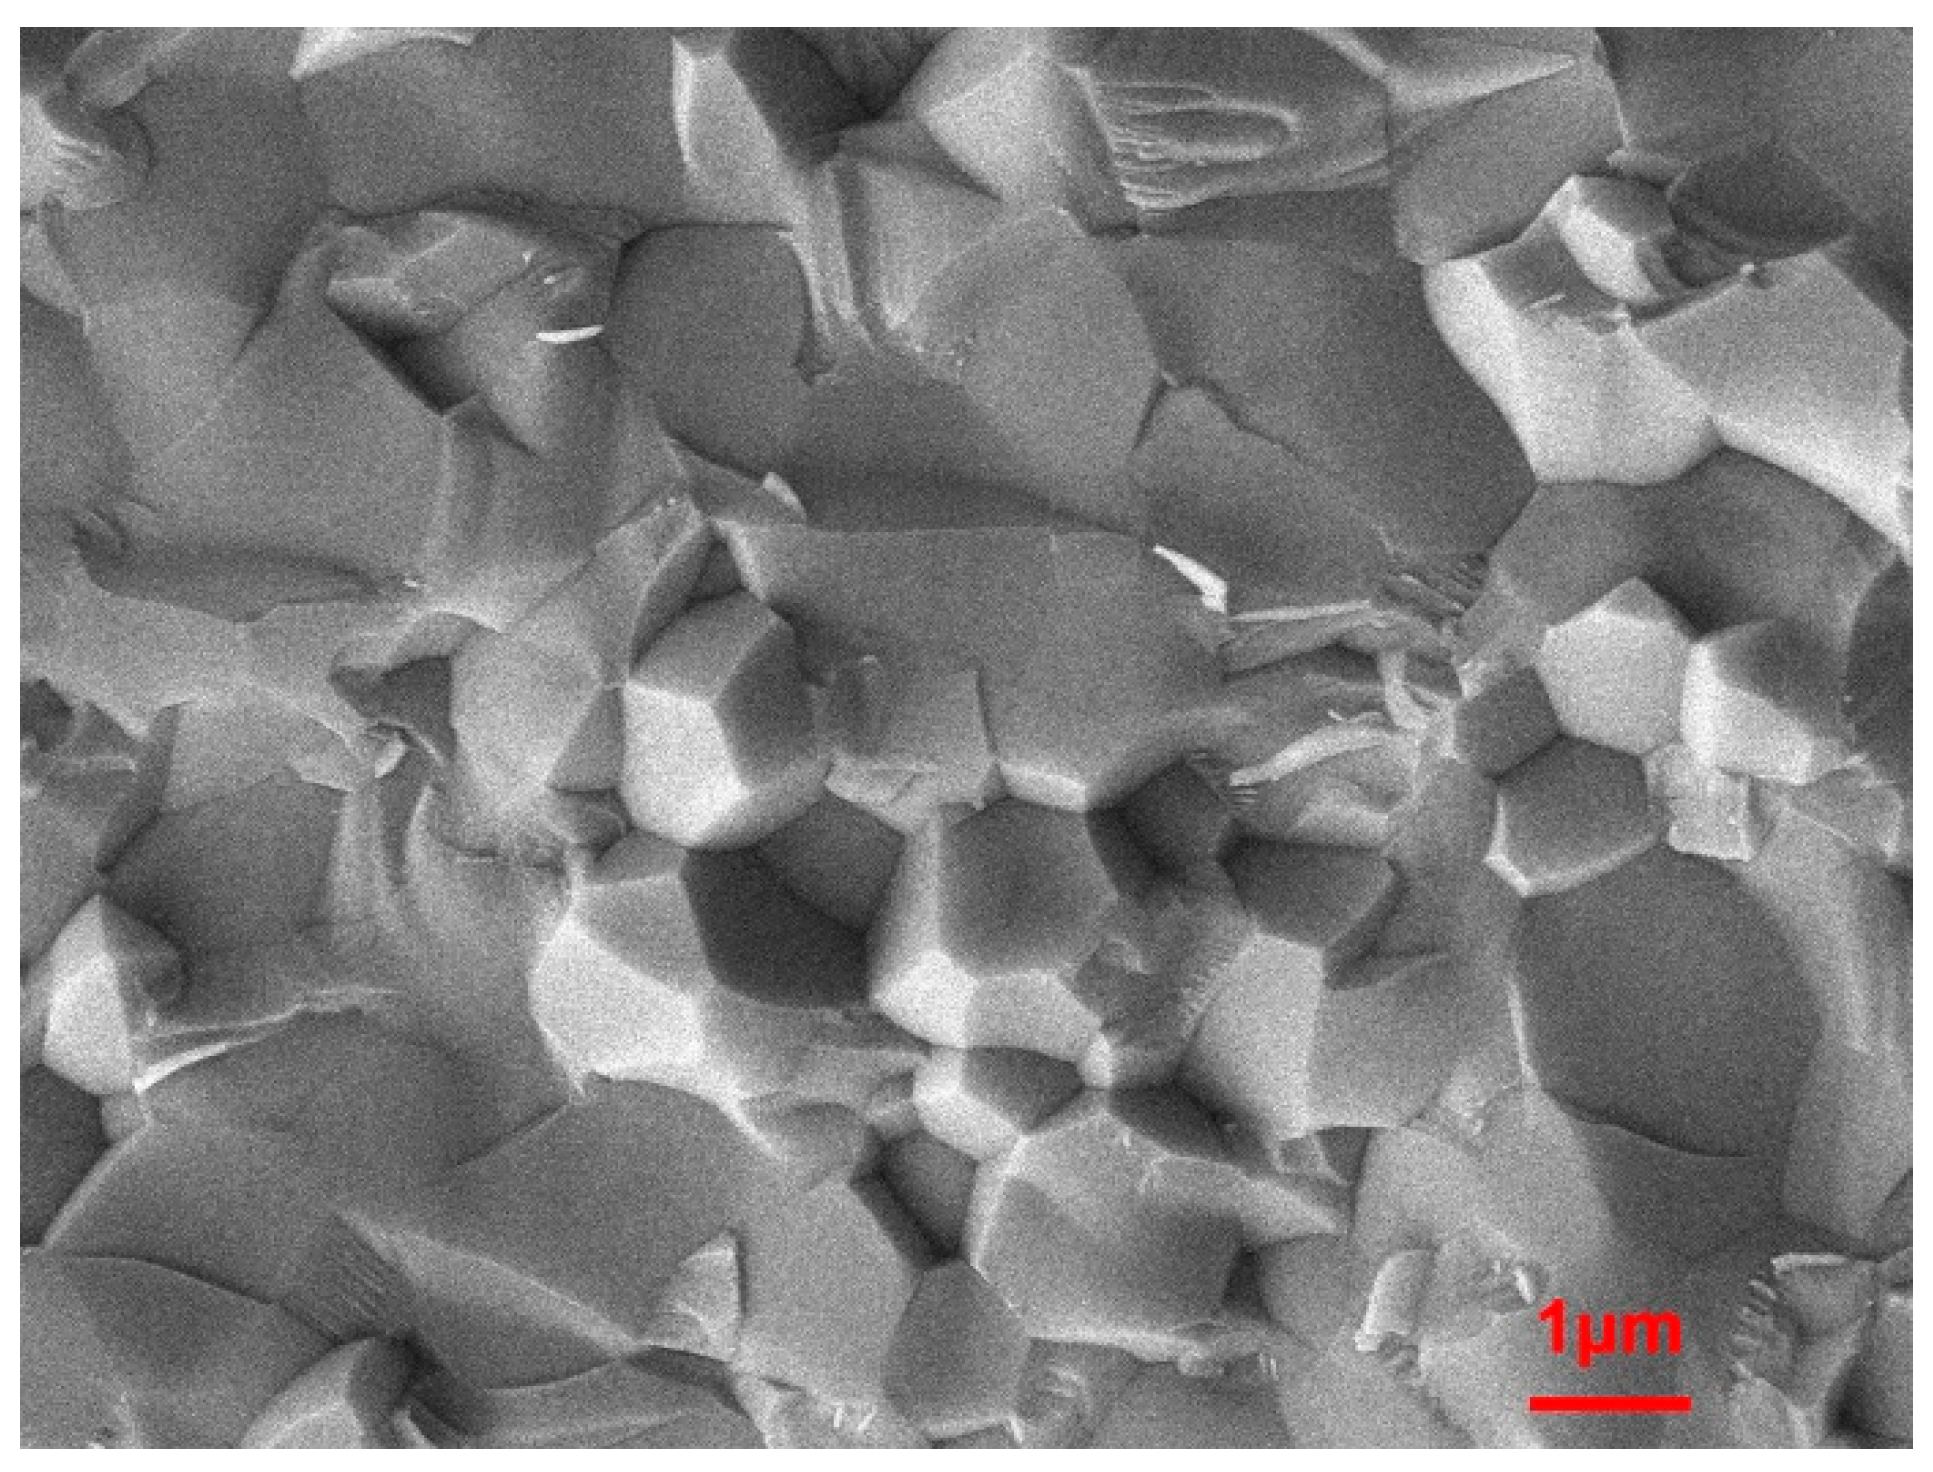
2.1. Nd:LuAG Ceramics

Unlike single-crystal preparation [15], the Nd:LuAG transparent ceramics were prepared by solid-state reaction using high purity micron commercial raw materials Nd2O3, Al2O3, Lu2O3. The raw materials are mixed according to the proportion and milled by alumina grinding balls in alcohol for 24 h. After milling, it is dried at 80 °C for 12 h, and then milled by mortar and pestle to obtain the mixture powders. The mixture powders are sieved though a 200-mesh sieve and then presintered at 900 °C for 6 h to remove residual impurities. Then, the powders are uniaxially pressed and followed by an isostatic cold pressing under 200 MPa to obtain green bodies with a size of 80 mm × 60 mm × 8 mm. The ceramic green body was sintered in vacuum at 1750 °C for 10 h, wherein the degree of vacuum is 10−3 Pa, and then, hot isostatic pressing was performed at 1750 °C for 5 h. After double-sided polishing, transparent ceramic samples with a thickness of 5.5 mm have a transmittance of up to 80% and good optical uniformity.
In the process of Nd:LuAG ceramics, we reduce residual impurities by selecting high-purity raw materials and a lower amount of sintering aids. In addition, we also adopt other techniques to accelerate the discharge of pores and reduce the formation of pores in the ceramics. Figure 1 shows the scanning electron microscope (SEM) micrograph of Nd:LuAG ceramics. It can be seen that no obvious micropores are found in the ceramic samples.

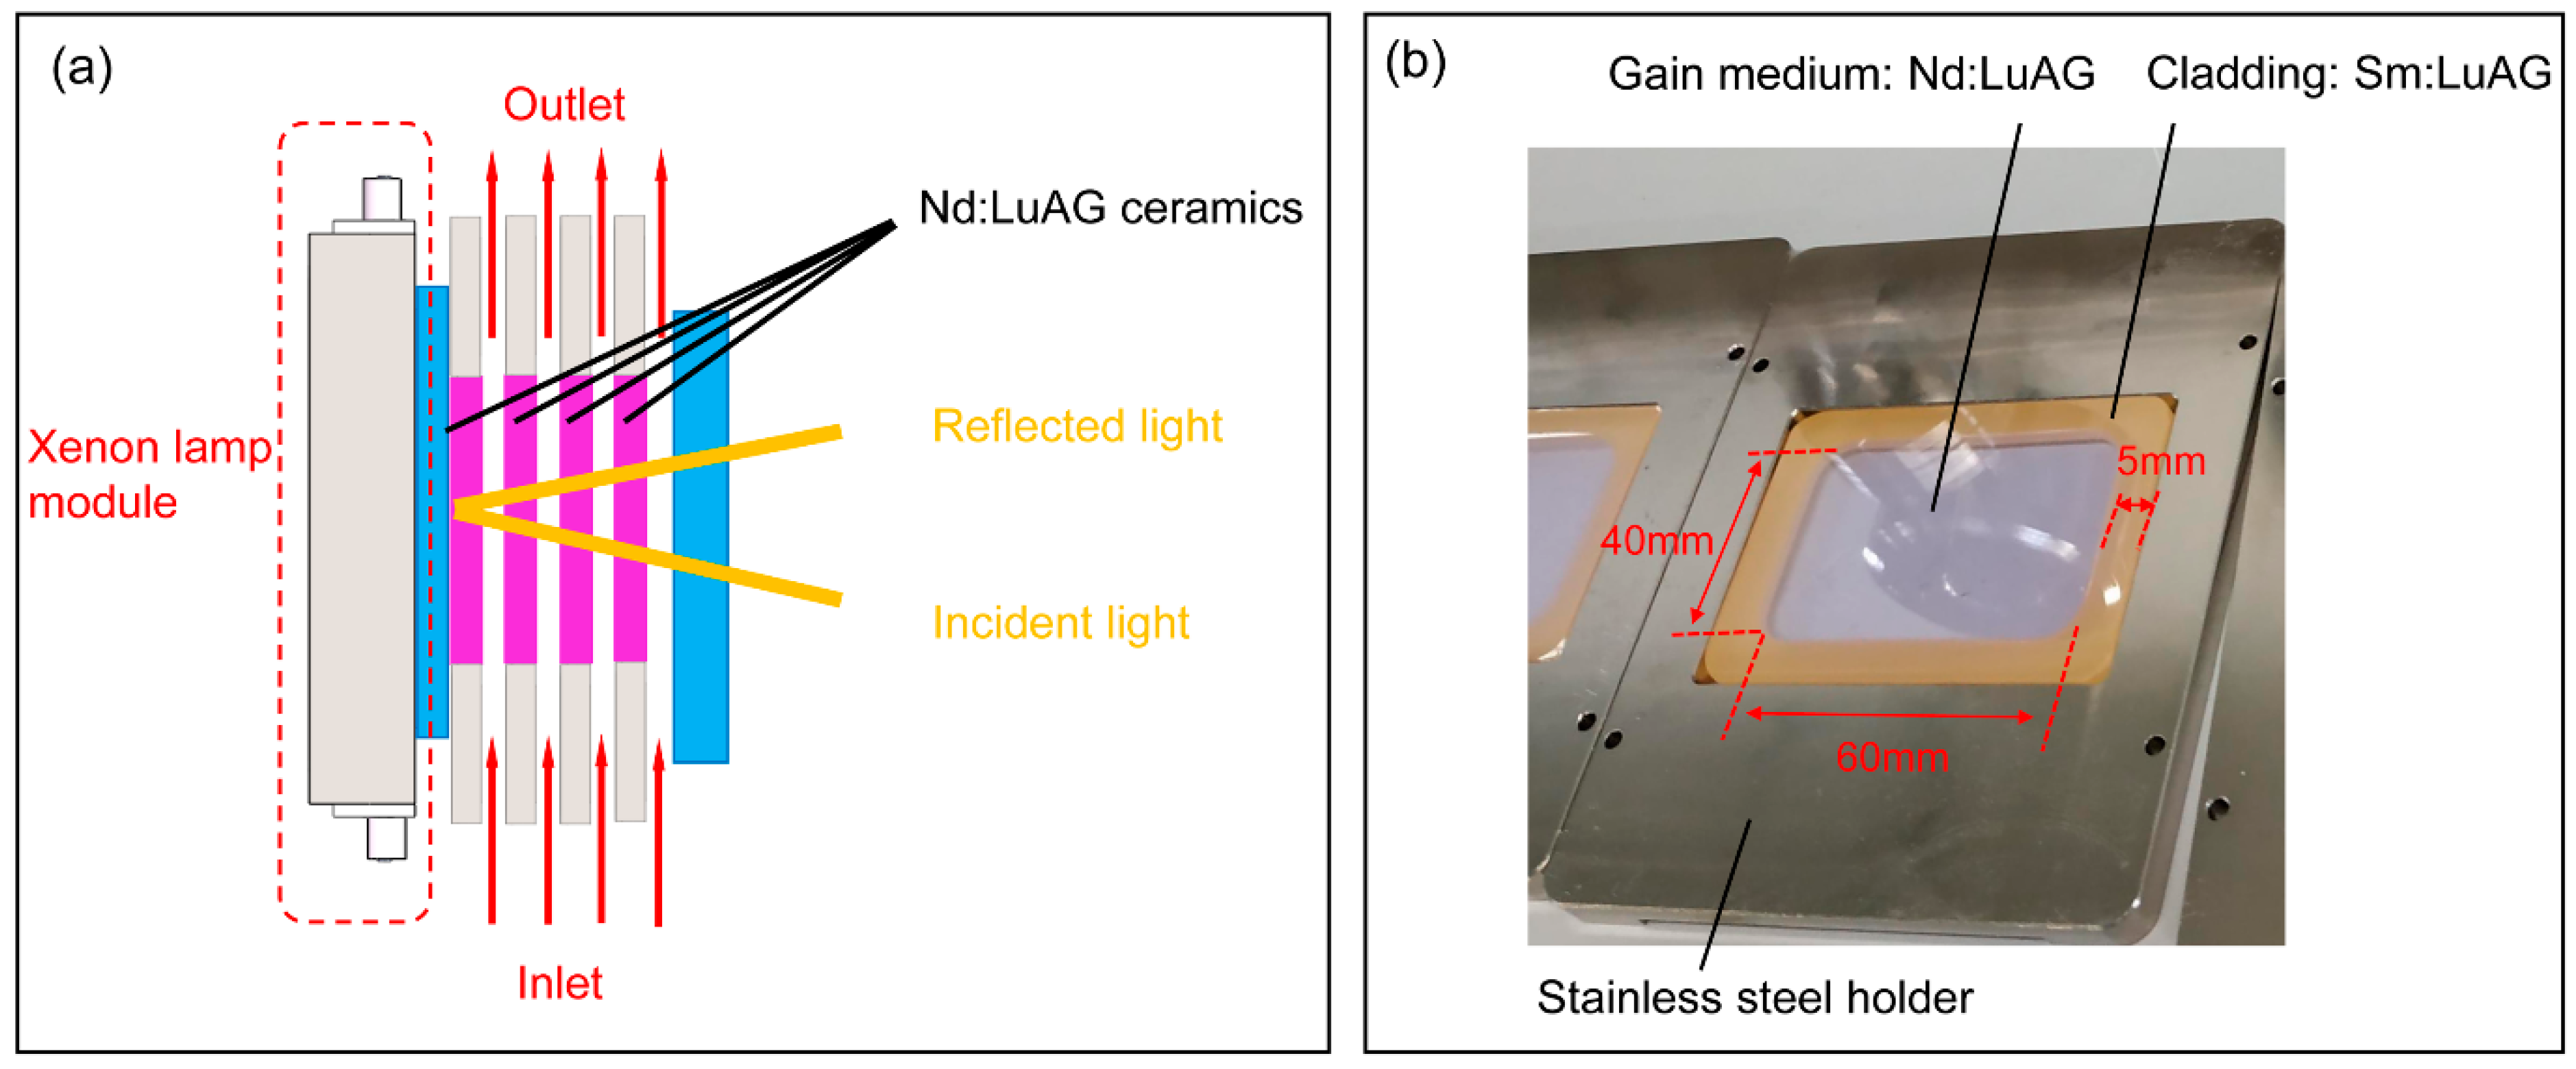
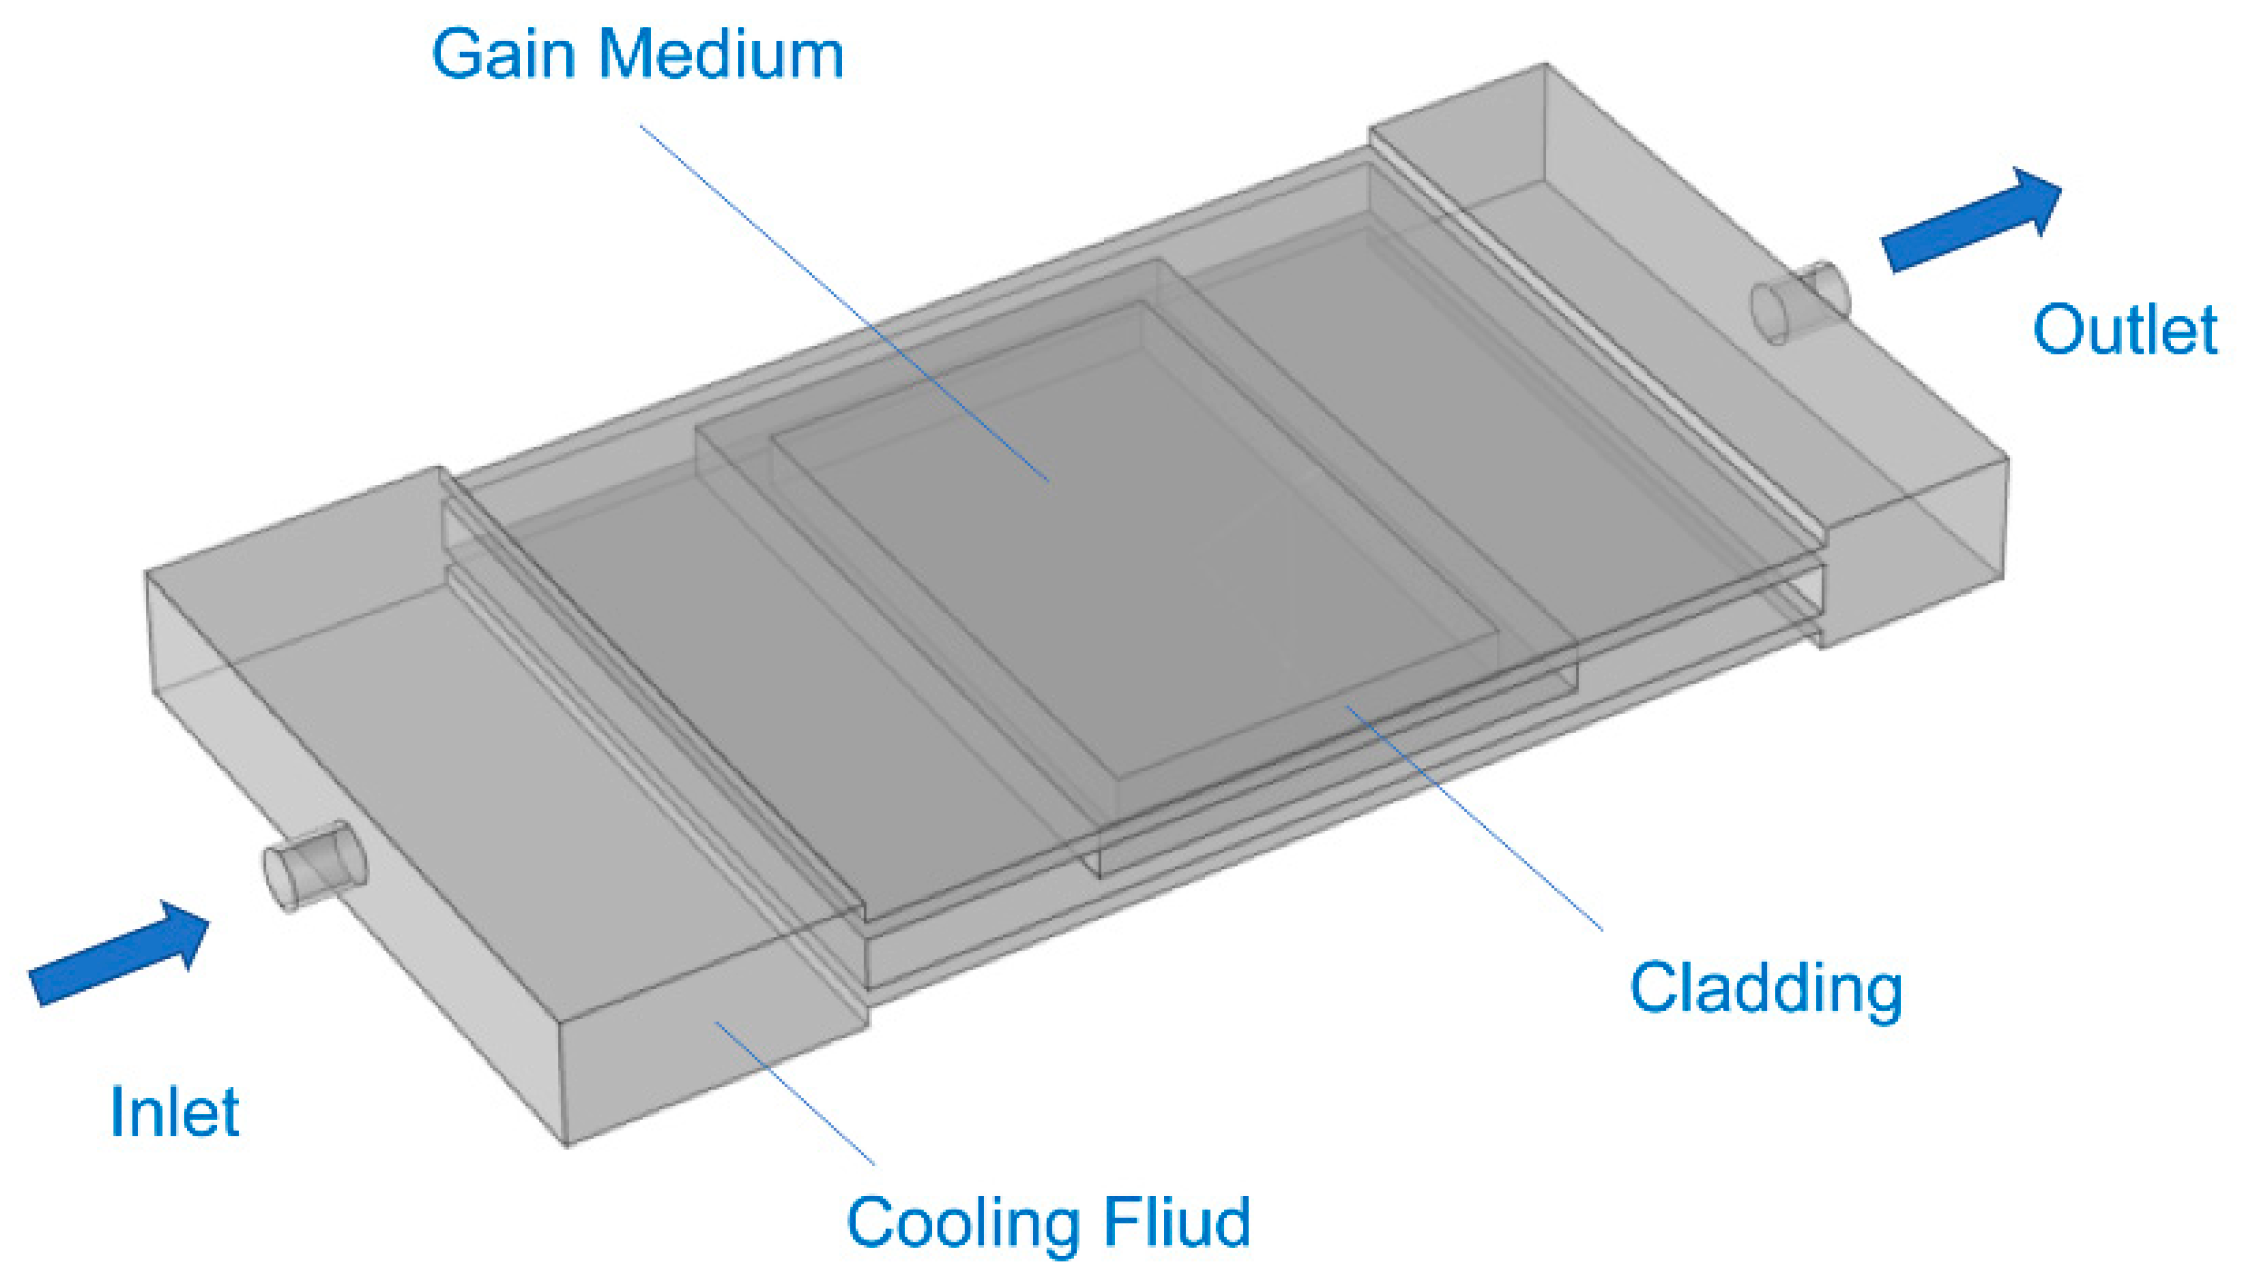
2.2. Structure of Laser Amplifier

The schematic diagram of the direct-liquid-cooled split-disk laser amplifier is shown in Figure 2a. The whole laser amplifier includes two parts: a pump module and a gain medium module. In the pump module, four xenon lamps with arc length of 100 mm are located in a sealed cavity and cooled by a set of cooling fluid device, while in the gain medium module, four Nd:LuAG (with doping concentration of 1.0 at.%) disks with stainless steel holder are in another sealed cavity, which is shown in Figure 2b. The size of the Nd:LuAG disk is 70 mm× 50 mm× 5.5 mm, which includes cladding with the thickness of 5 mm. The gain region of Nd:LuAG is 60 mm × 40 mm. Both larger surfaces of Nd:LuAG were antireflection (AR)-coated for 1064 nm and immersed in the coolant. The fluid channel used for cooling has been specially designed. There is a fluid homogenizer in the inlet region, which is not shown in Figure 2. The function of the fluid homogenizer is to make the cooling fluid velocity more uniform. The thickness of cooling fluid is 2 mm and the maximum flow rate of the cooling fluid circulation device used for the gain medium module is 6 L/min.
There is a quartz window with 1064-nm highly reflective (HR) coating at one face between the pump module and the gain medium module. The signal laser beam was reflected by this quartz window after entering four pieces of Nd:LuAG, which is shown in Figure 2a.

2.3. Preliminary Thermal Evaluation of Laser Amplifier

The small signal gain of this laser amplifier at different pump voltages was measured. The results are shown in Figure 3.
It can be seen from the red line shown in Figure 3 that small signal gain G increases with pump voltage. According to the laser amplification theory, stored energy E s t can be calculated by the expression, E s t = ln ( G ) E s A , where E s represents the saturated stored energy density of Nd:LuAG, and A is the area of the gain. Therefore, calculated stored energy also increases with pump voltage, as shown by the black line in Figure 3. Under the pump voltage of 1500 V at 1 Hz, the maximum small signal gain is 1.56, corresponding to a stored energy of 10 J. Furthermore, the thermal performance was simulated assuming: a stored energy of 10 J in pumped region of the disk; heat deposited in gain medium is scaled based on the stored energy using a normalized heating parameter, χ = 3.25 [16]. It is noted that the closer the gain medium was to the xenon lamp, the more pump light it absorbed. For the convenience of estimating total deposited heat power, four pieces of Nd:LuAG are assumed to absorb the same amount of pump light. The estimated heating power is the initial condition of heat source for the next thermal analysis.

3. Modeling of Direct-Liquid-Cooled Split-Disk Laser Amplifier

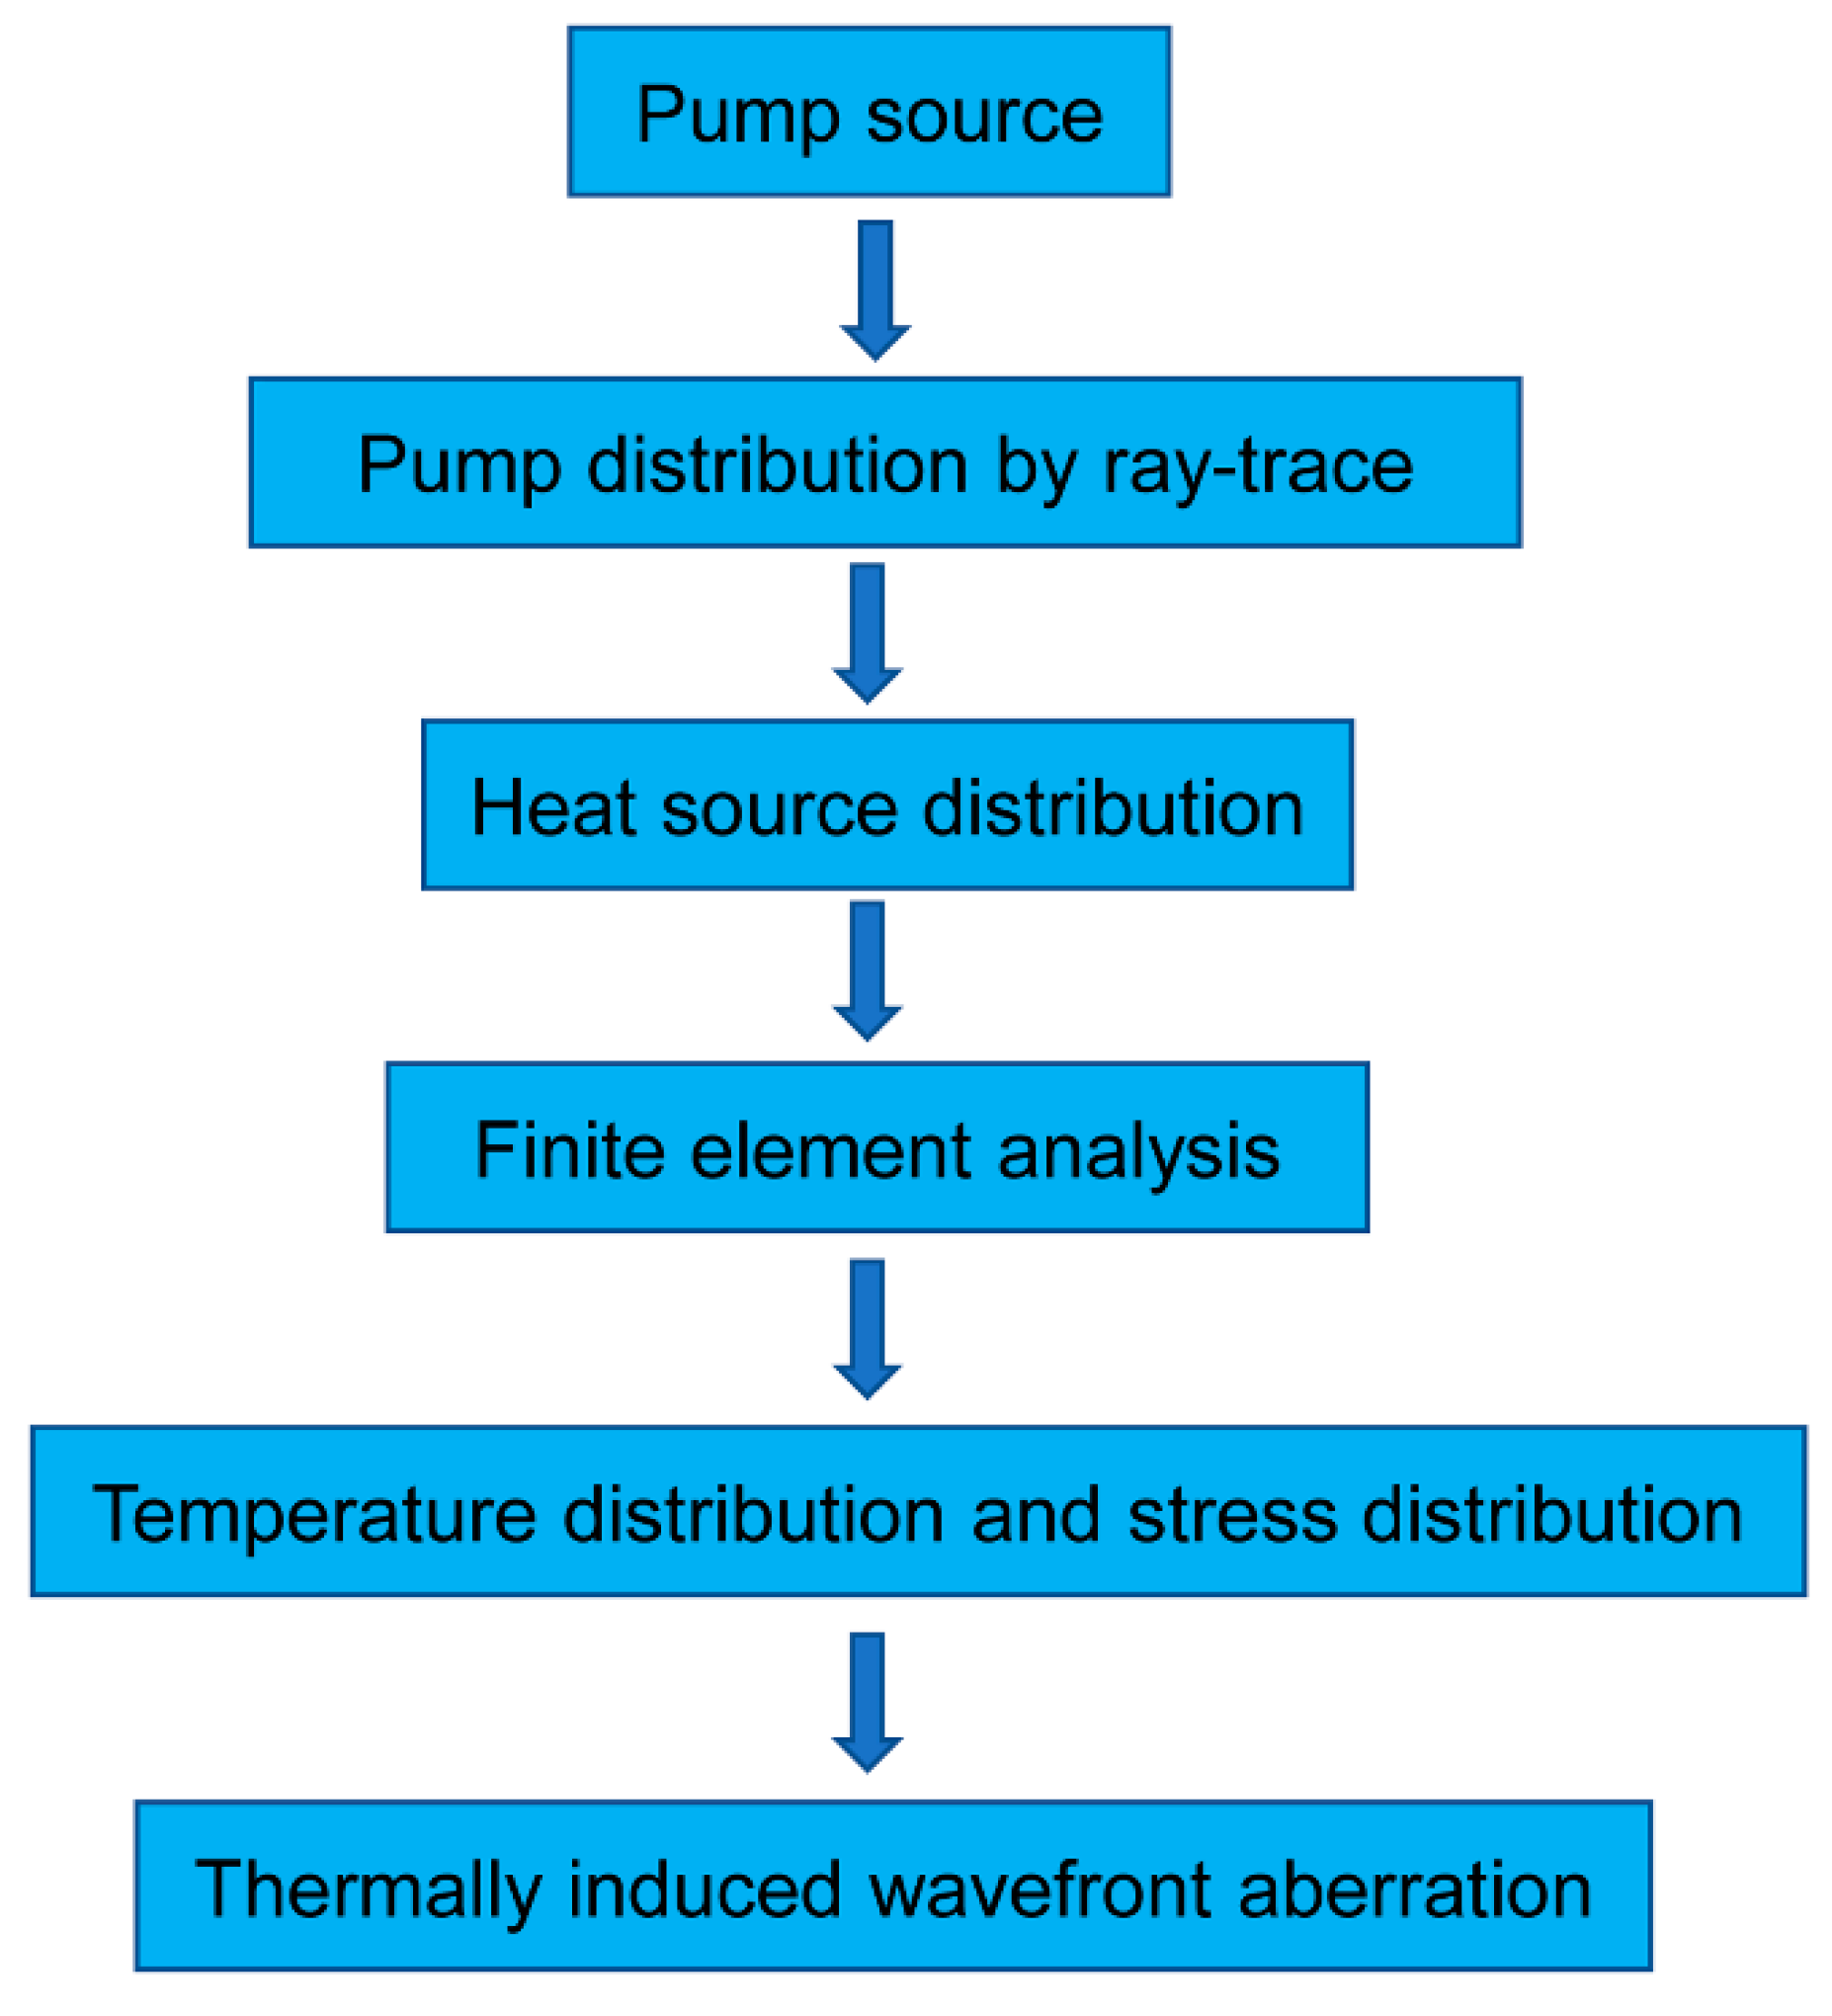
3.1. Modeling of Thermal Effect in the Laser Amplifier

The model described in this section is divided into three parts, namely:
  • Xenon lamp radiation model, to calculate the pump distribution in Nd:LuAG.
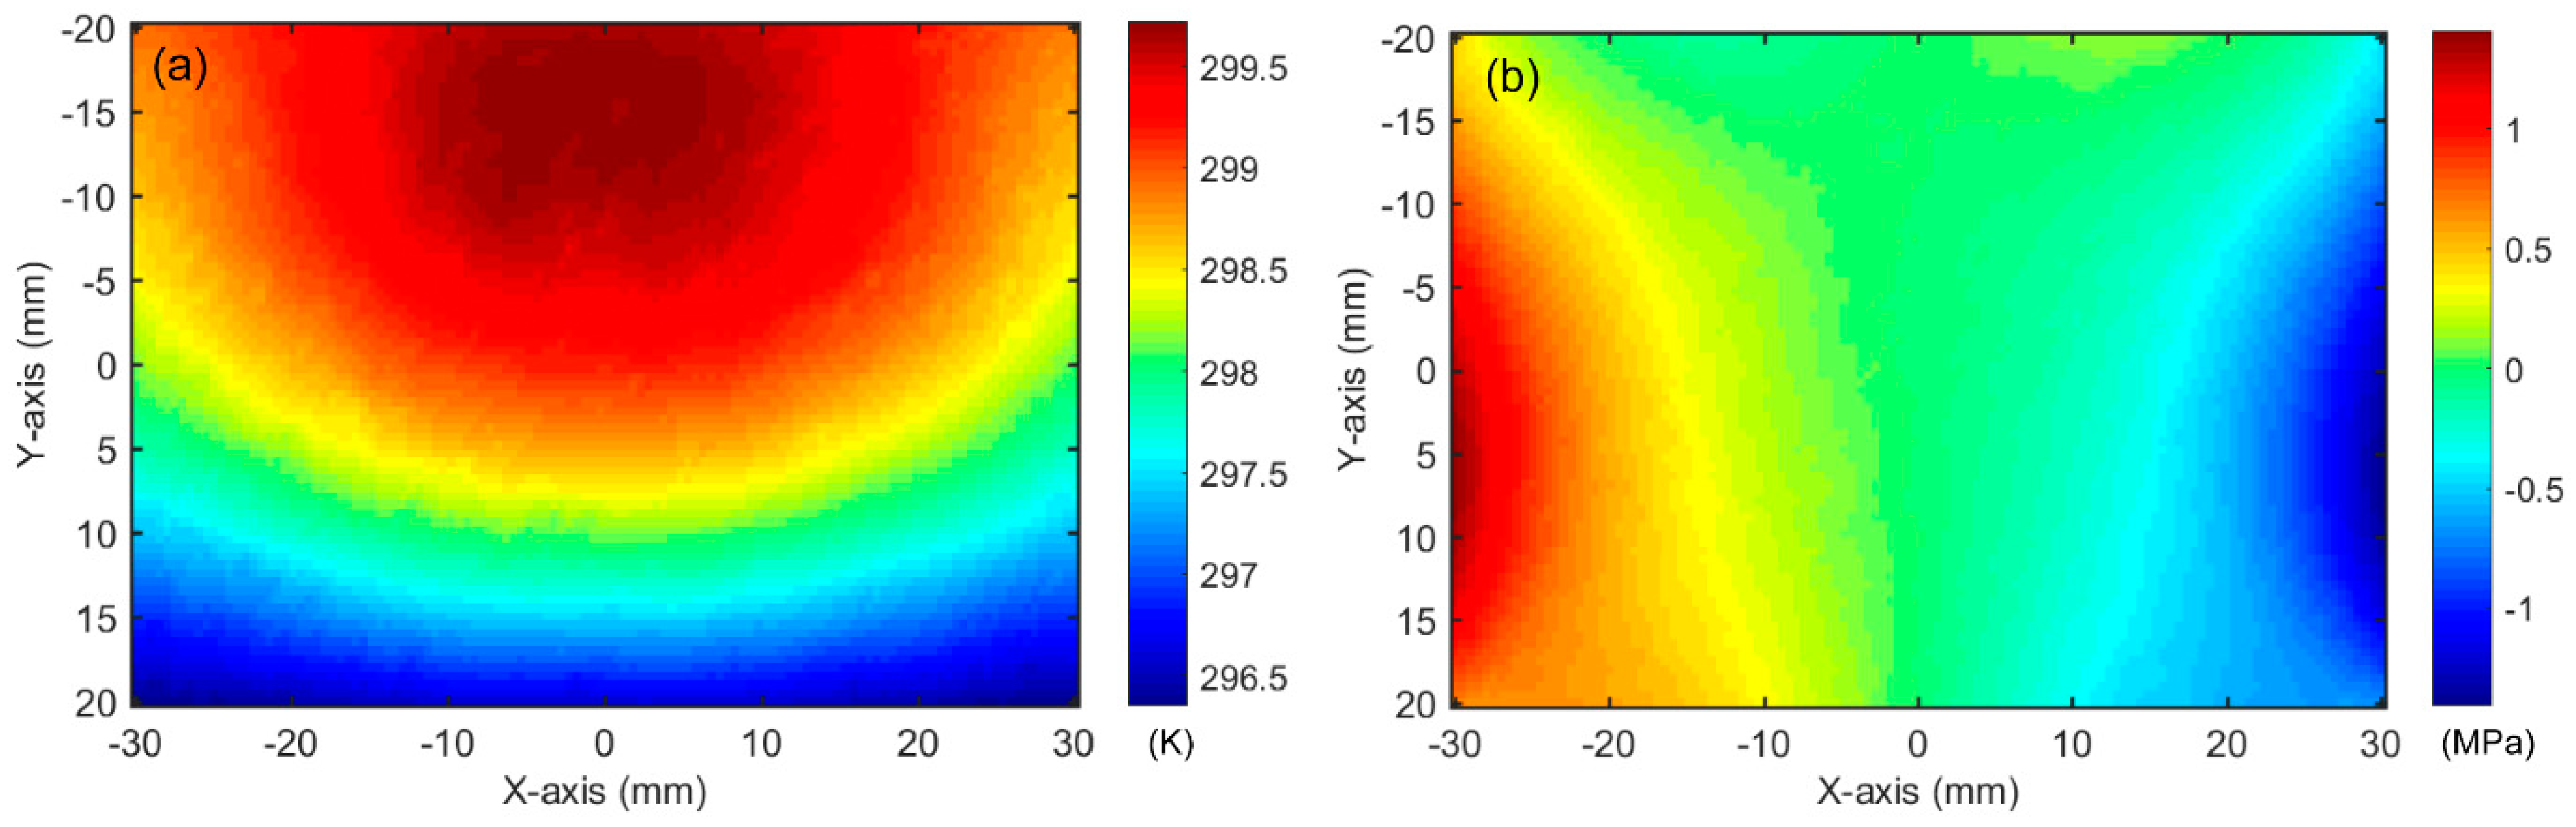
  • Thermal-fluid–solid multiphysics model, to calculate the temperature and stress of Nd: LuAG.
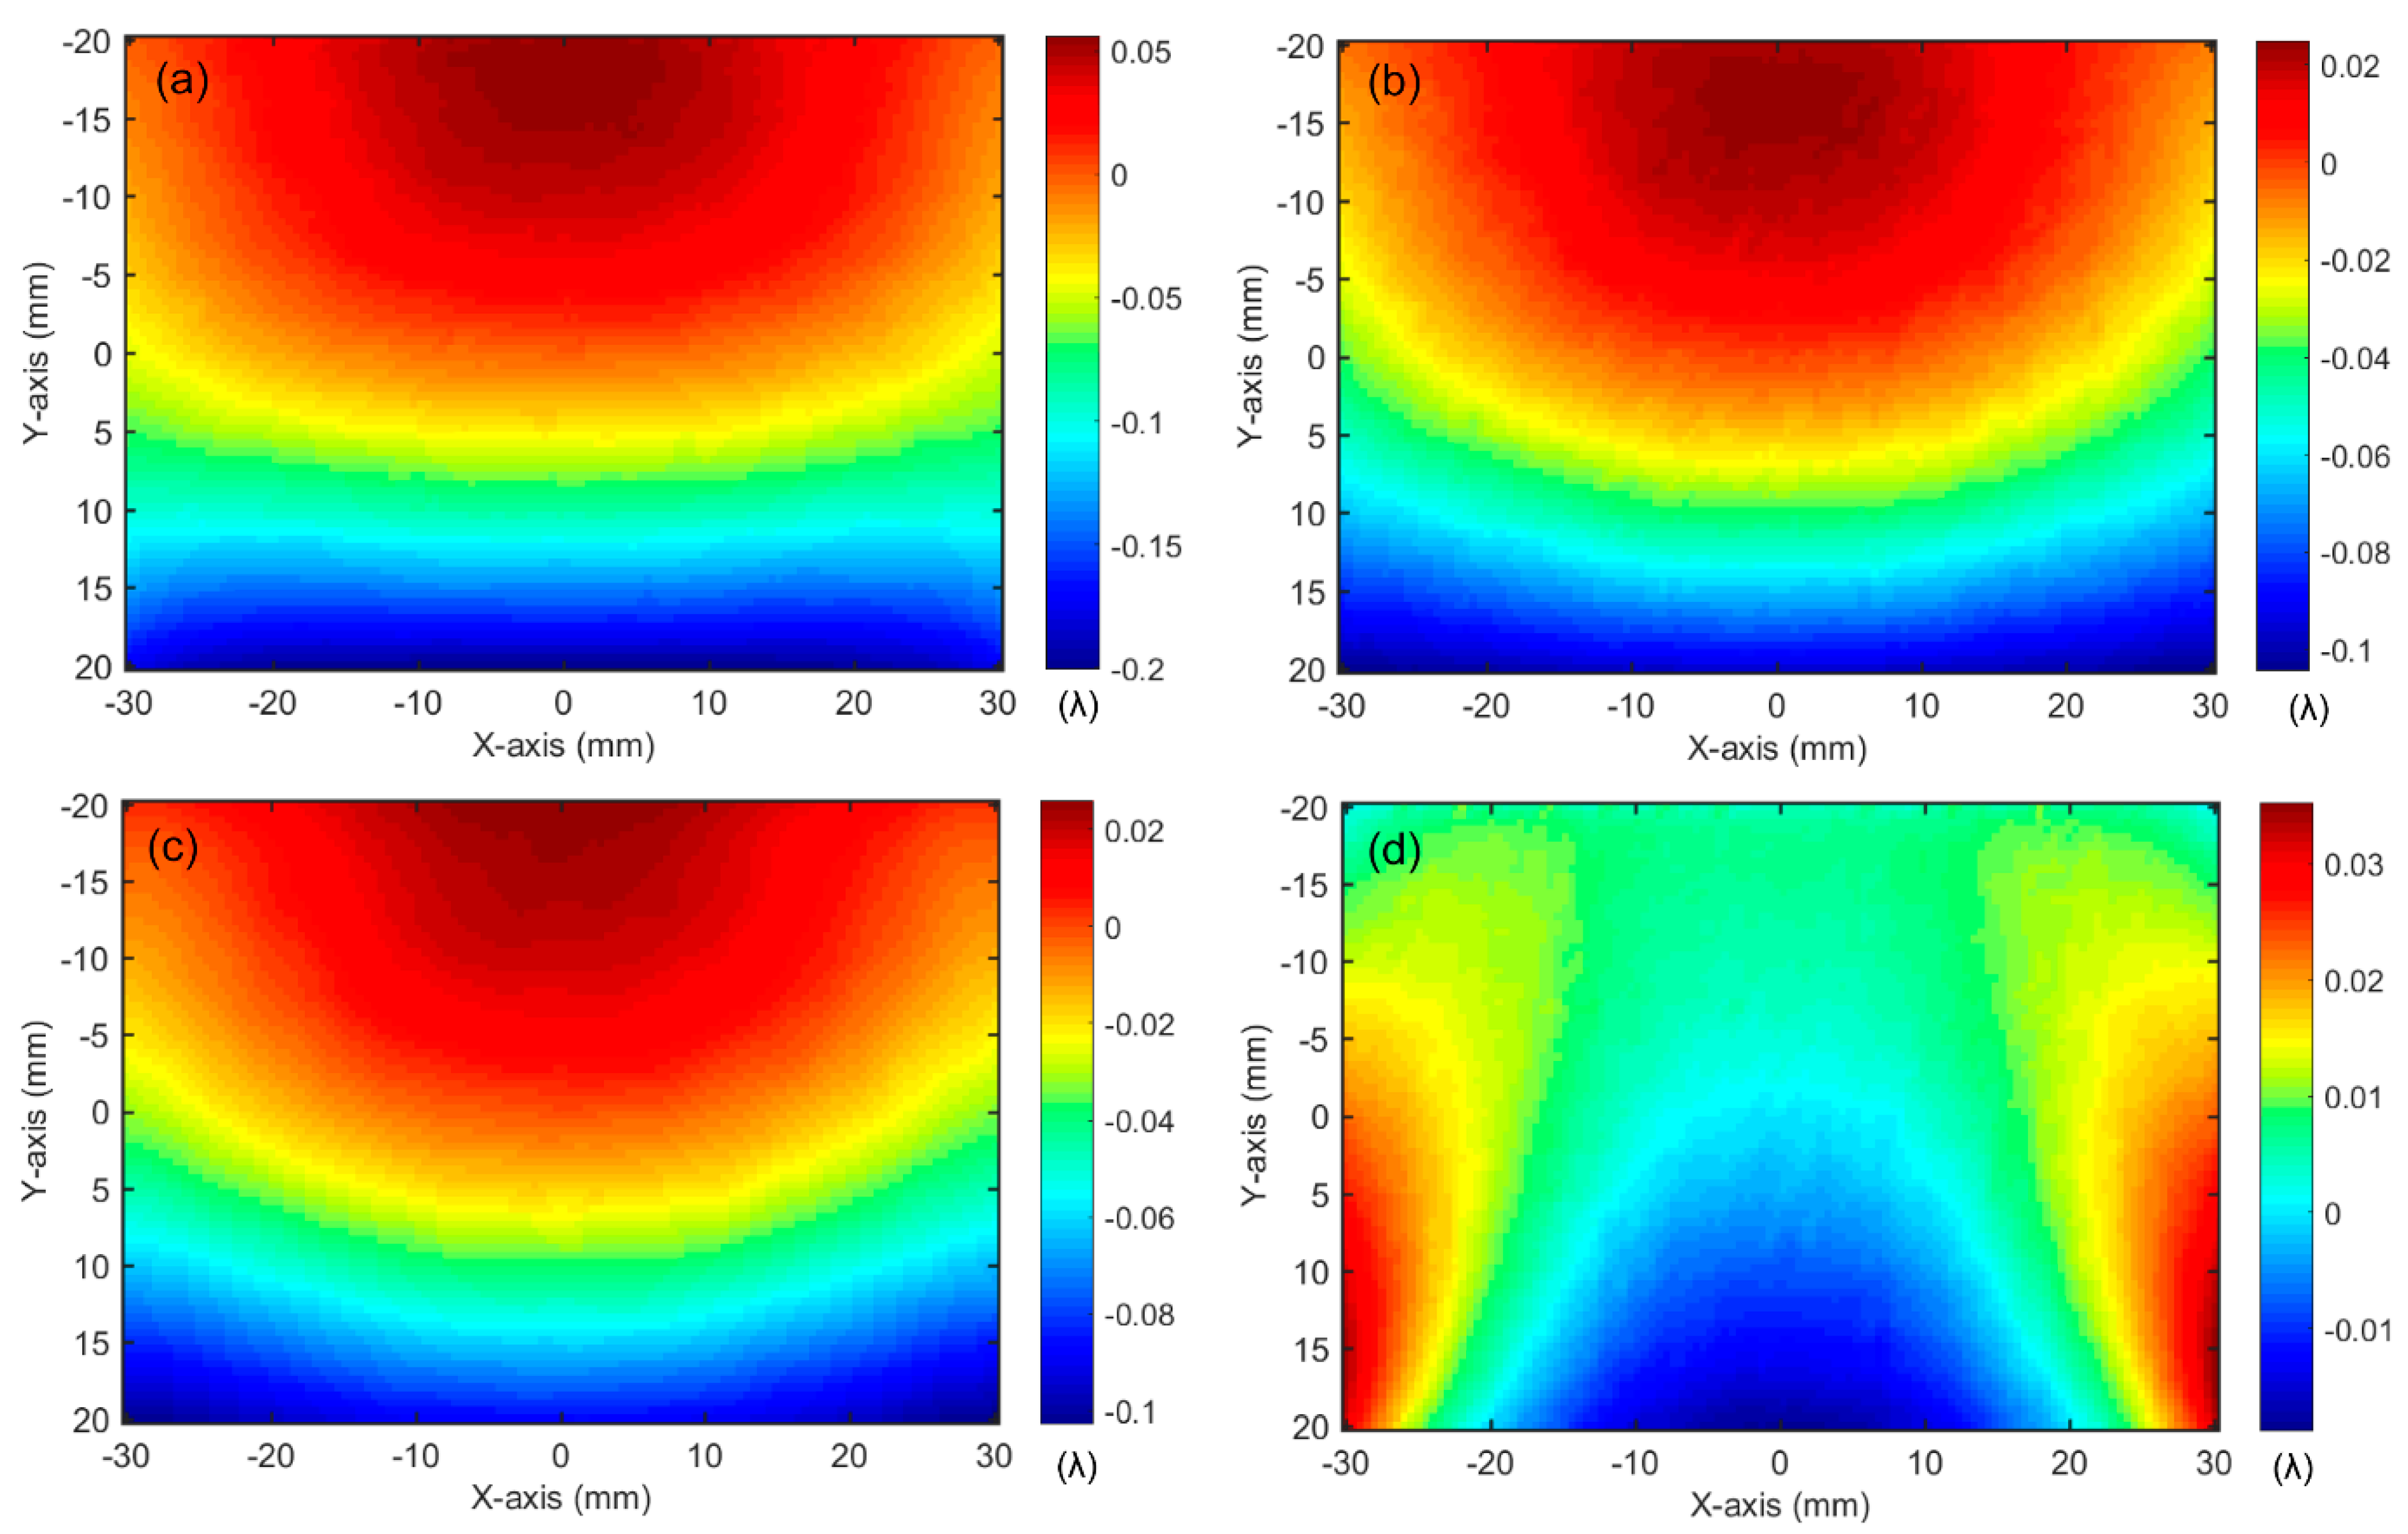
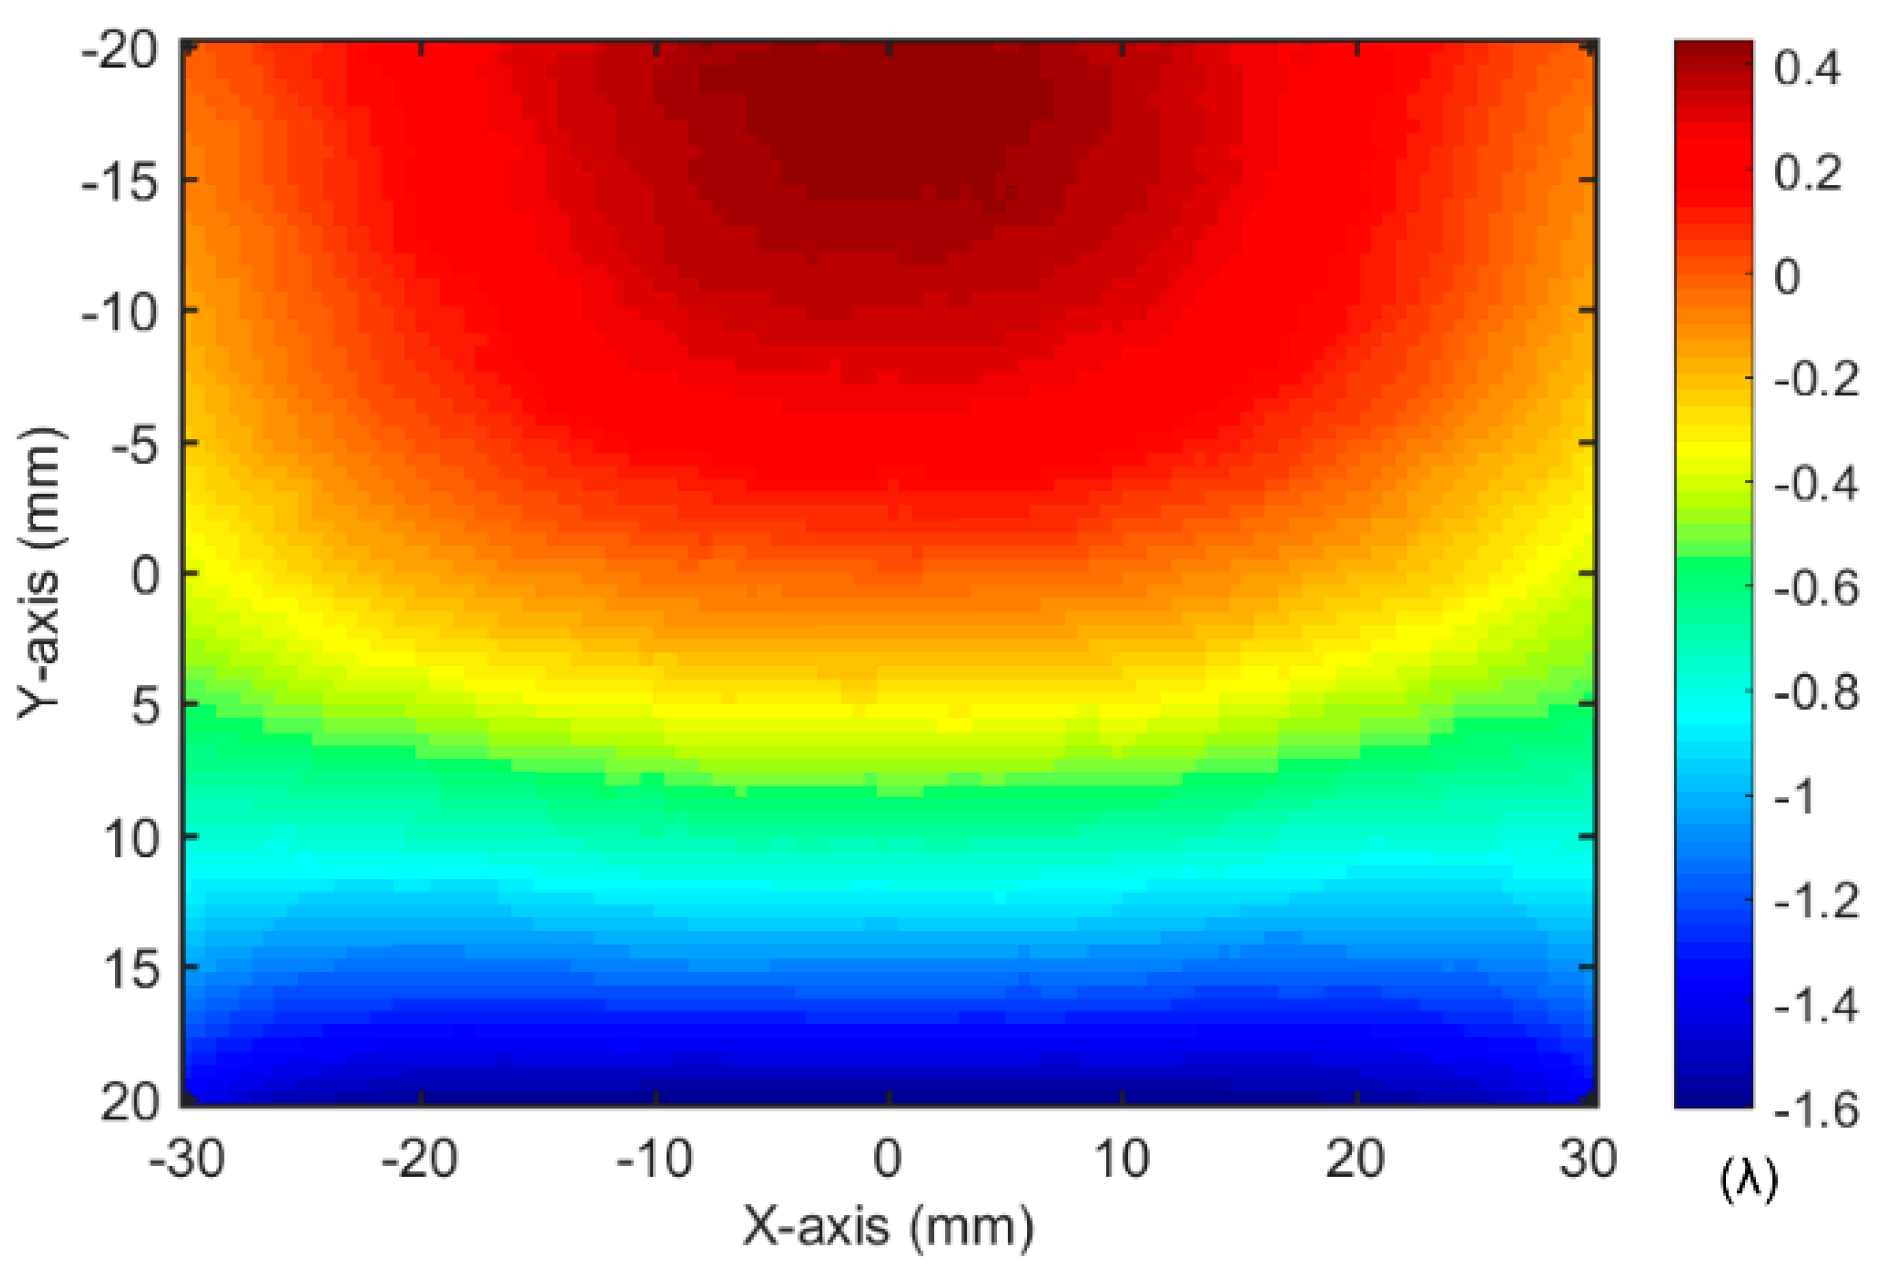
  • Thermally induced wavefront model, to calculate the single-pass thermally induced wavefront aberration of Nd:LuAG.
The modeling process can be concisely described. The first step is to determine the pump distribution in Nd:LuAG ceramic according to the pump source and pump transmission structure. This process is mainly completed by the ray tracing software. In the second step, the pump distribution obtained is used as the heat source distribution in the gain medium. The temperature, stress and deformation distribution of Nd:LuAG can be calculated by finite element calculation software according to the size, photothermal parameters and boundary conditions of Nd:LuAG; In the third step, based on data obtained in the second step, the thermally induced wavefront can be finally calculated. The thermal simulation flow chart of laser amplifier is shown in the Figure 4.

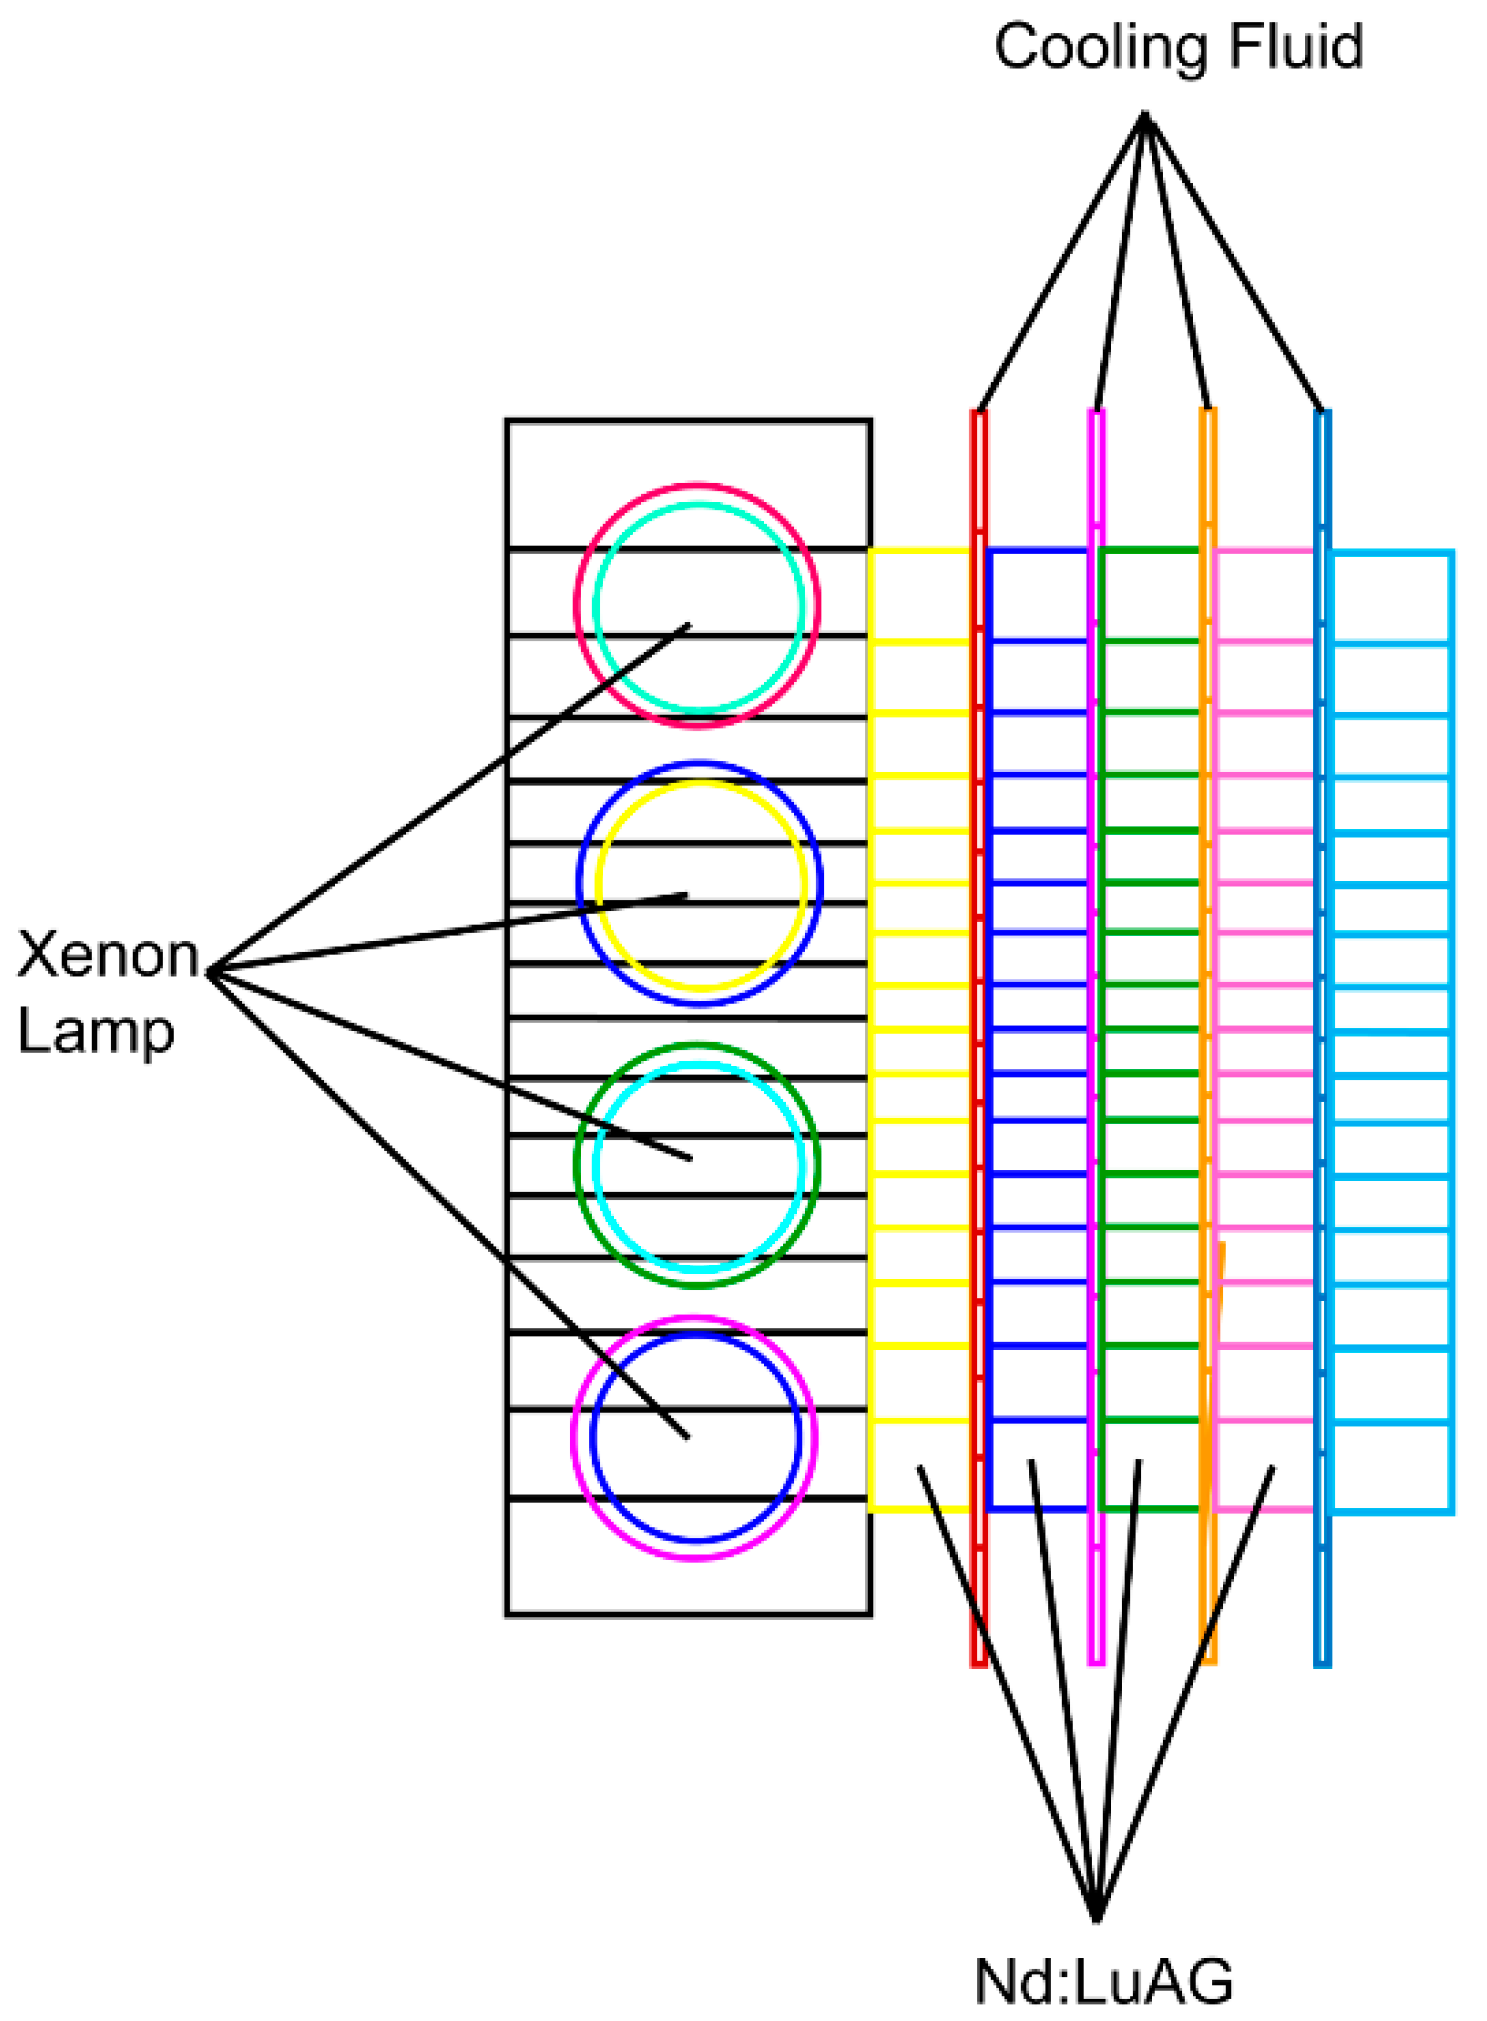
3.2. Xenon Lamp Radiation Model

The schematic diagram of the xenon lamp radiation model is shown in Figure 5. Four close-packed xenon lamps, as pump source, were located in the pump cavity. Four pieces of Nd:LuAG, as gain media, were located in front of the pump source from far to near. Xenon lamps radiate light in all directions, which was absorbed by front gain media. The main purpose of this model is to obtain the pump distribution in Nd:LuAG.
Figure 6 shows the calculated result of pump distribution. It can be seen that the strong area of the pump intensity is concentrated in the center of Nd:LuAG, whereas the pump intensity in the surrounding area is lower than that in the center. This is because the radiated light is in all directions and the light around the edges cannot be absorbed by Nd:LuAG. As a result, the pump intensity in the surrounding area is lower than in the center. By optimizing the number and arrangement of xenon lamps, the pump distribution will be more uniform. This pumping distribution can be used as an initial condition of heat distribution in the thermal effect simulation.

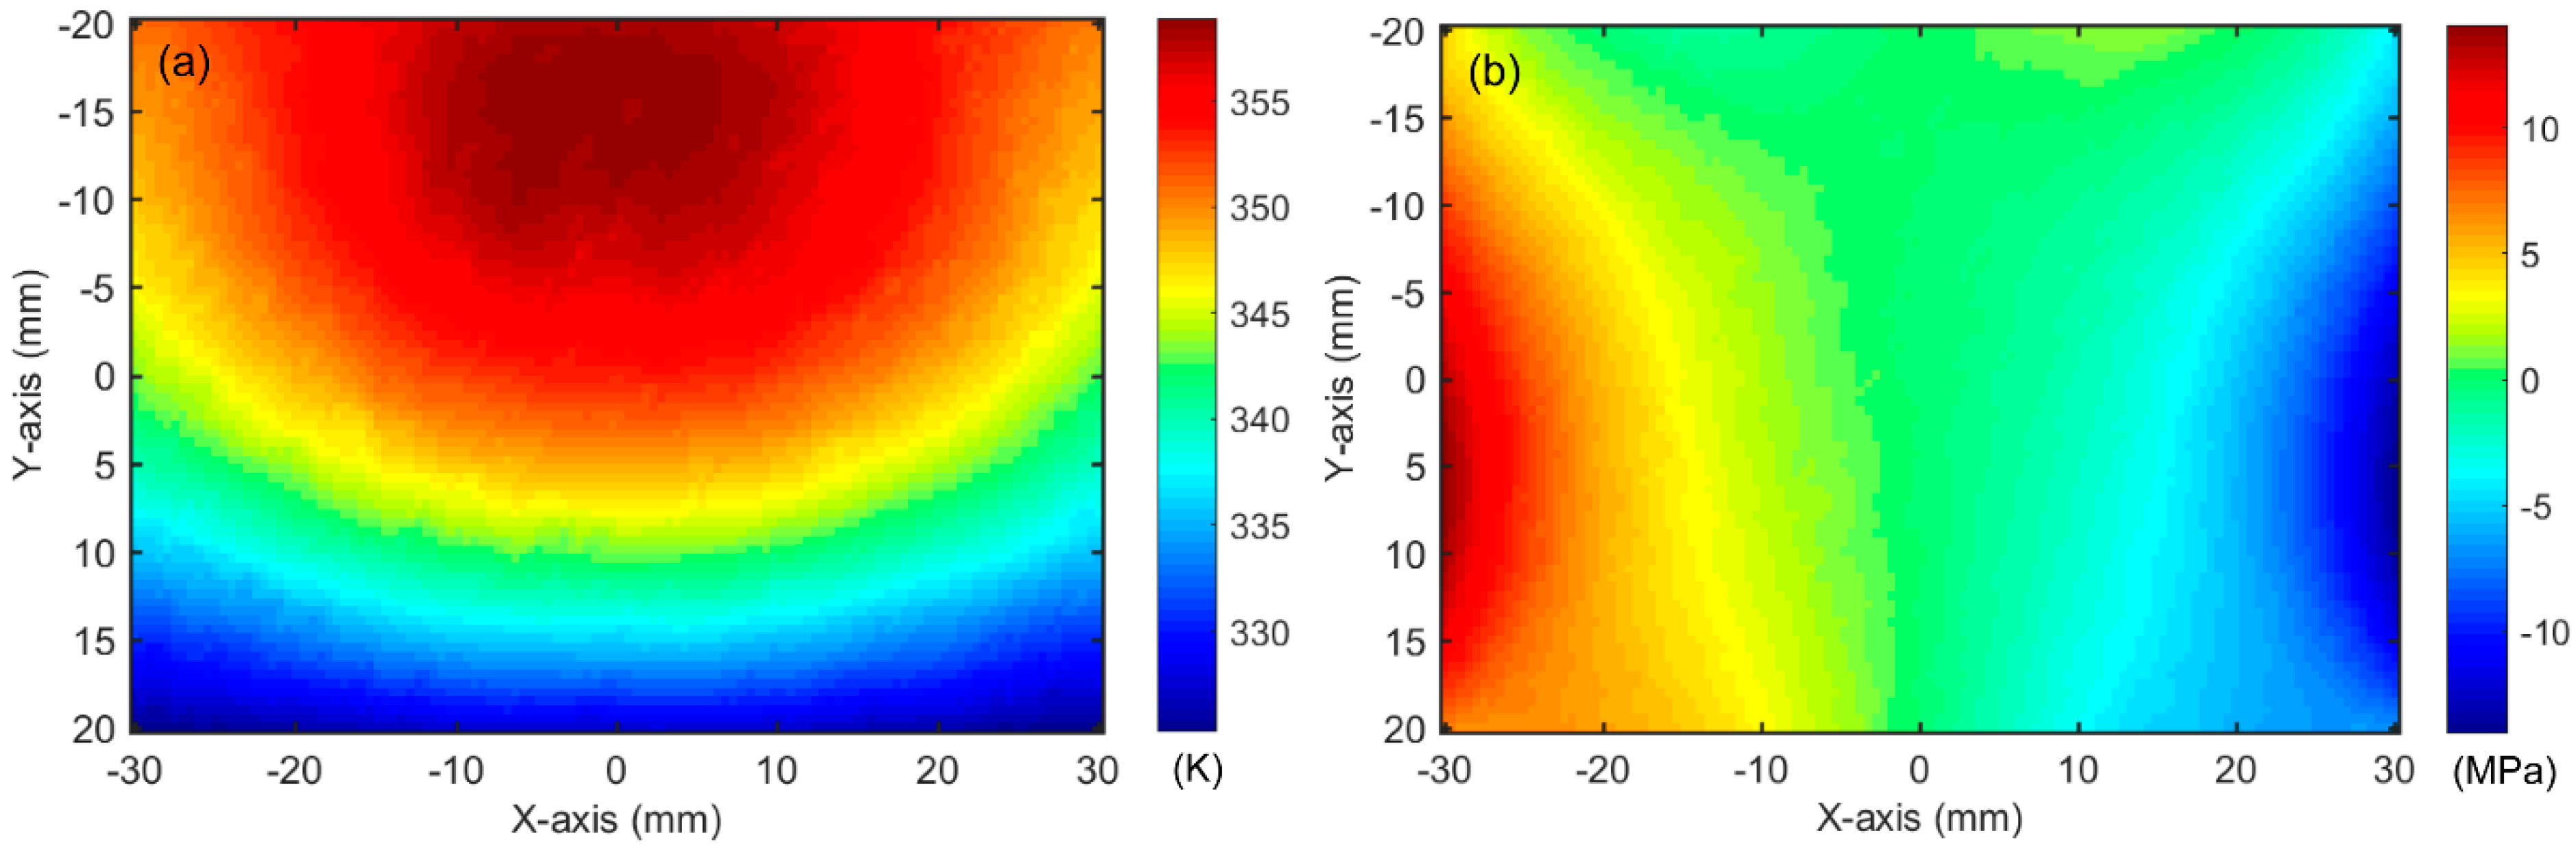
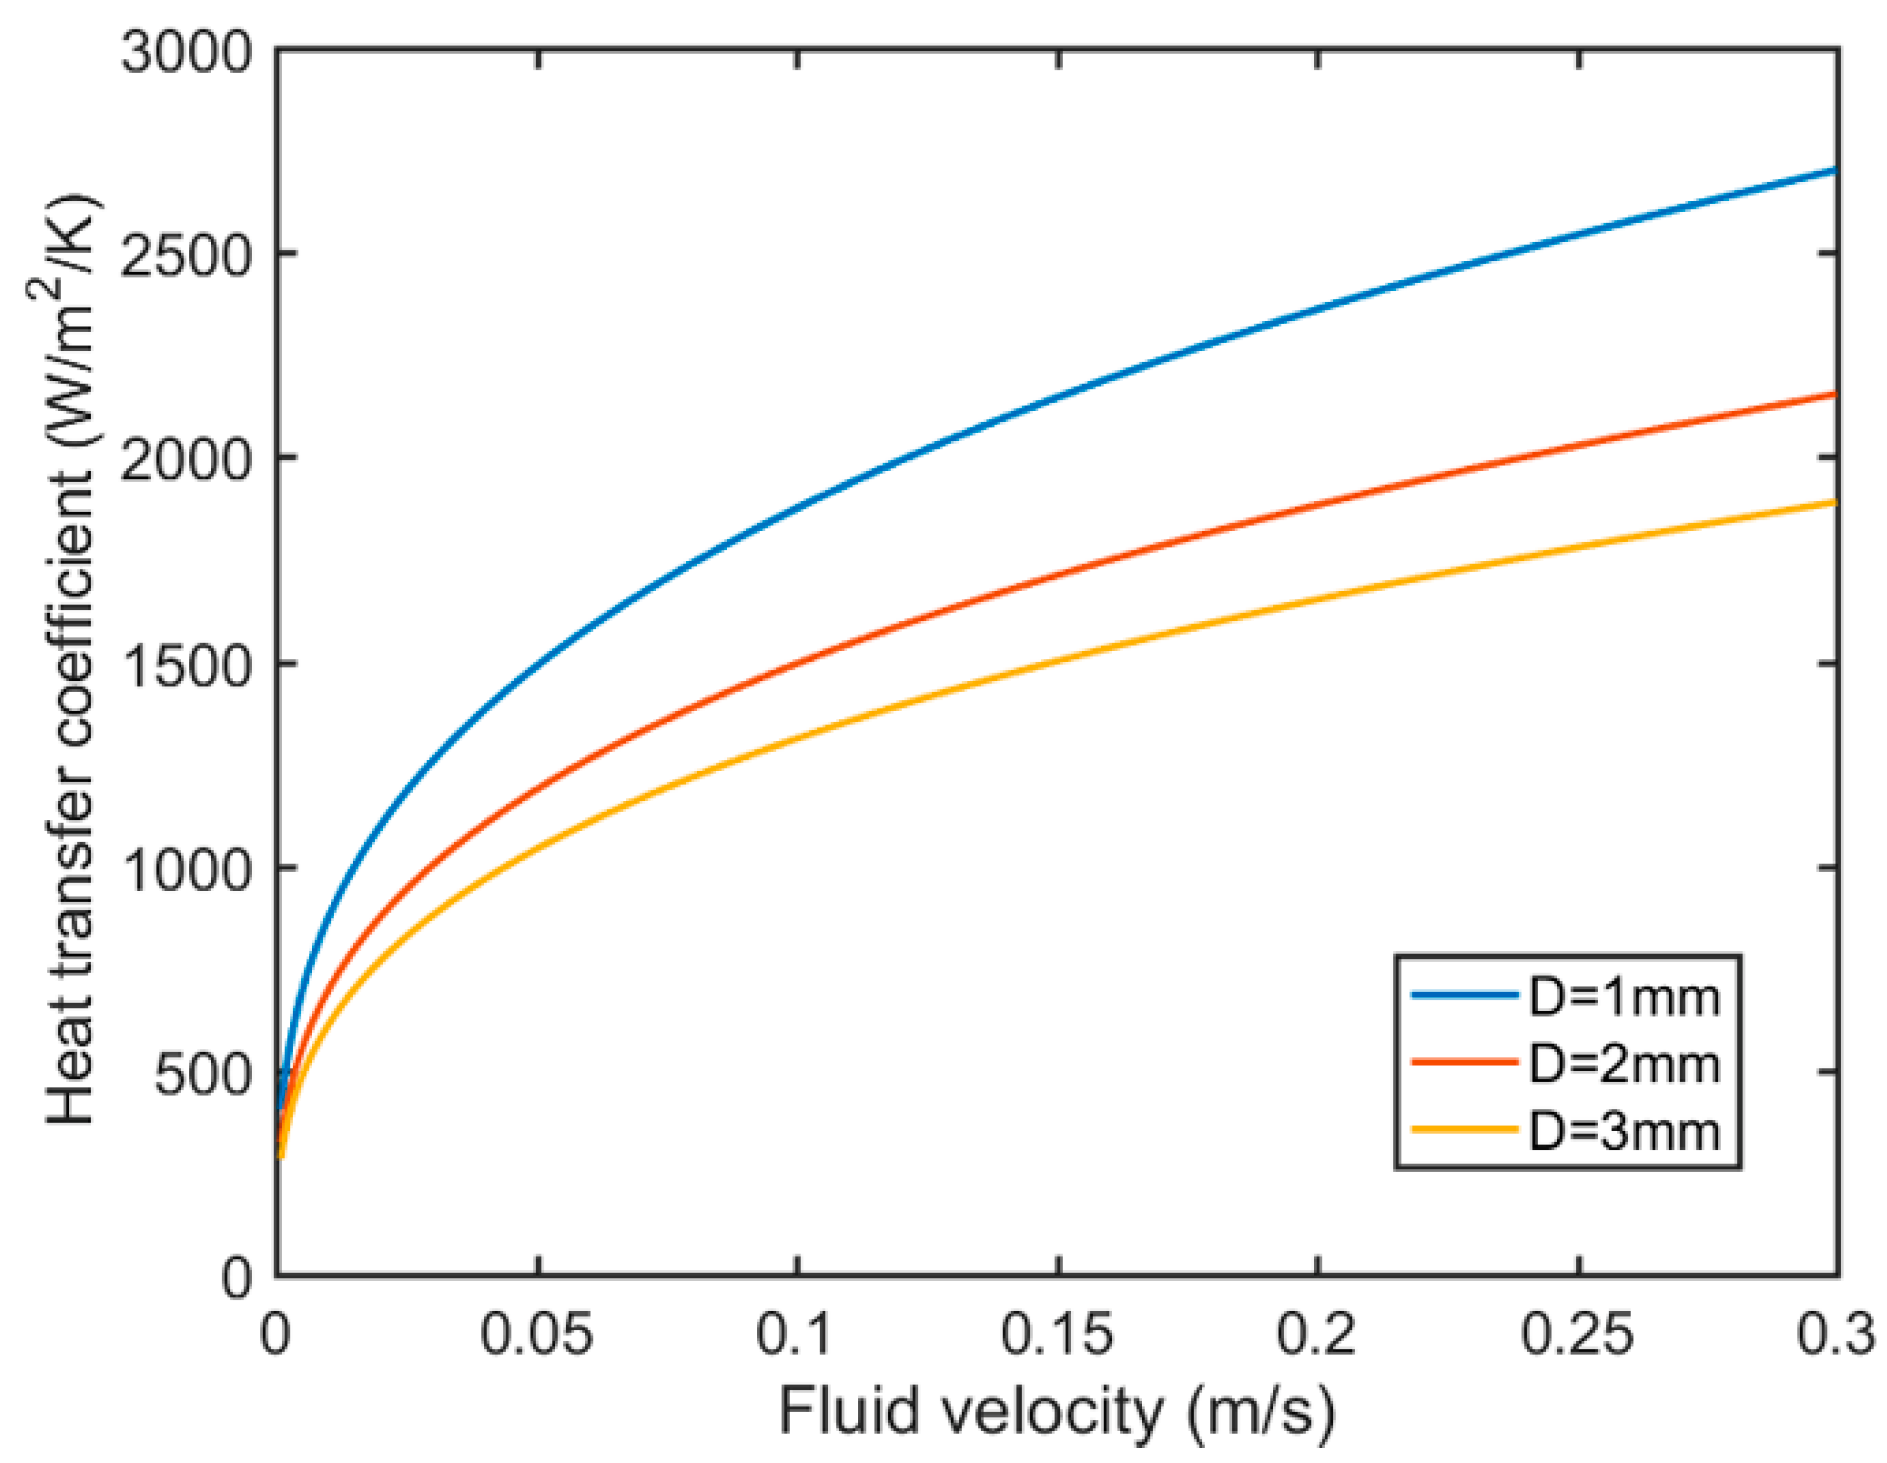
3.3. Thermal-Fluid–Solid Multiphysics Model

The temperature and stress distribution in gain medium is related to the thermophysical parameters, geometric structure and external environmental conditions of material. In Cartesian coordinates, the steady-state heat transfer equation can be expressed as,
( k T ) = k 2 T x 2 + k 2 T y 2 + k 2 T z 2 = Q ( x , y , z )
where Q is the heat source inside gain medium. The heat source distribution is consistent with pump distribution and the absolute value of Q can be preliminarily estimated according to Section 2.3.
The boundary conditions of the steady-state heat transfer equation are given by Newton’s law of cooling,
n T | Ω + h k [ T ( Ω ) T c ] = 0
where n is the vector perpendicular to the surface of Nd:LuAG; Ω represents the boundary of Nd:LuAG; h is the heat transfer coefficient of surface between sloid and fluid; T c is the coolant temperature.
The boundary condition of each side of Nd:LuAG is express as,
n [ k T ] | Ω = 0
Each side of Nd:LuAG was assumed to be a thermal boundary condition of adiabatic state and mechanical boundary conditions of fixed constraint. The three-dimensional modeling of the above process can be carried out using a finite element calculation software. In order to save computing resources, this model is established for one piece of Nd:LuAG. The schematic diagram of the thermal-fluid–solid multiphysics model is shown in Figure 7.
The temperature and stress distribution of Nd:LuAG in central plane were calculated, which is shown in Figure 8.
The temperature difference in the central plane is 3.7 K, which is acceptable in a laser amplifier. The maximum stress in the gain medium is 1.4 MPa, which is far lower than the breaking stress of Nd:LuAG.

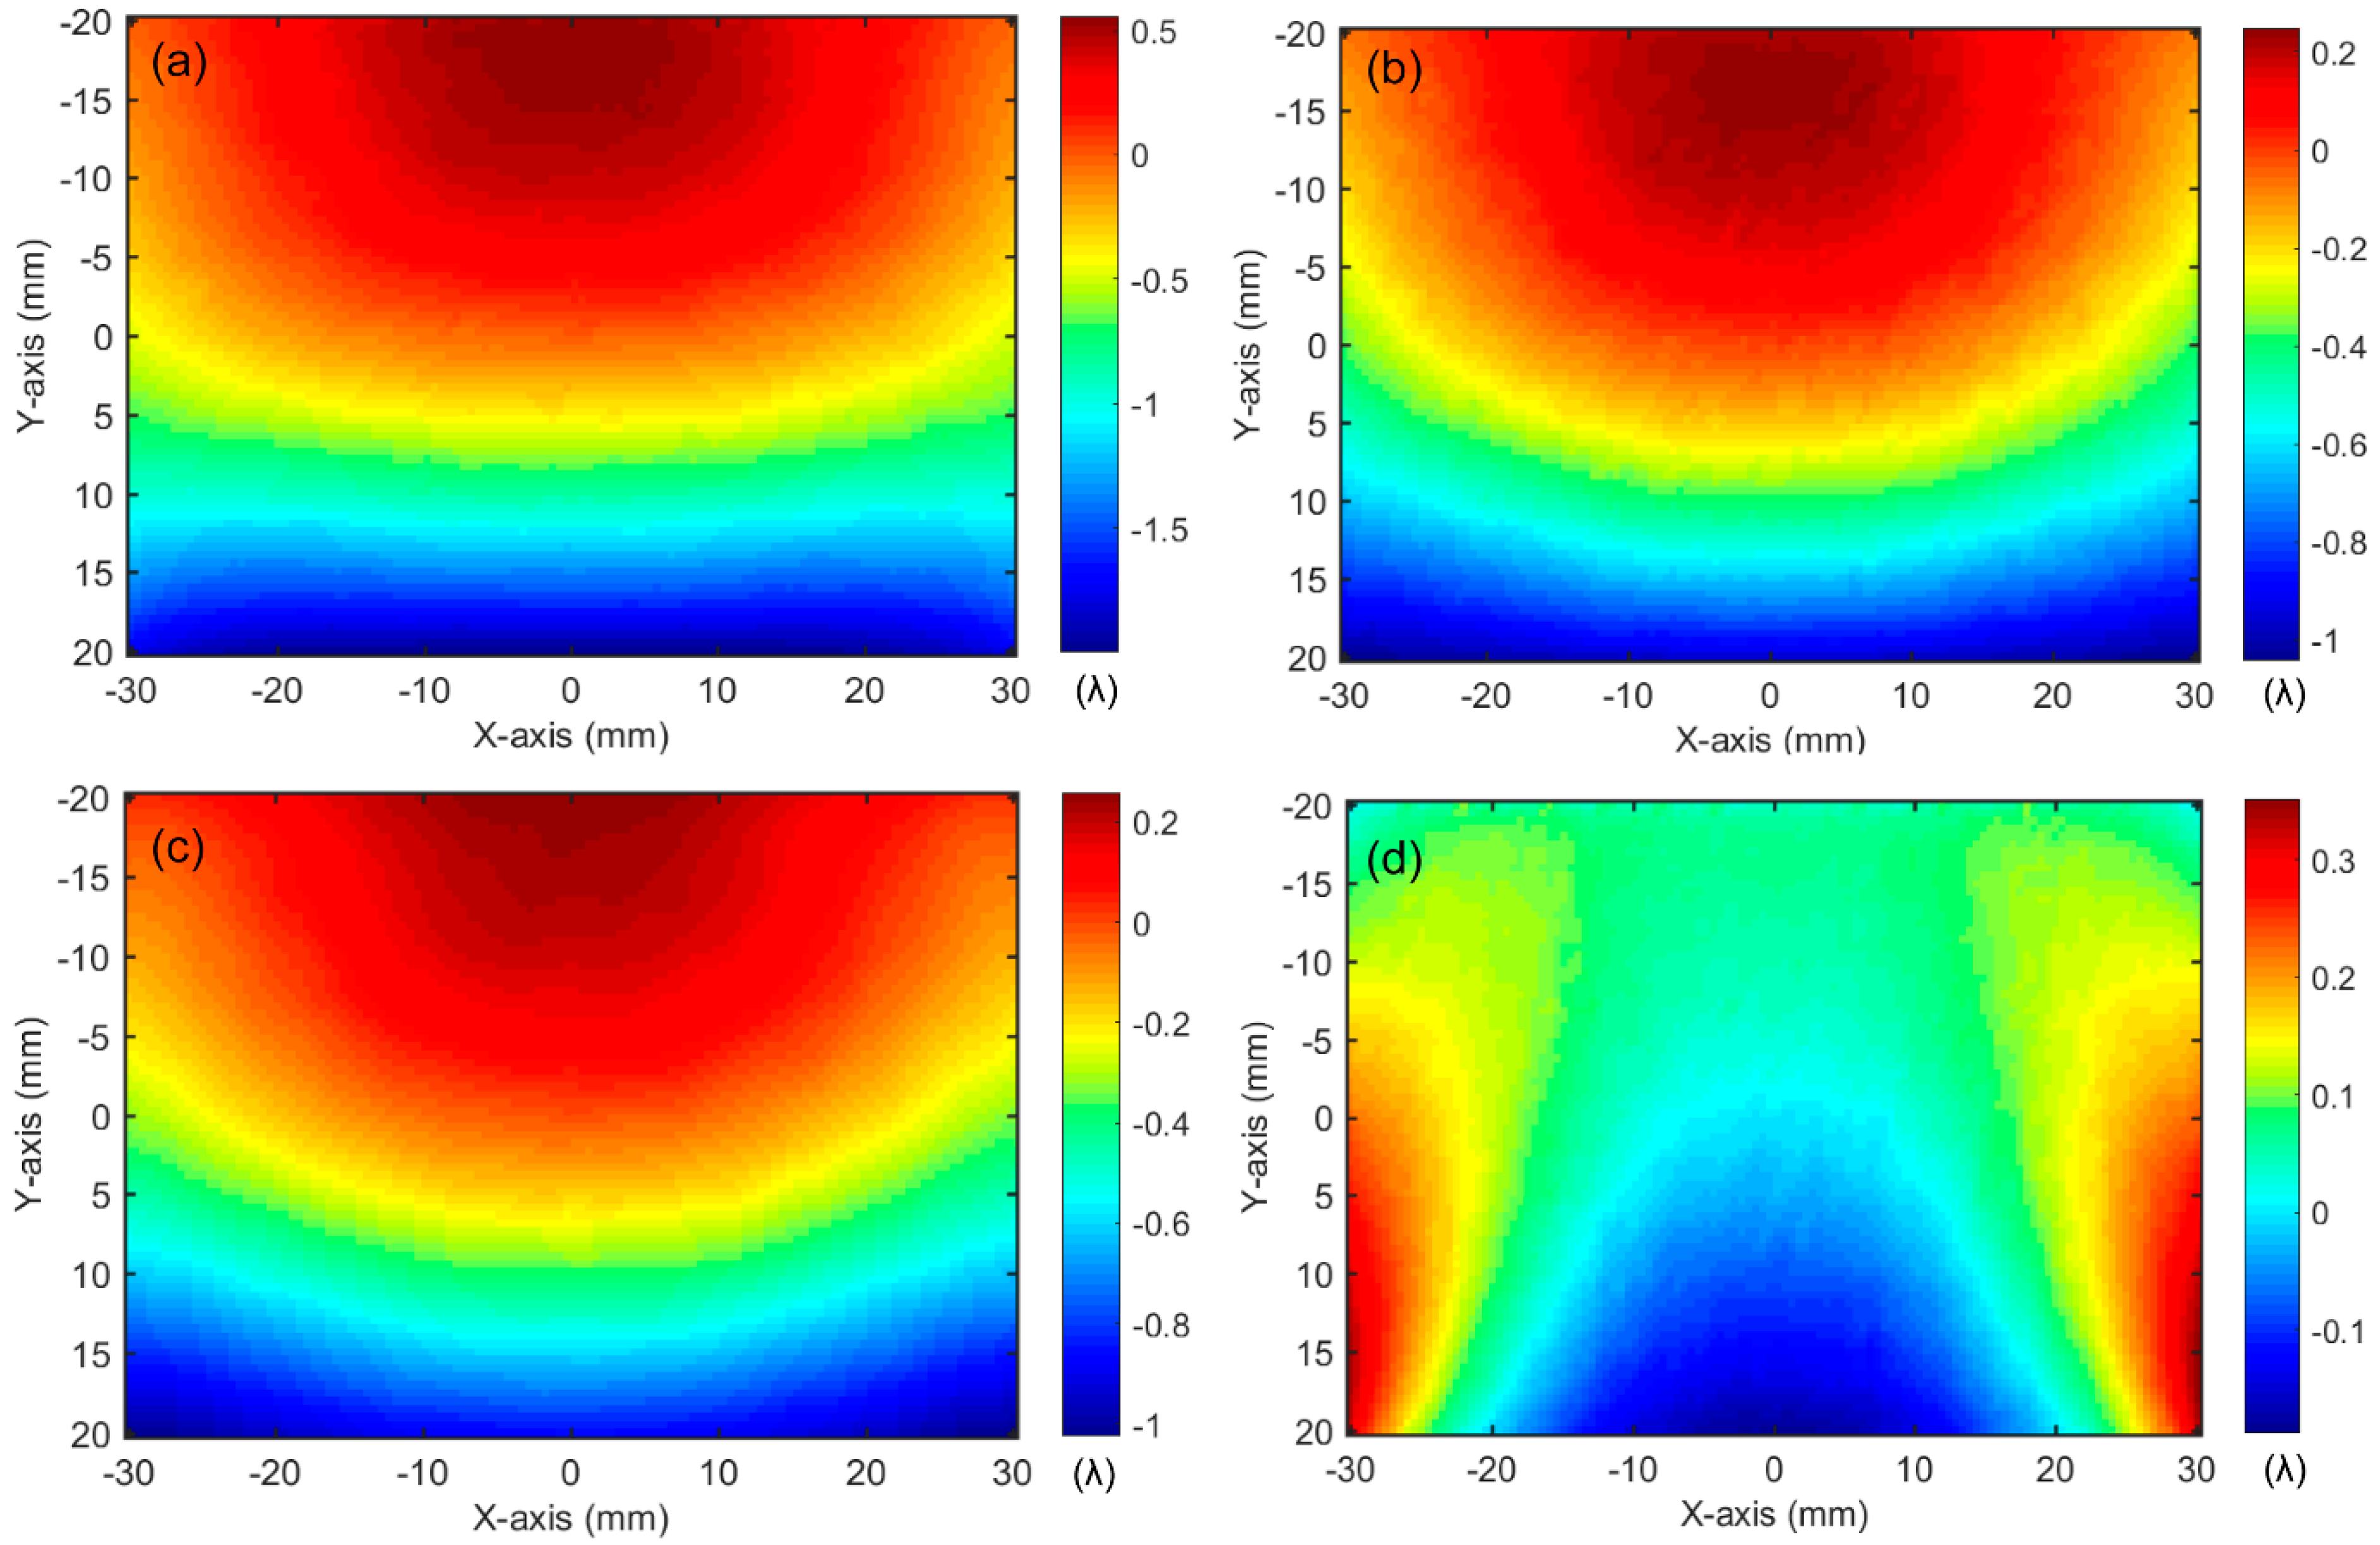
3.4. Thermally Induced Wavefront Model

The variety of optical path difference (OPD) of a laser beam due to thermal effects is mainly caused by three reasons: the first is end face deformation of gain medium due to thermal expansion; the second is the variation in refractive index of Nd:LuAG due to the thermo-optic effect; the third is the birefringence effect caused by stress. The total wavefront distortion can be expressed as:
O P D ( x , y ) = Δ L ( x , y ) ( n 0 1 ) + n T 0 L T ( x , y , z ) dz + i , j = 1 3 0 L n ε i , j ε i , j ( x , y , z ) dz
The first term on the right side of equation represents the deformation-induced wavefront aberration; the second term represents temperature-induced wavefront aberration; the third term represents stress-induced wavefront aberration.
The calculated single-pass thermally induced wavefront aberrations are shown in Figure 9. The peak-to-valley (PV) of the temperature, stress and deformation-induced wavefront aberrations were 0.13 λ, 0.13 λ, and 0.05 λ, respectively, and the total wavefront aberration PV was 0.26 λ.
The wavefront aberration of whole laser amplifier is eight times that of the single pass. Thus, the total wavefront aberration is shown in Figure 10,
Figure 10 shows that the total wavefront aberrations in laser amplifier is 2.06 λ, which can be compared with our subsequent measurement result.

4. Experimental Setup and Results

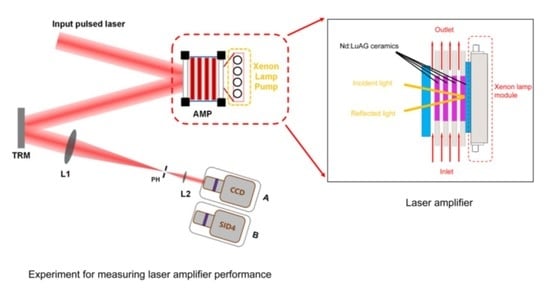
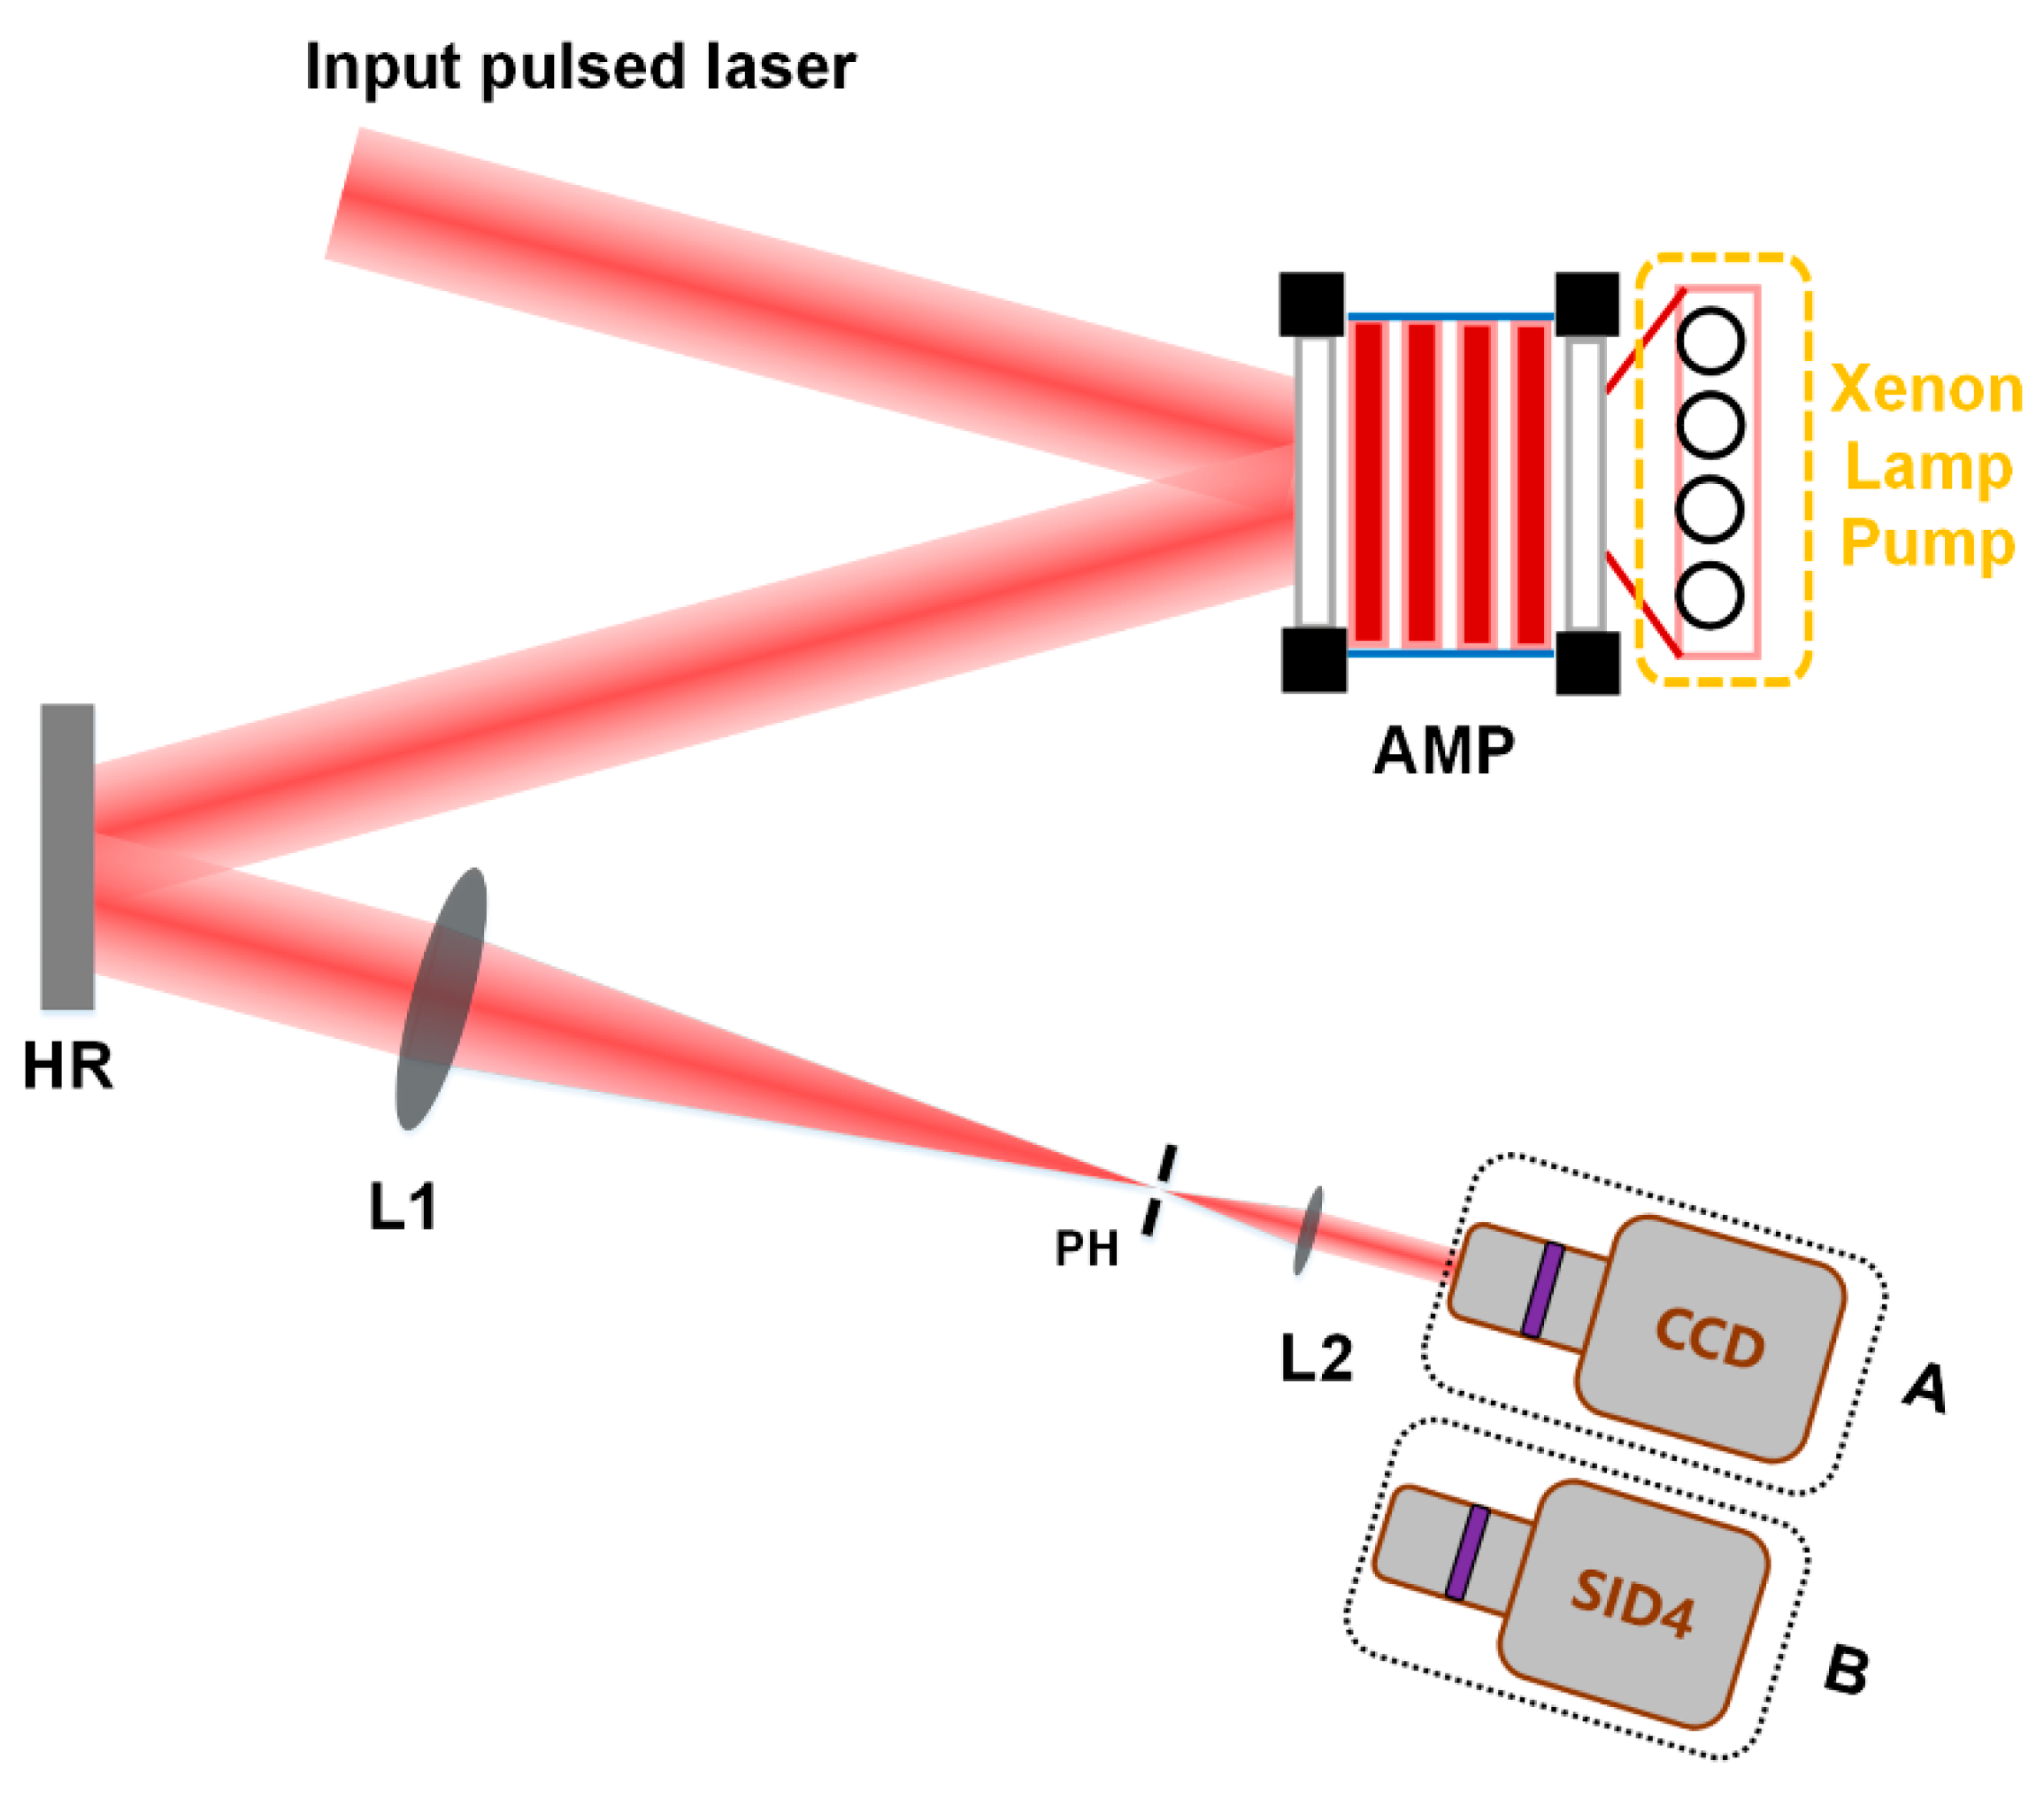
4.1. Experimental Setup

The schematic diagram of measurement is shown in Figure 11. The input pulsed beam with diameter of 100 mm illuminated the laser amplifier. After the reflection of the laser amplifier, the test laser beam, which carried the laser amplifier information, entered the detector. As the detector aperture is generally smaller than the beam aperture, the test laser beam was reduced to the proper size so that the detector can receive it. The pump distribution data were received by CCD (13.3 µm × 13.3 µm resolution, 1024 × 1024 sampling point, 13.6 mm × 13.6 mm imaging area, Gangyu Company, Chongqing, China). The thermally induced wavefront data were received by the wavefront sensor SID4 (29.6 µm × 29.6 µm resolution, 160 × 120 sampling point, 3.6 mm × 4.8 mm imaging area, France Physics). To prevent the influence of xenon lamp pump light and stray light, a pinhole was placed on the focal spot of L1 and L2. During the measurement, the 1064 nm filter was also placed in front of CCD or SID4 to reduce the interference of stray light. When pump distribution were measured, the pump light was turned on while the signal light was turned off.

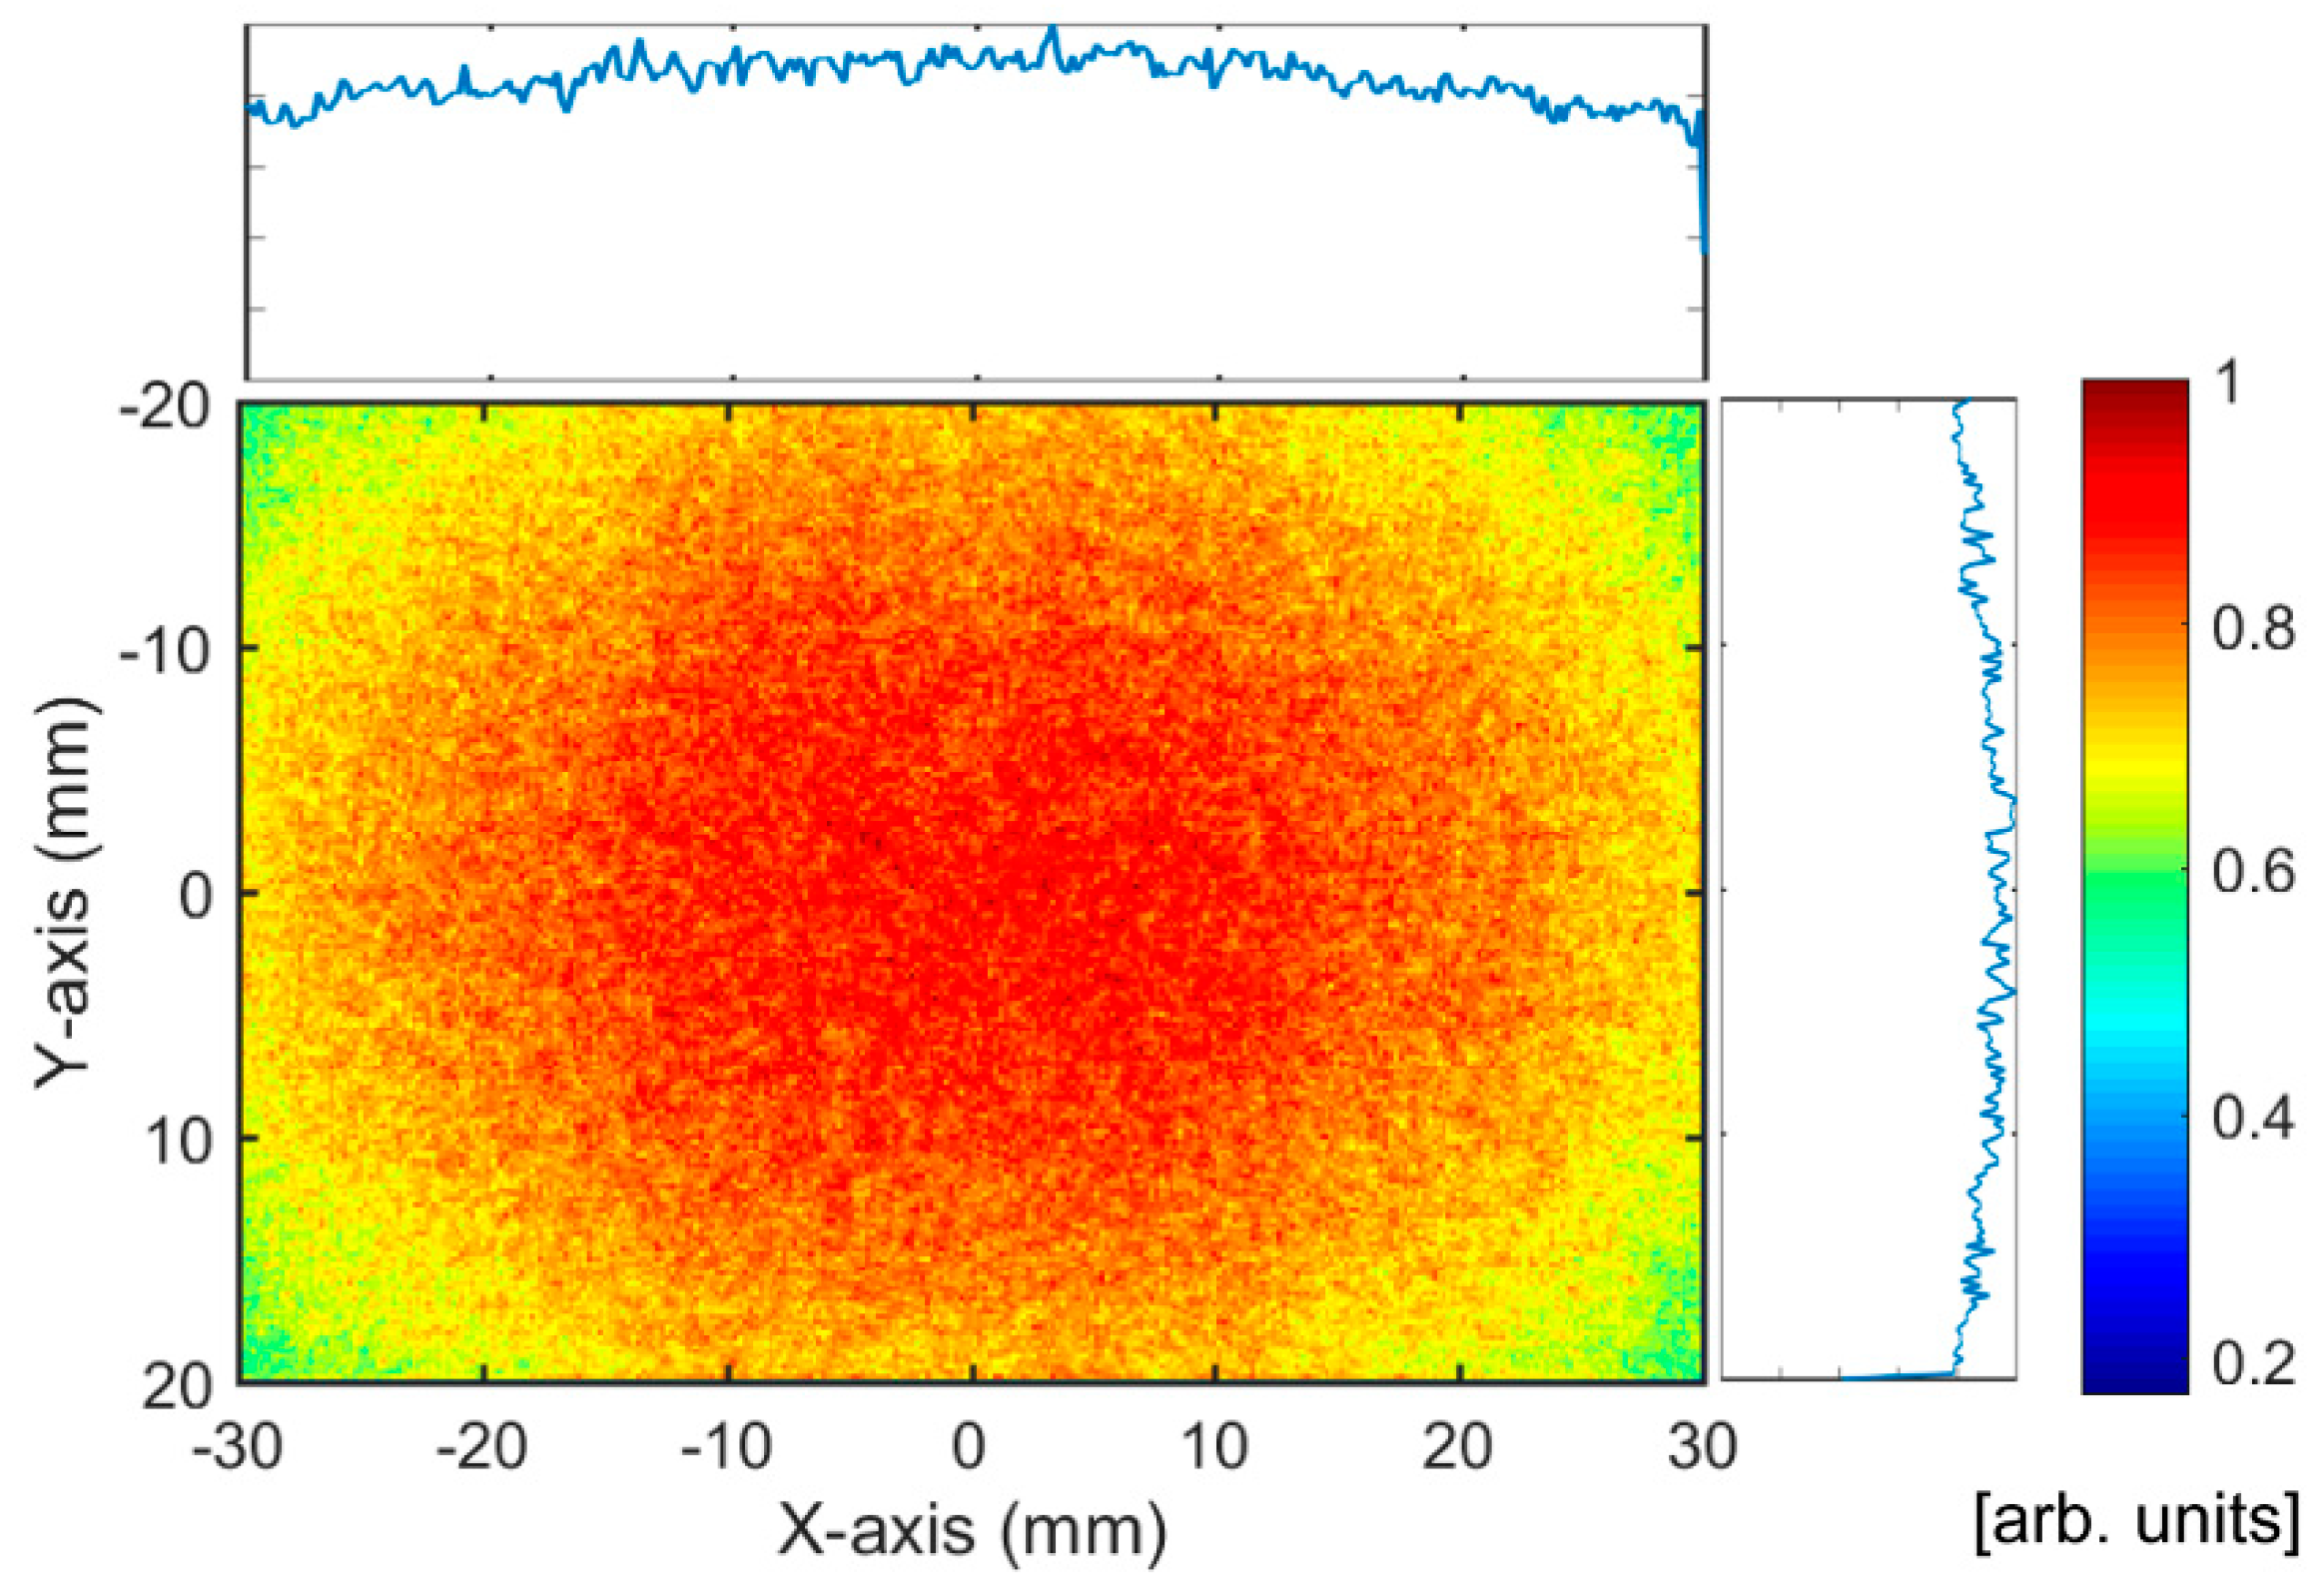
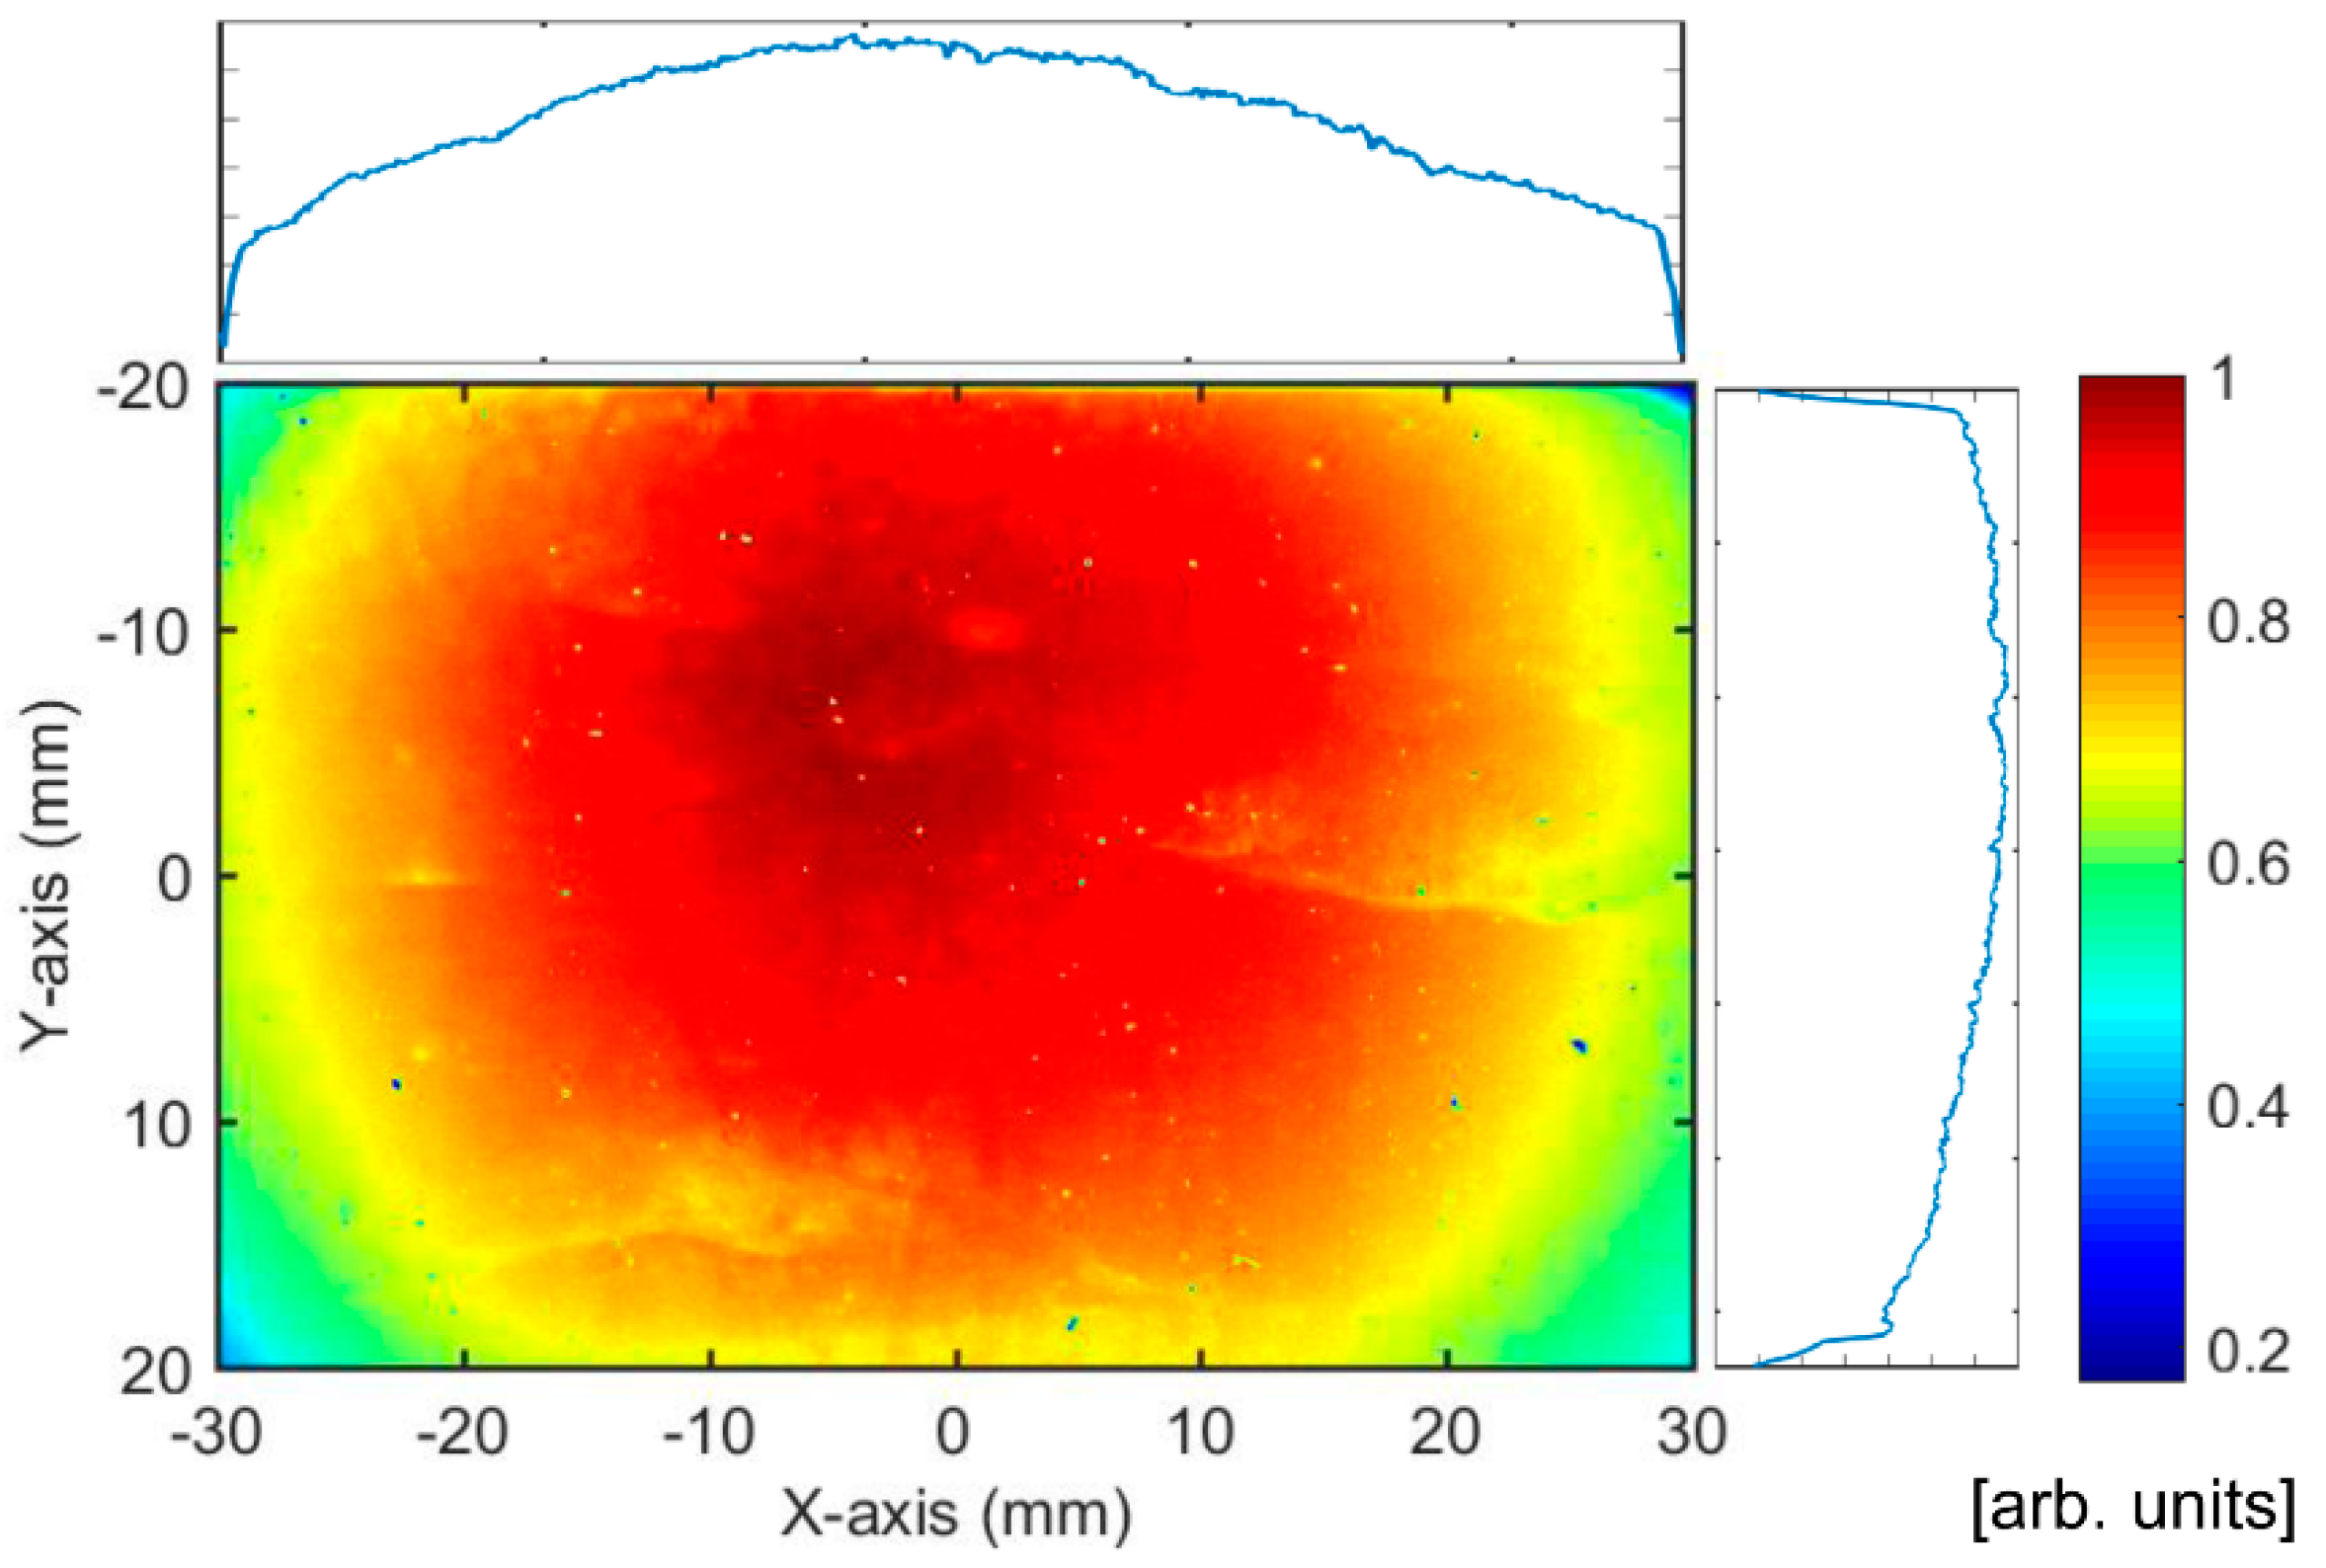
4.2. Experimental Pump Distribution

The measured result of pump distribution is shown in Figure 12. Compared with the calculation result shown in Figure 6. It can be seen that the measured pump distribution is basically consistent with the calculated result. Both strong areas of distributions were located in the center, while the intensity of the surrounding areas was lower. By further optimizing the arrangement and number of xenon lamps, a more uniform pump distribution can be obtained.

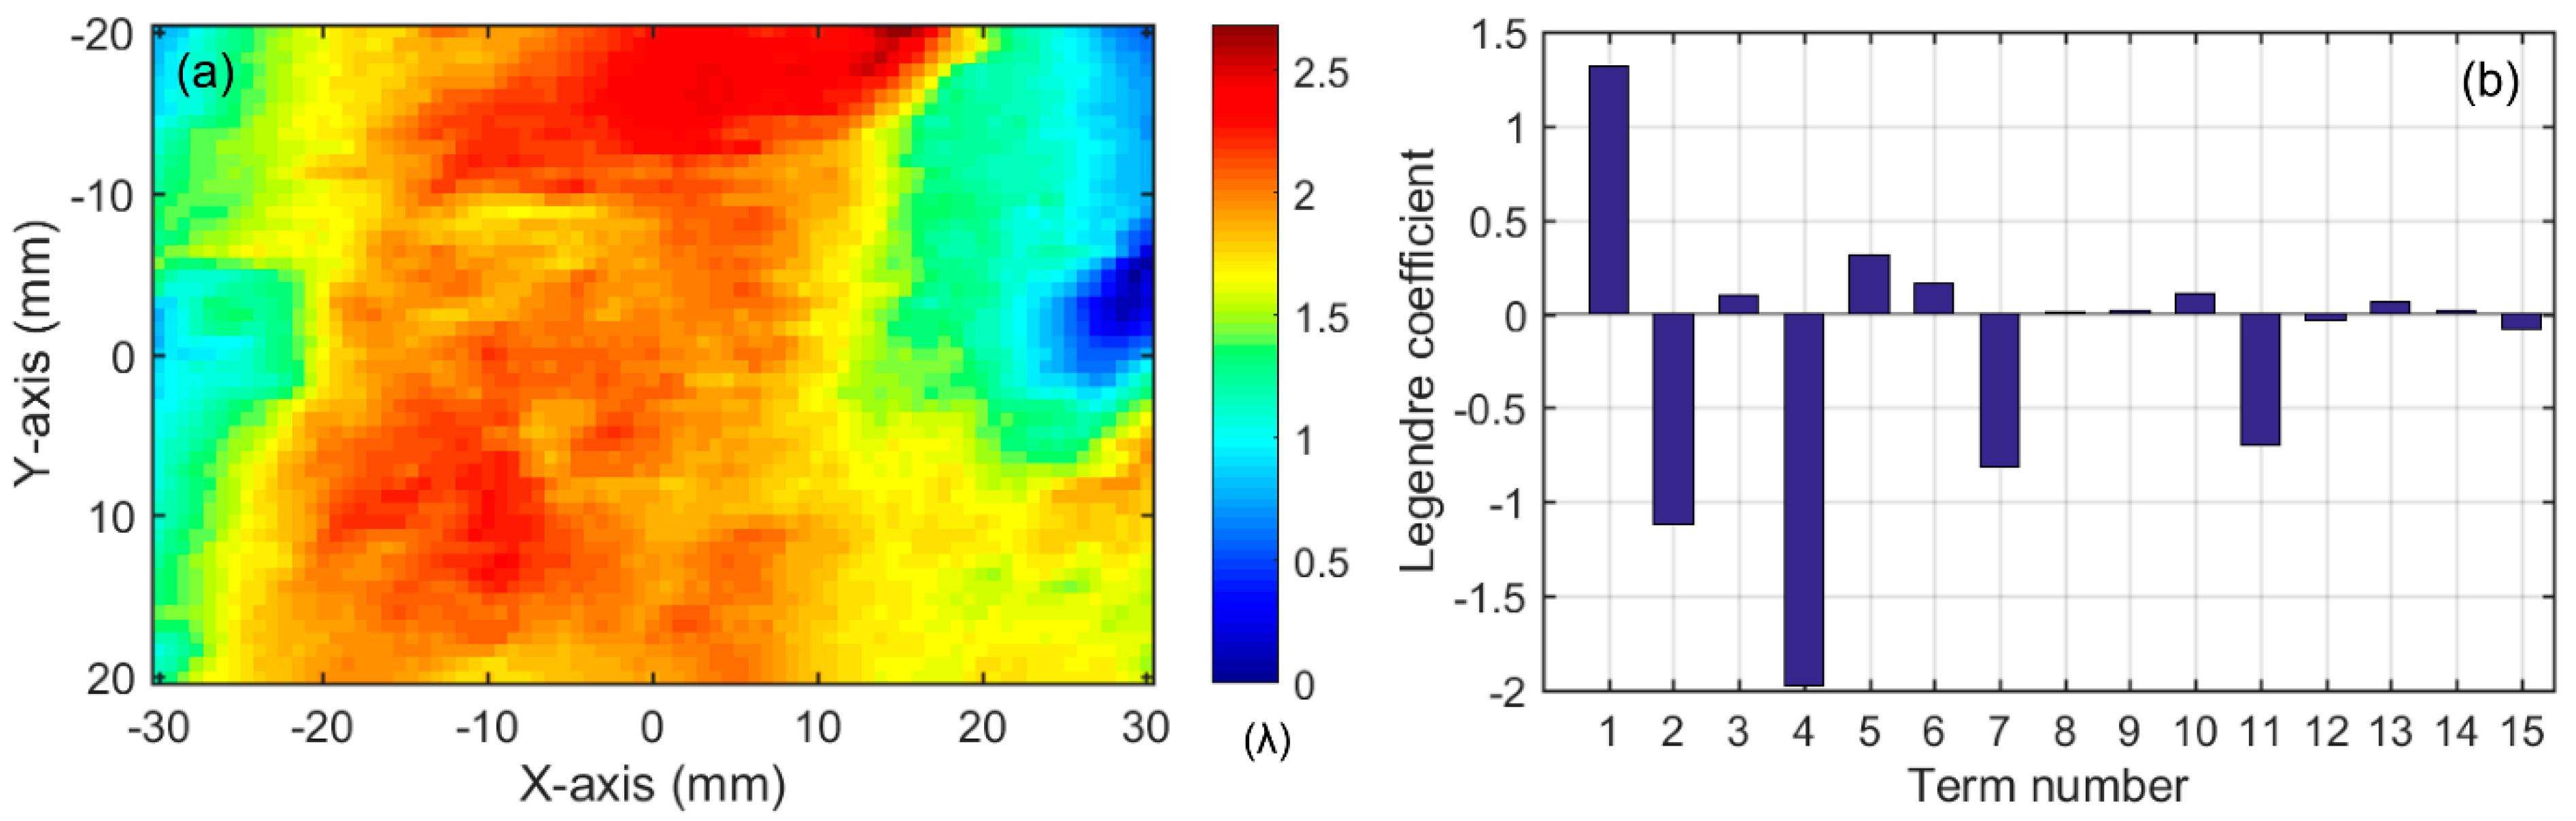
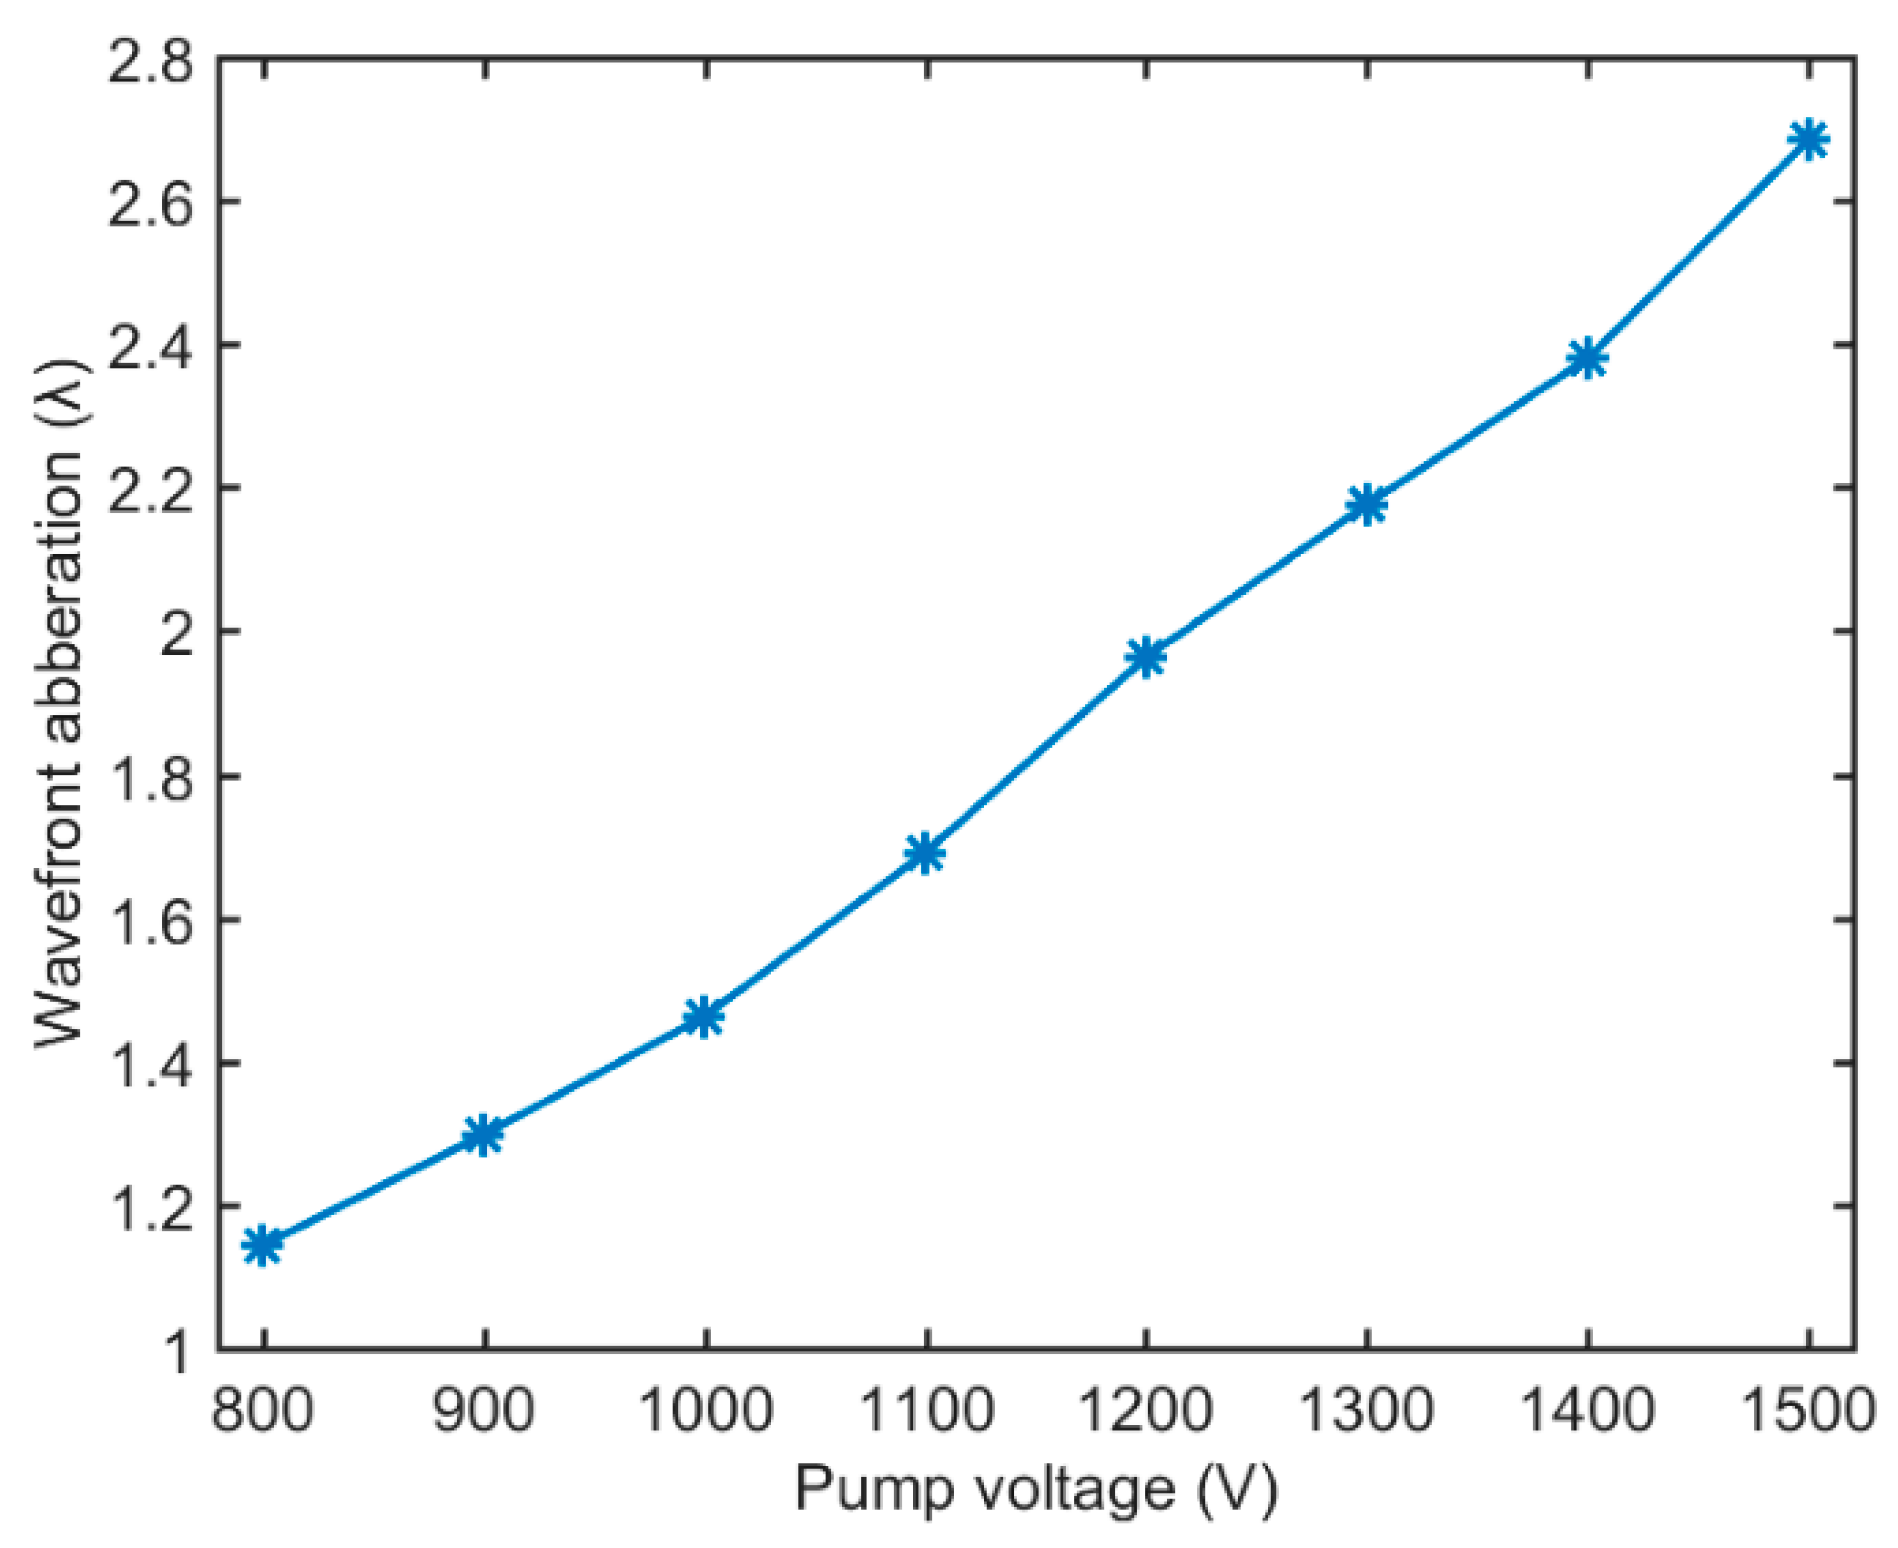
4.3. Experimental Wavefront Aberration

The thermally induced wavefront aberration was measured using a wavefront sensor in the pump condition of 1500 V at 1 Hz repetition rate, which is shown in Figure 13.
Figure 13a shows that the experimental total wavefront aberration was 2.685 λ. Figure 13b shows the measured first 15 orders Legendre coefficients of different Legendre polynomials. The 2nd and 4th polynomial coefficients were dominant, where the 2nd coefficient corresponds to the x tilt, and the 4th coefficient corresponds to x defocuses. The 7th polynomial (x-primary coma) and 11th polynomial (x-primary spherical) are somewhat larger than other higher-order polynomial coefficients. However, they are still smaller than the 2nd and 4th polynomial coefficients. No obvious higher-order wavefront distortion appears. Thus, wavefront aberration can be easily rectified using the adaptive phase corrector technique.
The calculated PV of single-pass wavefront aberration is 0.26 λ and total wavefront aberration is 2.08 λ, which is basically consistent with the measured result of 2.685 λ.
It is noted that due to the complex structure of laser amplifier, the measured wavefront data may have other components, such as thermal effect of heat deposition in quartz window or the deformation of gain medium due to cooling fluid pressure, etc. These factors require further analysis in the future.
In addition, under the condition of 6 L/min cooling flow rate, the wavefront aberration at different pump voltages was measured, which is shown in Figure 14.
It can be seen from Figure 14 that the wavefront aberration increased with the pump voltage. As the pump voltage increases, the thermal effect becomes more serious, so the wavefront aberration increases gradually.

5. The Modeling of 10 Hz Direct-Liquid-Cooled Split-Disk Laser Amplifier

From Section 3 and Section 4, results of the laser amplifier model established in this study are basically consistent with measured results. Therefore, we can extrapolate calculation results to the case of 10 Hz operation. The heat source setting has been adjusted to ten times of 1 Hz operation. The temperature and stress distribution of Nd:LuAG were calculated, which is shown in Figure 15.
It can be seen that both temperature and stress are higher than the 1 Hz operation. The temperature difference in the central plane is 33.7 K, and maximum stress is 14 MPa, which is still lower than the breaking stress of Nd:LuAG, which indicates that Nd:LuAG can still support 10 Hz repetition operation despite the high temperature difference. It also indicates the potential of Nd:LuAG in repetition rate operation.
The single-pass wavefront aberrations are shown in Figure 16. The PV of the temperature, stress, and deformation induced wavefront aberrations were 1.29 λ, 1.28 λ, and 0.54 λ, respectively, and the total wavefront aberration was 2.56 λ. The thermal effect of 10 Hz laser amplifier is more severe than 1 Hz. So it needs to adopt more effective cooling method. It is necessary to analyze the cooling capacity of fluid in the laser amplifier.
In the fluid channel design, the choice of the thickness of the cooling fluid is particularly critical. The thickness of the cooling fluid directly determines the heat dissipation effect of the gain medium. The heat dissipation capacity is generally expressed by the convective heat transfer coefficient, which is defined as [17],
D H = 2 W × D ( W + D ) Re = U D H ν Pr = μ C p k N u = 1.86 ( Re Pr D H L ) 1 / 3 h = N u k D H
D H , Re , Pr , N u , and h represent the thickness of the fluid channel, Reynolds number, Prandtl number, Nusselt coefficient and heat transfer coefficient, respectively. U , ν , μ , C p , and k represent the velocity of fluid, kinematic viscosity, dynamic viscosity, specific heat, and thermal conductivity, respectively. According to Equation (5), the calculation results are shown in Figure 17.
Figure 17 shows that the heat transfer coefficient increases with fluid velocity and decreases with thickness. The thickness of cooling fluid introduced in Section 2.2 is 2 mm and the upper limit of the cooling flow rate is 6 L/min. Thus, flow velocity in each cooling channel in this laser amplifier is 0.1667 m/s, which corresponds to the heat exchange coefficient of 1771 W/(m2K). From results of Figure 15 and Figure 16, the current cooling fluid structure are not suitable for the 10-Hz laser amplifier operation. Therefore, the cooling capacity of the laser amplifier can be improved by reducing the thickness of the fluid in future work.

6. Conclusions

In this study, a model to predict the thermal effect in a flash-lamp-pumped direct-liquid-cooled split-disk Nd:LuAG ceramic laser amplifier has been presented. It includes xenon lamp radiation model, thermal-fluid–solid multiphysics model, and thermally induced wavefront aberration model. We show that this model allows the prediction of performance of a direct-liquid-cooled split-disk Nd:LuAG ceramic laser amplifier from pump distribution to thermal-induced wavefront aberration. Under the pump condition of 1500 V at 1 Hz, the predicted total wavefront aberration is 2.08 λ, which is basically consistent with the measured result of 2.685 λ when considering the 0.4–0.5 λ wavefront aberration induced by cooling fluid. The profile of predicted pump distribution is agreement with measurement result. Furthermore, the thermal results in the 10-Hz laser amplifier have been predicted. The wavefront aberration of single Nd:LuAG is 20.48 λ. In the end, heat transfer coefficient as a function of the fluid thickness and fluid velocity is obtained. The cooling capacity of the 10-Hz laser amplifier can be improved by reducing the thickness of the fluid in future work.

Author Contributions

Conceptualization, S.J. and W.H.; methodology, S.J., W.H. and T.F.; software, X.L. (Xinghua Lu); validation, S.J., W.H. and L.P.; formal analysis, S.J.; investigation, T.F. and J.W.; resources, W.F.; data curation, S.J. and L.P.; writing—original draft preparation, S.J.; writing—review and editing, S.J., W.H., T.F. and B.J.; visualization, S.J. and L.P.; supervision, X.L. (Xuechun Li). All authors have read and agreed to the published version of the manuscript.

Funding

This research was funded by Program of Shanghai Academic Research Leader, grant number 19XD1404000; Strategic Priority Research Program of the Chinese Academy of Sciences, grant number XDA25020307.

Data Availability Statement

Not applicable.

Conflicts of Interest

The authors declare no conflict of interest.

References

  1. Dunne, M. A high-power laser fusion facility for Europe. Nat. Phys. 2006, 2, 2–5. [Google Scholar] [CrossRef]
  2. Kalainathan, S.; Prabhakaran, S. Recent development and future perspectives of low energy laser shock peening. Opt. Laser Technol. 2016, 81, 137–144. [Google Scholar] [CrossRef]
  3. Azhari, A.; Sulaiman, S.; Prasada Rao, A.K. A review on the application of peening processes for surface treatment. IOP Conf. Ser. Mater. Sci. Eng. 2016, 114, 012002. [Google Scholar] [CrossRef] [Green Version]
  4. Lindl, J. Development of the indirect-drive approach to inertial confinement fusion and the target physics basis for ignition and gain. Phys. Plasmas 1995, 2, 3933–4024. [Google Scholar] [CrossRef] [Green Version]
  5. Kodama, R.; Norreys, P.A.; Mima, K.; Dangor, A.E.; Evans, R.G.; Fujita, H.; Kitagawa, Y.; Krushelnick, K.; Miyakoshi, T.; Miyanaga, N.; et al. Fast heating of ultrahigh-density plasma as a step towards laser fusion ignition. Nature 2001, 412, 798–802. [Google Scholar] [CrossRef] [PubMed]
  6. Bayramian, A.; Armstrong, P.; Ault, E.; Beach, R.; Bibeau, C.; Caird, J.; Campbell, R.; Chai, B.; Dawson, J.; Ebbers, C.; et al. The Mercury project: A high average power, gas-cooled laser for inertial fusion energy development. Fusion Sci. Technol. 2007, 52, 383–387. [Google Scholar] [CrossRef] [Green Version]
  7. Gales, S.; Tanaka, K.A.; Balabanski, D.L.; Negoita, F.; Stutman, D.; Tesileanu, O.; Ur, C.A.; Ursescu, D.; Andrei, I.; Ataman, S.; et al. The extreme light infrastructure—Nuclear physics (ELI-NP) facility: New horizons in physics with 10 PW ultra-intense lasers and 20 MeV brilliant gamma beams. Rep. Prog. Phys. 2018, 81, 094301. [Google Scholar] [CrossRef] [PubMed]
  8. Mason, P.; Divoký, M.; Ertel, K.; Pilar, J.; Butcher, T.; Hanuš, M.; Banerjee, S.; Phillips, J.; Smith, J.; Vido, M.; et al. Kilowatt average power 100 j-level diode pumped solid state laser. Optica 2017, 4, 438–439. [Google Scholar] [CrossRef]
  9. Erlandson, A.; Aceves, S.; Bayramian, A.; Bullington, A.; Beach, R.; Boley, C.; Caird, J.; Deri, R.; Dunne, A.; Lowers, D.; et al. Comparison of Nd:phosphate glass, Yb:YAG and Yb:S-FAP laser beamlines for laser inertial fusion energy (LIFE). Opt. Mater. Express 2011, 1, 1341–1352. [Google Scholar] [CrossRef]
  10. Liu, T.; Feng, T.; Sui, Z.; Liu, Q.; Gong, M.; Zhang, L.; Jiang, B.; Fu, X. 50 mmaperture Nd:LuAG ceramic nanosecond laser amplifier producing 10 J at 10 Hz. Opt. Express 2019, 27, 15595–15603. [Google Scholar] [CrossRef] [PubMed]
  11. Liu, Q.; Wang, J.; Liu, J.; Li, L.; Chen, R.; Shi, X. Thermal analysis of active mirror Nd: LuAG gain medium. Chin. J. Lasers 2018, 45, 0801002. [Google Scholar]
  12. Wang, J.; Zhao, K.; Feng, T.; Zhu, X.; Chen, W. 1.5 J high-beam-quality Nd:LuAG ceramic active mirror laser amplifier. Chin. Opt. Lett. 2020, 18, 021401. [Google Scholar] [CrossRef]
  13. Xu, D.; Wang, X.; Meng, J. Crystal growth, spectral and laser properties of Nd: LuAG single crystal. Laser Phys. Lett. 2009, 6, 678–681. [Google Scholar] [CrossRef]
  14. Liu, Q.; Gong, M.; Liu, T.; Sui, Z.; Fu, X. Efficient sub-joule energy extraction from a diode-pumped Nd:LuAG amplifier seeded by a Nd:YAG laser. Opt. Lett. 2016, 41, 5322–5325. [Google Scholar] [CrossRef] [PubMed]
  15. Arzakantsyan, M.; Ananyan, N.; Gevorgyan, V.; Chanteloup, J.C. Growth of large 90 mm diameter Yb:YAG single crystals with Bagdasarov method. Opt. Mater. Express 2012, 2, 1219–1225. [Google Scholar] [CrossRef]
  16. Mangir, M.S.; Rockwell, D.A. Measurements of heating and energy storage in flashlamp-pumped Nd:YAG and Nd-doped phosphate laser glasses. IEEE J. Quantum Electron. 1986, 22, 574–580. [Google Scholar] [CrossRef]
  17. Ji, S.; Huang, W.; Pan, L.; Wang, J.; Lu, X.; Fan, W.; Li, X. Hydrodynamic and thermal simulation for high energy large size Nd:YAG liquid-cooled laser amplifier. Proc. SPIE 2020, 11717. [Google Scholar] [CrossRef]
Figure 1. SEM micrograph of the Nd:LuAG ceramics.
Photonics 08 00097 g001
Figure 2. (a) Schematic diagram of the direct-liquid-cooled split-disk laser amplifier; (b) picture of Nd: LuAG ceramics.
Photonics 08 00097 g002
Figure 3. Stored energy and small signal gain versus pump voltage.
Photonics 08 00097 g003
Figure 4. Thermal simulation flow chart of the laser amplifier.
Photonics 08 00097 g004
Figure 5. Schematic diagram of the xenon pump radiation.
Photonics 08 00097 g005
Figure 6. Calculated result of pump distribution.
Photonics 08 00097 g006
Figure 7. Diagram of the thermal-fluid-solid multiphysics model.
Photonics 08 00097 g007
Figure 8. (a) Temperature distribution in central plane; (b) stress distribution in central plane.
Photonics 08 00097 g008
Figure 9. Calculated wavefront aberrations after single pass: (a) total wavefront aberration; (b) temperature-induced wavefront aberration; (c) stress-induced wavefront aberration; (d) deformation-induced wavefront aberration.
Photonics 08 00097 g009
Figure 10. Total wavefront aberrations in laser amplifier.
Photonics 08 00097 g010
Figure 11. Schematic diagram of the experiment for measuring laser amplifier performance. AMP: direct-liquid-cooled split-disk laser amplifier; L1: lens with f = 1000 mm; L2: lens with f = 50 mm; HR: fused silica with high-reflection coating for 1064 nm; PH: pinhole plate; A: CCD used for measuring the pump distribution; B: wavefront sensor SID4 used for measuring the thermally induced wavefront.
Photonics 08 00097 g011
Figure 12. Measured result of pump distribution.
Photonics 08 00097 g012
Figure 13. Single-pass thermally induced wavefront aberration through the amplifier. (a) measured wavefront aberration; (b) analysis of wavefront aberration by Legendre polynomials.
Photonics 08 00097 g013
Figure 14. Wavefront aberration versus pump voltage with the cooling flow rate of 6 L/min.
Photonics 08 00097 g014
Figure 15. (a) Temperature distribution in central plane; (b) stress distribution in central plane.
Photonics 08 00097 g015
Figure 16. Calculated wavefront aberrations after single pass: (a) total wavefront aberration; (b) temperature-induced wavefront aberration; (c) stress-induced wavefront aberration; (d) deformation-induced wavefront aberration.
Photonics 08 00097 g016
Figure 17. Heat transfer coefficient as a function of fluid thickness and fluid velocity.
Photonics 08 00097 g017
Publisher’s Note: MDPI stays neutral with regard to jurisdictional claims in published maps and institutional affiliations.

