Application of Optical Quality Control Technologies in the Dairy Industry: An Overview

 , , ,
, , ,  ,
,  ,
,  and
and 
Abstract
:1. Introduction
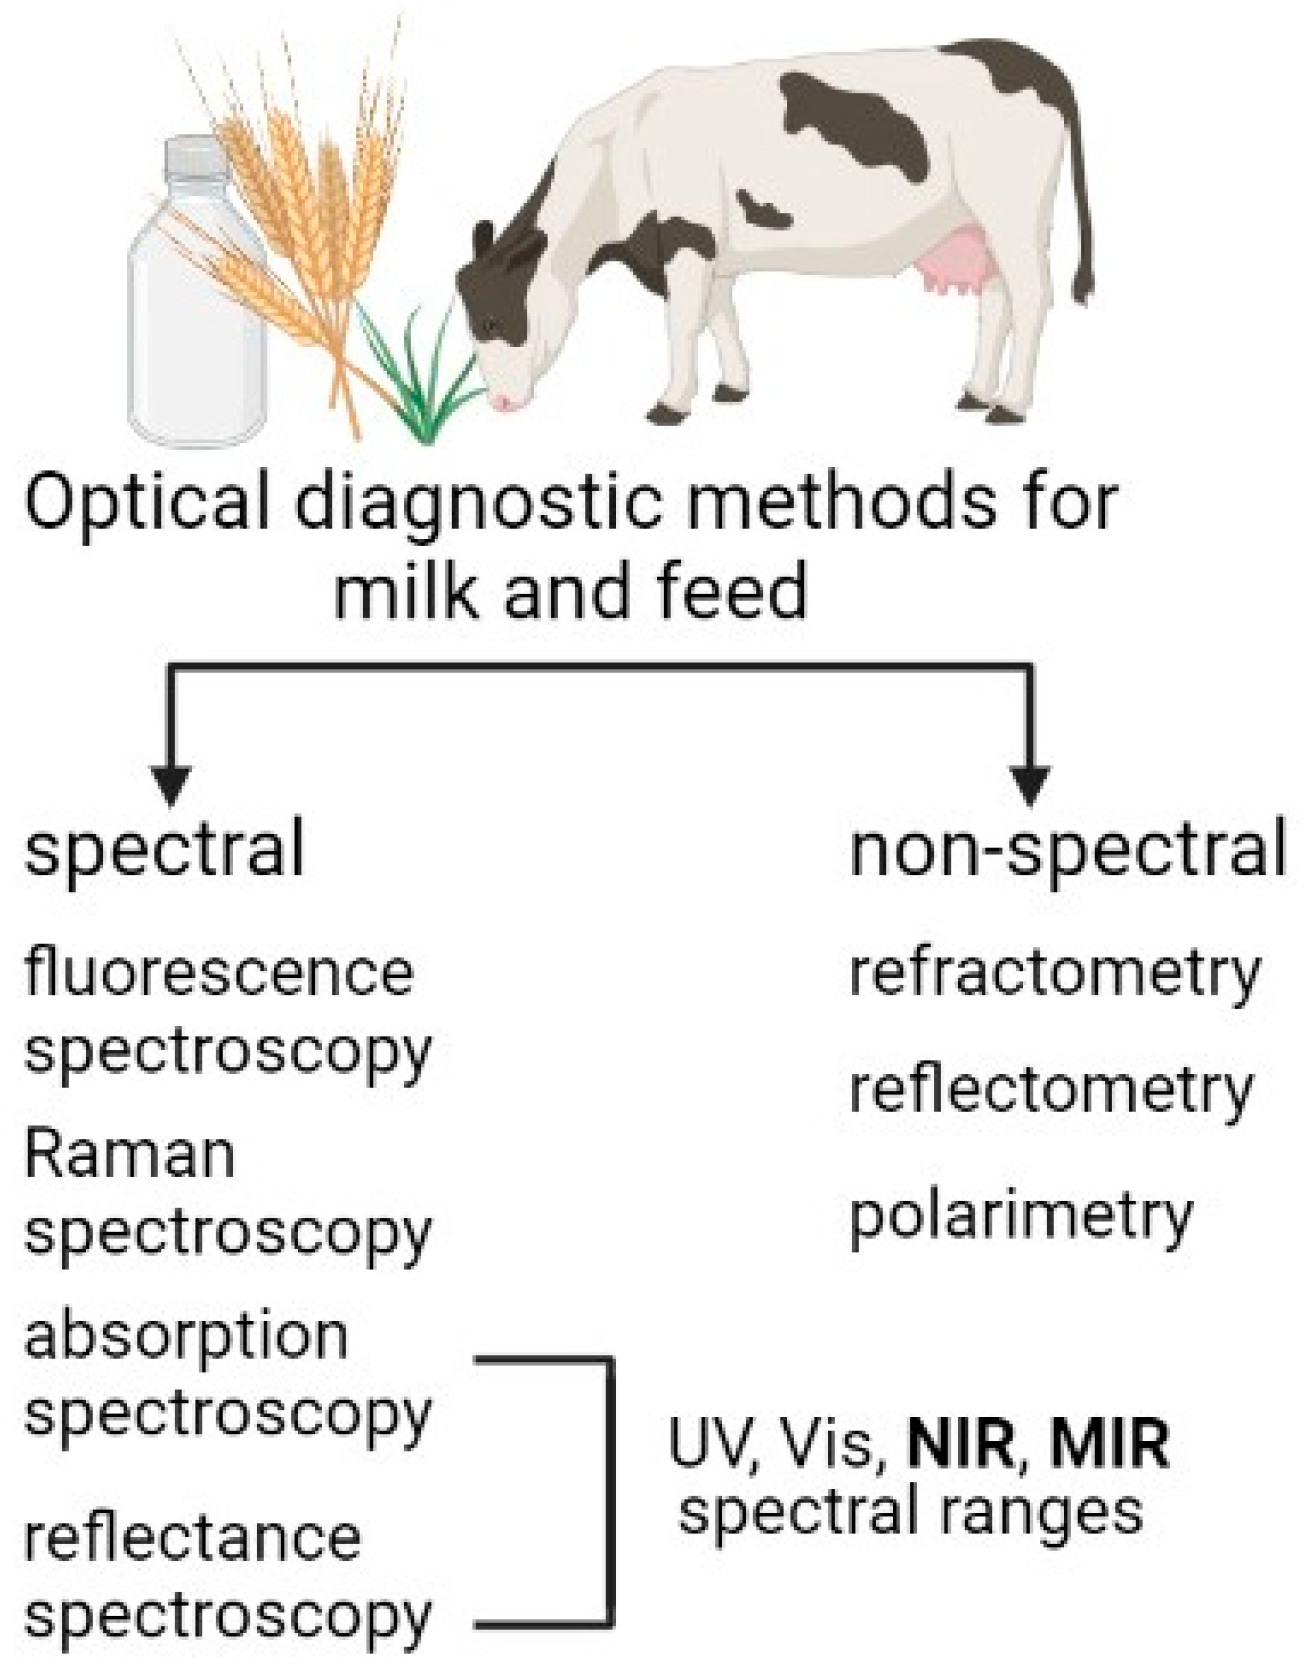
2. Variety of Optical Techniques Used in Agricultural Applications
Presentation of Tabular Data
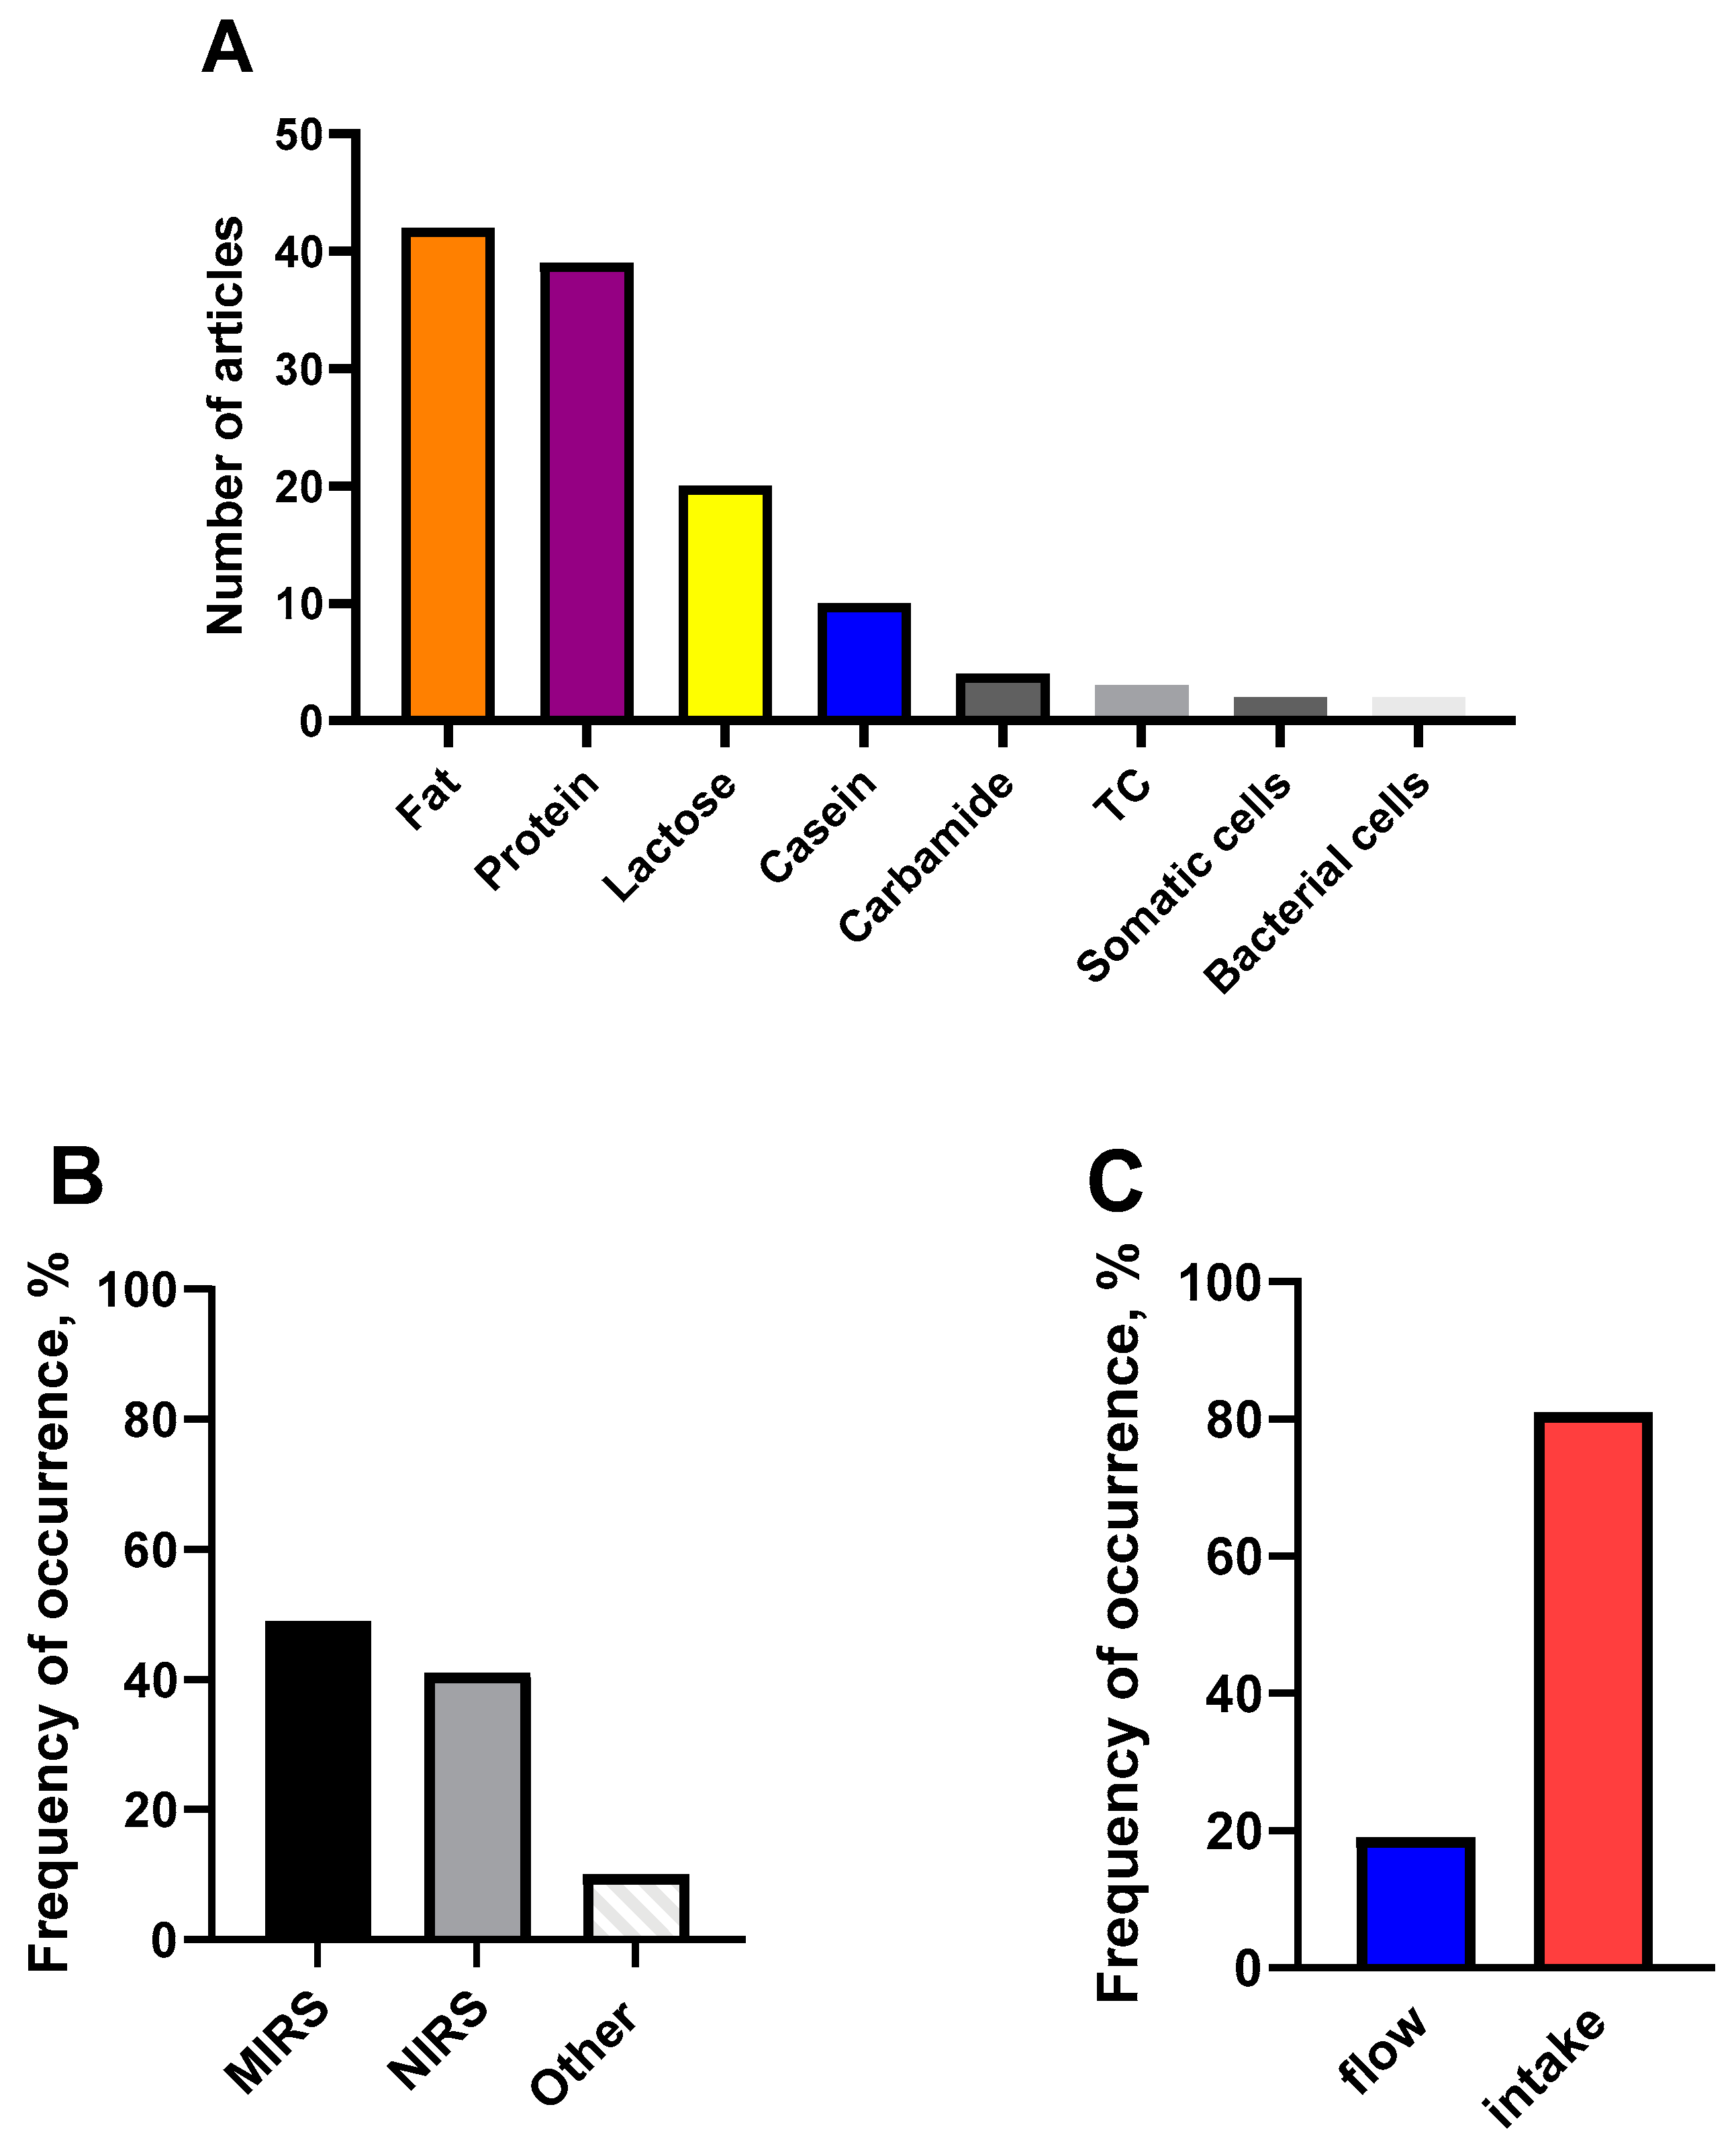
3. Using Optical Methods for Analyzing the Composition of Milk

| N | Analyzer Characteristics | Type (C/I) * | Analysis Method | Spectral Range, nm | Flow/Intake | The Investigated Components of Milk | Method Advantages | Prediction Value | Ref. |
|---|---|---|---|---|---|---|---|---|---|
| 1 | Milkoscan FT + (Foss-Electric A/S, Hillerød, Denmark) | I | NIR-spectroscopy | 851–1649 | intake | fat, protein, lactose, urea | sufficient and adequate prediction accuracy with regard to fat and protein content in milk was achieved | R2 were 0.998, 0.94, and 0.73 for fat, protein, lactose; 0.31 for urea, respectively | [31] |
| 2 | installation: 18 channel multispectral photosensor module and miniature halogen lamp | I | Vis/NIR-spectroscopy | 410–940 | intake | fat, protein, lactose | high measurement speed, cost-effectiveness of the device and operational efficiency | RPD increased for fat after homogenization from 2.34 to 3.48; for total solids from 2.06 to 2.14 | [32] |
| 3 | Xethru X4 sensor | C | wideband dielectric spectroscopy (WBDS) | 1300–3000 | intake | fat | high precision and non-contact application | – | [33] |
| 4 | MilkoScan FT + (Foss Electric A/S) | C | MIR- spectroscopy | 1300–3000 | intake | fat, protein, lactose dry matter, as well as the number of somatic cells | – | – | [34] |
| 5 | five in-line, two-stage MIR homogenizers (Delta Instruments) with different homogenization efficiency; LactoScope FTIR Advanced (FTA) milk analyzer equipped with a BMX optical bench (ABB Bomem, MO, Canada) | C | FT-MIR spectroscopy | 1300–3000 | flow | fat, true protein, anhydrous lactose | homogenization efficiency influenced the results of the assessment of the content of fat and protein | – | [35] |
| 6 | MicroPhazir™ NIR Spectrophotometer | C | NIR-spectroscopy | 1600–2400 | flow | fat, protein, fat-free solids | monitoring in real-time, in-situ and without pre-treatment milk composition, portability, the ability to synchronize between individual devices | R2 for fat, protein, fat-free solids were 0.97, 0.75, 0.61, respectively | [36] |
| 7 | Spectral Analyzer AS7262-AS7263 | I | NIR-spectroscopy | 960–1690 | flow | fat, protein, lactose | system can analyze the milk of each individual milking session autonomously; fast online milk analysis, using a real-time prediction model | R2 = 0.989 (fat), 0.894 (protein) and 0.644 (lactose) | [37] |
| 8 | MilkoScan FT6000, (Foss, Hillerod, Denmark) | C | MIR-spectroscopy | 3359–3612; 5555–5938; 6222–10,799 | intake | non-esterified fatty acids (NEFA) | determination of the content of non-esterified fatty acids (NEFA) in the blood of cows using MIR-IR spectroscopy of milk, without blood sampling | R2 values of 0.613 and 0.502, respectively | [38] |
| 9 | Portable IR spectrometer MicroPHAZIR ™ | C | NIR-spectroscopy | 1600–2400 | intake | protein, fat, fat-free solids, lactose | real-time tracking of quality control parameters for an individual sample | – | [39] |
| 10 | MilkoScan Minor, (Foss, Hillerød, Denmark) | C | NIR-spectroscopy | 400–900 | intake | fat, protein, total solid, lactose | the possibility of using NIR—spectroscopy to assess the genetic variability and heredity of qualitative traits of colostrum | – | [40] |
| 11 | Milko-Scan FT1 (Foss Electric, Hillerød, Denmark). | C | FT-MIR spectroscopy | 2000–10,800 | intake | fat, total protein, casein, lactose, total solids, solids-not-fat | precise definition of milk components for comparison of different genetic groups and breeds of cows | R2 were 0.99 for fat, protein, casein, total solid; 0.97 for lactose; 0.94 for solids-not-fat | [41] |
| 12 | LactoScope FTIR Advanced; five different homogenizers | C | FT-MIR spectroscopy | 1300–3000 | intake | fat | predicting the particle size of fat globules in homogenized milk | – | [42] |
| 13 | MilkoScan FT 120 (FOSS, Hillerød, Denmark; Milcom Servis as, (Prague, Czech Republic) | C | MIR-spectroscopy | 1300–3000 | intake | determination of preservatives content in milk | – | – | [43] |
| 14 | installation: probe with eight fiber optic channels with a diameter of 200 µm, forming a linear array | I | Vis/NIR-spectroscopy | 400–995 | intake, flow | fat, total protein | alternative to full-scale scanning or diode array spectroscopy | R2 for fat 0.97; for protein 0.84 | [44] |
| 15 | MilkoScan FT120 (Foss, Hillerød, Denmark) | C | Vis/NIR spectroscopy dispersion-based | 400–1100 | intake, flow | fat, total protein | the generated PLS regression models were trained on a very large set of milk samples; the accuracy of the resulting models makes them suitable for many practical applications in the dairy industry | R2 for fat was 0.95; for protein was 0.77 (PLS) | [45] |
| 16 | NIR spectrometer MP.0331.04, (Bruker Co., Bremen, Germany) | C | FT-NIR spectroscopy | 833–2500 | intake | fat, total protein | PLSR-UVE-PLS model had excellent protein prediction for non-homogenized milk | RPD when using the PLCR model for protein determination, before homogenization was 2.22; after 2.73 | [46] |
| 17 | Horiba LA-920; (Horiba Instruments Inc., Irvine, CA, USA) | C | Laser scatterometry, Vis/NIR-spectroscopy | 360–970 | intake, flow | fat, fatty acid profile, protein, lactose | the device provides the ability to take multiple samples during milking without losing vacuum or interrupting intermediate milk sampling | R2 for fat, protein, lactose was 0.94; 0.92; 0.84 | [47] |
| 18 | IR spectrophotometer with a diode matrix in the diffuse transmission mode; glass cavity with an internal path length of 4 mm | I | NIR- spectroscopy | 400–1100 | intake | fat, total protein | variety and relative cheapness of components, high design flexibility | R2 = 0.9 for fat and protein | [48] |
| 19 | TIDAS E oT J&M Analytik AG, Esslingen, Germany) in diffuse transmission mode through a 4 mm cuvette | C | Vis/NIR- spectroscopy | 400–1100 | intake | fat, protein | the method shows the influence of the size distribution of fat globules on the diffuse transmission spectra | – | [49] |
| 20 | FTLA 2000 (ABB, Saint-Laurent, QC, Canada) with thermostat and light transmission control | C | FT-NIR-spectroscopy | 780–2500 | intake | Escherichia coli., Pseudomonas aeruginosa | NIRS can be used to detect and quantify pathogenic bacteria and bacteria that cause milk spoilage | R2 for E. coli was 0.94; for P. aeruginosa 0.60 | [50] |
| 21 | testing data from two anonymous MIR instruments | I | MIR-spectroscopy | 1300–3000 | flow | fat, protein, dry matter | a statistical approach has been developed to determine the differences from the obtained values between the two instruments | – | [51] |
| 22 | MilkoScan FT-120, Foss (Foss A/S, Hillerød, Denmark); Near Infra-Red Multipurpose Analyzer (MPA) Bruker Optik Gmbh (Ettlingen, Germany) | C | FT-MIR and FT-NIR spectroscopy | 800–2500; 2500–15,000 | intake | lactose, protein, fat, total solid | near and mid-infrared spectroscopy methods are both valuable for raw milk analysis | Correlation coefficient ≥ 0.96 for protein, r ≥ 0.99 for fat, r = 0.82 for lactose; r = 0.90 for total solid | [52] |
| 23 | installation combining measurements of transmission, scattering and fluorescence spectra of milk; halogen and deuterium lamps, optical fiber system, AvaSpec 2048 spectrometer with 8 nm resolution | I | Vis/NIR- spectroscopy | 300–1100 | intake | fat, protein, carbohydrates, minerals, calories | fluorescence and scattering spectra of milk can be used for the identification of different producers of milk and for obtaining information about milk chemical composition | – | [53] |
| 24 | Milkoscan (Foss Electric, Hillerod, Denmark) | I | NIR-spectroscopy | 700–1050 | flow | fat, protein, lactose, somatic cells | the NIR spectroscopic sensing system developed in this study can be used for online real-time monitoring of fat, protein, lactose and somatic cells | R2 were 0.98; 0.72; 0.54; 0.63 for fat, protein, lactose, somatic cells, respectively | [54] |
| 25 | AfiLab (Afimilk, Kibbutz Afikim, Israel); Bentley 2000 (Bentley Instruments Inc., Chaska, MN, USA) | C | MIR-spectroscopy; NIR-spectroscopy | 300–950; 1300–3000 | intake, flow | fat, anhydrous lactose, protein, total solids content | AfiLab real-time milk analyzers can be useful for assessing the content of milk components | – | [55] |
| 26 | Milkoscan FT + (Foss A/S, Hillerod, Denmark), reflection/transmission mode; | C | MIR-spectroscopy; NIR-spectroscopy | 400–1000; 11,000–2500 | intake | fat, crude protein, lactose, urea | transmission spectroscopy can be used to predict the three main components of milk, but with less accuracy for fat and crude protein than in reflection mode | reflection: R2 for fat and protein was >0.95; for lactose was <0.75; transmission: R2 for fat and protein was >0.9; for lactose was 0.88; | [7] |
| 27 | MilkoScan FT6000 (Foss Electronic A/S) | C | FT-MIR-spectroscopy | 2000–12,000 | intake | fat, protein, lactose | using modern statistical machine learning methods to predict features based on mid-infrared spectroscopy can improve prediction accuracy | R2 were 0.65 for pH; 0.5 for rennet coagulation time; 0.2–0.5 for protein; <1 for casein micelle size | [56] |
| 28 | MilkoScan FT6000 (Foss Electric A/S, Hillerod, Denmark) | C | MIR-spectroscopy | 2000–15,000 | intake | fatty acid composition, protein, lactoferrin, Ca, P, Mg, K | the use of various models for forecasting the composition | – | [57] |
| 29 | MilkoScan FT6000 (Foss Electric A/S, Hillerod, Denmark) | C | MIR- spectroscopy | 2000–15,000 | intake | fatty acid profile, protein composition, lactoferrin, concentration of basic minerals | high accuracy of the profile of fatty acids in milk | RPD were 1.8–2.0 for fatty acids; 1.6 for protein; 1.8 for fat; 1.3–1.4 for minerals | [58] |
| 30 | Milko-Scan FT120 (Foss Electric A/S, Denmark) | C | FT-MIR spectroscopy | 2500–12,000 | intake | total protein, casein, milk protein composition, β-lactoglobulin, glycosylated κ- casein, whey protein | the use of FT-MIRS to predict the detailed protein composition of milk | RPD were 2.2 for protein; 2.07 for casein; 1.6 for whey protein | [59] |
| 31 | Optigraph (OPT; Ysebaert SA, Frépillon, France); MilkoScan FT6000 (Foss Electric A/S, Hillerod, Denmark); Fossomatic FC (Foss Electric A/S) for determining the presence of somatic cells | C | NIR-spectroscopy; MIR-spectroscopy | 2000–15,000; 350–1000 | intake | fat, protein, casein, lactose | the optical method for analyzing the composition of milk is a good alternative to the mechanical method | correlation coefficients for rennet coagulation time was 0.82; for curd-firming time was 0.49; curd firmness at 30 min was 0.69; for curd firmness at 45 min was 0.41 | [60] |
| 32 | MilkoScan FT 6000 (Foss Electric A/S, Hillered, Denmark) | C | MIR-spectroscopy | 2000–15,000 | intake | fat, fatty acid profile, total protein, casein, lactoferrin, Ca, P, Mg, K | MIR spectroscopy is suitable for evaluating genetic parameters | R2 < 0.5 for minerals; 0.2–0.7 for rennet coagulation time; 0.7 for fat; 0.8 for casein; 0.42 for lactoferin | [61] |
| 33 | MilkoScan FT 6000 (Foss, Hillered, Denmark) | C | MIR-spectroscopy | 2000–12,000 | intake | fat, fatty acid profile | the use of MIR spectroscopy for the evaluation of fatty acids; using six different data processing methods | RPD were 21.8, 19,4, 24,0, 22,2, 22,4, and 21,1 for 1–6 methods, respectively | [62] |
| 34 | handheld spectrometer 4100 EXOSCAN (Agilent Technologies); tabletop Nicolet™ iS10 FTIR (Thermo Scientific™) | C | FT-MIR | 2500–15,384 | intake | proteins, fats, carbohydrates | handheld FT-MIR—a good alternative to the benchtop analyzer for the analysis of macrocomponents in milk | Benchtop: R2 were 0.96; 0.90; 0.92 for fats, proteins, and carbohydrates, respectively (PLS models) Portable: R2 were 0.91; 0.69; 0.86 for fats, proteins, and carbohydrates, respectively (PLS models) | [63] |
| 35 | Spectrum GX, (Perkin-Elmer Ltd., Beaconsfield, UK) equipped with a DTGS detector | C | FTIR spectroscopy combined with 2D correlation IR spectroscopy | 2500–25,000 | intake | determination of different types of carbohydrates, incl. lactose | quick and convenient way to assess the quality of milk powder | Correlation coefficients were 0.97–0.99 | [64] |
| 36 | FTIR spectrometer with diamond/ZnSe crystal cell ATR (RX-1 Perkin Elmer, MA, USA) | C | FT-IR- spec-troscopy | 2500–25,000 | intake | fat, proteins, carbohydrates | accurate forecast using PLS-DA model | R2 = 0.958 | [65] |
| 37 | Milko-Scan FT120 (Foss Electric A/S, Hillered, Denmark) | C | FT-MIR spectroscopy | 2500–11,110 | intake | casein | the possibility of predicting the properties of milk coagulation and acidity of milk using MIR spectroscopy in combination with PLS regression was shown | R2 for titratable acidity was 0.66; rennet coagulation time and pH were 0.59–0.62 | [66] |
| 38 | MPA Multi Purpose FT-NIR Analyzer (Bruker, Germany) | C | MIR/NIR spectroscopy | 1110–2500 | intake | melamine | fast, sensitive, reliable, and inexpensive method for the analysis of liquid milk | – | [67] |
| 39 | MilkoScan FT 6000 (Foss Electronic A/S, Hillered, Denmark) | C | MIR- spectroscopy | 2000–11,110 | intake | protein, fat, casein, urea, dry matter | fast and inexpensive milk quality control using MIR-spectroscopy | R2 = 0.73 for pH; 0.61 for rennet coagulation time | [68] |
| 40 | CombiFoss FT+ analyzer (FOSS, Hillerød, Denmark) | C | FT- MIR spectroscopy | 1996–10,810 | intake | fat, protein, lactose, urea, β-hydroxybutyrate | a methodology of spectral analysis was developed to study the relationship between animal welfare and milk FTIR spectral data | – | [69] |
| 41 | Ultra-compact spectrometer Micro-NIR 1700 (JDSU, Milpitas, CA/USA); desktop NIRFlex N-500 (Buchi AG, Flawil, Switzerland) | C | FT-NIR-spectroscopy | 908–1676 (Micro-NIR 1700); 1000–2500 (NIRFlex N-500) | intake | fatty acid profile | a new method is presented for organic milk authentication by portable NIR spectroscopy | Correlation coefficients were 0.1–0.4 for different fatty acids | [70] |
| 42 | Bentley Instruments NexGen Series FTS Combi machine (Chaska, MN, USA) | C | MIR- spectroscopy | 2500–15,408 | intake | fat, protein, lactose | determination of the pregnancy status of dairy cows using MIRS analysis of the composition of milk | – | [71] |
| 43 | CARY 5G UV/VIS/NIR | C | NIR- spectroscopy | 1027–2400 | intake | starch, whey, sucrose | LS-SVM models were built with low prediction errors and superior performance compared to PLS | LS-SVM: R2 for starch, whey and sucrose were 1.0; PLS: R2 were 0.99, 0.98, and 0.99, respectively | [72] |
| 44 | MilkoScan FT7 | C | MIR- spectroscopy | 2000–15,000 | intake | fat, total protein, casein, lactose, urea nitrogen, β-hydroxybutyrate | analysis of the content of metabolites in the blood based on the obtained spectra of milk | coefficients of determination for β-hydroxybutyrate, urea, and non-esterified fatty acids were 0.63, 0.58, and 0.52, respectively | [73] |
| 45 | Milko-Scan FT120 equipped with a Fourier transform infrared interferometer | C | MIR- spectroscopy | 2000–15,000 | intake | fat, protein, casein | the method makes it possible to predict the coagulation parameters of milk using MIR methods | R2 were 0.6 for rennet coagulation time; 0.5 for curd firmness | [74] |
| 46 | model 6500 NIRS scanning spectrometer (Foss NIR Systems) | C | Vis/NIR- spectroscopy | 400–2500 | intake | fat, protein | the approach can be used to authenticate dairy products | – | [75] |
| 47 | MilkoScan FT6000 (FOSS Analytical A/S, Hillerød, Denmark) | C | FT-MIR- spectroscopy | 2000–15,000 | intake | fat, total protein, lactose, casein, acetone (Ac), acetoacetate (AcAc), β-hydroxybutyrate (BHBA) | the milk analyzer can be calibrated to detect subclinical ketosis, which allows for additional assessment of the health of the herd | Correlation coefficient for Ac and BHBA was 0.8 | [76] |
| 48 | the system consisted of an NIR spectroscopic instrument, a milk flow meter, a milk sampler | I | NIR- spectroscopy | 600–1050 | flow | fat, protein, lactose, somatic cells, urea nitrogen | NIR spectroscopy can be used for on-line monitoring of fat, protein, lactose, somatic cells and urea nitrogen during milking using a milking robot with sufficient accuracy | R2 for fat, protein, lactose and somatic cells were 0.95; 0.72; 0.83, and 0.68, respectively | [77] |
| 49 | Matrix-F FT-NIR, (Bruker, Germany) | C | FT-NIR- spectroscopy | 800–2500 | flow | fat, protein, total solid content | FT-NIR flow technology has demonstrated accurate, reliable, and consistent performance | Correlation coefficient were 0.96 for fat; 0.85 for protein; 0.96 for total solid; RPD were 5.1, 2.2, 1.3, respectively | [78] |
| 50 | Bruker Equinox 55 IR spectrometer using adeuterated triglycerine sulfate (DTGS) detector (Bruker Ltd., Coventry, UK) | C | FT-IR- spectroscopy | 2500–20,000 | intake | Staphylococcus aureus, Lactococcus lactis ssp.cremoris | FT-IR spectroscopy made it possible to fairly well assess the levels of S. aureus and L. lactis in both pure form and in co-cultures | R2 varied on average from 0.78 to 0.88 | [79] |
4. Application of IR Spectroscopy to Analyze the Quality of Feed
| N | Analyzer Characteristics | Type (C/I) * | Analysis Method | Spectral Range, nm | Object | The Investigated Parameters of Feed | Method Advantages | Prediction Value | Ref. |
|---|---|---|---|---|---|---|---|---|---|
| 1 | Thermo Fisher Scientific Nicolet 5700 equipped with Smart iTR TM Attenuated Total Reflectance sampling device | C | ATR-FT-MIR spectroscopy | 2500–14,815 | ryegrass, white clover, chicory, plantain | DM, hemicellulose | portable method for analysis of feed composition | R2 were 0.92 and 0.86 for hemicellulose and neutral detergent fiber, respectively | [23] |
| 2 | spectrometer with an array of micromirrors and a single-element detector | I | NIR-spectroscopy | 800–2500 | lucerne | CP, NDF, ADF | a high-performance portable NIR spectrometer with an embedded chemometric model has been developed to extract the necessary information about the quality of feed | R2 were 0.516, 0.742, 0.704, for CP, ADF, NDF, respectively | [97] |
| 3 | - | I | NIR-spectroscopy | 1000–2500 | fermented sago residues | NDF, ADF, in vitro dry matter digestibility (IVDMD), in vitro organic matter digestibility (IVOMD) | excellent results for IVDMD, IVOMD, and NDF predictions have been achieved | RPD were 2.78 for IVDMD; 2.35 for IVOMD; 2.31 for NDF; 3.00 for ADF | [110] |
| 4 | Bruker MPA (Bruker, Bremen, Germany) | C | FT-NIR-spectroscopy | 800–2500 | Italian ryegrass (Lolium multiflorum) | CP, ADF, NDF, WSC | four optimal NIRS models have been developed to predict CP, NDF, ADF, and WSC content in Italian ryegrass samples | RPD for CP 8.58; for NDF 4.25; for ADF 3.64; for WSC 3.10 | [98] |
| 5 | FOSS NIRSystems 5000 (FOSS NIRSystems, Silver Spring, MD); PoliSPEC NIR PL1 and PL2 (ITPhoton-ics, Breganze, Italy) | C | NIR-spectroscopy | 1100–2500 (FOSS NIRSystems 5000); 902–1680 (PoliSPEC NIR) | corn silage | DM, ash, CP, NDF, ADF, starch, total sugar (TS) | poliSPECNIR PL2 gave more accurate predictions of feed composition than PL1 | 0.72 > R2 < 0.97 for DM, ash and NDF; 0.78 > R2 < 0.82 for CP and ADF | [101] |
| 6 | eight kinds of handheld spectrometers: DLP NIRscan Nano EVM, F750, LabSpec 4, MicroNIR1700, MicroNIR2200, NI-RONE 2.2, Scio, TellSpec | C | NIR-spectroscopy | 350–2500 (LabSpec 4); 901–1701 (NIRscan Nano EVM); 450–1140 (F750); 908–1676 (MicroNIR1700); 1158–2169 (MicroNIR2200); 1750–2150 (NIRONE 2.2); 740–1070 (Scio); 900–1700 (TellSpec) | Saccharum officinarum | TS, CP, ADF, IVOMD | successful prediction of the composition of dried sugar cane by eight commercial mini-spectrometers with varying accuracy | R2 for TS: DLP NIRscan 0.86; F750 0.72; LabSpec 4 0.97; MicroNIR1700 0.94; MicroNIR2200 0.97; NIRONE 2.2 0.79; Scio 0.68; TellSpec 0.69; R2 for CP: DLP NIRscan 0.65; F750 087; LabSpec 4 0.92; MicroNIR1700 0.91; MicroNIR2200 0.89; NIRONE 2.2 090; Scio 0.87; TellSpec 0.73 | [109] |
| 7 | NIRSystems 6500 scanning monochromator (FOSS, Silver Spring, MD, USA) with a transportmodule | C | NIR-spectroscopy | 400–2500 | Meadow grasses | total N; nitrogen in the substance precipitated by trichloroacetic acid; insoluble nitrogen in borate-phosphate buffer; insoluble nitrogen in neutral detergents; acid detergent insoluble nitrogen (ADIN) | accurately predicted the content of total nitrogen, nitrogen in the substance precipitated by trichloroacetic acid, and nitrogen insoluble in neutral detergents | R2 were 0.97 for total N; 0.91 for nitrogen in the substance precipitated by trichloroacetic acid; 0.69 for insoluble nitrogen in borate-phosphate buffer; 0.95 for insoluble nitrogen in neutral detergents; 0.74 for ADIN | [10] |
| 8 | FieldSpec Pro (Analytical Spectral Devices, Incorporated) | C | NIR-spectroscopy | 350–1050 | Salix spp. | CP, NDF, ADF, acid detergent lignin, acid insoluble ash, tannins, digestible protein (DP), digestible dry matter (DDM) | feed quality indicators such as DP and DDM can be successfully quantified using hyperspectral remote sensing data | R2 were 0.81 for DP; 0.73 for DDM; | [99] |
| 9 | Unity Spectrastar 2500X rotating top window system (Unity Scientific, Milford, MA, USA) | C | NIR-spectroscopy | 680–2500 | herbs, legumes | total N, CP, NDF, ADF | broad calibrations predict the performance of annual grasses, annual legumes, and forbs more accurately than perennial grasses or legumes | RPD were 5.3 for CP; 4.3 for NDF; 3.7 for ADF; 2.2 for organic matter | [111] |
| 10 | benchtop-type (FOSS) and two handheld NIR devices (microPHAZIR and DLP NIRscan Nano EVM) | C | NIR-spectroscopy | 1100–2498 (FOSS); 1600–2400 (microPHAZIR); 900–1700 (DLP NIRscan) | Panicum virgatum L., Cynodon dactylon (L.) | CP, ADF, NDF, IVTD | the ability to predict component content for both handheld devices was similar to that of a desktop device | R2 were 0.81–0.87 for NDF; 0.96–0.99 for CP; 0.84 for ADF; 0.9–0.97 for IVTD | [112] |
| 11 | NIRSystem 6500 (Foss NIRSystems, Inc., Silver Spring, MD, USA) | C | NIR-spectroscopy | 400–2498 | Sorghum bicolor (L.) Moench × Sorghum sudanense Stapf. cv. Superdan | hydrogen cyanide (HCN) | possibility of using NIR to predict HCN content in feed sorghum | PLS model: R2 = 0.838; multiple linear regression (MLR) approach: R2 = 0.847 | [102] |
| 12 | SVC HR 1024-i, (Spectra Vista Corporation, Poughkeepsie, NY, USA) | C | vis-NIR-spectroscopy | 350–2500 | herbal crops of mountain pastures | ash, fat, protein, fiber | fast, economical, and high-performance method for analyzing feed quality | R2 were 0.83 for ash; 0.86 for fat; 0.42 for fiber; 0.93 for protein | [11] |
| 13 | SpectraStar 2600 XT-R, (Unity Scientific, Columbia, MD, USA) | C | NIR-spectroscopy | 680–2600 | Cyamopsis tetragonoloba, Phaseolus acutifolius, Cajanus cajan, Glycine max, Vigna aconitifolia | CP, NDF, ADF, IVTD | NIRS methods can be effective in providing fast and accurate predictions of most feed quality characteristics for various warm-season legumes; machine learning algorithms such as SVM can also develop robust models with relatively few samples | PLS model: R2 were 0.94–0.98 for all forage quality parameters | [113] |
| 14 | Foss NIRSystem 6500 (Foss North America, MN); AuroraNir (Grainit srl, Italy); NIR-S-G1 (Innospectra, Taiwan); SCiO (Consumer Physics, Hod Hasharon, Israel) | C | NIR-spectroscopy | 1100–2498 (FOSS); 950–1650 (AuroraNir, NIR-S-G1); 740–1070 (SCiO) | Medicago sativa L. | NDF, ADF, ADL, IVTD | portable analyzers AuroraNir and NIR-S-G1 are an alternative to expensive benchtop laboratory equipment, while providing reasonably accurate predictions | AuroraNir: R2 = 0.97 for CP; 0.95 for NDF; 0.96 for ADF; 0.93 for ADL; 0.90 for IVTD; NIR-S-G1: R2 = 0.94 for CP; 0.91 for NDF; 0.93 for ADF; 0.86 for ADL; 0.87 for IVTD | [114] |
| 15 | Vector22/N, (Bruker, Ettlingen, Germany) | C | NIR-spectroscopy | 833–2500 | Zea Mays ssp. L. | % in vitro digestibility, NDF, ADF, CP, Crude Fat | the optimal timing of harvesting corn at the peak of the total assimilable energy was proposed | – | [21] |
| 16 | Lambda FTIR-7600 c ATR (Tianjin Gangdong Sci. & Tech. Development Co. Ltd., Nankai, China) | C | FT-MIR-spectroscopy | 2500–12,500 | ceHo Medicago sativa L. | spectral profiles and chemical properties of protein amides I and II | non-invasive molecular spectroscopy methods are able to detect the features of the internal protein structure of feed | – | [106] |
| 17 | NIRS DS2500-FOSS Analytrical A/S—Denmark) | C | NIR-spectroscopy | - | Vicia faba, Zea mayz var. ICA V-305, Raphanus sativus L., Beta vulgaris, Avena sativa var. Cayuse, Phalaris sp., Medicago sativa L. var. moapa, Medicago sativa L. | DM, CP, NDF, ADF, lignin, hemicellulose, dry matter digestibility and net energy of lactation (ENL) | comparison of nutritional characteristics of different types of forage plants using NIRS | – | [115] |
| 18 | UAV with a camera with a spectral sensor Cubert Hyperspectral Fire-fleye S185 SE (Cubert GmbH, (Ulm, Germany) | C | vis-NIR-spectroscopy | 482–950 | hay meadows, Nardus stricta, Lupinus polyphyllus | CP, ADF | the resulting models can accurately estimate the content of crude protein and acid-detergent fiber regardless of the type of pasture; the accuracy of the models is in the same range as the accuracy obtained using field spectroscopy | R2 were 0.33–0.4 for CP; 0.23–0.33 for ADF | [116] |
| 19 | Foss NIRSystems model 6500 (Foss NIRSystems, Silver Spring, MD, USA) | C | Vis-NIR-spectroscopy | 400–2500 | silage | N, NDF, ADF, dry matter digestibility pepsin cellulase (PCDMD) | the developed calibration equations are sufficiently reliable for successful prediction of the considered parameters for permanent grass hayfields | RPD were 7.95, 4.28, 4.23, 5.23 for N, NDF, ADF, PCDMD, respectively | [117] |
| 20 | XDS-NIRS rapid content analyzer (FOSS Analytical, Slangerupgade, Denmark) | C | NIR-spectroscopy | 400–2498 | soybean | CP, crude fat, NDF, ADF | the developed NIR calibration equations are useful for predicting the quality of soybeans according to the considered quality parameters | R2 were 0.92, 0.94, 0.84, 0.78 for CP, CF, NDF, ADF, respectively | [22] |
| 21 | Micro-Hyperspec VNIR model, Headwall Photonics, (Bolton, MA, USA) | C | Vis/NIR-spectroscopy | 400–850 | durum wheat grains Triticum sp. | protein | the use of Vis/NIR- spectroscopy in the form of remote sensing from an airplane made it possible to assess the state of the wheat crop | R2 ≤ 0.21 | [118] |
| 22 | Foss NIRS model 6500 (FOSS Analytical, Slangerupgade, Denmark) | C | NIR-spectroscopy | 400–2500 | Salix caroliniana | CP, ADF, NDF, lignin, gross energy (GE), condensed tannin (CT) | accurate prediction of the content of the considered components in the leaves and stems of willow collected in different seasons and years | R2 > 0.75 for CP, ADF, NDF, and GE; R2 = 0.72 for CT | [100] |
| 23 | NIRS DS2500 (Foss UK Ltd., Warrington, UK) | C | NIR-spectroscopy | 1100–2500 | hay, grass, silage | mineral content (Ca, P, K, S, Mg, Na) | the importance of preliminary preparation of the sample under study is shown; drying and grinding of samples increased the accuracy of NIRS analysis | Hay: R2 were 0.31; 0.30; 0.48; 0.41; 0.35; 0.31 for Ca, P, Mg, K, S, Na, respectively | [105] |
| 24 | Thermo Nicolet Antaris II TM | C | NIR-spectroscopy | 1000–2500 | sago leftovers, coconut flour, soy and ketchup by-products, coffee pulp, cocoa pods, sago tree, ear of corn | IVOMD, IVDMD, NDF, ADF | fast and reliable prediction and determination of several nutritional parameters of animal feeds simultaneously | R2 were 0.75, 0.83, 0.59, 0.61 for NDF, ADF, IVOMD, IVDMD, respectively | [108] |
| 25 | MPA, Opus Bruker, (Germany) | C | FT-NIR-spectroscopy | 800–2778 | grassland plant samples | CP, NDF | significant correlation between NIRS calibration models and reference methods for quantifying pasture quality parameters with greater accuracy in dry samples | dry samples: R2 = 0.936 and RPD = 4.01 for CP; R2 = 0.914 and RPD = 3.48 for NDF; fresh samples: R2 = 0.702 and RPD = 1.88 for CP; R2 = 0.720 and RPD = 2.38 for NDF | [119] |
5. Future Directions/Prospects for the Development of Optical Technologies for Quality Control on the Farm
6. Conclusions
Author Contributions
Funding
Institutional Review Board Statement
Informed Consent Statement
Data Availability Statement
Conflicts of Interest
References
- Górska-Warsewicz, H.; Rejman, K.; Laskowski, W.; Czeczotko, M. Milk and Dairy Products and Their Nutritional Contribution to the Average Polish Diet. Nutrients 2019, 11, 1771. [Google Scholar] [CrossRef] [Green Version]
- Visioli, F.; Strata, A. Milk, Dairy Products, and Their Functional Effects in Humans: A Narrative Review of Recent Evidence. Adv. Nutr. 2014, 5, 131–143. [Google Scholar] [CrossRef] [PubMed] [Green Version]
- Gerrior, S.; Putnam, J.; Bente, L. Milk and milk products: Their importance in the American diet. Food Rev. Natl. Food Rev. 1998, 21, 29–37. [Google Scholar]
- Kubicová, L.; Habánová, M. Development of milk consumption and marketing analysis of its demand. Potravin. Slovak J. Food Sci. 2012, 6, 66–72. [Google Scholar]
- Bórawski, P.; Kalinowska, B.; Mickiewicz, B.; Parzonko, A.; Klepacki, B.; Dunn, J.W. Changes in the Milk Market in the United States on the Background of the European Union and the World. Eur. Res. Stud. J. 2021, 24, 1010–1033. [Google Scholar] [CrossRef]
- Shahbandeh, M. Global Cow Milk Production 2015 to 2020. Available online: https://www.statista.com/topics/4649/dairy-industry/ (accessed on 1 October 2021).
- Aernouts, B.; Polshin, E.; Lammertyn, J.; Saeys, W. Visible and near-infrared spectroscopic analysis of raw milk for cow health monitoring: Reflectance or transmittance? J. Dairy Sci. 2011, 94, 5315–5329. [Google Scholar] [CrossRef] [Green Version]
- Luiz, L.d.C.; Bell, M.J.V.; Rocha, R.A.d.; Leal, N.L.; Anjos, V.d.C.d. Detection of Veterinary Antimicrobial Residues in Milk through Near-Infrared Absorption Spectroscopy. J. Spectrosc. 2018, 2018, 5152832. [Google Scholar] [CrossRef]
- Shenk, J.S.; Workman, J.J., Jr.; Westerhaus, M.O. Application of NIR spectroscopy to agricultural products. In Handbook of Near-Infrared Analysis; CRC Press: Boca Raton, FL, USA, 2007; pp. 365–404. [Google Scholar]
- Valdés, C.; Andrés, S.; Giraldez, F.J.; García, R.; Calleja, A. Potential use of visible and near infrared reflectance spectroscopy for the estimation of nitrogen fractions in forages harvested from permanent meadows. J. Sci. Food Agric. 2006, 86, 308–314. [Google Scholar] [CrossRef]
- Berauer, B.J.; Wilfahrt, P.A.; Reu, B.; Schuchardt, M.A.; Garcia-Franco, N.; Zistl-Schlingmann, M.; Dannenmann, M.; Kiese, R.; Kühnel, A.; Jentsch, A. Predicting forage quality of species-rich pasture grasslands using vis-NIRS to reveal effects of management intensity and climate change. Agric. Ecosyst. Environ. 2020, 296, 106929. [Google Scholar] [CrossRef]
- Nocita, M.; Stevens, A.; van Wesemael, B.; Aitkenhead, M.; Bachmann, M.; Barthès, B.; Ben Dor, E.; Brown, D.J.; Clairotte, M.; Csorba, A.; et al. Soil Spectroscopy: An Alternative to Wet Chemistry for Soil Monitoring. In Advances in Agronomy; Sparks, D.L., Ed.; Academic Press: Cambridge, MA, USA, 2015; Volume 132, pp. 139–159, Chapter Four. [Google Scholar]
- Robson, A.; Phinn, S.; Wright, G.; Fox, G. Combining near infrared spectroscopy and infrared aerial imagery for assessment of peanut crop maturity and aflatoxin risk. In Proceedings of the 4th International Crop Science Congress, Brisbane, QLD, Australia, 26 September–1 October 2004. [Google Scholar]
- Yang, D.; Ying, Y. Applications of Raman spectroscopy in agricultural products and food analysis: A review. Appl. Spectrosc. Rev. 2011, 46, 539–560. [Google Scholar] [CrossRef]
- Dong, Z.; Men, Y.; Liu, Z.; Li, J.; Ji, J. Application of chlorophyll fluorescence imaging technique in analysis and detection of chilling injury of tomato seedlings. Comput. Electron. Agric. 2020, 168, 105109. [Google Scholar] [CrossRef]
- Coates, J. Interpretation of infrared spectra, a practical approach. In Encyclopedia of Analytical Chemistry; John Wiley & Sons Ltd.: Chichester, UK, 2000. [Google Scholar]
- Manley, M. Near-infrared spectroscopy and hyperspectral imaging: Non-destructive analysis of biological materials. Chem. Soc. Rev. 2014, 43, 8200–8214. [Google Scholar] [CrossRef] [Green Version]
- Beć, K.B.; Grabska, J.; Huck, C.W. Near-Infrared Spectroscopy in Bio-Applications. Molecules 2020, 25, 2948. [Google Scholar] [CrossRef]
- Evangelista, C.; Basiricò, L.; Bernabucci, U. An Overview on the Use of Near Infrared Spectroscopy (NIRS) on Farms for the Management of Dairy Cows. Agriculture 2021, 11, 296. [Google Scholar] [CrossRef]
- Türker-Kaya, S.; Huck, C.W. A Review of Mid-Infrared and Near-Infrared Imaging: Principles, Concepts and Applications in Plant Tissue Analysis. Molecules 2017, 22, 168. [Google Scholar] [CrossRef] [Green Version]
- Fu, F.-L.; Guo, C.-J.; Tang, Q.-L.; Jian, L.; Li, W.-C. Growth dynamics and optimal harvesting stage of two forage maize varieties. Agric. Sci. China 2011, 10, 220–227. [Google Scholar] [CrossRef]
- Asekova, S.; Han, S.-I.; Choi, H.-J.; Park, S.-J.; Shin, D.-H.; Kwon, C.-H.; Shannon, J.G.; LEE, J.D. Determination of forage quality by near-infrared reflectance spectroscopy in soybean. Turk. J. Agric. For. 2016, 40, 45–52. [Google Scholar] [CrossRef] [Green Version]
- Cleland, J.D.; Johnson, E.; Morel, P.C.; Kenyon, P.R.; Waterland, M.R. Mid-infrared reflectance spectroscopy as a tool for forage feed composition prediction. Anim. Feed. Sci. Technol. 2018, 241, 102–111. [Google Scholar] [CrossRef]
- Griffiths, P. Fourier transform infrared spectrometry. Science 1983, 222, 297–302. [Google Scholar] [CrossRef] [PubMed] [Green Version]
- Legner, N.; Meinen, C.; Rauber, R. Root Differentiation of Agricultural Plant Cultivars and Proveniences Using FTIR Spectroscopy. Front. Plant Sci. 2018, 9, 748. [Google Scholar] [CrossRef] [PubMed] [Green Version]
- Li, X.C.; Zhao, J.M.; Wang, C.C.; Liu, L.H. Improved transmission method for measuring the optical extinction coefficient of micro/nano particle suspensions. Appl. Opt. 2016, 55, 8171–8179. [Google Scholar] [CrossRef] [Green Version]
- Soulat, J.; Andueza, D.; Graulet, B.; Girard, C.L.; Labonne, C.; Ait-Kaddour, A.; Martin, B.; Ferlay, A. Comparison of the potential abilities of three spectroscopy methods: Near-infrared, mid-infrared, and molecular fluorescence, to predict carotenoid, vitamin and fatty acid contents in cow milk. Foods 2020, 9, 592. [Google Scholar] [CrossRef]
- Kirsanov, V.V.; Shkirin, A.V.; Pavkin, D.Y.; Ignatenko, D.N.; Danielyan, G.L.; Khakimov, A.R.; Bunkin, N.F. Laser Fluorescence and Extinction Methods for Measuring the Flow and Composition of Milk in a Milking Machine. Photonics 2021, 8, 390. [Google Scholar] [CrossRef]
- Shkirin, A.V.; Ignatenko, D.N.; Chirikov, S.N.; Bunkin, N.F.; Astashev, M.E.; Gudkov, S.V. Analysis of Fat and Protein Content in Milk Using Laser Polarimetric Scatterometry. Agriculture 2021, 11, 1028. [Google Scholar] [CrossRef]
- Kirichenko, M.N.; Chaikov, L.L.; Shkirin, A.V.; Krasovskii, V.I.; Bulychev, N.A.; Kazaryan, M.A.; Krivokhizha, S.V.; Milovich, F.O.; Chirikov, S.N. General Features of Size Distributions and Internal Structure of Particles in Aqueous Nanosuspensions. Phys. Wave Phenom. 2020, 28, 140–144. [Google Scholar] [CrossRef]
- Melfsen, A.; Hartung, E.; Haeussermann, A. Accuracy of milk composition analysis with near infrared spectroscopy in diffuse reflection mode. Biosyst. Eng. 2012, 112, 210–217. [Google Scholar] [CrossRef]
- Yang, B.; Huang, X.; Yan, X.; Zhu, X.; Guo, W. A cost-effective on-site milk analyzer based on multispectral sensor. Comput. Electron. Agric. 2020, 179, 105823. [Google Scholar] [CrossRef]
- Saeedi, S.; Chamaani, S. Non-contact Time Domain Ultra Wide Band Milk Spectroscopy. IEEE Sens. J. 2021, 21, 13849–13857. [Google Scholar] [CrossRef]
- Teng, Z.; Yang, G.; Wang, L.; Fu, T.; Lian, H.; Sun, Y.; Han, L.; Zhang, L.; Gao, T. Effects of the circadian rhythm on milk composition in dairy cows: Does day milk differ from night milk? J. Dairy Sci. 2021, 104, 8301–8313. [Google Scholar] [CrossRef] [PubMed]
- Di Marzo, L.; Barbano, D.M. Effect of homogenizer performance on accuracy and repeatability of mid-infrared predicted values for major milk components. J. Dairy Sci. 2016, 99, 9471–9482. [Google Scholar] [CrossRef] [PubMed] [Green Version]
- de la Roza-Delgado, B.; Garrido-Varo, A.; Soldado, A.; Arrojo, A.G.; Valdés, M.C.; Maroto, F.; Pérez-Marín, D. Matching portable NIRS instruments for in situ monitoring indicators of milk composition. Food Control 2017, 76, 74–81. [Google Scholar] [CrossRef]
- Diaz-Olivares, J.A.; Adriaens, I.; Stevens, E.; Saeys, W.; Aernouts, B. Online milk composition analysis with an on-farm near-infrared sensor. Comput. Electron. Agric. 2020, 178, 105734. [Google Scholar] [CrossRef]
- Aernouts, B.; Adriaens, I.; Diaz-Olivares, J.; Saeys, W.; Mäntysaari, P.; Kokkonen, T.; Mehtiö, T.; Kajava, S.; Lidauer, P.; Lidauer, M.H. Mid-infrared spectroscopic analysis of raw milk to predict the blood nonesterified fatty acid concentrations in dairy cows. J. Dairy Sci. 2020, 103, 6422–6438. [Google Scholar] [CrossRef] [PubMed]
- Muñiz, R.; Cuevas-Valdés, M.; de la Roza-Delgado, B. Milk quality control requirement evaluation using a handheld near infrared reflectance spectrophotometer and a bespoke mobile application. J. Food Compos. Anal. 2020, 86, 103388. [Google Scholar] [CrossRef]
- Soufleri, A.; Banos, G.; Panousis, N.; Fletouris, D.; Arsenos, G.; Valergakis, G. Genetic parameters of colostrum traits in Holstein dairy cows. J. Dairy Sci. 2019, 102, 11225–11232. [Google Scholar] [CrossRef]
- Cheruiyot, E.K.; Bett, R.C.; Amimo, J.O.; Mujibi, F.D. Milk composition for admixed dairy cattle in Tanzania. Front. Genet. 2018, 9, 142. [Google Scholar] [CrossRef] [Green Version]
- Di Marzo, L.; Cree, P.; Barbano, D.M. Prediction of fat globule particle size in homogenized milk using Fourier transform mid-infrared spectra. J. Dairy Sci. 2016, 99, 8549–8560. [Google Scholar] [CrossRef] [Green Version]
- Zajác, P.; Zubrická, S.; Čapla, J.; Zeleňáková, L.; Židek, R.; Čurlej, J. Effect of preservatives on milk composition determination. Int. Dairy J. 2016, 61, 239–244. [Google Scholar] [CrossRef]
- Bogomolov, A.; Belikova, V.; Galyanin, V.; Melenteva, A.; Meyer, H. Reference-free spectroscopic determination of fat and protein in milk in the visible and near infrared region below 1000 nm using spatially resolved diffuse reflectance fiber probe. Talanta 2017, 167, 563–572. [Google Scholar] [CrossRef]
- Melenteva, A.; Galyanin, V.; Savenkova, E.; Bogomolov, A. Building global models for fat and total protein content in raw milk based on historical spectroscopic data in the visible and short-wave near infrared range. Food Chem. 2016, 203, 190–198. [Google Scholar] [CrossRef]
- Wang, Y.; Guo, W.; Zhu, X.; Liu, Q. Effect of homogenisation on detection of milk protein content based on NIR diffuse reflectance spectroscopy. Int. J. Food Sci. Technol. 2019, 54, 387–395. [Google Scholar] [CrossRef]
- Rico, D.; Marshall, E.; Choi, J.; Kaylegian, K.; Dechow, C.; Harvatine, K. Within-milking variation in milk composition and fatty acid profile of Holstein dairy cows. J. Dairy Sci. 2014, 97, 4259–4268. [Google Scholar] [CrossRef]
- Galyanin, V.; Melenteva, A.; Bogomolov, A. Selecting optimal wavelength intervals for an optical sensor: A case study of milk fat and total protein analysis in the region 400–1100 nm. Sens. Actuators B Chem. 2015, 218, 97–104. [Google Scholar] [CrossRef]
- Bogomolov, A.; Melenteva, A.; Dahm, D.J. Fat globule size effect on visible and shortwave near infrared spectra of milk. J. Near Infrared Spectrosc. 2013, 21, 435–440. [Google Scholar] [CrossRef]
- Cámara-Martos, F.; Lopes, J.A.; Moreno-Rojas, R.; Pérez-Rodríguez, F. Detection and quantification of Escherichia coli and Pseudomonas aeruginosa in cow milk by near-infrared spectroscopy. Int. J. Dairy Technol. 2015, 68, 357–365. [Google Scholar] [CrossRef]
- Adams, M.C.; Barbano, D.M. A novel statistical approach to detect differences in fat and protein test values among mid-infrared spectrophotometers. J. Dairy Sci. 2015, 98, 4174–4181. [Google Scholar] [CrossRef] [Green Version]
- Mohamed, H.; Nagy, P.; Agbaba, J.; Kamal-Eldin, A. Use of near and mid infra-red spectroscopy for analysis of protein, fat, lactose and total solids in raw cow and camel milk. Food Chem. 2021, 334, 127436. [Google Scholar] [CrossRef] [PubMed]
- Dimitrova, T.; Eftimov, T.; Kabadzhov, V.; Panayotov, P.; Boyanova, P. Scattering and fluorescence spectra of cow milk. Bulg. Chem. Commun. 2014, 46, 39–43. [Google Scholar]
- Iweka, P.; Kawamura, S.; Mitani, T.; Koseki, S. Non-destructive online real-time milk quality determination in a milking robot using near-infrared spectroscopic sensing system. Arid. Zone J. Eng. Technol. Environ. 2018, 14, 121–128. [Google Scholar]
- Kaniyamattam, K.; De Vries, A. Agreement between milk fat, protein, and lactose observations collected from the Dairy Herd Improvement Association (DHIA) and a real-time milk analyzer. J. Dairy Sci. 2014, 97, 2896–2908. [Google Scholar] [CrossRef]
- Frizzarin, M.; Gormley, I.; Berry, D.; Murphy, T.; Casa, A.; Lynch, A.; McParland, S. Predicting cow milk quality traits from routinely available milk spectra using statistical machine learning methods. J. Dairy Sci. 2021, 104, 7438–7447. [Google Scholar] [CrossRef]
- Bonfatti, V.; Tiezzi, F.; Miglior, F.; Carnier, P. Comparison of Bayesian regression models and partial least squares regression for the development of infrared prediction equations. J. Dairy Sci. 2017, 100, 7306–7319. [Google Scholar] [CrossRef]
- Bonfatti, V.; Degano, L.; Menegoz, A.; Carnier, P. Mid-infrared spectroscopy prediction of fine milk composition and technological properties in Italian Simmental. J. Dairy Sci. 2016, 99, 8216–8221. [Google Scholar] [CrossRef] [PubMed] [Green Version]
- Bonfatti, V.; Di Martino, G.; Carnier, P. Effectiveness of mid-infrared spectroscopy for the prediction of detailed protein composition and contents of protein genetic variants of individual milk of Simmental cows. J. Dairy Sci. 2011, 94, 5776–5785. [Google Scholar] [CrossRef] [PubMed]
- Cipolat-Gotet, C.; Cecchinato, A.; De Marchi, M.; Penasa, M.; Bittante, G. Comparison between mechanical and near-infrared methods for assessing coagulation properties of bovine milk. J. Dairy Sci. 2012, 95, 6806–6819. [Google Scholar] [CrossRef] [Green Version]
- Bonfatti, V.; Vicario, D.; Lugo, A.; Carnier, P. Genetic parameters of measures and population-wide infrared predictions of 92 traits describing the fine composition and technological properties of milk in Italian Simmental cattle. J. Dairy Sci. 2017, 100, 5526–5540. [Google Scholar] [CrossRef] [PubMed]
- Soyeurt, H.; Dehareng, F.; Gengler, N.; McParland, S.; Wall, E.; Berry, D.; Coffey, M.; Dardenne, P. Mid-infrared prediction of bovine milk fatty acids across multiple breeds, production systems, and countries. J. Dairy Sci. 2011, 94, 1657–1667. [Google Scholar] [CrossRef] [Green Version]
- Gorla, G.; Mestres, M.; Boqué, R.; Riu, J.; Spanu, D.; Giussani, B. ATR-MIR spectroscopy to predict commercial milk major components: A comparison between a handheld and a benchtop instrument. Chemom. Intell. Lab. Syst. 2020, 200, 103995. [Google Scholar] [CrossRef]
- Lei, Y.; Zhou, Q.; Zhang, Y.-L.; Chen, J.-B.; Sun, S.-Q.; Noda, I. Analysis of crystallized lactose in milk powder by Fourier-transform infrared spectroscopy combined with two-dimensional correlation infrared spectroscopy. J. Mol. Struct. 2010, 974, 88–93. [Google Scholar] [CrossRef]
- Salleh, N.A.; Selamat, J.; Meng, G.Y.; Abas, F.; Jambari, N.N.; Khatib, A. Fourier transform infrared spectroscopy and multivariate analysis of milk from different goat breeds. Int. J. Food Prop. 2019, 22, 1673–1683. [Google Scholar] [CrossRef] [Green Version]
- De Marchi, M.; Fagan, C.; O’Donnell, C.A.; Cecchinato, A.; Dal Zotto, R.; Cassandro, M.; Penasa, M.; Bittante, G. Prediction of coagulation properties. titrable acidity. and pH of bovine milk using mid-infrared spectroscopy. J. Dairy Sci. 2009, 92, 423–432. [Google Scholar] [CrossRef]
- Balabin, R.M.; Smirnov, S.V. Melamine detection by mid-and near-infrared (MIR/NIR) spectroscopy: A quick and sensitive method for dairy products analysis including liquid milk, infant formula, and milk powder. Talanta 2011, 85, 562–568. [Google Scholar] [CrossRef]
- Visentin, G.; McDermott, A.; McParland, S.; Berry, D.P.; Kenny, O.; Brodkorb, A.; Fenelon, M.A.; De Marchi, M. Prediction of bovine milk technological traits from mid-infrared spectroscopy analysis in dairy cows. J. Dairy Sci. 2015, 98, 6620–6629. [Google Scholar] [CrossRef] [Green Version]
- Bahadi, M.; Ismail, A.A.; Vasseur, E. Fourier Transform Infrared Spectroscopy as a Tool to Study Milk Composition Changes in Dairy Cows Attributed to Housing Modifications to Improve Animal Welfare. Foods 2021, 10, 450. [Google Scholar] [CrossRef]
- Liu, N.; Parra, H.A.; Pustjens, A.; Hettinga, K.; Mongondry, P.; van Ruth, S.M. Evaluation of portable near-infrared spectroscopy for organic milk authentication. Talanta 2018, 184, 128–135. [Google Scholar] [CrossRef] [PubMed]
- Delhez, P.; Ho, P.; Gengler, N.; Soyeurt, H.; Pryce, J. Diagnosing the pregnancy status of dairy cows: How useful is milk mid-infrared spectroscopy? J. Dairy Sci. 2020, 103, 3264–3274. [Google Scholar] [CrossRef] [PubMed] [Green Version]
- Borin, A.; Ferrao, M.F.; Mello, C.; Maretto, D.A.; Poppi, R.J. Least-squares support vector machines and near infrared spectroscopy for quantification of common adulterants in powdered milk. Anal. Chim. Acta 2006, 579, 25–32. [Google Scholar] [CrossRef]
- Benedet, A.; Franzoi, M.; Penasa, M.; Pellattiero, E.; De Marchi, M. Prediction of blood metabolites from milk mid-infrared spectra in early-lactation cows. J. Dairy Sci. 2019, 102, 11298–11307. [Google Scholar] [CrossRef]
- Cecchinato, A.; De Marchi, M.; Gallo, L.; Bittante, G.; Carnier, P. Mid-infrared spectroscopy predictions as indicator traits in breeding programs for enhanced coagulation properties of milk. J. Dairy Sci. 2009, 92, 5304–5313. [Google Scholar] [CrossRef] [PubMed] [Green Version]
- Coppa, M.; Martin, B.; Agabriel, C.; Chassaing, C.; Sibra, C.; Constant, I.; Graulet, B.; Andueza, D. Authentication of cow feeding and geographic origin on milk using visible and near-infrared spectroscopy. J. Dairy Sci. 2012, 95, 5544–5551. [Google Scholar] [CrossRef] [PubMed]
- De Roos, A.; Van Den Bijgaart, H.; Hørlyk, J.; De Jong, G. Screening for subclinical ketosis in dairy cattle by Fourier transform infrared spectrometry. J. Dairy Sci. 2007, 90, 1761–1766. [Google Scholar] [CrossRef] [Green Version]
- Kawasaki, M.; Kawamura, S.; Tsukahara, M.; Morita, S.; Komiya, M.; Natsuga, M. Near-infrared spectroscopic sensing system for on-line milk quality assessment in a milking robot. Comput. Electron. Agric. 2008, 63, 22–27. [Google Scholar] [CrossRef] [Green Version]
- Tang, S.; Johnson, J.C.; Jarto, I.; Smith, B.; Morris, S. Milk Components by in-Line Fiber Optic Probe-Based FT-NIR: Commercial Scale Evaluation of a Potential Alternative Measurement Approach for Milk Payment. J. AOAC Int. 2020, 104, 1328–1337. [Google Scholar] [CrossRef] [PubMed]
- Nicolaou, N.; Xu, Y.; Goodacre, R. Fourier transform infrared and Raman spectroscopies for the rapid detection, enumeration, and growth interaction of the bacteria Staphylococcus aureus and Lactococcus lactis ssp. cremoris in milk. Anal. Chem. 2011, 83, 5681–5687. [Google Scholar] [CrossRef] [PubMed]
- Leitner, G.; Merin, U.; Krifucks, O.; Blum, S.; Rivas, A.L.; Silanikove, N. Effects of intra-mammary bacterial infection with coagulase negative staphylococci and stage of lactation on shedding of epithelial cells and infiltration of leukocytes into milk: Comparison among cows, goats and sheep. Vet. Immunol. Immunopathol. 2012, 147, 202–210. [Google Scholar] [CrossRef] [PubMed]
- Rienesl, L.; Khayatzadeh, N.; Köck, A.; Dale, L.; Werner, A.; Grelet, C.; Gengler, N.; Auer, F.-J.; Egger-Danner, C.; Massart, X. Mastitis detection from milk mid-infrared (MIR) spectroscopy in dairy cows. Acta Univ. Agric. Silvic. Mendel. Brun. 2019, 67, 1221–1226. [Google Scholar] [CrossRef] [Green Version]
- Treguier, S.; Couderc, C.; Tormo, H.; Kleiber, D.; Levasseur-Garcia, C. Identification of lactic acid bacteria Enterococcus and Lactococcus by near-infrared spectroscopy and multivariate classification. J. Microbiol. Methods 2019, 165, 105693. [Google Scholar] [CrossRef] [PubMed]
- Cattaneo, T.M.; Holroyd, S.E. The use of near infrared spectroscopy for determination of adulteration and contamination in milk and milk powder: Updating knowledge. J. Near Infrared Spectrosc. 2013, 21, 341–349. [Google Scholar] [CrossRef]
- Ageev, A.; Osiptsov, A. Shear Flow of a Viscous Fluid over a Cavity with a Pulsating Gas Bubble. In Proceedings of the Doklady Physics; Pleiades Publishing: New York, NY, USA, 2020; pp. 242–245. [Google Scholar]
- Jensen, R.G.; Ferris, A.M.; Lammi-Keefe, C.J. The composition of milk fat. J. Dairy Sci. 1991, 74, 3228–3243. [Google Scholar] [CrossRef]
- Roy, B.; Brahma, B.; Ghosh, S.; Pankaj, P.K.; Mandal, G. Evaluation of Milk Urea Concentration as Useful Indicator for Dairy Herd Management: A Review. Asian J. Anim. Vet. Adv. 2011, 6, 1–19. [Google Scholar] [CrossRef] [Green Version]
- DePeters, E.J.; Ferguson, J.D. Nonprotein Nitrogen and Protein Distribution in the Milk of Cows. J. Dairy Sci. 1992, 75, 3192–3209. [Google Scholar] [CrossRef]
- Jenness, R. Biosynthesis and composition of milk. J. Investig. Dermatol. 1974, 63, 109–118. [Google Scholar] [CrossRef] [PubMed] [Green Version]
- Jenness, R. Composition of milk. In Fundamentals of Dairy Chemistry; Springer: Boston, MA, USA, 1988; pp. 1–38. [Google Scholar]
- Etzion, Y.; Linker, R.; Cogan, U.; Shmulevich, I. Determination of protein concentration in raw milk by mid-infrared Fourier transform infrared/attenuated total reflectance spectroscopy. J. Dairy Sci. 2004, 87, 2779–2788. [Google Scholar] [CrossRef] [Green Version]
- Rutten, M.J.M.; Bovenhuis, H.; Hettinga, K.A.; van Valenberg, H.J.F.; van Arendonk, J.A.M. Predicting bovine milk fat composition using infrared spectroscopy based on milk samples collected in winter and summer. J. Dairy Sci. 2009, 92, 6202–6209. [Google Scholar] [CrossRef] [Green Version]
- Laporte, M.-F.; Paquin, P. Near-infrared analysis of fat, protein, and casein in cow’s milk. J. Agric. Food Chem. 1999, 47, 2600–2605. [Google Scholar] [CrossRef]
- Purnomoadi, A.; Batajoo, K.K.; Ueda, K.; Terada, F. Influence of feed source on determination of fat and protein in milk by near-infrared spectroscopy. Int. Dairy J. 1999, 9, 447–452. [Google Scholar] [CrossRef]
- Godden, S.; Lissemore, K.; Kelton, D.; Leslie, K.; Walton, J.; Lumsden, J. Relationships between milk urea concentrations and nutritional management, production, and economic variables in Ontario dairy herds. J. Dairy Sci. 2001, 84, 1128–1139. [Google Scholar] [CrossRef]
- Nousiainen, J.; Shingfield, K.; Huhtanen, P. Evaluation of milk urea nitrogen as a diagnostic of protein feeding. J. Dairy Sci. 2004, 87, 386–398. [Google Scholar] [CrossRef] [Green Version]
- Horrocks, R.; Vallentine, J. Forage Quality—The Basics; Acdemic Press: San Diego, CA, USA, 1999; pp. 17–47. [Google Scholar]
- Rego, G.; Ferrero, F.; Valledor, M.; Campo, J.C.; Forcada, S.; Royo, L.J.; Soldado, A. A portable IoT NIR spectroscopic system to analyze the quality of dairy farm forage. Comput. Electron. Agric. 2020, 175, 105578. [Google Scholar] [CrossRef]
- Yang, Z.; Nie, G.; Pan, L.; Zhang, Y.; Huang, L.; Ma, X.; Zhang, X. Development and validation of near-infrared spectroscopy for the prediction of forage quality parameters in Lolium multiflorum. PeerJ 2017, 5, e3867. [Google Scholar] [CrossRef] [Green Version]
- Jennewein, J.S.; Eitel, J.U.; Joly, K.; Long, R.A.; Maguire, A.J.; Vierling, L.A.; Weygint, W. Estimating integrated measures of forage quality for herbivores by fusing optical and structural remote sensing data. Environ. Res. Lett. 2021, 16, 075006. [Google Scholar] [CrossRef]
- Lavin, S.R.; Sullivan, K.E.; Wooley, S.C.; Stone, K.; Russell, S.; Valdes, E.V. Near infrared reflectance spectroscopy (NIRS) analyses of nutrient composition and condensed tannin concentrations in carolina willow (Salix caroliniana). Zoo Biol. 2015, 34, 576–582. [Google Scholar] [CrossRef]
- Marchesini, G.; Serva, L.; Garbin, E.; Mirisola, M.; Andrighetto, I. Near-infrared calibration transfer for undried whole maize plant between laboratory and on-site spectrometers. Ital. J. Anim. Sci. 2018, 17, 66–72. [Google Scholar] [CrossRef] [Green Version]
- Fox, G.P.; O’Donnell, N.H.; Stewart, P.N.; Gleadow, R.M. Estimating hydrogen cyanide in forage sorghum (Sorghum bicolor) by near-infrared spectroscopy. J. Agric. Food Chem. 2012, 60, 6183–6187. [Google Scholar] [CrossRef] [PubMed]
- Bokobza, L. Origin of Near-Infrared Absorption Bands; Wiley-VCH: Weinheim, Gemrany, 2002. [Google Scholar]
- Auer, B.; Skinner, J. IR and Raman spectra of liquid water: Theory and interpretation. J. Chem. Phys. 2008, 128, 224511. [Google Scholar] [CrossRef] [PubMed]
- Ikoyi, A.Y.; Younge, B.A. Influence of forage particle size and residual moisture on near infrared reflectance spectroscopy (NIRS) calibration accuracy for macro-mineral determination. Anim. Feed. Sci. Technol. 2020, 270, 114674. [Google Scholar] [CrossRef]
- Ji, C.; Zhang, X.; Yu, P. Using non-invasive molecular spectroscopic techniques to detect unique aspects of protein Amide functional groups and chemical properties of modeled forage from different sourced-origins. Spectrochim. Acta Part A Mol. Biomol. Spectrosc. 2016, 156, 151–154. [Google Scholar] [CrossRef] [PubMed]
- Tilley, J.; Terry, R. A two-stage technique for the in vitro digestion of forage crops. Grass Forage Sci. 1963, 18, 104–111. [Google Scholar] [CrossRef]
- Wajizah, S.; Munawar, A.A. Near infrared spectroscopy (NIRS) data analysis for a rapid and simultaneous prediction of feed nutritive parameters. Data Brief 2020, 29, 105211. [Google Scholar] [CrossRef]
- Zgouz, A.; Héran, D.; Barthès, B.; Bastianelli, D.; Bonnal, L.; Baeten, V.; Lurol, S.; Bonin, M.; Roger, J.-M.; Bendoula, R.; et al. Dataset of visible-near infrared handheld and micro-spectrometers–comparison of the prediction accuracy of sugarcane properties. Data Brief 2020, 31, 106013. [Google Scholar] [CrossRef]
- Samadi, S.W.; Munawar, A. Rapid and simultaneous determination of feed nutritive values by means of near infrared spectroscopy. Trop. Anim. Sci. J 2018, 41, 121–127. [Google Scholar] [CrossRef] [Green Version]
- Norman, H.C.; Hulm, E.; Humphries, A.W.; Hughes, S.J.; Vercoe, P.E. Broad near-infrared spectroscopy calibrations can predict the nutritional value of >100 forage species within the Australian feedbase. Anim. Prod. Sci. 2020, 60, 1111–1122. [Google Scholar] [CrossRef]
- Acosta, J.; Castillo, M.; Hodge, G. Comparison of benchtop and handheld near-infrared spectroscopy devices to determine forage nutritive value. Crop. Sci. 2020, 60, 3410–3422. [Google Scholar] [CrossRef]
- Baath, G.S.; Baath, H.K.; Gowda, P.H.; Thomas, J.P.; Northup, B.K.; Rao, S.C.; Singh, H. Predicting forage quality of warm-season legumes by near infrared spectroscopy coupled with machine learning techniques. Sensors 2020, 20, 867. [Google Scholar] [CrossRef] [PubMed] [Green Version]
- Berzaghi, P.; Cherney, J.; Casler, M.D. Prediction performance of portable near infrared reflectance instruments using preprocessed dried, ground forage samples. Comput. Electron. Agric. 2021, 182, 106013. [Google Scholar] [CrossRef]
- Nieto-Sierra, D.F.; Meneses-Buitrago, D.H.; Morales-Montero, S.P.; Hernández-Oviedo, F.; Castro-Rincón, E. Características productivas de cultivos forrajeros en sistemas de producción de leche, Nariño, Colombia. Agron. Mesoam. 2020, 31, 177–192. [Google Scholar] [CrossRef] [Green Version]
- Wijesingha, J.; Astor, T.; Schulze-Brüninghoff, D.; Wengert, M.; Wachendorf, M. Predicting forage quality of grasslands using UAV-borne imaging spectroscopy. Remote Sens. 2020, 12, 126. [Google Scholar] [CrossRef] [Green Version]
- Andueza, D.; Picard, F.; Martin-Rosset, W.; Aufrère, J. Near-infrared spectroscopy calibrations performed on oven-dried green forages for the prediction of chemical composition and nutritive value of preserved forage for ruminants. Appl. Spectrosc. 2016, 70, 1321–1327. [Google Scholar] [CrossRef]
- Rodrigues, F.A.; Blasch, G.; Defourny, P.; Ortiz-Monasterio, J.I.; Schulthess, U.; Zarco-Tejada, P.J.; Taylor, J.A.; Gérard, B. Multi-temporal and spectral analysis of high-resolution hyperspectral airborne imagery for precision agriculture: Assessment of wheat grain yield and grain protein content. Remote Sens. 2018, 10, 930. [Google Scholar] [CrossRef] [Green Version]
- Serrano, J.; Shahidian, S.; Carapau, Â.; Rato, A.E. Near-Infrared Spectroscopy (NIRS) and Optical Sensors for Estimating Protein and Fiber in Dryland Mediterranean Pastures. AgriEngineering 2021, 3, 73–91. [Google Scholar] [CrossRef]
- Lednev, V.N.; Bunkin, A.F.; Pershin, S.M.; Grishin, M.Y.; Artemova, D.G.; Zavozin, V.A.; Sdvizhenskii, P.A.; Nunes, R.A. Remote Laser Induced Fluorescence of Soils and Rocks. Photonics 2021, 8, 411. [Google Scholar] [CrossRef]
- Lee, H.; Kim, M.S.; Lim, H.-S.; Park, E.; Lee, W.-H.; Cho, B.-K. Detection of cucumber green mottle mosaic virus-infected watermelon seeds using a near-infrared (NIR) hyperspectral imaging system: Application to seeds of the “Sambok Honey” cultivar. Biosyst. Eng. 2016, 148, 138–147. [Google Scholar] [CrossRef]
- Wajizah, S.; Munawar, A. Fast and simultaneous prediction of animal feed nutritive values using near infrared reflectance spectroscopy. In Proceedings of the IOP Conference Series: Earth and Environmental Science; IOP Publishing: Bristol, UK, 2018; p. 012112. [Google Scholar]
- Cui, C.; Fearn, T. Comparison of partial least squares regression, least squares support vector machines, and Gaussian process regression for a near infrared calibration. J. Near Infrared Spectrosc. 2017, 25, 5–14. [Google Scholar] [CrossRef]
- Agelet, L.E.; Hurburgh Jr, C.R. A tutorial on near infrared spectroscopy and its calibration. Crit. Rev. Anal. Chem. 2010, 40, 246–260. [Google Scholar] [CrossRef]

Publisher’s Note: MDPI stays neutral with regard to jurisdictional claims in published maps and institutional affiliations. |
© 2021 by the authors. Licensee MDPI, Basel, Switzerland. This article is an open access article distributed under the terms and conditions of the Creative Commons Attribution (CC BY) license (https://creativecommons.org/licenses/by/4.0/).
Share and Cite
Burmistrov, D.E.; Pavkin, D.Y.; Khakimov, A.R.; Ignatenko, D.N.; Nikitin, E.A.; Lednev, V.N.; Lobachevsky, Y.P.; Gudkov, S.V.; Zvyagin, A.V. Application of Optical Quality Control Technologies in the Dairy Industry: An Overview. Photonics 2021, 8, 551. https://doi.org/10.3390/photonics8120551
Burmistrov DE, Pavkin DY, Khakimov AR, Ignatenko DN, Nikitin EA, Lednev VN, Lobachevsky YP, Gudkov SV, Zvyagin AV. Application of Optical Quality Control Technologies in the Dairy Industry: An Overview. Photonics. 2021; 8(12):551. https://doi.org/10.3390/photonics8120551
Chicago/Turabian StyleBurmistrov, Dmitriy E., Dmitriy Y. Pavkin, Artyom R. Khakimov, Dmitry N. Ignatenko, Evgeniy A. Nikitin, Vasily N. Lednev, Yakov P. Lobachevsky, Sergey V. Gudkov, and Andrei V. Zvyagin. 2021. "Application of Optical Quality Control Technologies in the Dairy Industry: An Overview" Photonics 8, no. 12: 551. https://doi.org/10.3390/photonics8120551
APA StyleBurmistrov, D. E., Pavkin, D. Y., Khakimov, A. R., Ignatenko, D. N., Nikitin, E. A., Lednev, V. N., Lobachevsky, Y. P., Gudkov, S. V., & Zvyagin, A. V. (2021). Application of Optical Quality Control Technologies in the Dairy Industry: An Overview. Photonics, 8(12), 551. https://doi.org/10.3390/photonics8120551