Article

Investigation of Shielding Effects on Picosecond Laser-Induced Copper Plasma Characteristics under Different Focusing Distances

1
School of Information Engineering, Southwest University of Science and Technology, Mianyang 621010, China
2
School of Mechanical Engineering, Guilin University of Aerospace Technology, Guilin 541004, China
3
School of Intelligent Technology, Tianfu College of Southwestern University of Finance and Economics, Mianyang 621010, China
*
Author to whom correspondence should be addressed.
Photonics 2021, 8(12), 536; https://doi.org/10.3390/photonics8120536
Submission received: 14 October 2021 / Revised: 18 November 2021 / Accepted: 24 November 2021 / Published: 26 November 2021

Abstract

:
In traditional laser-induced breakdown spectroscopy (LIBS) applications, the line intensity and analysis capability are susceptible to plasma shielding. To investigate the shielding effects on the characteristics of Cu plasma in air, a ~120-picosecond laser with a wavelength of 1064 nm was employed to produce plasma. The plasma temperature and electron density were calculated under the condition of local thermal equilibrium (LTE) and optically thin, while the relationships between the line intensity, plasma temperature and electron density were analyzed. Moreover, the LTE condition was validated by the McWhirter relation, plasma relaxation time and diffusion length, and the optically thin condition was observed through the variation in line intensity. The results indicated that when the focal point was below the target surface, the plasma shielding was the weakest, and the highest line intensity could be obtained. In addition, there was a positive correlation between the increased plasma temperature and the degree of shielding effect. When the focal point was above the target surface, the high-irradiance pulse directly broke down the free air and produced a shock wave. Under the high pressure of the over-heated shock wave, the line intensity, plasma temperature and electron density increased again. This study provides an important insight into the experiments and applications of picosecond LIBS.

1. Introduction

Laser-induced breakdown spectroscopy (LIBS) originated in the second half of the 20th century [1], and became a representative laser ablation technique in the discipline of chemical analysis [2]. It has distinct advantages in real-time, in-situ, standoff [3] and contactless detection [4], and requires less sample preparation and consumption [5]. Currently, LIBS is widely used in the fields of public safety [3], metallurgical engineering [6], space exploration [7], geology and archaeology [8] and water quality detection [9]. It is well-known that the spectral quality is susceptible to the wavelength, irradiance, pulse duration and gas atmosphere during the process of capturing spectra [10]. Various effective approaches can be used to improve the signal-to-noise ratio (SNR) of emitted spectra and the analytical performance of LIBS applications, such as increasing spectra accumulation and pulse irradiance/duration, optimizing the gate width or delay of the spectrometer, changing environmental ambient gas and pressure, modulating the beam profile [4,11] and so on.
In a common LIBS system, a nanosecond (ns) pulse at a fundamental wavelength of 1064 nm or a femtosecond (fs) pulse at a wavelength of 800 nm is utilized to irradiate the unknown sample. For an ns pulse, the laser irradiance is on the order of 107–1011 W/cm2. Once the laser irradiance exceeds the critical threshold of 108 W/cm2, a part of the ablation mass is converted into vapor and particles, resulting in vapor breakdown and plasma formation on the surface of the target [12]. During the ns duration, only a part of the pulse energy is used to produce the vapor plume, and the rest is absorbed by the expanding plume mainly through the reverse Bremsstrahlung. The truncation of beam energy is called plasma shielding [13,14]. In comparison to ns LIBS, a significant advantage of fs LIBS is its ability to perform remote detection. Owing to less thermal and mechanical damage on the target surface, the fs LIBS produces less background continuum noise and higher stability in mass removal [11]. The shielding effects also exist in fs LIBS, although no pulse energy is used to interact with the plasma plume. Due to the huge difference in pulse duration, the physical mechanism of fs and ns plasma generation is completely different.
Plasma shielding and air breakdown are affected when the target mass is converted into vapor plume, which also influences the plasma emission and the analytical performance of LIBS [15]. To study the characteristics of shielding effects, Capon et al. [16] analyzed the relationship between plasma shielding and pulse energy and elucidated plasma evolution as early as 1988. They found that the degree of plasma shielding depends on the electron temperature and the characteristics of ions in the plasma. Based on the inverse Bremsstrahlung process and photoionization of excited species, Zhang et al. [17] developed a theoretical model to explain the laser–plasma interaction and the effect of shielding plasma in the ablation process. Penczak et al. [18] utilized an fs pulse up to 2000 J/cm2 to achieve an enhanced line intensity in fs double-pulse LIBS. The results indicated that the enhancement is produced by plasma reheating due to plasma shielding. By using a lens with a focal length of 74 mm, Lee et al. [19] observed the evolution of line intensity and plasma plume image with the pulse numbers. It was found that the crater depth affects the plasma shape, shielding effects and line intensity due to continuous pulse ablation. To investigate the effects of plasma shielding on the analytical performance of ns LIBS, Wang et al. [20] employed a 5.29 TW/cm2 pulse to irradiate a set of alloy steel samples through a lens with a focal length of 100 mm. The results indicated that the analytical performance of LIBS depends on the degree of plasma shielding.
Due to the less mechanical damage and redeposition, the mass removal from the target surface is more reproducible when using a picosecond (ps) pulse compared to an ns pulse. Moreover, the line intensity-to-background ratio in ps pulse ablation is several times higher than that in ns pulse [11]. The maximum pulse energy of an fs laser (around 10 mJ, [18]) is much lower than that of a ps laser. To enhance the line intensity or improve the limit of detection, the method of single/simple fs LIBS is not recommended to analyze non-metallic samples. Currently, the number of reports on ps LIBS is small compared to ns/fs LIBS. This work attempts to analyze the influence of shielding effects on the characteristics of ps laser-induced Cu plasma at different focusing distances.

2. Materials and Methods

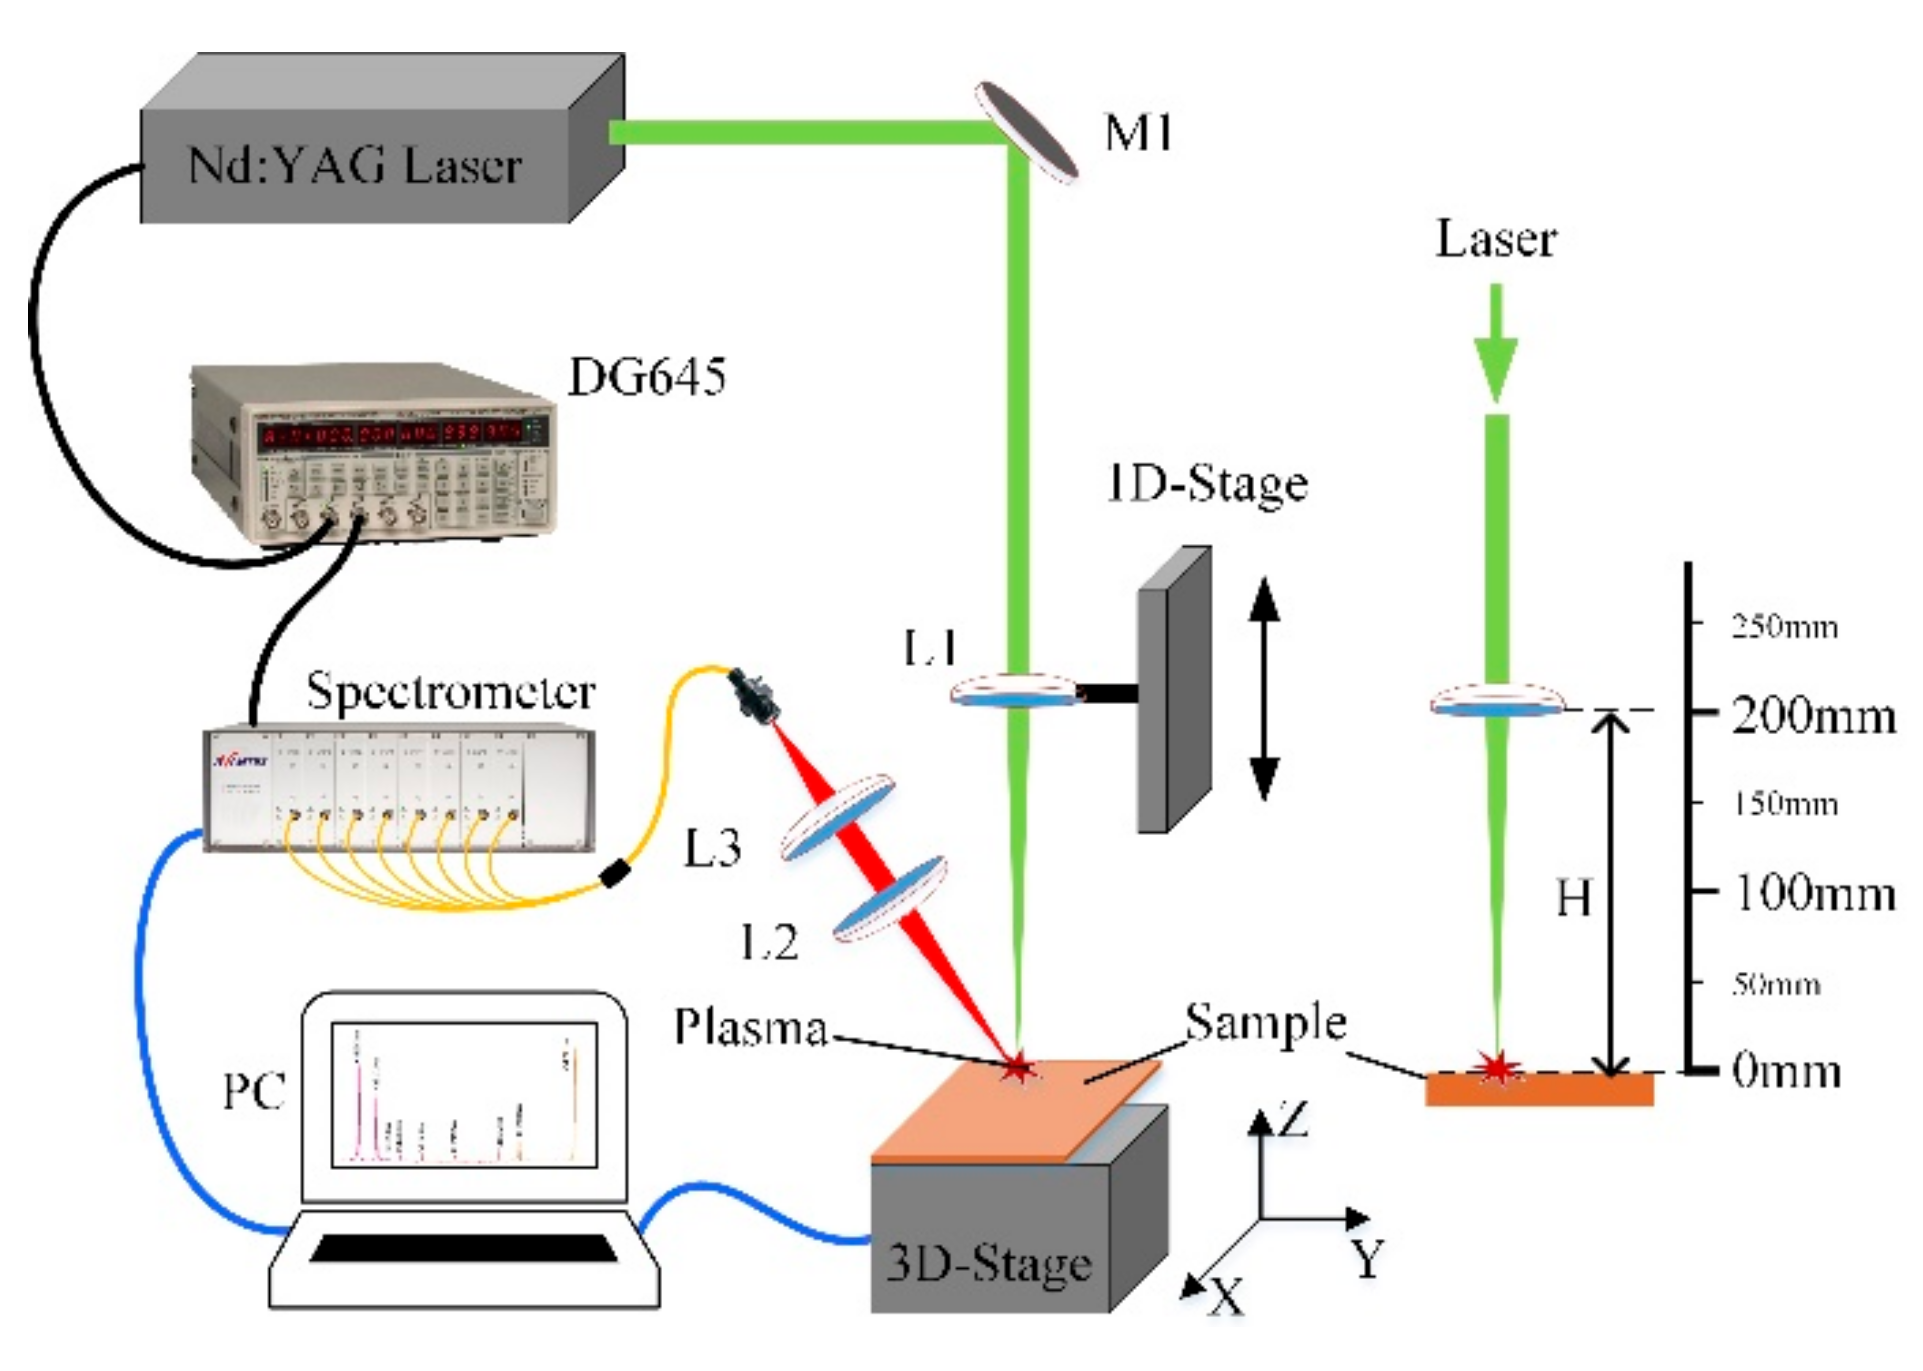
2.1. Instrumentation

The schematic diagram of the experimental setup for LIBS is shown in Figure 1. The plasma of 99.90% copper (with fewer impurities, such as Fe, Ca, Ba, Pb, Zn and so on) was produced by a Q-switched Nd: YAG laser (SL234, Ekspla) operating at a fundamental wavelength of 1064 nm with a duration of ~120 ps. The pulse energy ranged from 15 mJ to 55 mJ with a repetition rate of 10 Hz. The laser beam was reflected and then incident vertically down to the target surface through the plano-convex lens L1. This lens, with a nominal focal length of 200 mm, was fixed on a linear translation 1D stage (NRT150, Thorlabs), and it was used to change the distance between the lens (L1) and target. On the right side in Figure 1, d represents the relative focusing distance. The negative sign signifies that the focal point is below the target surface. The plasma spectrum was collected through a pair of plano-convex lenses (L2 and L3, with nominal focal lengths of 150 and 100 mm, respectively) and an optical fiber (Model FC8-UV200-2-ME-SR, with a diameter of 200 μm), finally coupled to a multichannel optical fiber spectrometer (AvaSpec-ULS2048-8-USB2, Avantes). To ensure that the diameter of optical fiber was completely covered by the collected image of copper plasma, the angle between the collecting lens and the incident laser was less than 30°, and the entrance of the fiber was located at the front of the focal point of L3. The trigger and delay of the laser and spectrometer were controlled manually by using a digital delay/pulse generator (DG645, SRS) that worked in burst mode. Given the data transmission rate of the spectrometer, only the 4th and 5th channel were enabled, and the maximum resolution was 0.024 nm, with the wavelength ranging from 496 nm to 671 nm.

2.2. Operating Conditions

Before the experiment was conducted, the sensitivity of the spectrometer was calibrated with a calibration light source (AvaSpec-CAL-Mini, Avantes). According to the method reported in the literature [21], the instrumental broadening (~0.045 nm) was calculated by two Hg lines (576.96 and 579.06 nm) emitted from a low-pressure mercury lamp (GY-4, Tianjin Gangdong). Meanwhile, to obtain the precise distance between the lens and the sample, the pulse energy (~150 μJ) attenuated by a half-wave plate and a high power polarizer was used to ablate the photographic paper, and the actual focus position was determined by observing the size of the ablation spot through the microscope. Each crater was shot successively with 10 shots and an average spectrum was obtained. For each d, one crater was produced and the corresponding average spectrum was collected. Moreover, to ensure the same coupling efficiency between the plasma and the collector, a CCD camera and portable point light were used to calibrate the ablation position on the target (not shown in Figure 1). Given the SNR of spectral lines in the preparatory experiment and the optimal gate delay of the spectrometer proposed in the literature [22], the interval between the laser pulse and the actual trigger of the spectrometer was set to 1.3 μs. The gate width of the spectrometer was set at a minimum value of 1.05 ms. The above experiments were conducted in air at room temperature, with humidity ranging from 28% to 32%.

3. Results and Discussion

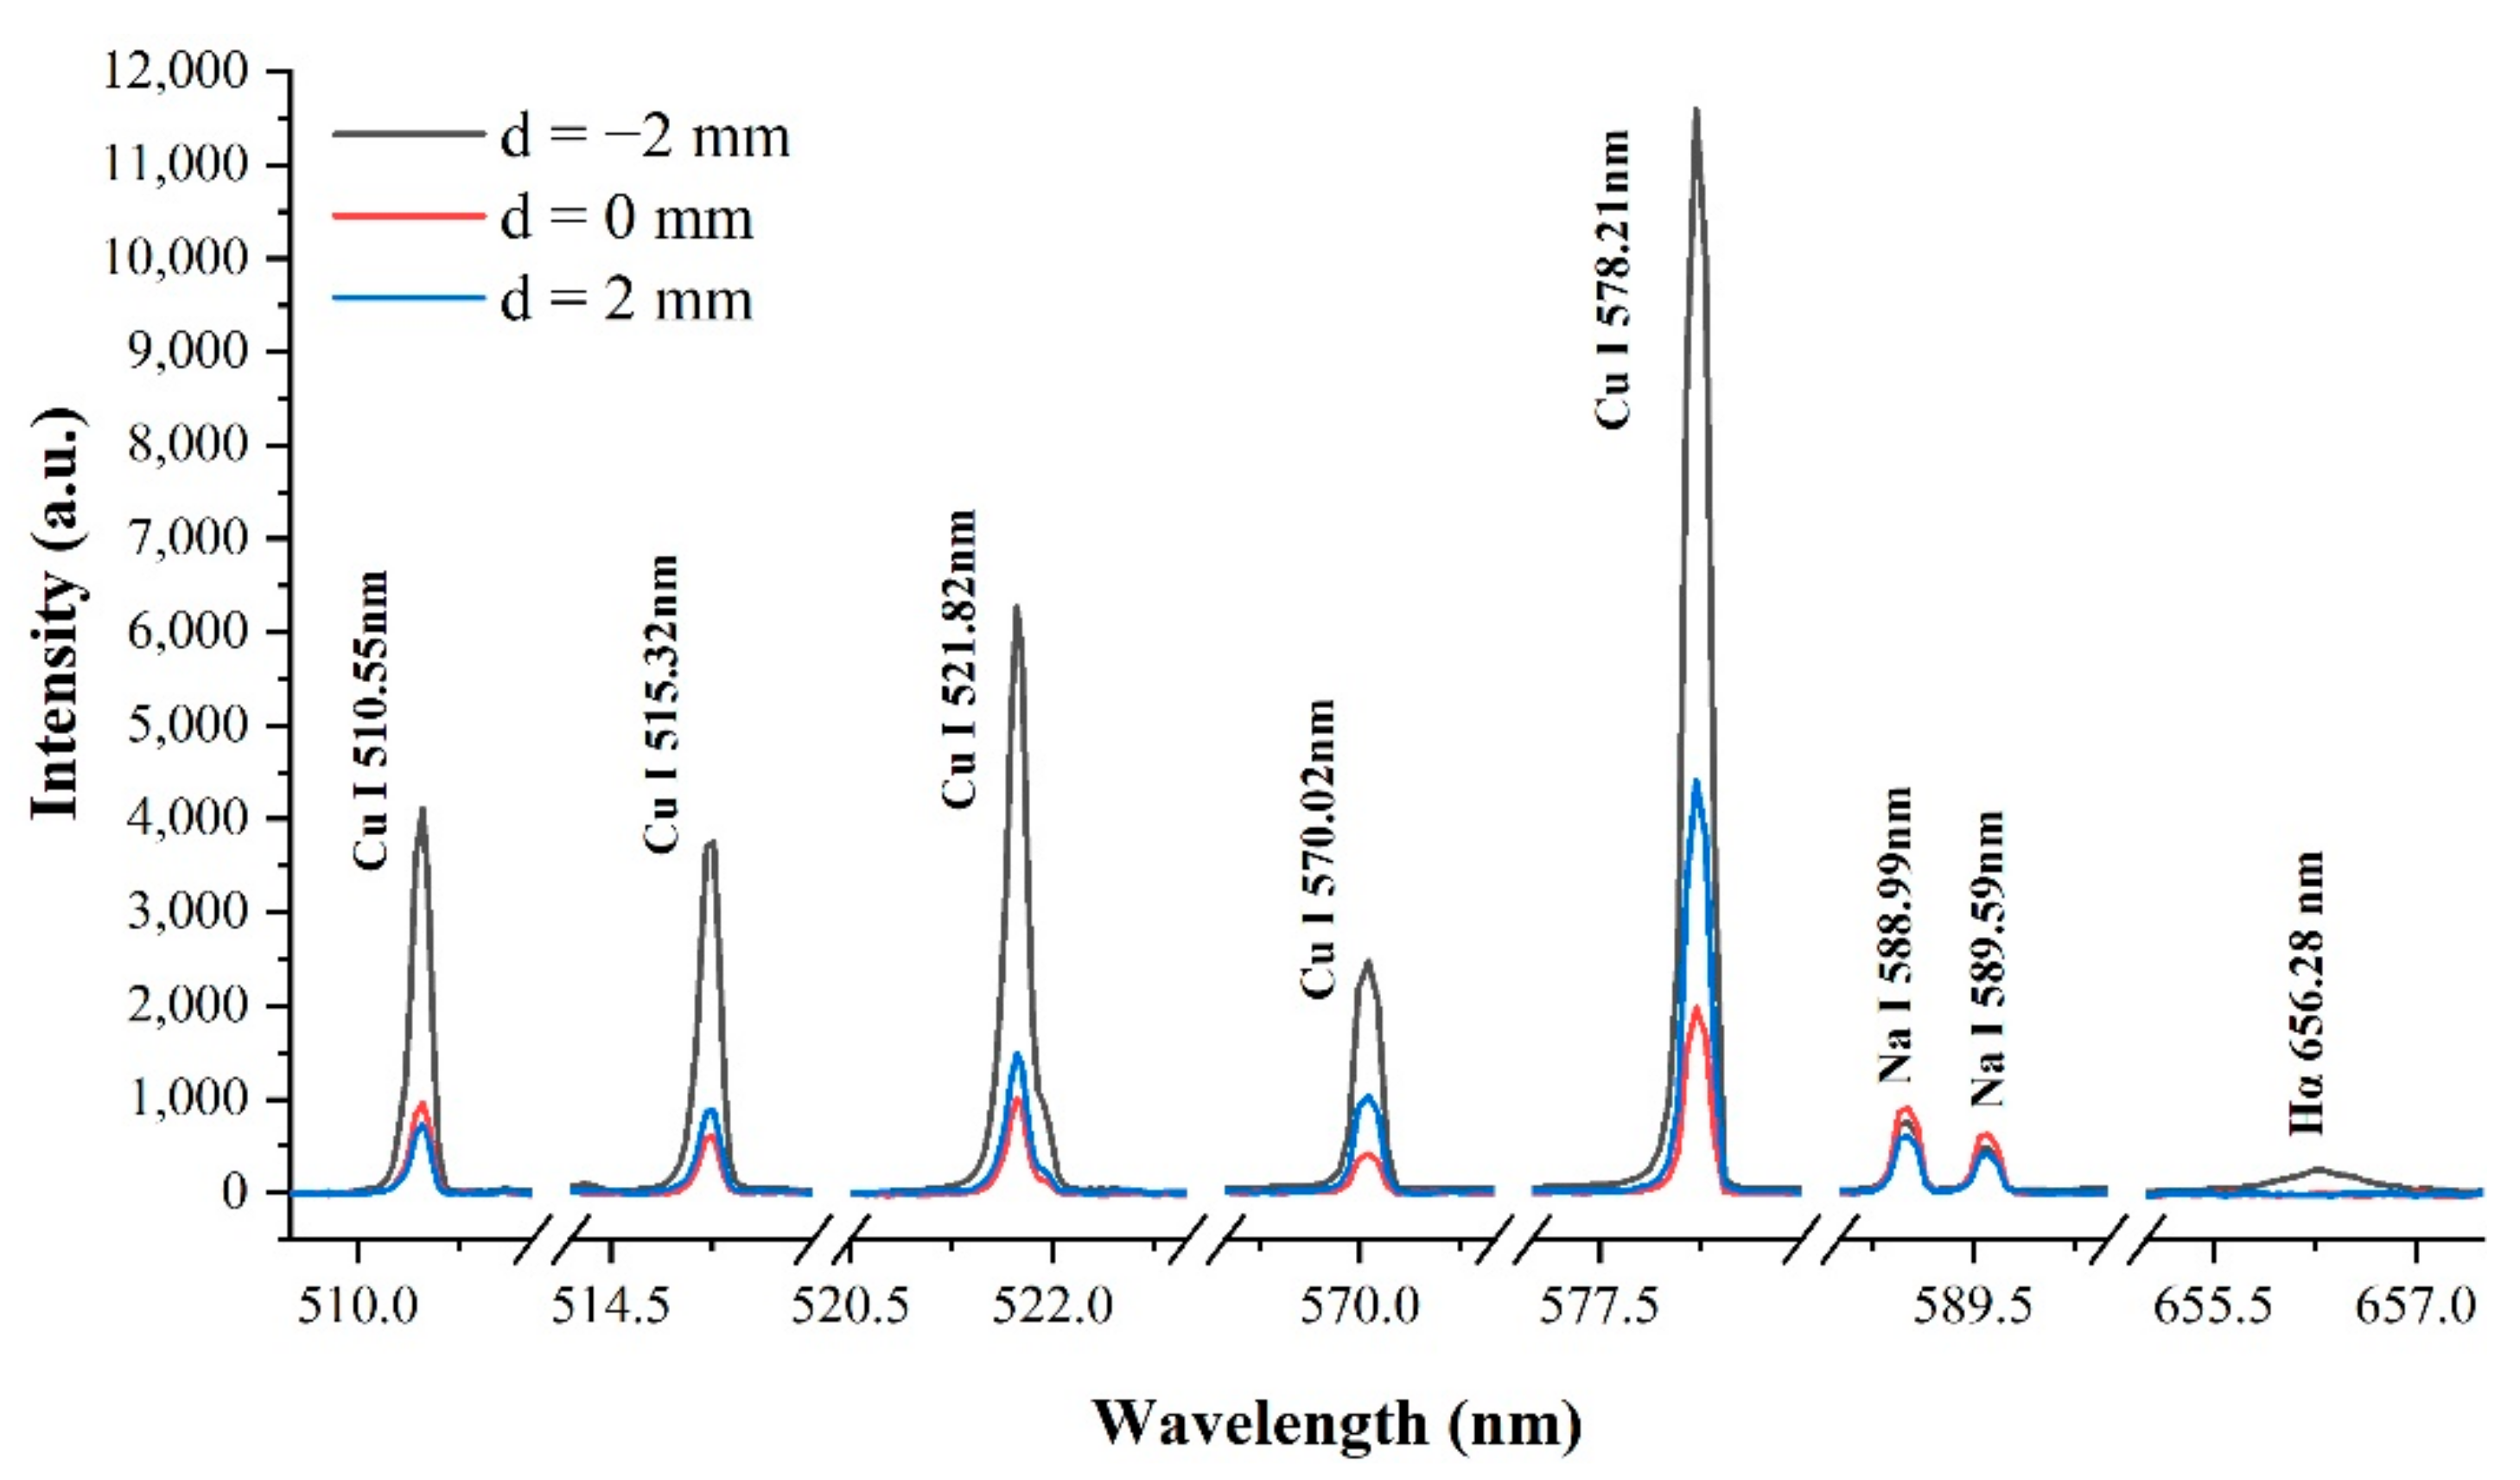
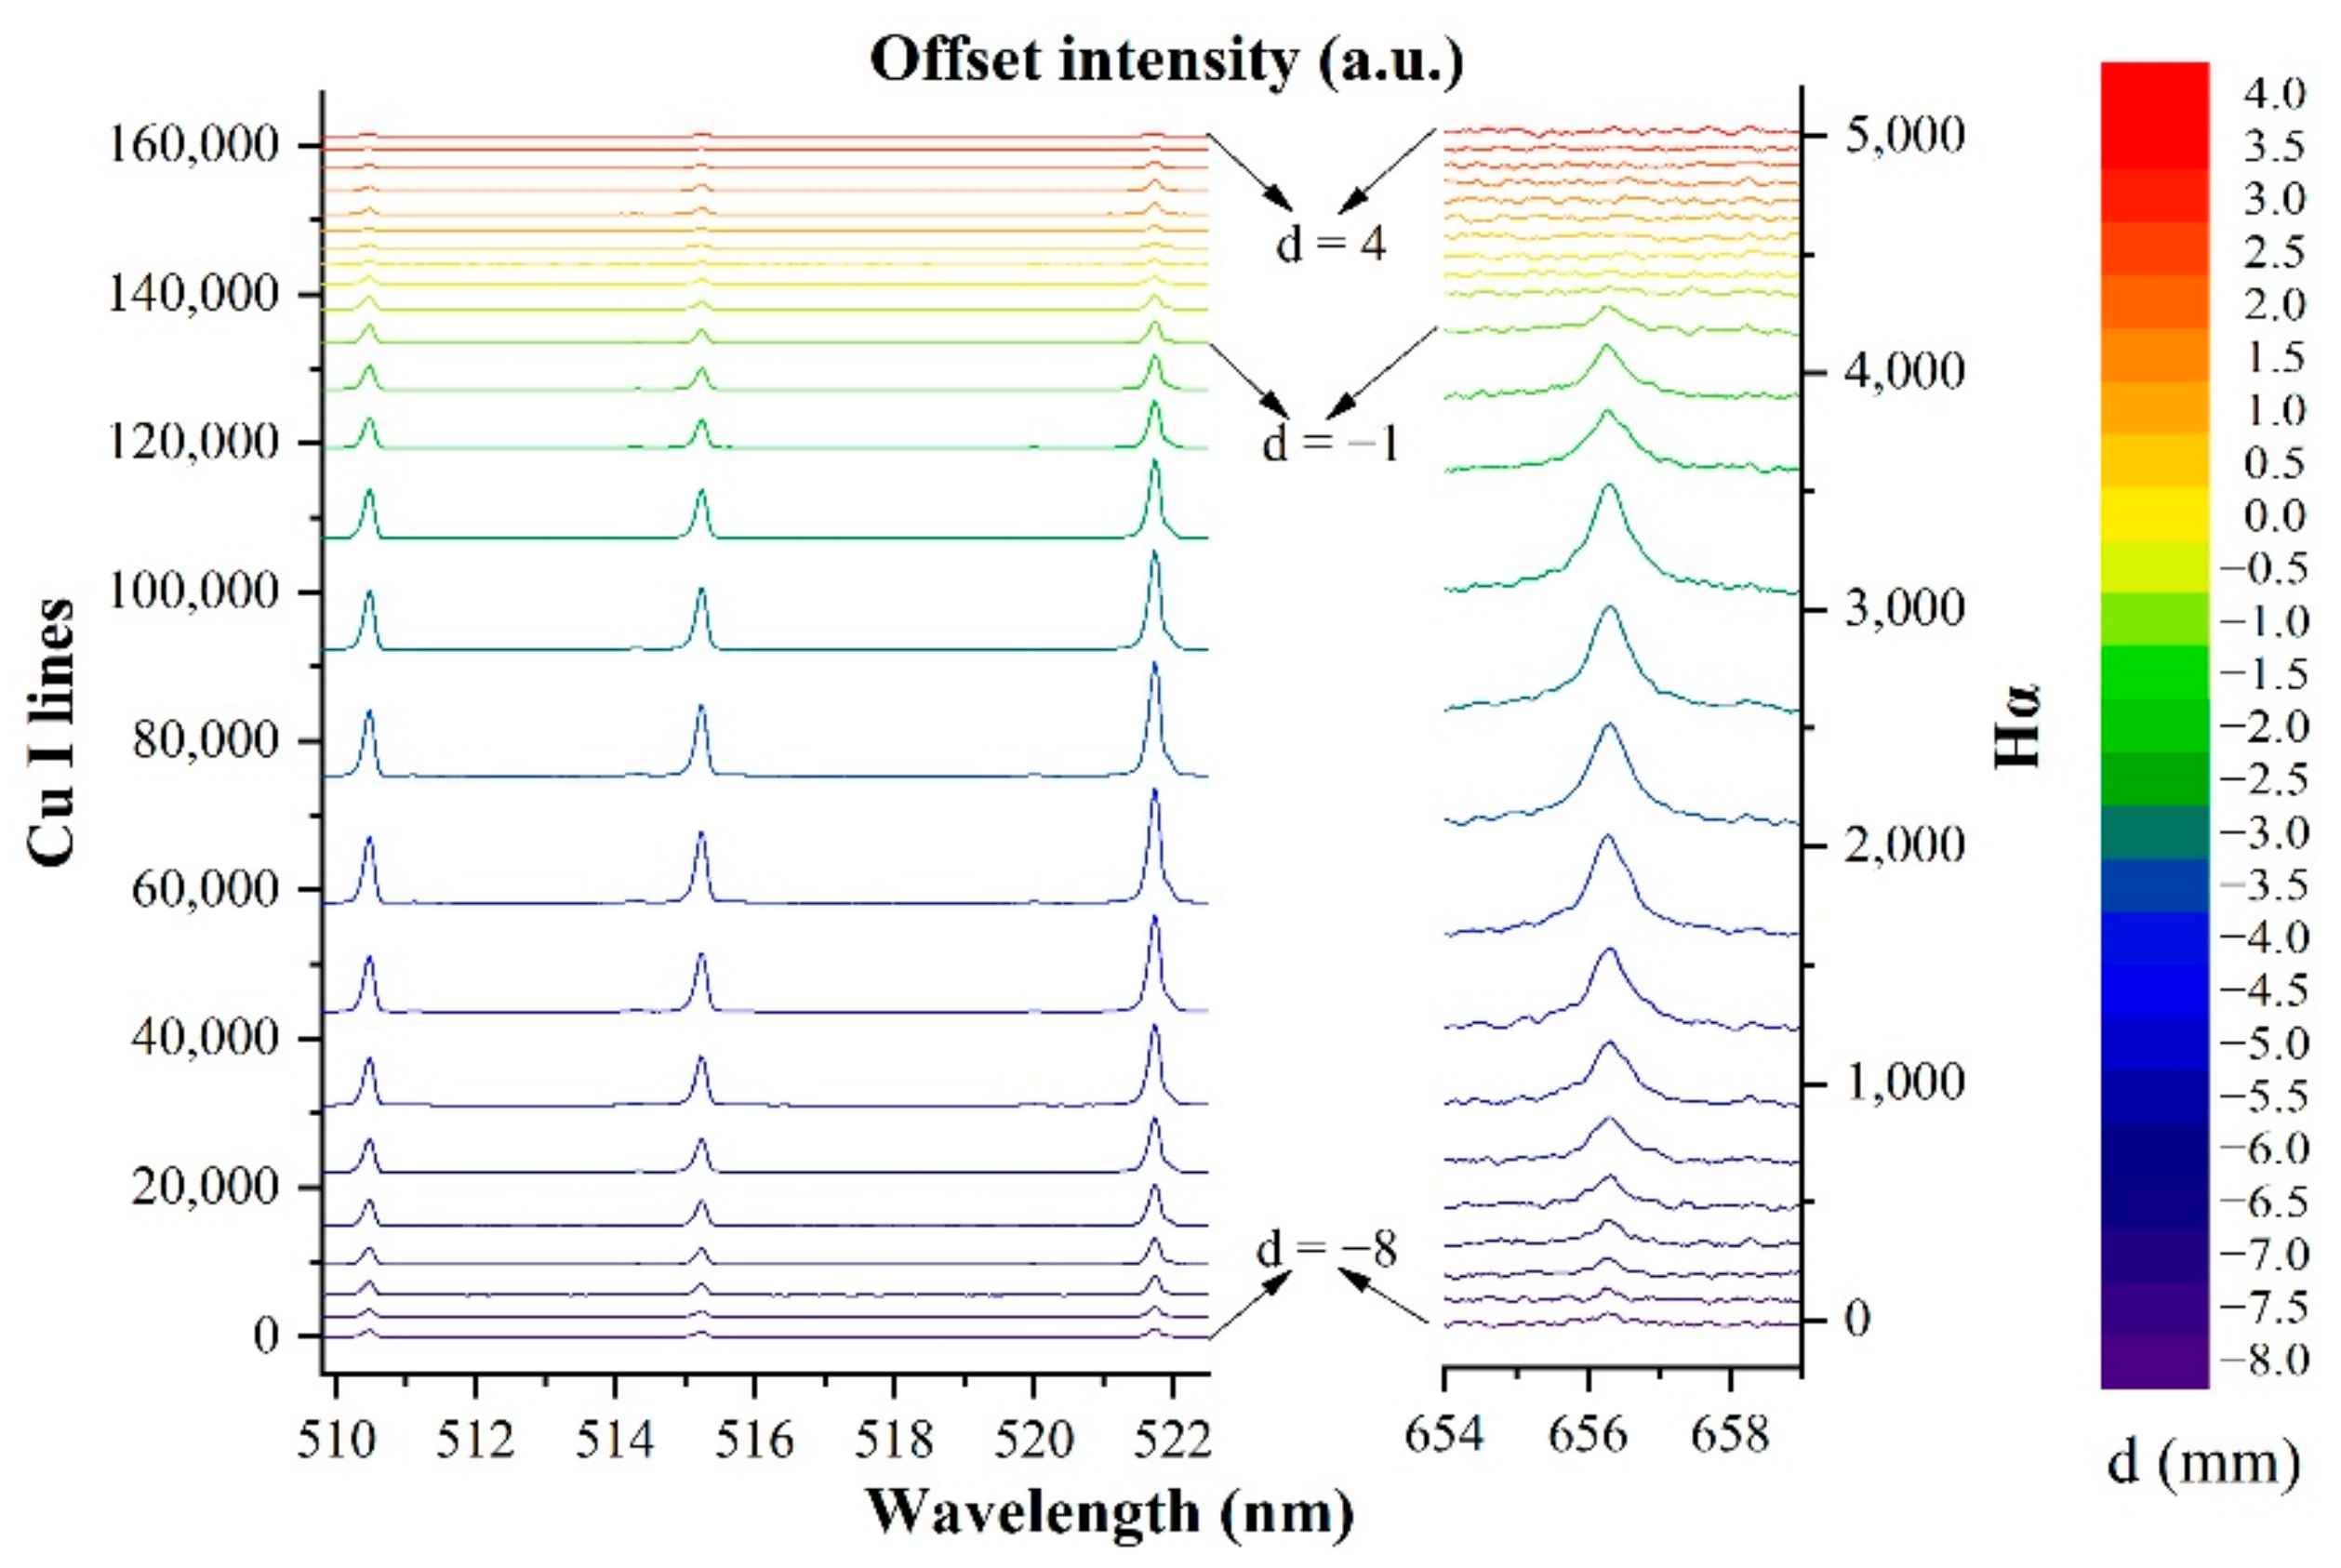
3.1. Emission Spectrum

When the pulse energy was 55 mJ, the typical Cu spectra recorded in the wavelength range of 509 to 658 nm at three focusing distances were as shown in Figure 2. The main peak included five strong Cu atomic lines (510.55, 515.32, 521.82, 570.02 and 578.21 nm), two Na atomic lines (588.89 and 589.59 nm) and a single line Hα (656.28 nm). Due to the effects of plasma shielding, the intensity of the Cu spectrum at d = 0 mm was lower than that of d = −2 mm and d = 2 mm. This phenomenon is similar to that in ns LIBS reported by Aguilera et al. [15], while the physical mechanism of produced plasma shielding is not completely identical. In ns pulse-induced plasma, the rising edge is used to interact with the target and the trailing edge is deposited on the plasma plume. A plasma plume of target material vapor is produced after a few nanoseconds or longer [23]. Once the particle density reaches a critical threshold, the plasma plume becomes opaque and induces reflection and scattering. Due to the longer pulse duration, the expanding plume absorbs the remaining laser energy and prevents the laser pulse from illuminating the copper surface. This reduces the ablation volume of the target [14], thereby decreasing the intensity of the plasma spectrum, i.e., plasma shielding.
It is necessary to speculate about the basic mechanism of plasma formation when the pulse duration was ~120 ps in our experiment. According to research on the laser–material interaction conducted by Mao et al. in 2000 [24], it is considered that the formation of plasma induced by a ~35 ps pulse is mainly due to the laser–target–air interaction. When a ps beam (irradiance between 1010 and 1013 W/cm2) irradiates on the target surface, the target surface absorbs the laser energy during the rising edge, causing elevated surface electron and lattice temperatures [11]. Once the electrons absorb enough incident photons, this will break the constraint of energy level and produce electron emission. In this case, the high-speed and high-density free electrons will be ejected from the target surface, which can break down the air and produce the initial air plasma above the target [25]. Meanwhile, the target surface will be melted and evaporated to form a material vapor plume. This excitation process and air plasma are completed in dozens of ps. After hundreds of ps, the material vapor plume expands in the opposite direction of the incident beam and interacts with the fresh gas above the target, resulting in a shock wave (phase explosion) [26]. In this work, the pulse duration (~120 ps) was higher than that in the work conducted by Mao et al. (35 ps). Thus, it is considered that the expanding plume may absorb the energy from the falling edge of the pulse, leading to the shielding effects of plasma.
To detail the influence of shielding effects on the plasma spectrum, various irradiance levels were simulated by adjusting the value of d. Figure 3 shows four typical lines (Cu I 510.55, 515.32, 521.82 nm and Hα 656.28 nm) when −8 mm < d < 4 mm. During the movement of the lens, the large spot size resulted in a hemispherical structure and a small spot size in a stream-like shape of the produced plasma plume [27]. For a smaller spot size, due to the smaller cone angle of the laser beam, the plasma absorption will be localized near the vicinity of the central axis [28]. When a high-irradiance beam is employed to produce plasma, plasma shielding efficiently reduces the ablation rate [29]. Once the focal point is above the target surface (correspond to d > 0 mm), the enhanced shielding effects reduce the pulse energy deposited on the copper target. Therefore, the ablation rate and line intensity will be subject to the combined effects of the spot size, irradiance and plasma shielding.

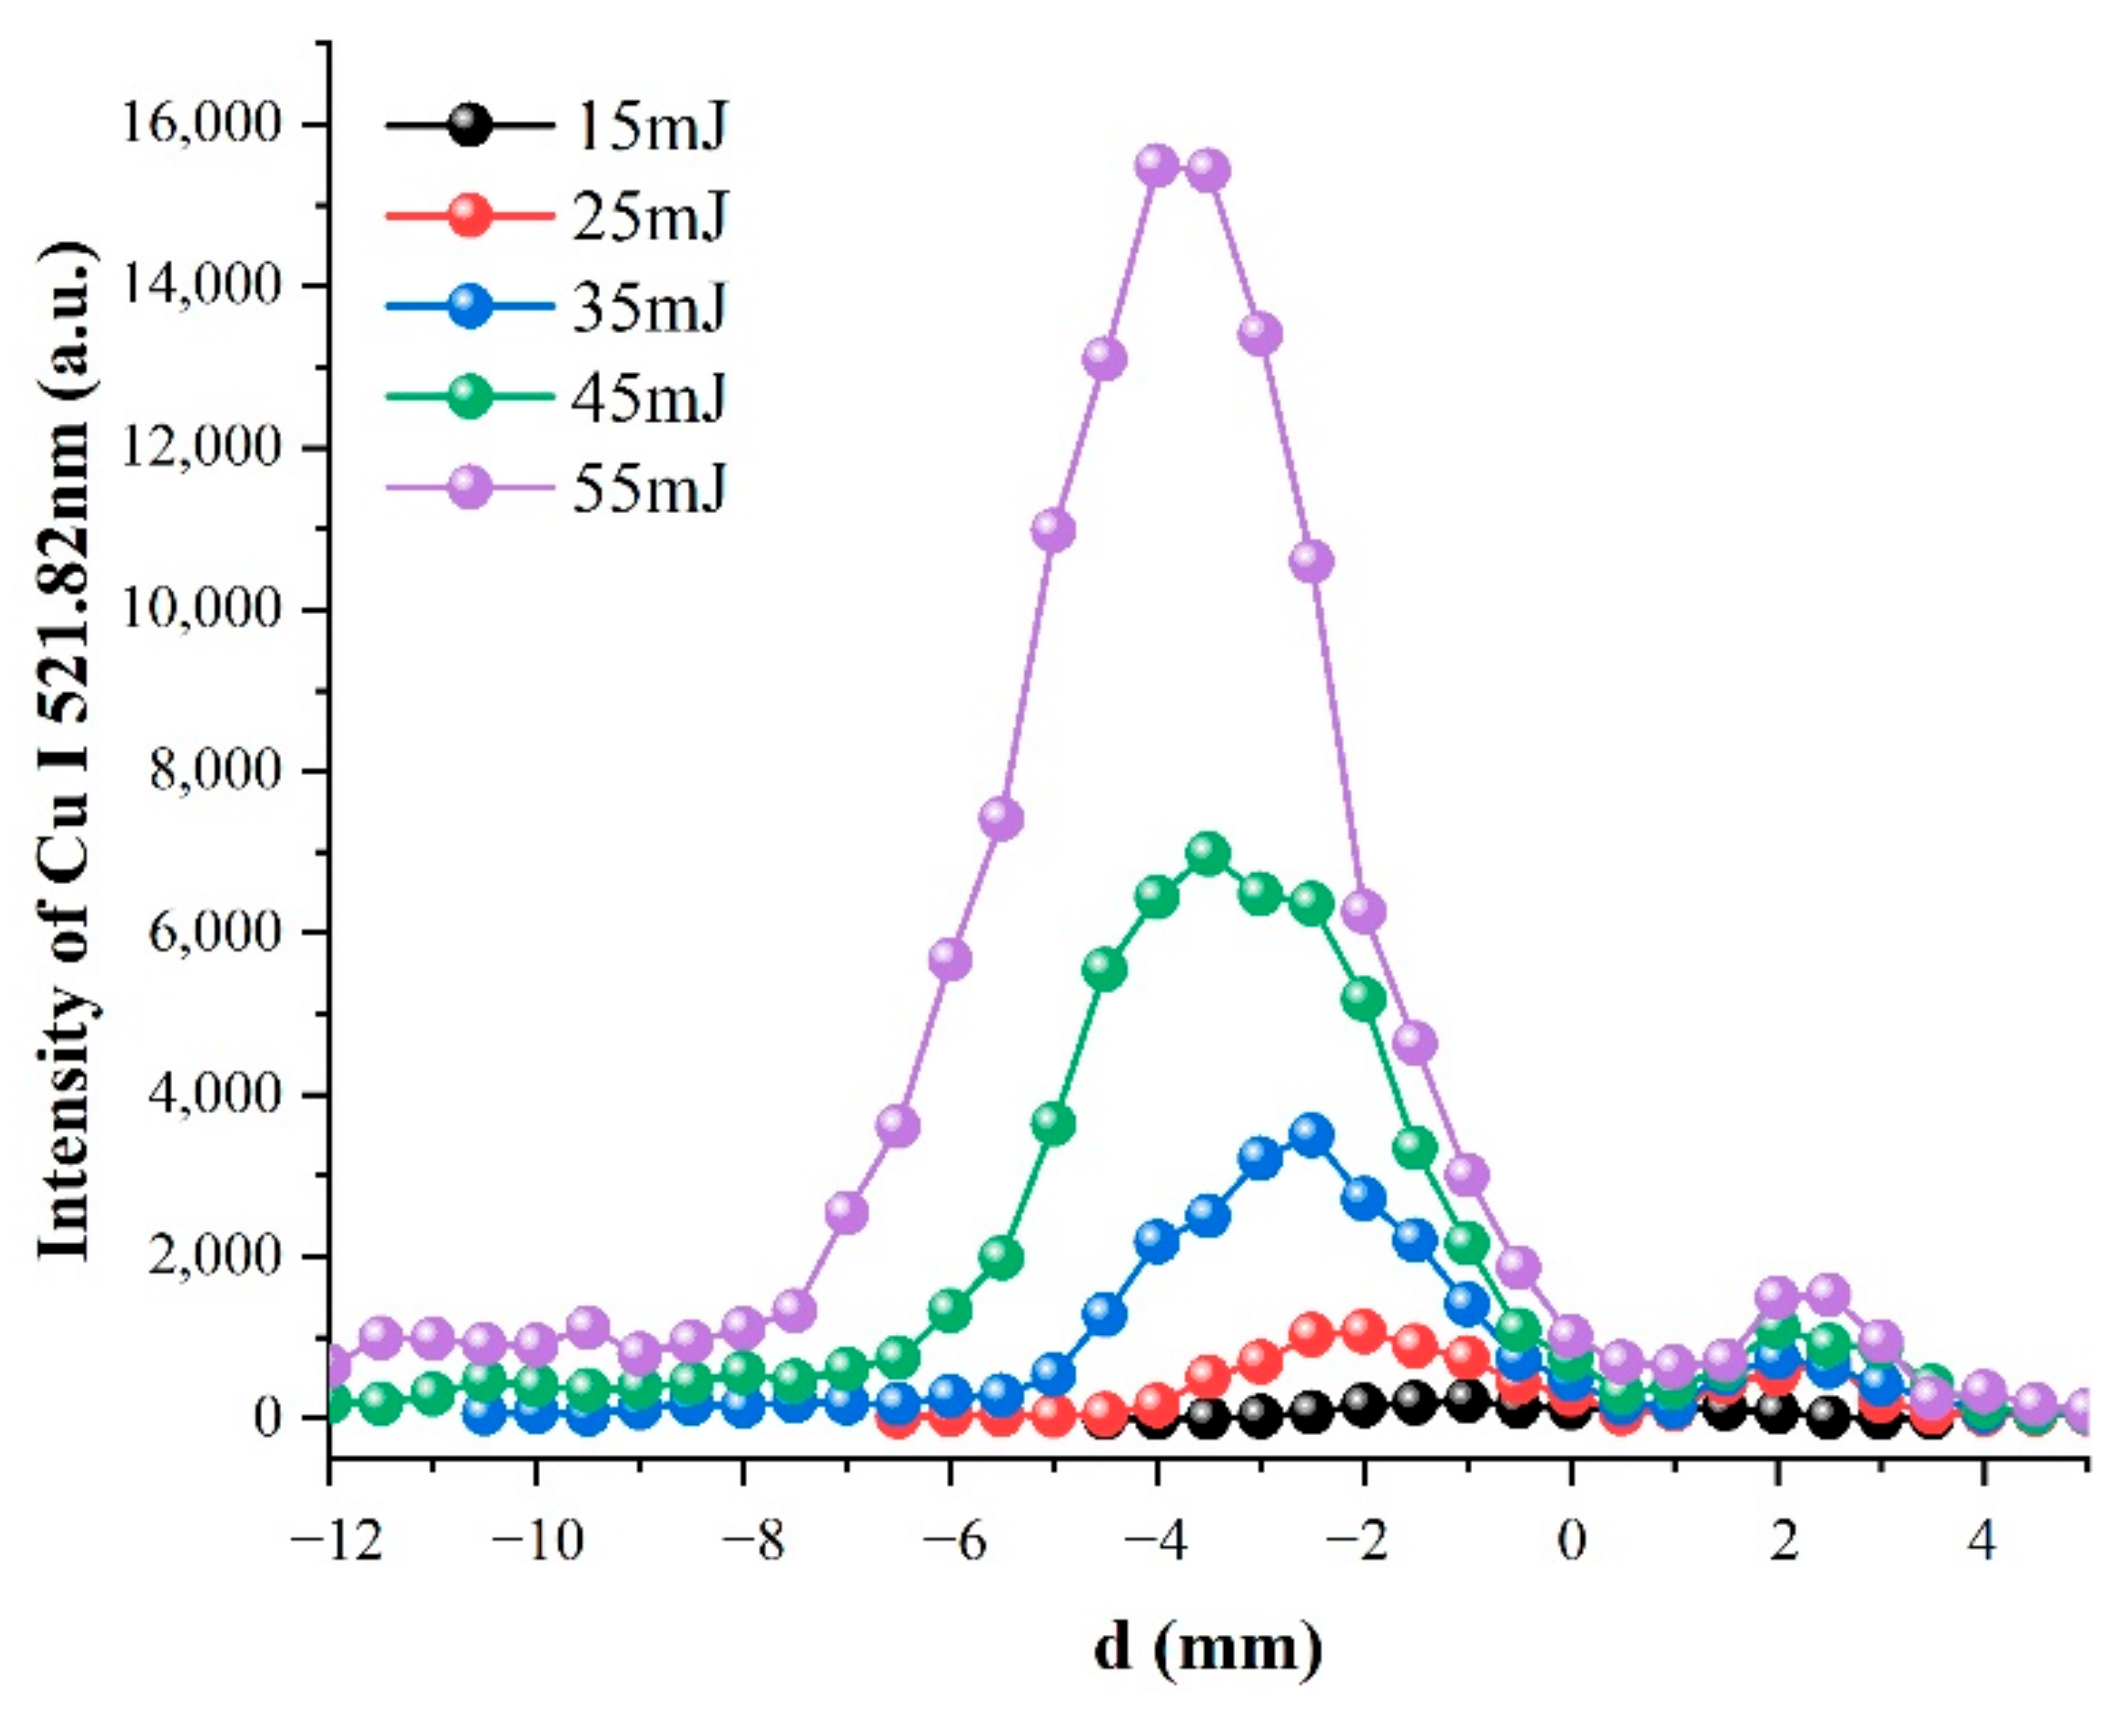
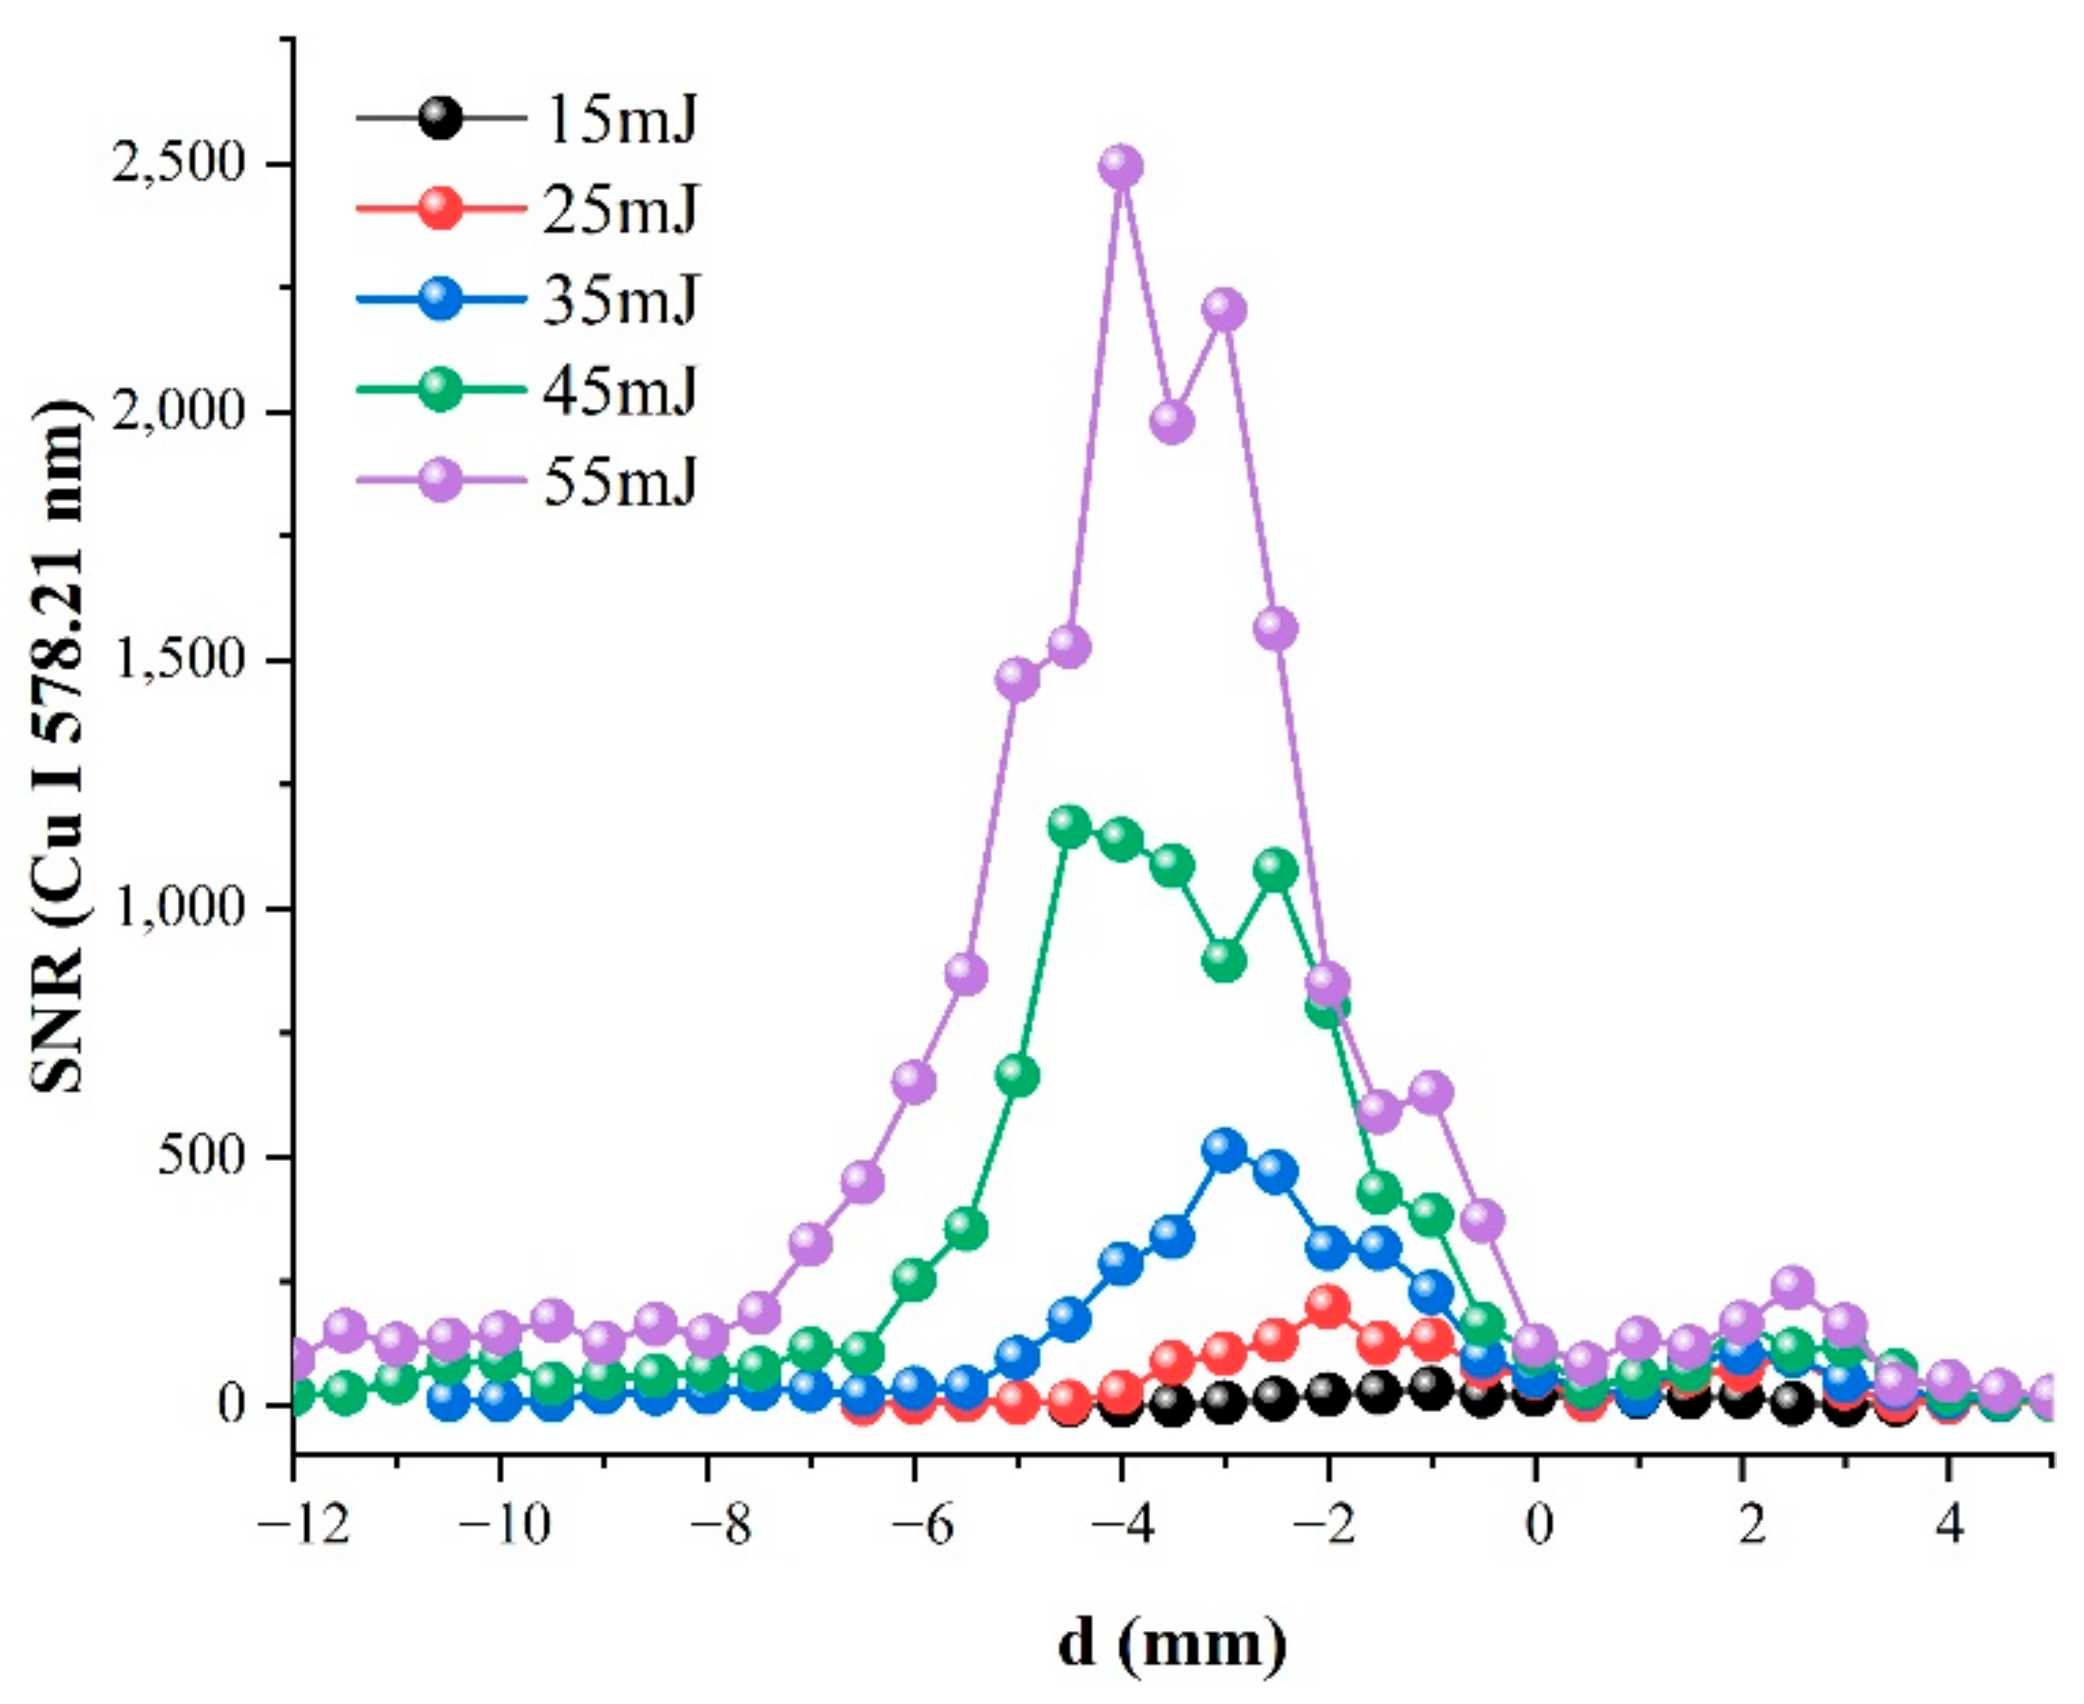
3.2. Effects of Pulse Energy

The line intensity at 521.82 nm was adopted to analyze the effects of pulse energy on the emission spectrum. The variations in line intensity at different d are shown in Figure 4. There was an obvious hump structure in the curve shape if the pulse energy exceeded 25 mJ. When the value of d was negative (such as d = −4 mm), the corresponding peak intensity was significantly higher than that of a positive one (d = 2.5 mm). Taking the pulse energy of 55 mJ as an example, the maximum intensity at d = −4 mm was approximately 15.4 times that of d = 0 mm. It is easy to achieve the maximum line intensity when the focal point is below the target surface (correspond to d < 0 mm), no matter how much pulse energy is employed. The first peak moved to the left with the increased pulse energy from 15 to 55 mJ. This indicated that the target should be even farther from the focal point to obtain the maximum line intensity. Moreover, it was found that the maximum line intensity increased nonlinearly with the increased pulse energy. For example, the maximum intensity (at d = −4 mm) was ~6900 and ~15,700 when the pulse energy was 45 and 55 mJ, respectively. It increased more than twice, while the pulse energy increased merely by 20%.
The line intensity decreased sharply and reached its minimum value at d = 1 mm. The ps pulse induced air breakdown and produced an air plasma during the pulse duration. The mixed plume of target vapor and ionized air absorbed the laser energy and expanded toward the incident beam [23]. After a few hundred ns, the emission of air plasma will be weak due to the lower density of air in comparison with the material plume. This is why the line Hα cannot be observed in Figure 3. Moreover, due to the decreased energy deposited on the target surface, the material vapor plume will not be significant during the ps duration. In this case, the shielding effects become serious, and the plasma emission is decreased due to the sharp decline in the ablation rate of the copper plate.
The line intensity reached another peak at d = 2.5 mm. Due to the reflected electrons from the ionized air channel and the free electrons emitted from the target surface, the high-irradiance pulse directly broke down the free air above the surface and produced an air plasma in the duration of the ps pulse [25]. Almost all of the pulse energy was absorbed by the air to produce and reheat the air plasma. After a few hundred ps or several ns, the ejected material plume was compressed by the shock wave of the air breakdown, and the high-temperature plasma moved toward the target and heated the erosive material plume [30]. When d > 2.5 mm, the increased spot size led to reduced irradiance and line intensity until the irradiance was below the breakdown threshold of copper.
SNR is often used to measure the capacity of a system or a device, and its value is directly related to the level of limit of detection (LOD) when detecting trace elements [20]. Here, the intensity of the Cu atomic line at 578.21 nm is regarded as the signal, and the background intensity from 574 nm to 576 nm represents the standard deviation. Figure 5 illustrates the variation in SNR with d under different pulse energies. It can be seen that the SNR increased with the pulse energy, regardless of whether the value of d was positive or negative. For d < 0 mm, as the focusing distance increased under a specified pulse energy, the SNR first increased sharply and then decreased quickly. The variation in SNR with the focusing distance was extremely similar to that of line intensity.

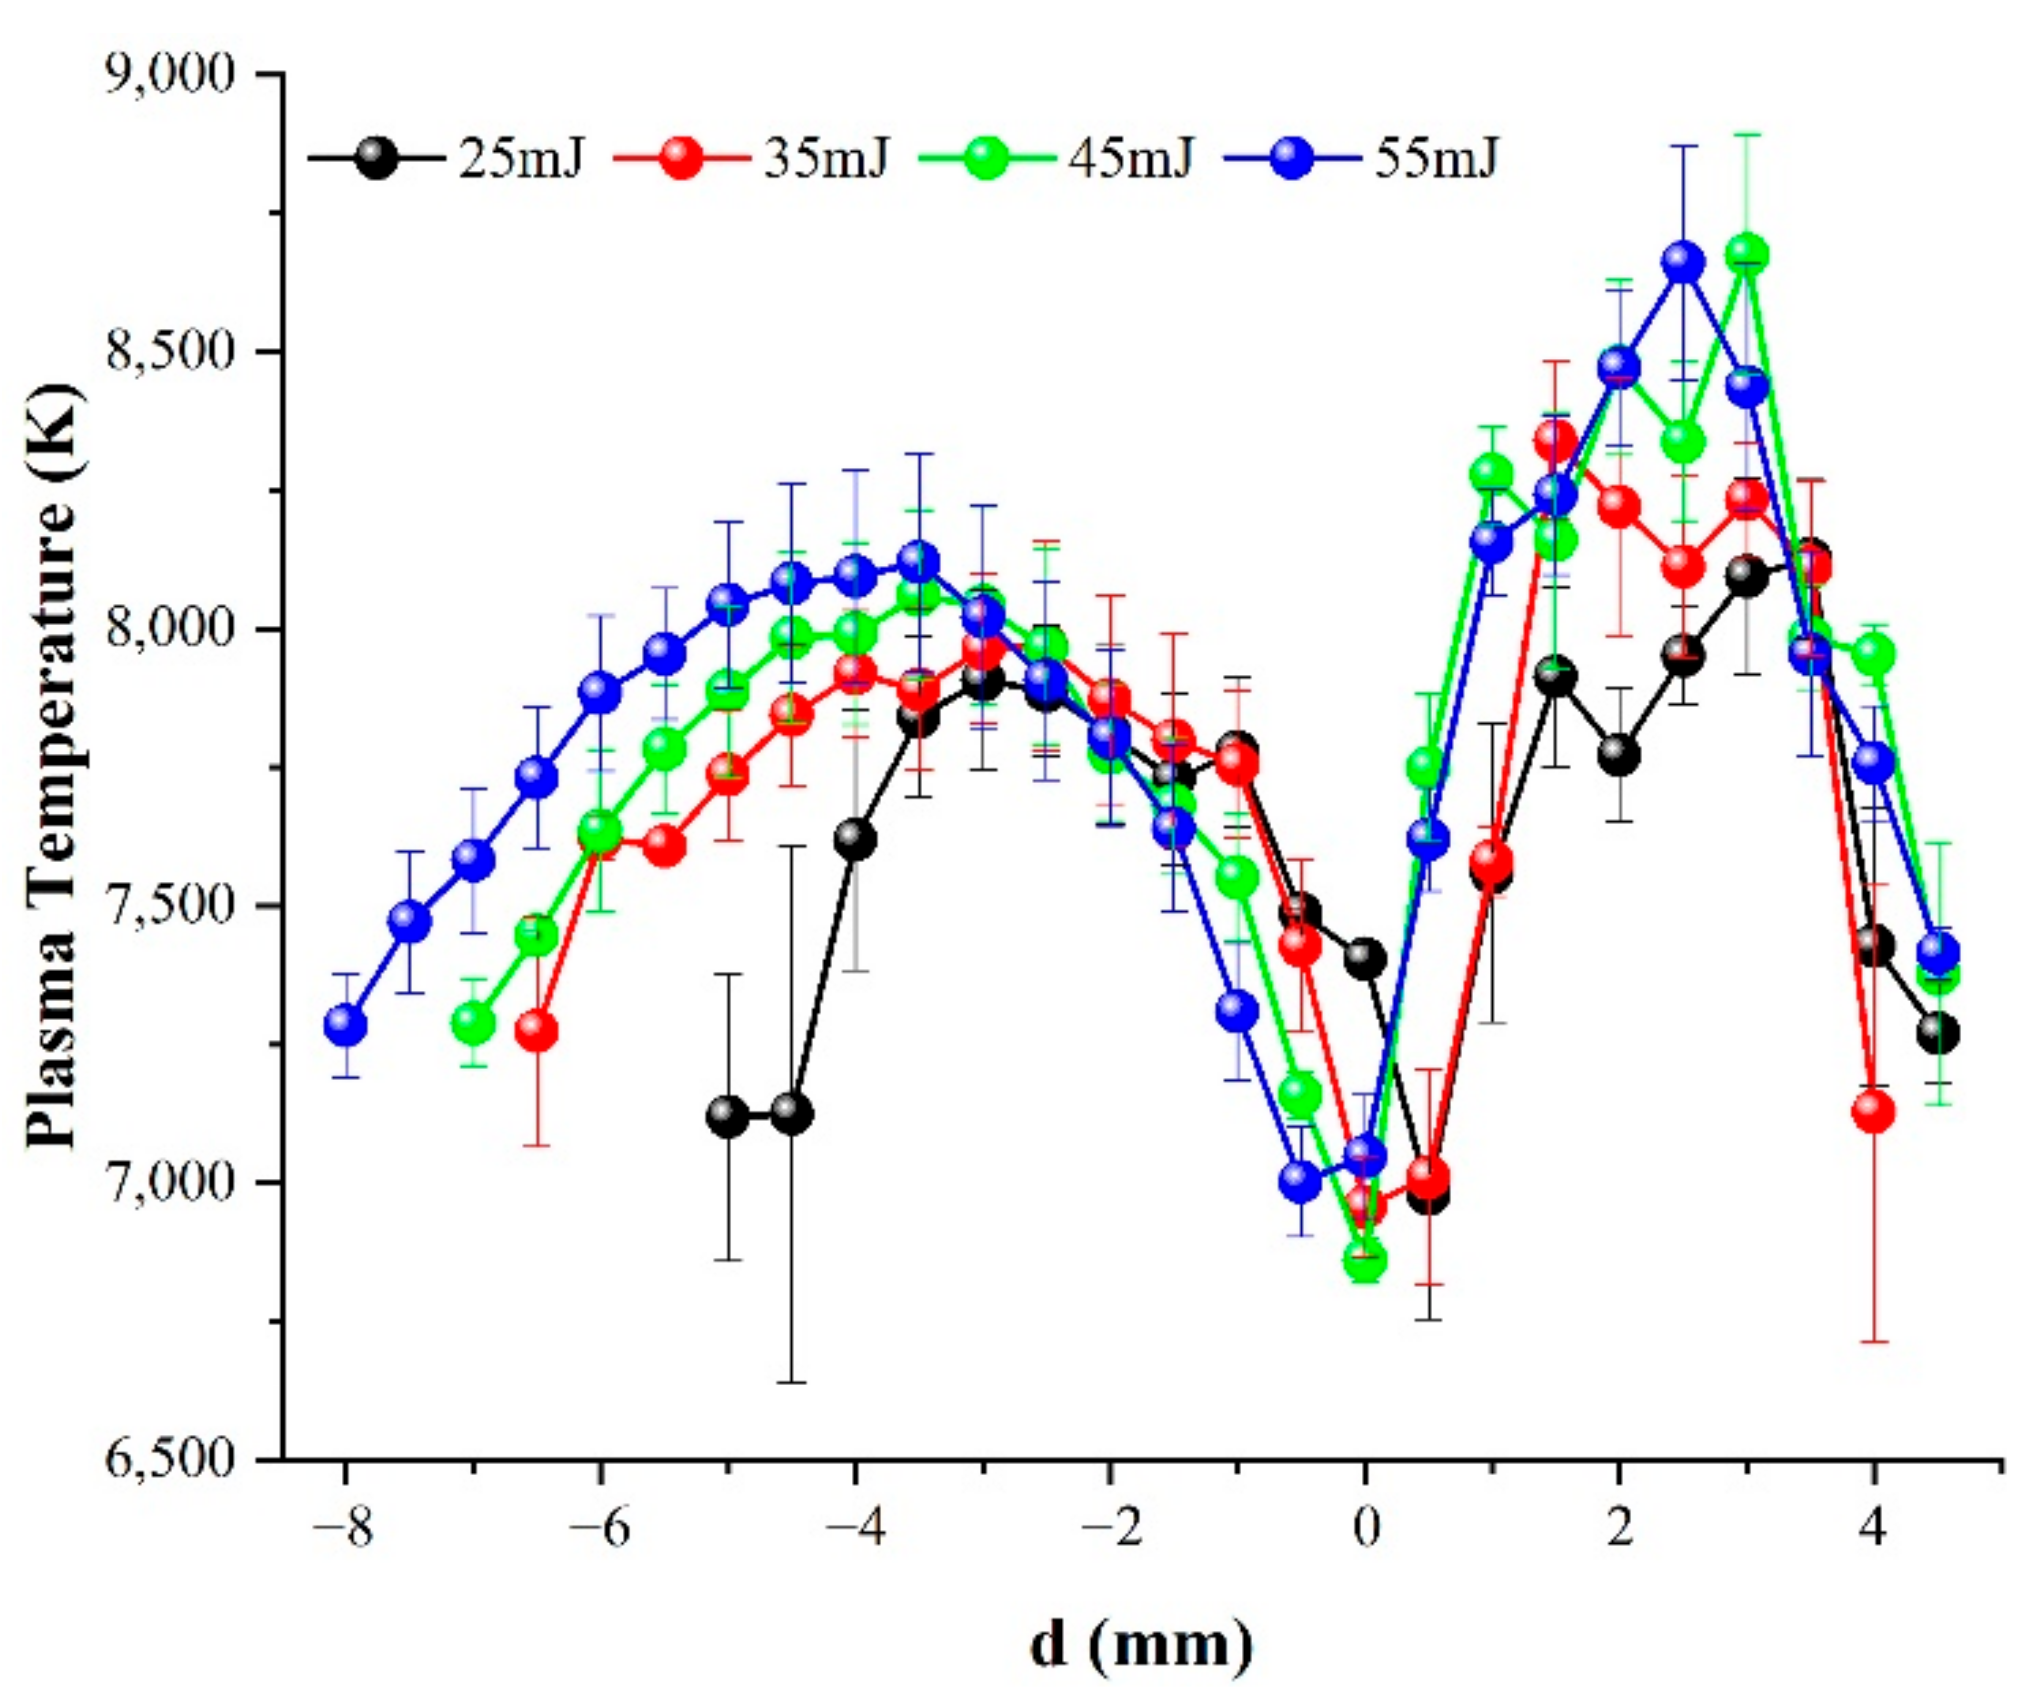
3.3. Plasma Temperature

It is difficult to achieve thermodynamic equilibrium in practical LIBS experiments and applications. Therefore, the local thermodynamic equilibrium (LTE) and optically thin conditions are usually considered to provide accurate plasma characteristics [31]. Under the above assumptions, the self-absorption of the non-resonance line is much weaker than electron collision and can be ignored during the radiation process [11].
Here, it is assumed that there are two atomic spectral lines λ1 and λ2, with spectral intensities of I1 and I2, respectively. The theoretical intensity ratio of the two atomic spectral lines can be expressed as [32]
I 1 I 2 = A 1 g 1 λ 2 A 2 g 2 λ 1 exp ( E 1 E 2 K b T )
where the plasma temperature T (K) is determined by the fitted slope of the Boltzmann plot, and it depends on the intensity of spectral lines. In other words,
ln I 1 λ 1 A 2 g 2 I 2 λ 2 A 1 g 1 = 1 K b T E 1 E 2
where A1 and A2 are, respectively, the spontaneous transition probabilities of spectral lines λ1 and λ2 from high energy levels to low energy levels, g1 and g2 are the degeneracy of the upper levels of E1 and E2, respectively, and Kb is the Boltzmann constant (eV/K). Referring to the NIST database, the characteristics of the Cu atomic lines at 510.55, 515.32 and 521.82 nm are listed in Table 1.
To accurately calculate the plasma temperature and electron density, the analytical lines should be selected in terms of the following four physical factors [11]: (1) lines with fewer self-absorption effects should be selected, such as the non-resonance lines; (2) the selected lines should possess high transition probability, and lines with a lesser transition probability below 2 × 10⁶ s−1 are supposed to be eliminated; (3) individual lines without interference and deformation, and (4) a sufficient difference in the upper-level energy of two lines. The three lines in Table 1 satisfy the four factors, and they are within the same channel with identical plasma collection efficiency.
When the pulse energy was 25, 35, 45 and 55 mJ, the variations in plasma temperature with d were as shown in Figure 6. It was found that the maximum plasma temperature increased slightly with the pulse energy when the value of d was negative. Two peaks of plasma temperature were observed on both sides of d = 0 mm. The peak temperature at a negative value of d was lower than that at a positive one, which contrasts the observed peaks of the line intensity in Figure 4. In the case of d > 0, the high-irradiance laser first interacted with the air above the target surface and produced an air plasma during the rising edge of ps pulse. The mixed plume of material vapor and ionized air absorbed the rest of the energy and exhibited a higher temperature.

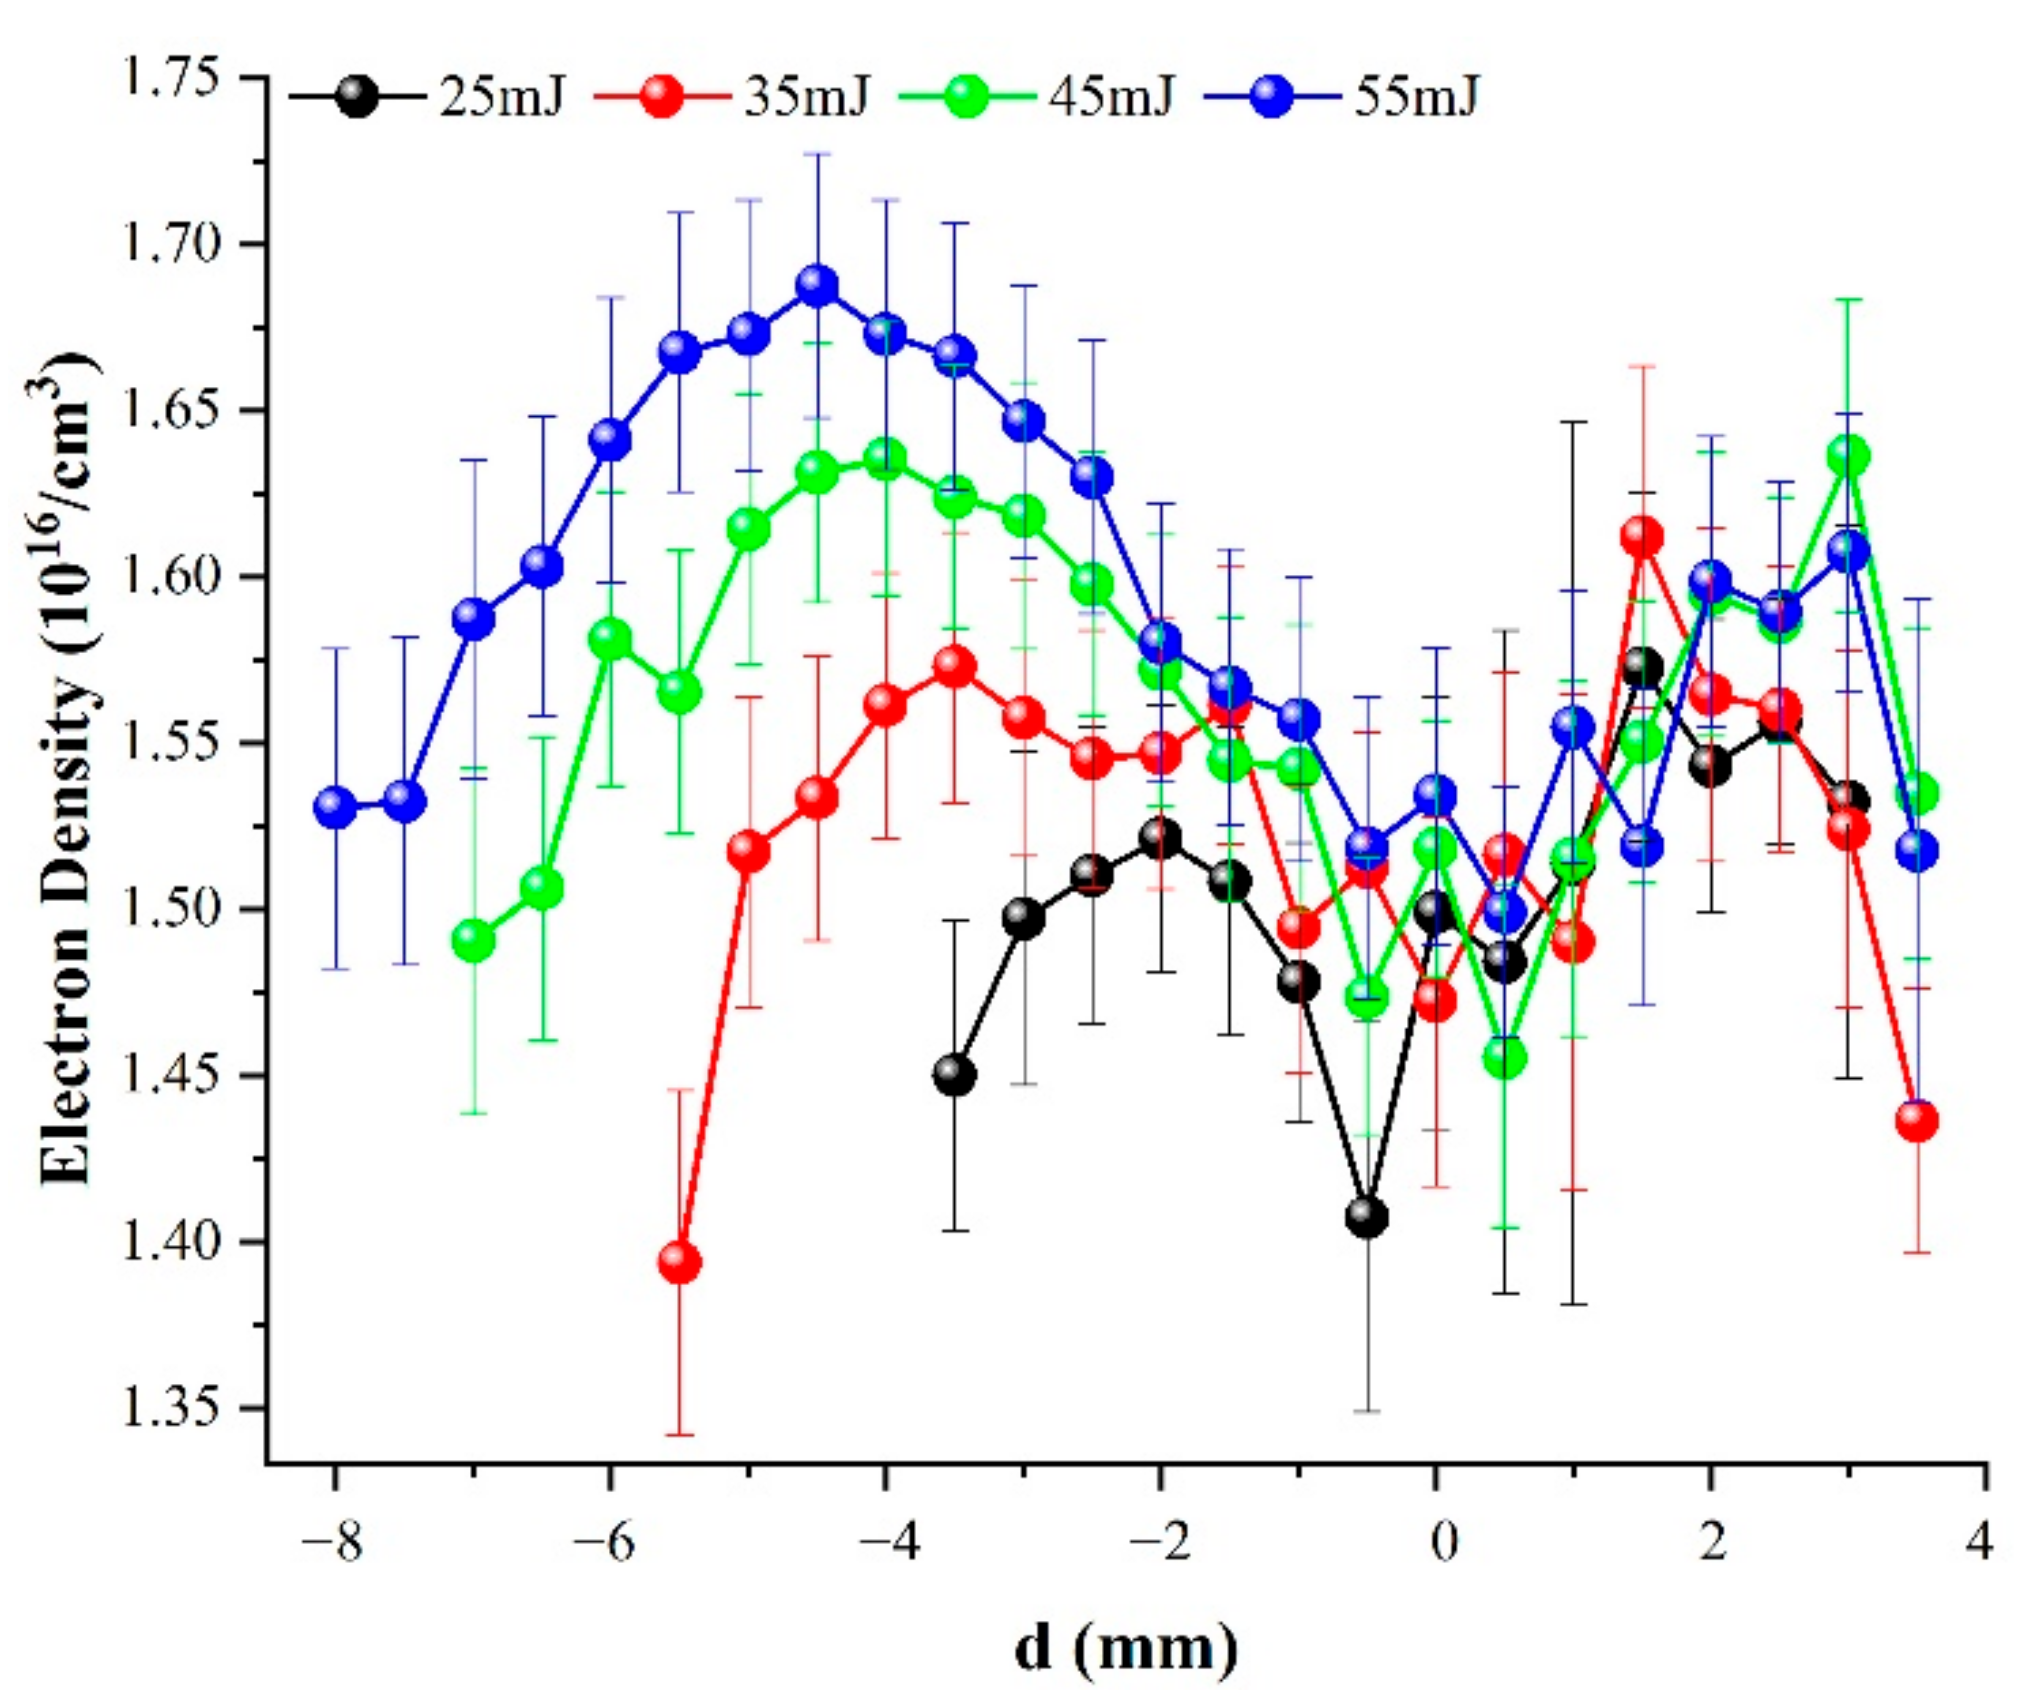
3.4. Electron Density

Generally, Stark broadening is mainly caused by the collisions of electrons and ions. Stark broadening is assumed to fit a Lorentz line shape, and the full width at half maximum (FWHM) Δλ is determined by the sum of two terms [33]:
Δ λ = 2 ω n e 10 16 + 3.5 A n e 10 16 1 / 4 1 3 4 n D 1 / 3 ω n e 10 16
where ω is the collision parameter independent of the electron density; A is the ion broadening parameter; nD is the number of particles in the Debye sphere, and ne is the electron density. The first and the second term in Equation (3) are related to electron broadening and ion broadening, respectively. Since the effect of ion broadening is significantly lower than that of electron broadening, Equation (3) can be rewritten as
Δ λ 2 ω n e 10 16
It can be seen from Table 1 that the three Cu atomic lines at 510.55, 515.32 and 521.82 nm represent non-resonant emission lines, and they do not exhibit a self-absorption effect. Therefore, the spectral line at 510.55 nm is recommended to estimate the value of Δλ by Lorentz linear fitting [34]. The value of the collision parameter ω is approximately 0.043 nm when the plasma temperature is 104 K [35]. With the pulse energy increased from 25 to 55 mJ, the variation in the electron density with d was as shown in Figure 7. It was found that two peaks were located at both sides of d = 0 mm, which is similar to the variation trend in Figure 4 and Figure 6. For the negative d, the peak electron density was 1.521 × 10¹⁶, 1.571 × 10¹⁶, 1.633 × 10¹⁶ and 1.688 × 10¹⁶/cm3 at pulse energies of 25, 35, 45 and 55 mJ, respectively.
The variation in Figure 4, Figure 6 and Figure 7 indicates that the increase in line intensity was far greater than that of electron density/plasma temperature when various pulse energy levels were employed. This phenomenon is similar to that when an fs or ns pulse is employed to irradiate copper at different focusing distances/irradiance. Xu et al. [10] deem that stronger irradiance will generate a plasma channel with higher ionization compared with a weak one. The target plasma plume will rush into this low-density region in the ionized air channel, which slows the increase in electron density. Moreover, the focusing distance/spot size is different when the maximum intensity is achieved at various pulse energy levels. The spatial and temporal evolution of species distribution in a plasma plume is heavily dependent on the focusing distance [27].

3.5. Validity of LTE and Optically Thin

In the case of stationary and homogenous plasma, the LTE condition can be examined by the McWhirter criterion. This is usually written as follows [31]:
n e 1.6 × 10 12 T 1 / 2 Δ E 3
where ΔE represents the difference between the upper and lower energy levels (eV) of the spectral line. Given the physical parameters of the spectral line at 510.55 nm (Table 1), the minimum electron density can be approximately estimated as 0.213 × 10¹⁶/cm3 when the plasma temperature is 8674 K. It is much lower than the experimental values in Figure 7. Thus, the McWhirter criterion is satisfied.
The McWhirter criterion is a necessary but not sufficient condition for the existence of LTE [31]. Two more criteria, plasma relaxation time and diffusion length, should be investigated in a transient and inhomogeneous plasma. The first one is that the plasma relaxation time τrel must be much shorter than the characteristic time of evolution of thermodynamic plasma parameters, which is the precondition of establishing and maintaining the thermodynamic equilibrium. This criterion can be expressed as the following inequality [33]:
T t + τ r e l T t T t 1
N e t + τ r e l N e t N e t 1
where Ne is the electron density, and T is the plasma temperature. Shakeel et al. [36] reported that the value of τrel ranges from 4 to 120 ns, which is much shorter than the observation time of the spectrometer in this work.
The second criterion requires that the diffusion length of species is shorter than the variation length of plasma temperature and electron density. For spatially inhomogeneous plasma, the position x can be expressed as [31]
T x + Δ x T x T x 1
N e x + Δ x N e x N e x 1
where Δx is the diffusion length during the plasma relaxation time τrel. Generally, the diffusion length must be at least one order of magnitude shorter than the plasma dimension. The value of Δx is in the order of 10−3 mm [36], whereas the plasma diameter can be estimated at ~1 mm in this work. This implies that the third criterion is fulfilled and the previously assumed LTE condition holds.
The non-resonance lines are free from self-absorption effects in optically thin plasma, and the relationship between two atomic lines must conform to Equation (1). In particular, if two lines of the same element originate from the same upper level with the identical ionization stage, the theoretical doublet intensity ratio can be expressed as [32]
I 1 I 2 = A 1 g 1 λ 2 A 2 g 2 λ 1
where the three factors are independent of the experimental parameters. Considering that the Cu atomic lines 515.32 and 521.82 nm have the same upper level, the experimental intensity ratio I521.82 nm/I515.32 nm at different d was as shown in Appendix A. The results indicated that most of the experimental ratios ranged from 1.68 to 1.75 with increased d, which is close to the theoretical value of 1.85 obtained from Equation (10). Therefore, the observed plasma can exist in an optically thin condition.

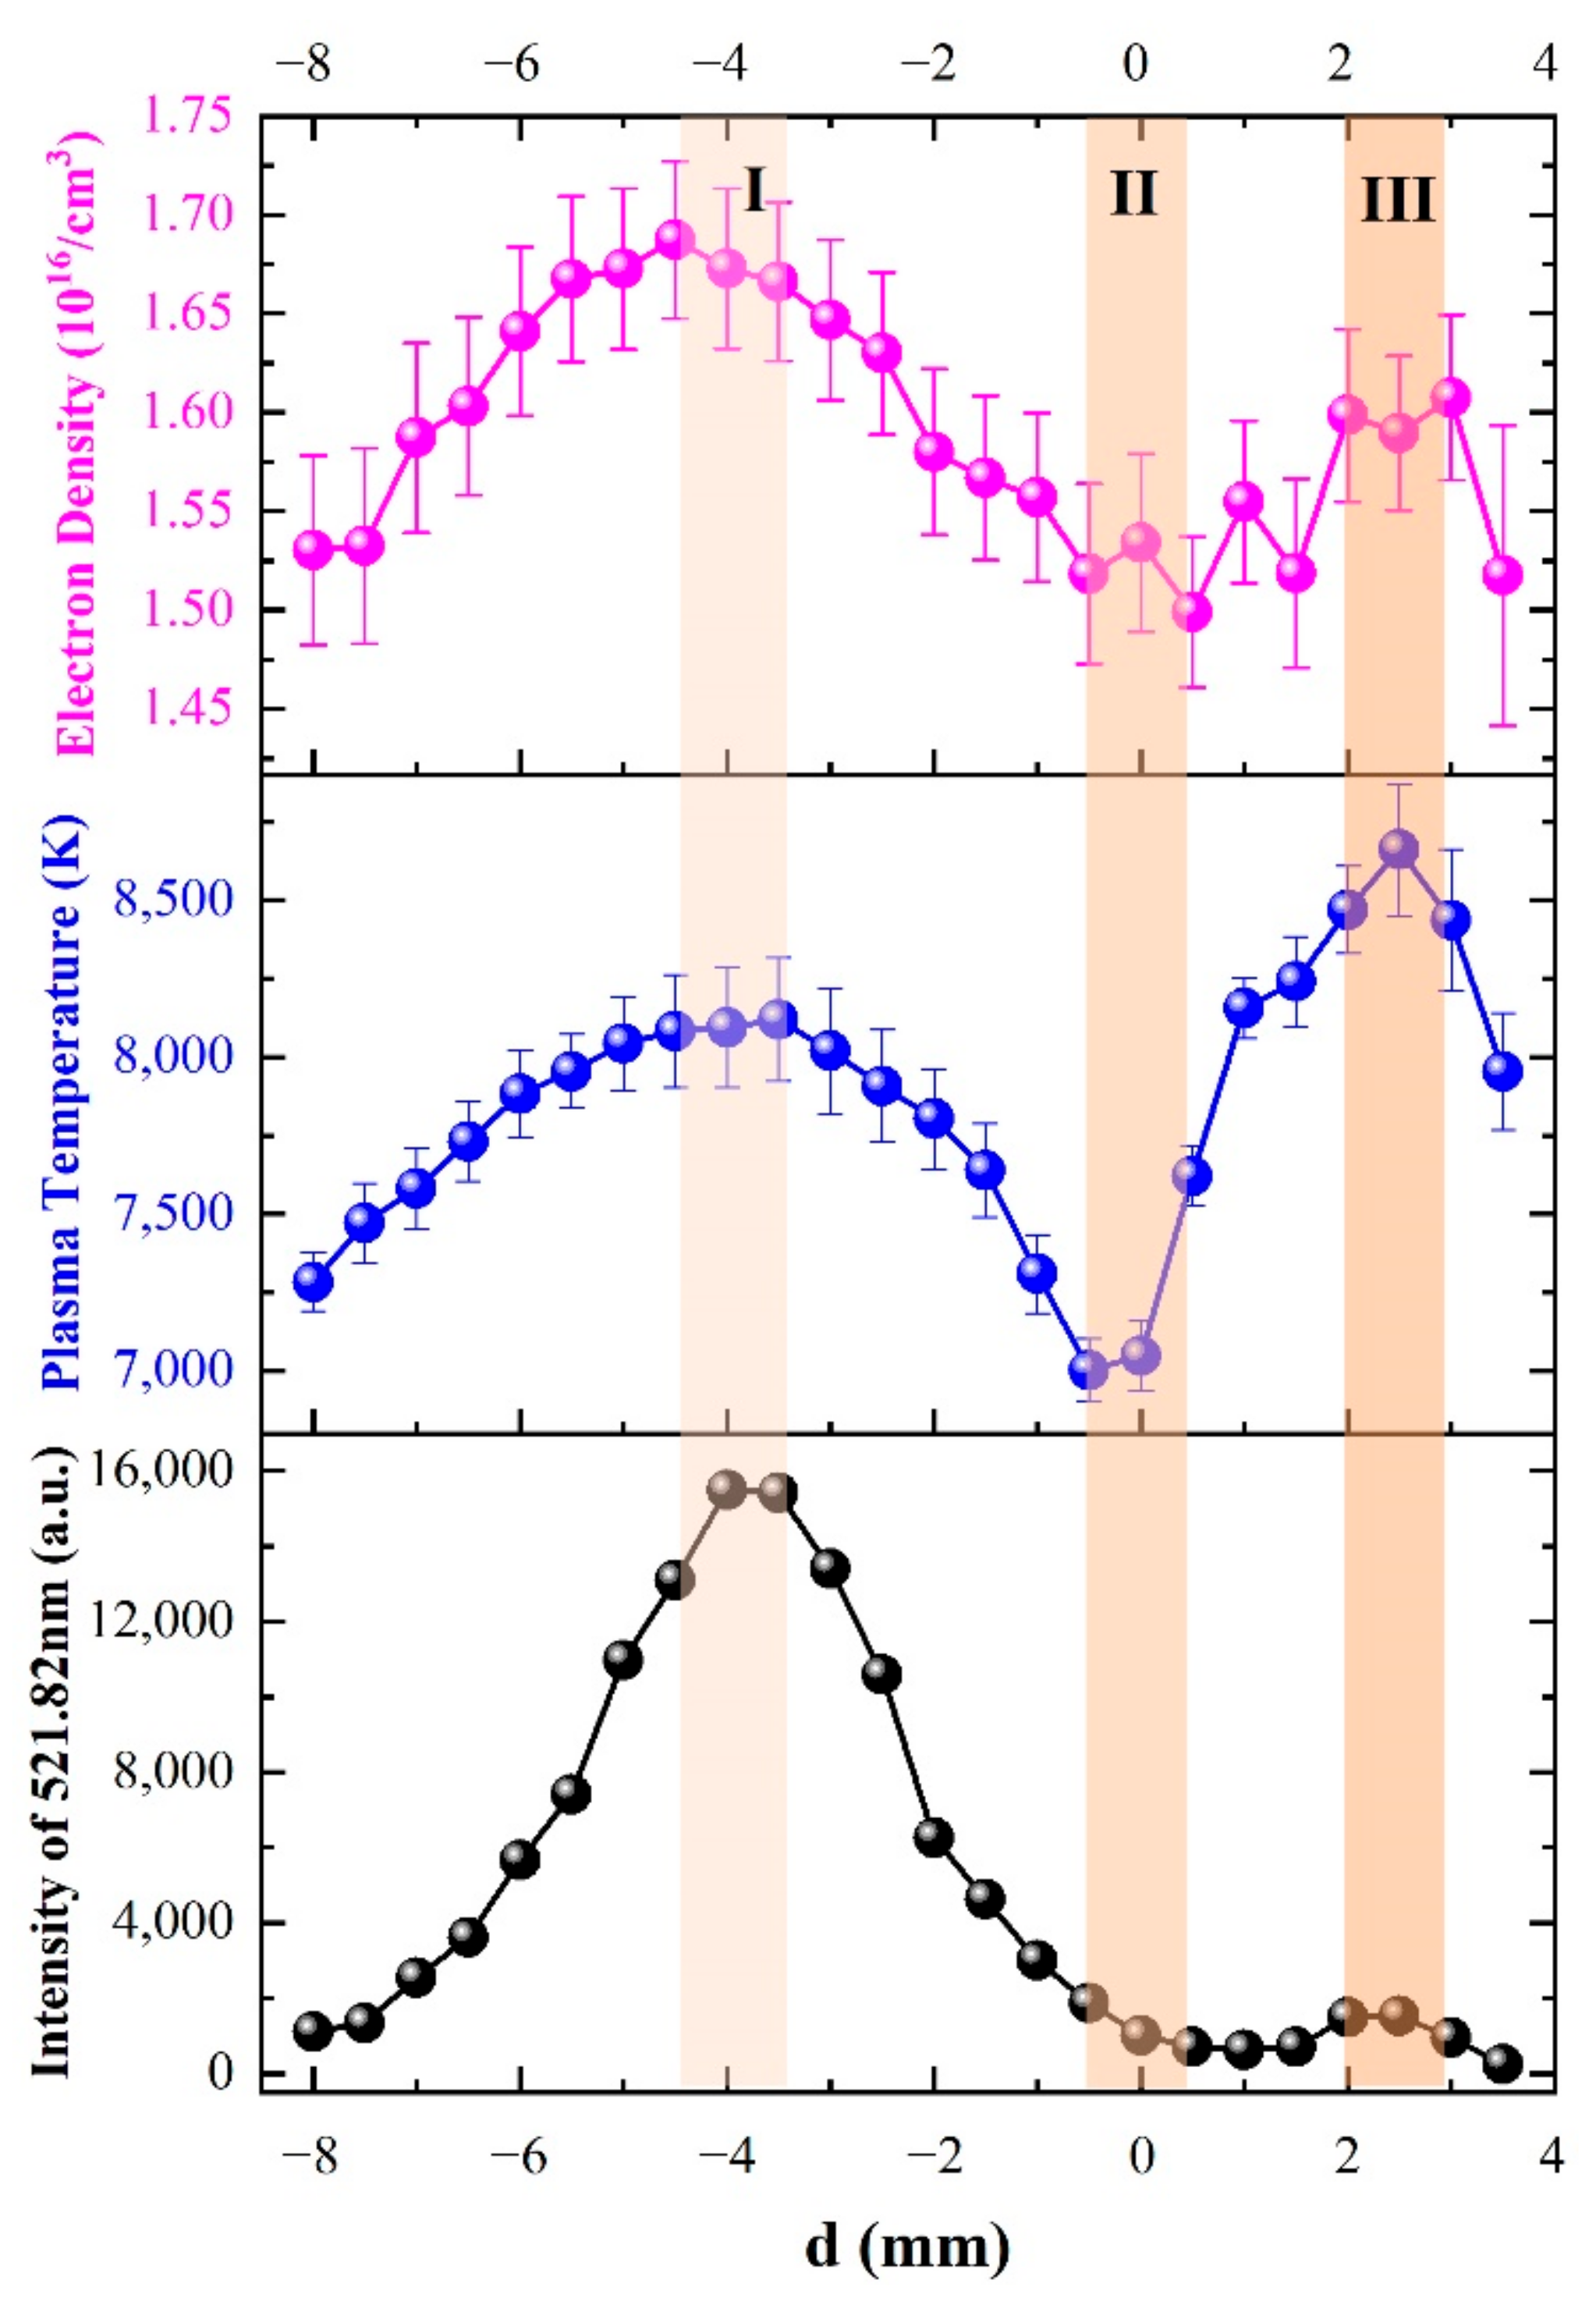
3.6. Internal Relationship

When the pulse energy was 55 mJ (here, the irradiance is up to 8.65 TW/cm2), the variation in the electron density, plasma temperature and line intensity with d was as shown in Figure 8. An interesting phenomenon could be observed whereby the electron density and line intensity were the highest at d < 0 mm, while the highest plasma temperature occurred at d > 0 mm. When the focal point is on/below the target surface, or the ps pulse intensity is between the breakdown threshold of the solid target and that of air, it is considered that the formation of ps laser-induced plasma is mainly due to the laser–target–air interaction. If the focal point is above the target surface, or the irradiance exceeds the breakdown threshold of the air, the ps pulse will induce air breakdown and form a plasma channel. Due to the decreased energy deposited on the target surface, the material vapor plume will not be significant during the ps duration [26].
When d gradually ranges from a negative value to a positive one, the degree of plasma shielding becomes severe. Since most of the pulse energy is absorbed by the plasma, the values of the above three parameters increase first and then decrease at d < 0 mm. In the case of d > 0 mm, the shielding effects are intensified due to the material plume pressured by the shockwave, causing the above three parameters to increase again. According to the line intensity, the three typical regions with different degrees of plasma shielding in the range of −4 mm < d < 4 mm are: (i) the slightly shielded region near the peak line intensity when d ≈ −4 mm; (ii) the intermediate shielding region when d ≈ 0 mm; and (iii) the significant shielding region near the second peak when d ≈ 2.5 mm.
In the slightly shielded region, when the irradiance increased sharply and reached a critical threshold, the laser-induced air breakdown appeared and generated a weak air plasma gradually, causing initial plasma shielding. Once plasma shielding occurs, the mixture plasma will absorb a part of the pulse energy through electron-ion inverse Bremsstrahlung or electron-neutral inverse Bremsstrahlung processes. The above three values reached the first peak due to the relatively weak shielding effects.
In the intermediate shielding region, the focal point was exactly located on the target surface, which induced the highest pulse intensity. Compared to the condition of no target, the existence of a target will induce a sharply decreased air breakdown threshold [26]. After a few ps, the air above the target surface will be broken down and produce an air plasma due to the seed electrons emitted from the target. Under an extremely intensive beam, the ejected melted material may occur in the ps pulse duration [25]. With the fast expansion of melted material caused by the higher temperature and pressure, more melted target mass is removed through the shock wave (phase explosion), resulting in a decreased line intensity and plasma temperature.
In the significant shielding region, the air above the target surface will directly break down under extreme irradiance in the order of TW/cm2 [37]. During the ps pulse, the electrons and atoms emitted from the ionized air will arrive at the target surface and then reflect backward. Meanwhile, the free electrons emitted from the target surface absorb pulse energy mainly through the inverse Bremsstrahlung. Due to the extremely high pressure, the overheated pulse–matter area will create an adiabatic expansion and then produce a fast shock wave that expands outward [26]. The spherical expansion distance can be calculated by Sedov–Taylor scaling [30]:
R t = λ E / ρ 1 / 5 t 2 / 5
where λ ≈ 1; E is the energy released by the shock wave; ρ is the air density, and t is the time delay. Assuming that the air breakdown absorbs half of 55 mJ, the corresponding expansion distance is ~2 mm when t = 1.3 μs. This estimated distance approximates the relative distance d = 2.5 mm. It is considered that the material plasma plume is compressed by the shock wave, which enhances the electron density and plasma temperature.

4. Conclusions

In this work, the effects of plasma shielding on plasma characteristics, including line intensity, electron density and plasma temperature, are analyzed by changing the pulse energy and focusing distance. Compared to the case whereby the focal point is above the target surface, the shielding effects of plasma are relatively minor when the focal point is below the target surface, where it is easier to obtain the maximum line intensity, spectrum SNR and electron density. As the pulse energy increases, the optimal position of the sample is farther away from the focal point, and the corresponding line intensity, plasma temperature and electron density are increased. When the focal point is above the target surface, the values of the above three parameters increase again due to the high pressure of the over-heated shock wave. Under an extremely high pulse intensity, the self-focusing effect in the ps filament may help to reduce the defocusing effect and increase the irradiated intensity on the target surface [38]. For accurate plasma temperature and electron density, the McWhirter relation, plasma relaxation time and diffusion length are adopted to validate the LTE assumption. The variation in line intensity indicates that the optically thin condition is satisfied at different focusing distances. To comprehensively understand the effects of plasma shielding on the laser–matter interaction, our future work will utilize ICCD and filtering devices to determine the species characteristics of plasma.

Author Contributions

Conceptualization, data curation, writing—original draft preparation, L.C.; project administration, funding acquisition, H.D.; writing—review and editing, Z.X.; methodology, J.G.; resources, Q.L.; investigation, G.L.; supervision, funding acquisition, L.S. All authors have read and agreed to the published version of the manuscript.

Funding

This research was funded by the National Natural Science Foundation of China, grant number 11872058; Sichuan Science and Technology Program of China, grant numbers 2019110 and 2019YFG0114; Guangxi Natural Science Foundation of China, grant number 2019GXNSBA185013; and National Defense Basic Scientific Research Program of China, grant numbers JCKY2018404C007, JSZL2017404A001 and JSZL2018204C002.

Data Availability Statement

The data presented in this study are available on request from the corresponding author.

Acknowledgments

The authors would like to thank H. Zhang and Y. Jiang for the discussion.

Conflicts of Interest

The authors declare no conflict of interest.

Appendix A

Figure A1. Effect of pulse energies and d on the experimental intensity ratio I521.82 nm/I515.32 nm.
Photonics 08 00536 g0a1

References

  1. Ahmed, R.; Iqbal, J.; Baig, M.A. Effects of laser wavelengths and pulse energy ratio on the emission enhancement in dual pulse LIBS. Laser Phys. Lett. 2015, 12, 66102. [Google Scholar] [CrossRef]
  2. Bredice, F.O.; Di Rocco, H.O.; Sobral, H.M.; Villagrán-Muniz, M.; Palleschi, V. A new method for determination of self-absorption coefficients of emission lines in laser-induced breakdown spectroscopy experiments. Appl. Spectrosc. 2010, 64, 320–323. [Google Scholar] [CrossRef] [PubMed]
  3. De Lucia, F.C.; Gottfried, J.L.; Miziolek, A.W. Evaluation of femtosecond laser-induced breakdown spectroscopy for explosive residue detection. Opt. Express 2009, 17, 419–425. [Google Scholar] [CrossRef] [PubMed]
  4. Cremers, D.A.; Radziemski, L.J. Handbook of Laser-Induced Breakdown Spectroscopy, 2nd ed.; Wiley: Hoboken, NJ, USA, 2013; ISBN 9781118567364. [Google Scholar]
  5. Li, Q.; Tian, Y.; Xue, B.; Li, N.; Ye, W.; Lu, Y.; Zheng, R. Improvement in the analytical performance of underwater LIBS signals by exploiting the plasma image information. J. Anal. At. Spectrom. 2020, 35, 366–376. [Google Scholar] [CrossRef]
  6. Ruiz, J.; Delgado, T.; Cabalín, L.M.; Laserna, J.J. At-line monitoring of continuous casting sequences of steel using discriminant function analysis and dual-pulse laser-induced breakdown spectroscopy. J. Anal. At. Spectrom. 2017, 32, 1119–1128. [Google Scholar] [CrossRef]
  7. Rauschenbach, I.; Jessberger, E.K.; Pavlov, S.G.; Hübers, H.-W. Miniaturized Laser-Induced Breakdown Spectroscopy for the in-situ analysis of the Martian surface: Calibration and quantification. Spectrochim. Acta Part B At. Spectrosc. 2010, 65, 758–768. [Google Scholar] [CrossRef]
  8. Pagnotta, S.; Lezzerini, M.; Ripoll-Seguer, L.; Hidalgo, M.; Grifoni, E.; Legnaioli, S.; Lorenzetti, G.; Poggialini, F.; Palleschi, V. Micro-Laser-Induced Breakdown Spectroscopy (Micro-LIBS) Study on Ancient Roman Mortars. Appl. Spectrosc. 2017, 71, 721–727. [Google Scholar] [CrossRef]
  9. Yao, M.; Lin, J.; Liu, M.; Xu, Y. Detection of chromium in wastewater from refuse incineration power plant near Poyang Lake by laser induced breakdown spectroscopy. Appl. Opt. 2012, 51, 1552–1557. [Google Scholar] [CrossRef]
  10. Xu, W.; Chen, A.; Wang, Q.; Zhang, D.; Wang, Y.; Li, S.; Jiang, Y.; Jin, M. Generation of high-temperature and low-density plasma with strong spectral intensity by changing the distance between the focusing lens and target surface in femtosecond laser-induced breakdown spectroscopy. J. Anal. At. Spectrom. 2019, 34, 1018–1025. [Google Scholar] [CrossRef]
  11. Singh, J.P.; Thakur, S.N. Laser-Induced Breakdown Spectroscopy, 1st ed.; Elsevier: Amsterdam, The Netherlands, 2007; ISBN 978-0-444-51734-0. [Google Scholar]
  12. Liu, D.; Zhang, D. Vaporization and Plasma Shielding during High Power Nanosecond Laser Ablation of Silicon and Nickel. Chin. Phys. Lett. 2008, 25, 1368–1371. [Google Scholar] [CrossRef]
  13. Mao, X.; Russo, R.E. Invited paper Observation of plasma shielding by measuring transmitted and reflected laser pulse temporal profiles. Appl. Phys. A 1996, 64, 1–6. [Google Scholar] [CrossRef]
  14. Giannuzzi, G.; Gaudiuso, C.; Di Franco, C.; Scamarcio, G.; Lugarà, P.M.; Ancona, A. Large area laser-induced periodic surface structures on steel by bursts of femtosecond pulses with picosecond delays. Opt. Lasers Eng. 2019, 114, 15–21. [Google Scholar] [CrossRef]
  15. Aguilera, J.A.; Aragón, C.; Peñalba, F. Plasma shielding effect in laser ablation of metallic samples and its influence on LIBS analysis. Appl. Surf. Sci. 1998, 127-129, 309–314. [Google Scholar] [CrossRef]
  16. Capon, M.R.; Docchio, F.; Mellerio, J. Nd:YAG laser photodisruption: An experimental investigation on shielding and multiple plasma formation. Graefe’s Arch. Clin. Exp. Ophthalmol. 1988, 226, 362–366. [Google Scholar] [CrossRef]
  17. Zhang, D.; Liu, D.; Li, Z.; Hou, S.; Yu, B.; Guan, L.; Tan, X.; Li, L. A new model of pulsed laser ablation and plasma shielding. Phys. B Condens. Matter 2005, 362, 82–87. [Google Scholar] [CrossRef]
  18. Penczak, J.; Kupfer, R.; Bar, I.; Gordon, R.J. The role of plasma shielding in collinear double-pulse femtosecond laser-induced breakdown spectroscopy. Spectrochim. Acta Part B At. Spectrosc. 2014, 97, 34–41. [Google Scholar] [CrossRef] [Green Version]
  19. Lee, D.H.; Kim, T.H.; Jung, E.C.; Yun, J.-I. Shielding effect of laser-induced plasma in glass: Pulse-to-pulse evolution of nitrogen and analyte emission lines. Appl. Phys. A 2011, 104, 863–869. [Google Scholar] [CrossRef]
  20. Wang, J.; Li, X.; Li, H.; Li, X.; Li, Z. Lens-to-sample distance effect on the quantitative analysis of steel by laser-induced breakdown spectroscopy. J. Phys. D Appl. Phys. 2020, 53, 255203. [Google Scholar] [CrossRef]
  21. Liu, Y.; Chen, M.; Liu, X.; Cui, Q.; Zhao, M. The mechanism of effect of lens-to-sample distance on laser-induced plasma. Acta Phys. Sin. 2013, 62, 25203. [Google Scholar] [CrossRef]
  22. Fu, H.; Ni, Z.; Wang, H.; Jia, J.; Dong, F. Accuracy improvement of calibration-free laser-induced breakdown spectroscopy. Plasma Sci. Technol. 2019, 21, 34001. [Google Scholar] [CrossRef]
  23. Goncharov, V.K.; Kozadaev, K.V.; Makarov, V.V.; Shchegrikovich, D.V. Occurrence of erosion processes in the near-surface region of metals exposed to intense nanosecond laser pulses. J. Eng. Thermophys. 2013, 86, 798–804. [Google Scholar] [CrossRef]
  24. Mao, S.S.; Mao, X.; Greif, R.; Russo, R.E. Dynamics of an air breakdown plasma on a solid surface during picosecond laser ablation. Appl. Phys. Lett. 2000, 76, 31–33. [Google Scholar] [CrossRef]
  25. Zhang, N.; Zhu, X.; Yang, J.; Wang, X.; Wang, M. Time-resolved shadowgraphs of material ejection in intense femtosecond laser ablation of aluminum. Phys. Rev. Lett. 2007, 99, 167602. [Google Scholar] [CrossRef]
  26. Zhang, H.; Zhang, F.; Du, X.; Dong, G.; Qiu, J. Influence of laser-induced air breakdown on femtosecond laser ablation of aluminum. Opt. Express 2015, 23, 1370–1376. [Google Scholar] [CrossRef]
  27. Li, X.; Wei, W.; Wu, J.; Jia, S.; Qiu, A. The Influence of spot size on the expansion dynamics of nanosecond-laser-produced copper plasmas in atmosphere. J. Appl. Phys. 2013, 113, 243304. [Google Scholar] [CrossRef]
  28. Harilal, S.S.; Coons, R.W.; Hough, P.; Hassanein, A. Influence of spot size on extreme ultraviolet efficiency of laser-produced Sn plasmas. Appl. Phys. Lett. 2009, 95, 221501. [Google Scholar] [CrossRef] [Green Version]
  29. Vadillo, J.M.; Fernández Romero, J.M.; Rodríguez, C.; Laserna, J.J. Effect of plasma shielding on laser ablation rate of pure metals at reduced pressure. Surf. Interface Anal. 1999, 27, 1009–1015. [Google Scholar] [CrossRef]
  30. Zeldovich, Y.B.; Raizer, Y.P. Physics of Shock Waves and High-Temperature Hydrodynamic Phenomena; Dover Publications: New York, NY, USA, 2003. [Google Scholar]
  31. Cristoforetti, G.; de Giacomo, A.; Dell’Aglio, M.; Legnaioli, S.; Tognoni, E.; Palleschi, V.; Omenetto, N. Local Thermodynamic Equilibrium in Laser-Induced Breakdown Spectroscopy: Beyond the McWhirter criterion. Spectrochim. Acta Part B At. Spectrosc. 2010, 65, 86–95. [Google Scholar] [CrossRef]
  32. Hou, J.; Zhang, L.; Yin, W.; Yao, S.; Zhao, Y.; Ma, W.; Dong, L.; Xiao, L.; Jia, S. Development and performance evaluation of self-absorption-free laser-induced breakdown spectroscopy for directly capturing optically thin spectral line and realizing accurate chemical composition measurements. Opt. Express 2017, 25, 23024–23034. [Google Scholar] [CrossRef]
  33. Hahn, D.W.; Omenetto, N. Laser-induced breakdown spectroscopy (LIBS), part I: Review of basic diagnostics and plasma-particle interactions: Still-challenging issues within the analytical plasma community. Appl. Spectrosc. 2010, 64, 335–366. [Google Scholar] [CrossRef] [PubMed] [Green Version]
  34. Jabbar, A.; Hou, Z.; Liu, J.; Ahmed, R.; Mahmood, S.; Wang, Z. Calibration-free analysis of immersed metal alloys using long-pulse-duration laser-induced breakdown spectroscopy. Spectrochim. Acta Part B At. Spectrosc. 2019, 157, 84–90. [Google Scholar] [CrossRef]
  35. Konjević, N.; Wiese, W.L. Experimental Stark widths and shifts for spectral lines of neutral and ionized atoms. J. Phys. Chem. Ref. Data 1990, 19, 1307–1385. [Google Scholar] [CrossRef]
  36. Shakeel, H.; Haq, S.U.; Abbas, Q.; Nadeem, A.; Palleschi, V. Quantitative analysis of Ge/Si alloys using double-pulse calibration-free laser-induced breakdown spectroscopy. Spectrochim. Acta Part B At. Spectrosc. 2018, 146, 101–105. [Google Scholar] [CrossRef]
  37. Valenzuela, A.; Munson, C.; Porwitzky, A.; Weidman, M.; Richardson, M. Comparison between geometrically focused pulses versus filaments in femtosecond laser ablation of steel and titanium alloys. Appl. Phys. B 2014, 116, 485–491. [Google Scholar] [CrossRef]
  38. Zhong, J.; Li, Y.; Lu, X.; Zhang, Y.; Bernhardt, J.; Liu, F.; Hao, Z.; Yu, Q.; Chen, M.; Yuan, X.; et al. Generation of single plasma channel in air. Acta Phys. Sin. 2007, 56, 7114–7119. [Google Scholar] [CrossRef]
Figure 1. Schematic diagram of the laser-induced breakdown spectroscopy.
Photonics 08 00536 g001
Figure 2. Copper spectra at d = −2, 0 and 2 mm (the pulse energy is 55 mJ).
Photonics 08 00536 g002
Figure 3. The plasma spectrum of the three Cu(I) lines at different d values (pulse energy is 55 mJ).
Photonics 08 00536 g003
Figure 4. Variation in line intensity with d at different pulse energies.
Photonics 08 00536 g004
Figure 5. Variation in SNR of Cu(I) at 578.21 nm with d at different pulse energies.
Photonics 08 00536 g005
Figure 6. Effect of pulse energies and d on the Cu plasma temperature (the error bar is derived from the ratio of line 521.82 nm to 510.55 nm, and the ratio of line 515.32 nm to 510.55nm).
Photonics 08 00536 g006
Figure 7. Effect of pulse energies and d on the electron density (the error bar is derived from the error of fitted Δλ).
Photonics 08 00536 g007
Figure 8. Variation in the electron density, plasma temperature and intensity of the spectral line at 521.82 nm with d.
Photonics 08 00536 g008
Table 1. Spectroscopic parameters of the Cu atomic lines.
WavelengthAki (s−1)gkTransition Levels (Up→Low)Ek (eV)Ei (eV)
510.55 nm0.2 × 10743d104p(2P3/2)→3d94s2(2D5/2)3.8171.389
515.32 nm6 × 10743d104d(2D3/2)→3d104p(2P1/2)6.1923.786
521.82 nm7.5 × 10763d104d(2D5/2)→3d104p(2P3/2)6.1933.817
Publisher’s Note: MDPI stays neutral with regard to jurisdictional claims in published maps and institutional affiliations.

