1. Introduction
Optical coherence tomography (OCT) is an interferometric imaging technique of scattering structure of optically turbid media, especially biological tissues. OCT is mostly used for non-invasive imaging of biological structures for clinical diagnostics. One of the widespread varieties of OCT is a spectral-domain type (SD-OCT), which is based on an optical spectrometer [
1].
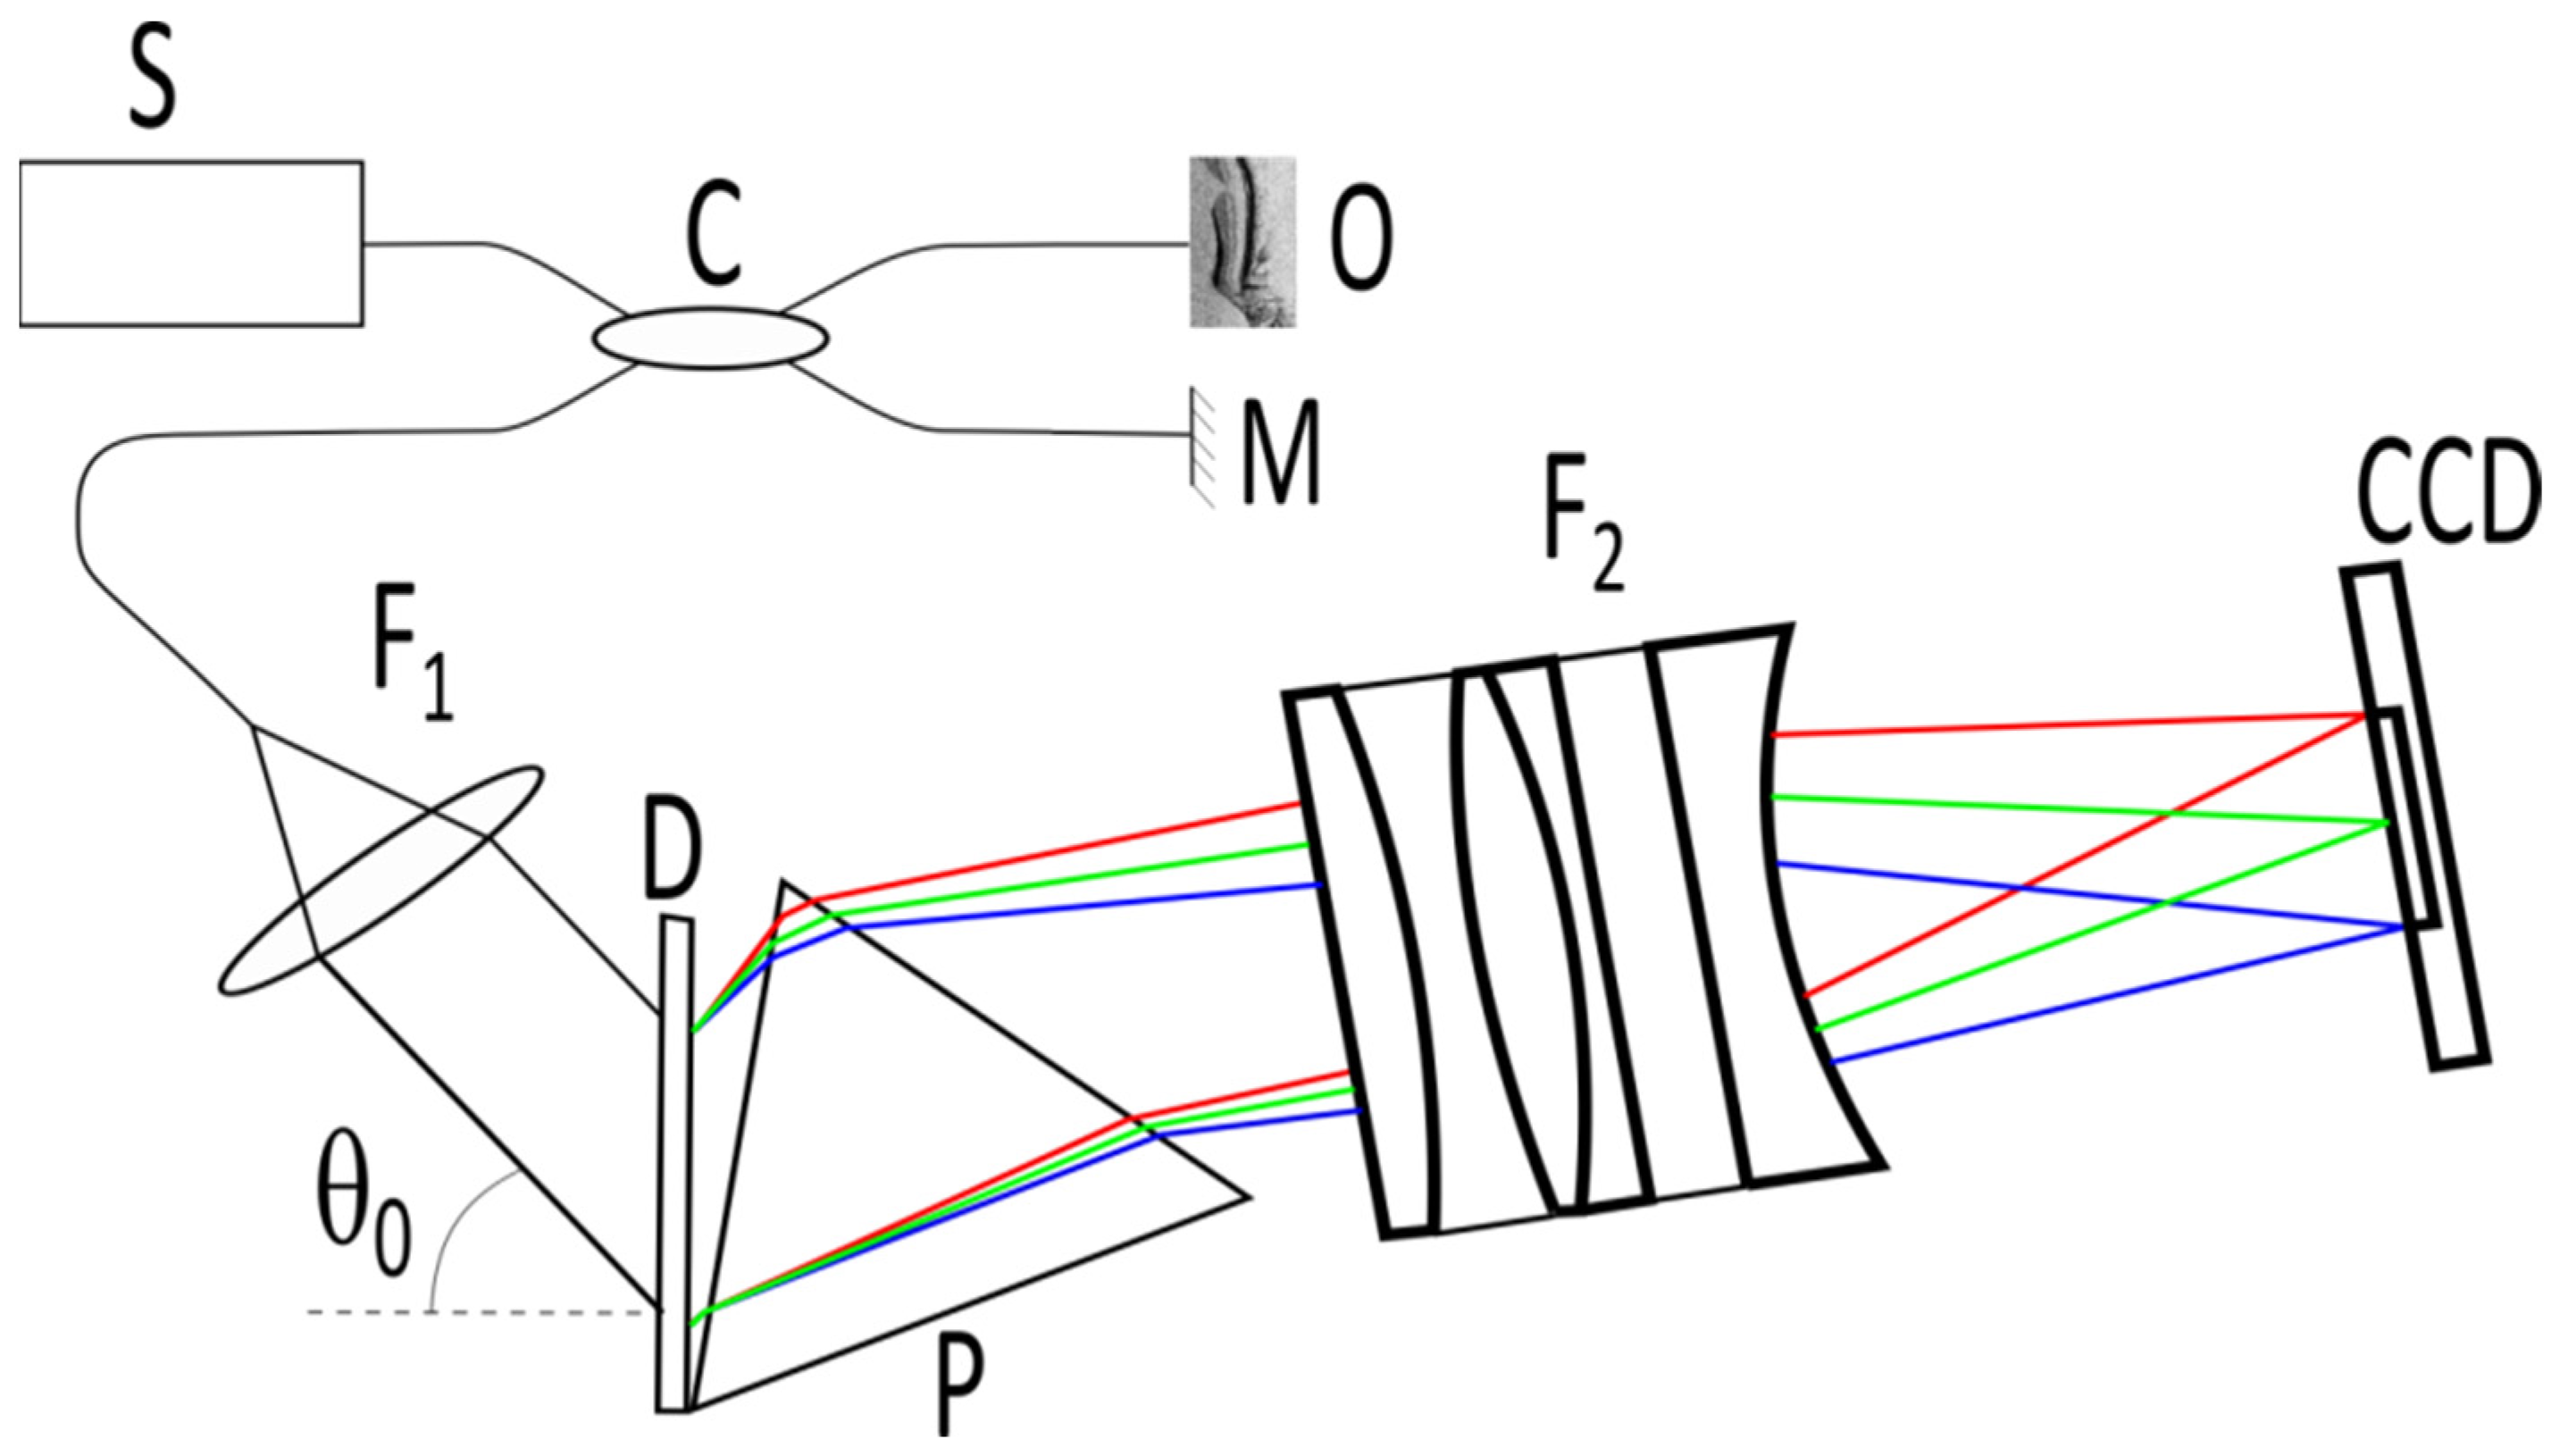
An OCT signal is formed by recording and further processing the interference of two light beams—a reference beam and a beam scattered by the object. Initial beams are formed from light source S using an optical splitter C (
Figure 1). The reference beam is formed upon reflection from the reference plane M, the scattered beam—as a result of the scattering of the probe beam on optical inhomogeneities of the medium under study O. The radiation scattered by the medium is directed back to the optical splitter, where it is added to the reference radiation and then sent to the recording system, which in spectral-domain OCT consists of a spectrometer built on a diffraction grating D and a matrix photodetector (commonly a linear CCD array). The interference of the reference and scattered light provides a modulation of the optical spectrum in k-space. Each spatial frequency of the modulation is associated with the in-depth position of the scatterer by the Fourier transform.
The use of spectral sampling of the OCT signal has both strengths (a significant increase in speed compared to correlation methods [
2]) and weaknesses, which consists of the appearance of additional unwanted image elements (autocorrelation and mirror artifacts [
3,
4,
5,
6]), a vulnerability in relation to the Doppler frequency shift arising from the probe-to-object relative movement while in vivo imaging [
7,
8], and a decrease in the level of useful signal with an increase in the interfering waves optical path difference [
9]. The latter manifests itself regardless of the features of radiation scattering in the object medium and the position of the focusing plane or the sharpness of the probing beam. This effect is known as sensitivity fall-off and is usually associated with finite sizes of both detecting pixels in the CCD array and point spread function (PSF) of the spectrometer focusing lens [
9,
10,
11,
12]. These factors decrease the amplitude of interference-caused spectrum modulation (i.e., OCT signal level) with an increase of modulation frequency corresponded to optical path length difference (i.e., the in-depth position of the observation point). Thus, the OCT signal becomes weaker in depth.
There have been several attempts to overcome the sensitivity fall-off influence. Here, we should note the development of the complex OCT approach [
3,
5,
13] and Talbot-fringes OCT [
14,
15]. The first technique introduces phase modulation between reference and probing waves for a series of consecutive A-scans, therefore, the OCT signal becomes sensitive to the sign of the path difference. It allows shifting zero-delay surface to some depth under the tissue surface, decreasing the signal level from the surface and preserving it at the said depth. Talbot-fringes OCT operates with two parallel-shifted beams in a spectrometer. This setup causes additional modulation along the spectrum image in a spectrometer (Talbot-fringes), therefore, the interference-caused modulation is heterodyned by the Talbot-fringes frequency. This approach allows decreasing interference-caused spectrum modulation frequency corresponded for deeper scatterers and, thus, increasing OCT signal level.
For qualitative estimation of sensitivity fall-off
FO, the following formula was proposed and used in OCT developments [
10,
12,
16]:
where
z is the imaging depth,
p is the width of a single CCD pixel,
R0 denotes the mutual linear dispersion in a spectrometer (spectral width in
k corresponding to 1 μm in CCD plane),
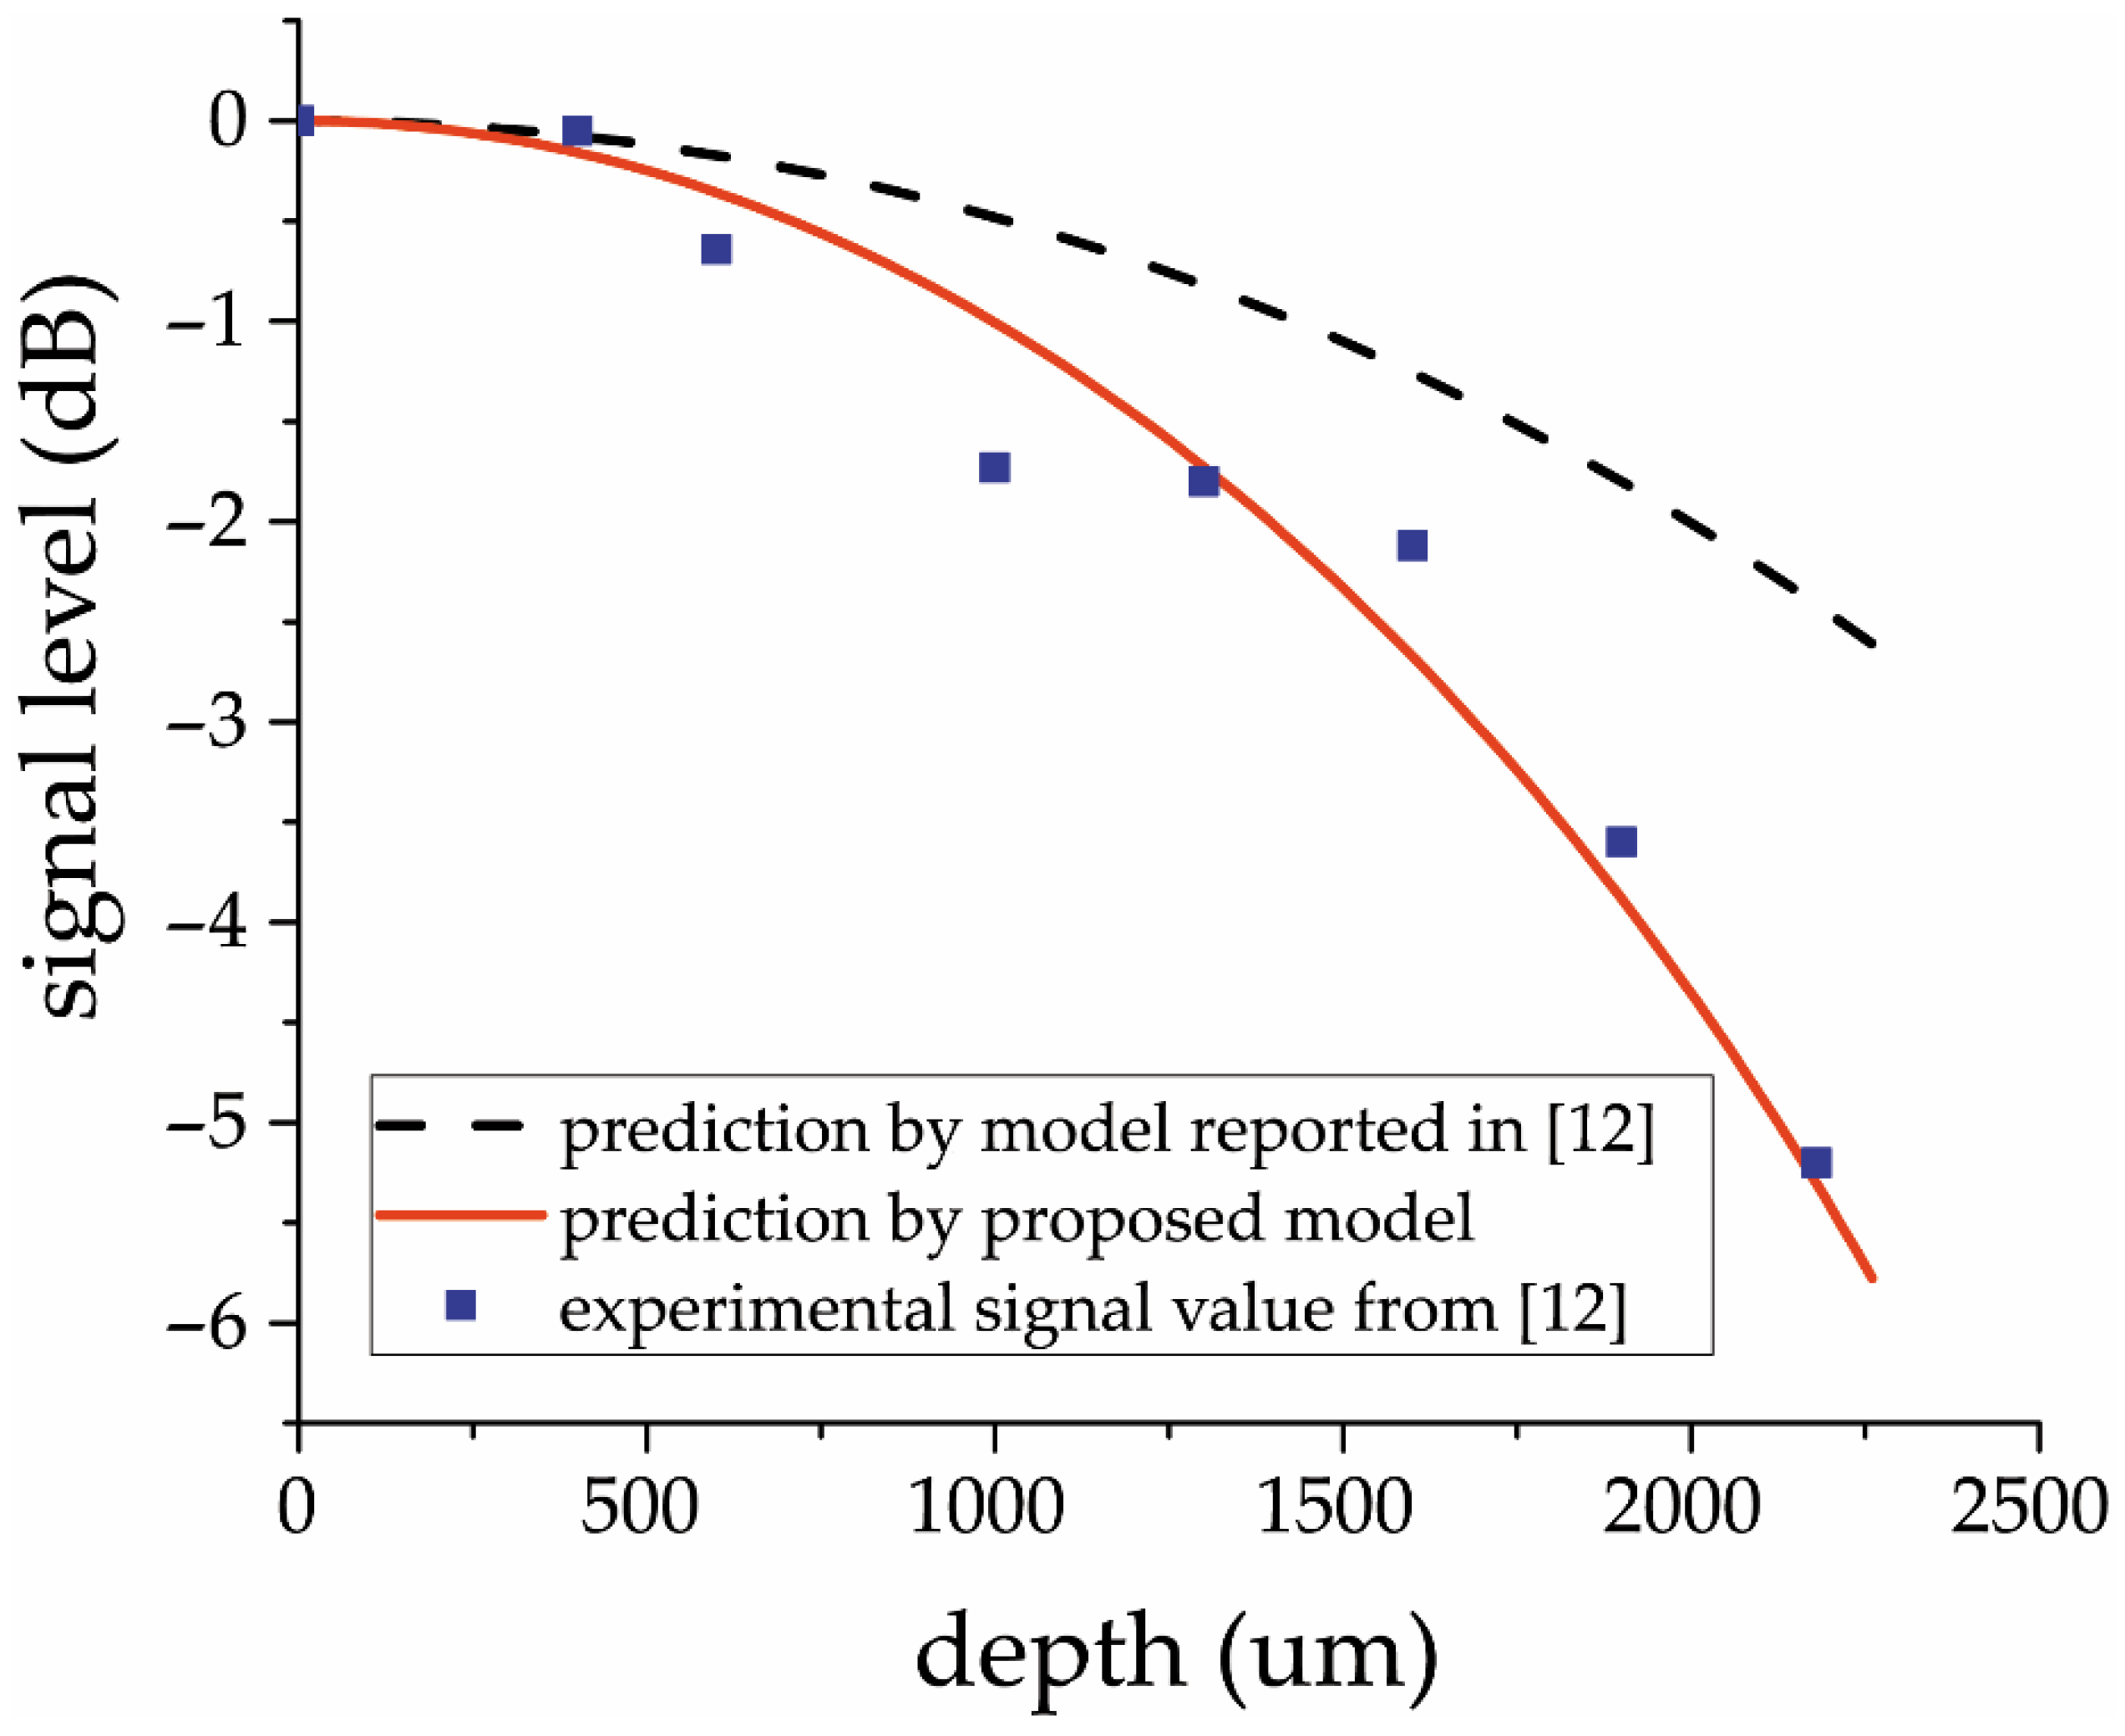
a is the optical beam width. Equation (1) claims to be a complete description of spectrometer-caused in-depth sensitivity fall-off in OCT images. However, experimental results [
12] show sensitivity fall-off to be significantly higher than predicted by Equation (1). It enforces developers to seek other possibilities and generate conclusions on used optics imperfection [
12]. The last does not seem quite realistic, especially since the calculation omitted an important element—the effect of the own resolution of the spectrometer’s dispersive element.
This study aims at formulating a refined description of an SD-OCT in-depth sensitivity, taking into account the effect of the resolution of the diffractive grating and combined dispersive element, comprising the grating and optical prism.
2. Materials and Methods
The optical intensity spectrum of the sum of two interfering waves with the delay of Δz is modulated in k-space by a sinus-like waveform with the frequency proportional to said Δz, and the amplitude is determined by the product of the wave intensities. The tissue under OCT imaging may be described as a set of scatterers characterized by some distribution in tissue space and scattering properties. Each scattered light portion contributes to the formation of the overall spectrum modulation. Hereinafter, we suppose that any autocorrelation artifacts [
5] are eliminated from the signal and we consider only those components resulting from interference between reference and backscattered waves. The localization of scatterers along the depth-axis (
z) and the value of backscattered light—so-called A-scan
FA(
z)—are reconstructed by Fourier transformation of optical intensity spectrum
S(
k) recorded in the spectrometer.
Equation (2) also describes the envelope of the value of the reconstructed signal from a single scatterer placed at different depths along the probing beam. This envelope describes sensitivity at each depth and could be found in Equation (2) by substituting
S(
k) with the shape of single resolved spectral component
fA(
k).
fA(
k) is determined by the convolution [
11,
17] of three functions recorded in
k-space:
where
PSF(
k) is a point spread function of focusing beam determined only by the focusing lens and beam diameter and converted in
k-space using the spectrometer dispersion formula;
SW(
k) is the
k-space-converted image of rectangular sensitivity shape of a single element of the CCD array;
DG(
k) is the diffractive grating resolution function. In contradistinction to previous models, we take into account the exact shape of
DG(
k). This function describes the angular dependence of light intensity for monochromatic components diffracting on the grating by converting into
k-space.
Since the envelope of the reconstructed signal
FE(
z) value represents a Fourier image of
fA(
k), it is the product of the three Fourier images of functions listed previously:
This allows for considering their impacts separately.
2.1. Resolution of Diffractive Grating
Mostly, the diffractive grating resolution is estimated by the Rayleigh criterion and qualitatively is set as the ratio of the wavelength to the number of illuminated grating lines. For the OCT spectrometer description, it is common to ensure formal compliance of desirable spectral resolution to beam size on a grating. However, this approach has some weaknesses. First, the Rayleigh criterion is formulated for beams with a flat intensity shape and all scratches are to be illuminated by equal light. In real systems, the analyzed beam has a Gaussian shape, so peripheral scratches lead to low impact, in comparison to central ones. Second, the criterion expresses distinguishing between two adjacent peaks by eye, that is, the presence of an intensity dip between them at a magnitude of 80% of the peak value. This leads to a 5-fold decrease in spectrum modulation depth or, equivalently, a 5-fold decrease in the reconstructed signal value at the edge of the range.
For the OCT spectrometer, the most commonly used is the Bragg setup, in which the diffraction angle for the central component of the spectrum θ(
k0) is set equal to the angle of incidence of the optical beam light θ
0 on the grating with lines period
d:This setup provides polarization independence and optimal diffraction efficacy to (−1) order if volume phase holographic grating (WasatchPhotonics) or other high density and precision gratings (LightSmyth product line from II-IV Max Levy, FSTG-NIR line from Ibsen Photonics) are used and allows for significant simplifying of analytical calculations. For the Bragg setup of the spectrometer, the envelope component in object depth-space
is described by a Gaussian shape:
where
and
σ0 denotes the half-width of the optical beam after the spectrometer collimator F
1 and is determined by its focal length and fiber numerical aperture.
2.2. Dispersion in the Spectrometer
As mentioned above,
PSF(
k) and
SW(
k) initially are functions in image space that are converted in
k-space using the spectrometer dispersion formula. Let
R0 be a reciprocal linear dispersion, indicating the width of the spectrum (in wavenumber) spread over 1 μm at the focal plane [
12]. In general, the dependence between image space coordinates and wavenumbers is nonlinear and may be described by Taylor expansion as:
However, for most spectrometers, analyzing the broadband light with a spectrum width up to 15% of the central frequency, the impact of the nonlinear component is less than 3–5% from the overall function range [
18], even in the absence of a compensator prism that reduces this contribution to a value below tenths and hundredths of a percent [
19,
20]; therefore, the last term in Equation (8) may be omitted. For the Bragg configuration, the linear dispersion coefficient is found as:
where
F denotes the focal length of focusing lens F
2.
In contrast to swept-source OCT, where the equidistance of the received spectral components can be ensured through the implementation of frequency-dependent digitization [
21,
22,
23,
24], in the spectrometer-based OCT setup, to ensure equidistant optical frequency recording of spectral components, additional optical correctors may be used [
12,
18,
19,
20]. These provide some features to the device setup; firstly, a decrease in the number of calculations [
20], however, this causes a significant (about 30%) decrease in the dispersion value 1/
R0 [
18,
19]. This decrease may be taken into account by the correction factor η defined for every spectrometer setup numerically. Taking into account this coefficient, the linear dispersion can be rewritten as the following:
2.3. Point-Spread Function in k-Space
The
PSF(
k) describes the optical limitations of focusing lens F
2. Ideally, the spot in the focal plane is described by Gaussian function with transversal size determined by focal length
F, wavelength λ
0, and collimated beam size
σ0, much smaller than lens aperture:
The corresponding envelope component in object depth-space
is also described by Gaussian shape
where γ is found taking into account Equations (8) and (10) for the Bragg setup:
Since both components
and
are Gaussian-shape functions, their joint impact may be formulated as a single Gaussian function:
where
or
It is important to note that since the component has no dependence on the dispersion correction factor η, the influence of the corrector on the envelope cannot be taken into account by simply decreasing the dispersion value 1/R0, or changing the focal length of focusing lens F2. Thus, a spectrometer built using a prism-corrector has a fundamentally different description than a conventional spectrometer based on a single diffraction grating.
2.4. Spectrum Sampling Window
The third component in Equation (4)
is determined by the finite size of a single element of the CCD array. Its conversion to
k-space is produced using the same linear dispersion coefficient (Equation (10)). If the pixel size is denoted as
p (following [
12,
16]), then the envelope component is formulated as:
2.5. Signal Envelope
In accordance with Equation (4), the total expression for signal envelope in spectrometer-based OCT is given by:
In this case, the scales of the sinc and exponential components have significantly different dependencies from η, so the corrector prism influence cannot be accounted for changing the dispersion coefficient value.
2.6. Experimental Verification
The in-house SD-OCT device used for the experimental validation operates with a light source—λ
0 = 1055 nm. The spectrometer is based on grating with lines density 1/
d = 1500 L/mm (T-1500-930 LightSmyth product line from II-IV Max Levy) and an equidistance correction 63.2 degrees prism made of K9 glass (Nanyang Jingliang optical technology corp, Nanyang city, China). The focal length of the focusing lens F
2 is 86 mm. The CCD array used for spectrum registration has a pixel width of 25 μm (Collins Aerospace SU512LD). The received spectrum width is 81 nm (corrector prism provides dispersion decreasing factor η = 0.74). The device operates under homemade software [
25]—its electrical circuits are described in detail in [
26].
The OCT signal was recorded from 4% reflecting surface placed into an optical beam with a Rayleigh length of 30 cm to overcome the influence of focusing nonuniformity during sample movement along the beam axis. This design—of the object simulation—is very important to exclude other factors causing in-depth sensitivity fall-off, such as focusing sharpness and the effect of scattering in the medium under study. These factors have greater variability depending on certain OCT setups and object properties and their consideration is beyond the scope of this article.
The envelope was calculated from OCT data recorded for several object positions with 150–300 μm gaps over 1.75 mm depth. Thus 15–20 object surface positions were recorded for a single envelope finding.
To highlight the influence of the frequency transfer characteristic of an electrical circuit on a signal envelope we increased the data rate 4-fold from 5000 spectra per second, recommended by the CCD array (SU512LD-1.7T1-0500) producer, to 20,000 spectra per second. This was achieved by increasing the main clock frequency, preserving both light power to be analyzed and its integration time to overcome changes to the signal-to-noise ratio [
27].
Image reconstruction and analysis were carried out using in-house code on Python 4.2.
4. Discussion
The proposed mathematical model of the OCT spectrometer takes into account two aspects omitted by earlier investigations. First, we considered the intrinsic spectral resolution of the dispersive element. A careful analysis shows that taking into account the factor of angular spectral resolution in the diffraction of light by a grating leads to a significant increase in the specific gravity of the exponential part in expression (1) with respect to sinc. However, this correction may be taken into consideration by correcting the effective beam width in this expression. Second, the influence of additional components—equidistance correcting prism—on the signal sensitivity fall-off in OCT was examined. It was shown that a spectrometer built using a prism-corrector had a fundamentally different description than a conventional spectrometer based on a single diffraction grating. In this case, the scales of the sinc and exponential components have significantly different dependencies from the dispersion decreasing factor η; therefore, the influence of the corrector prism cannot be accounted for as changing the dispersion coefficient value. In addition, it cannot be compensated by the corresponding increase in the focal length of the focusing lens in the spectrometer.
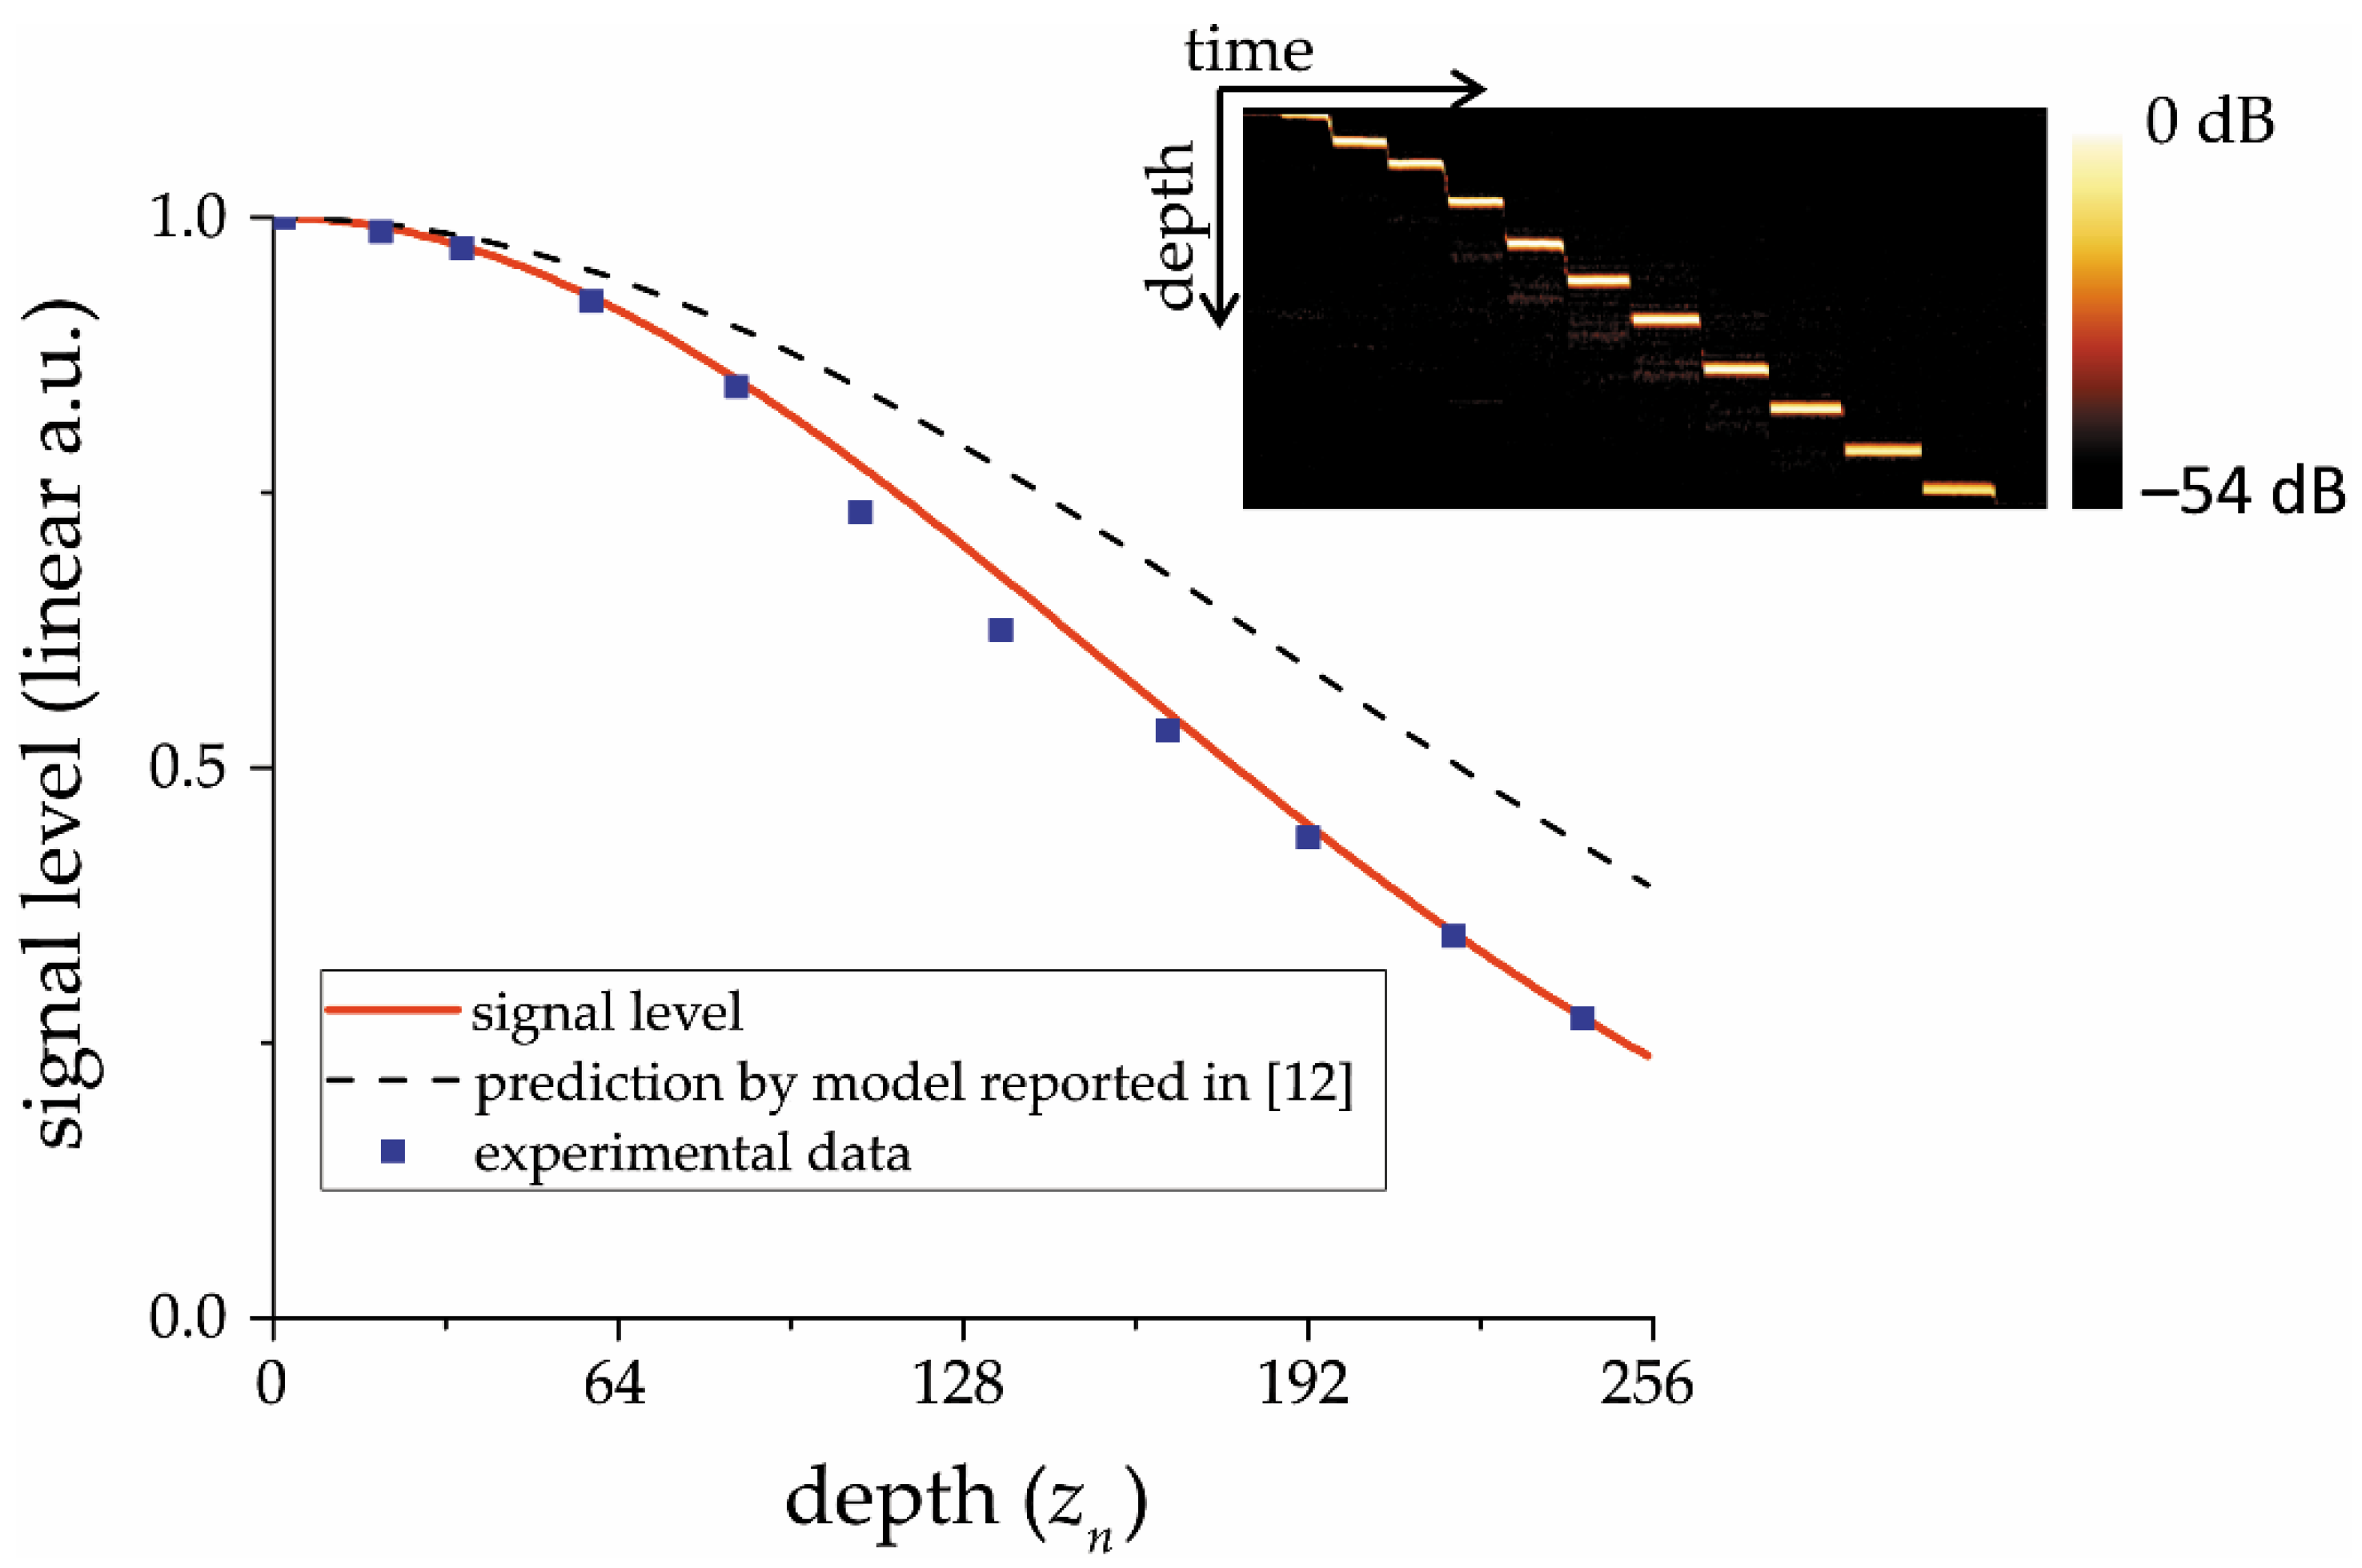
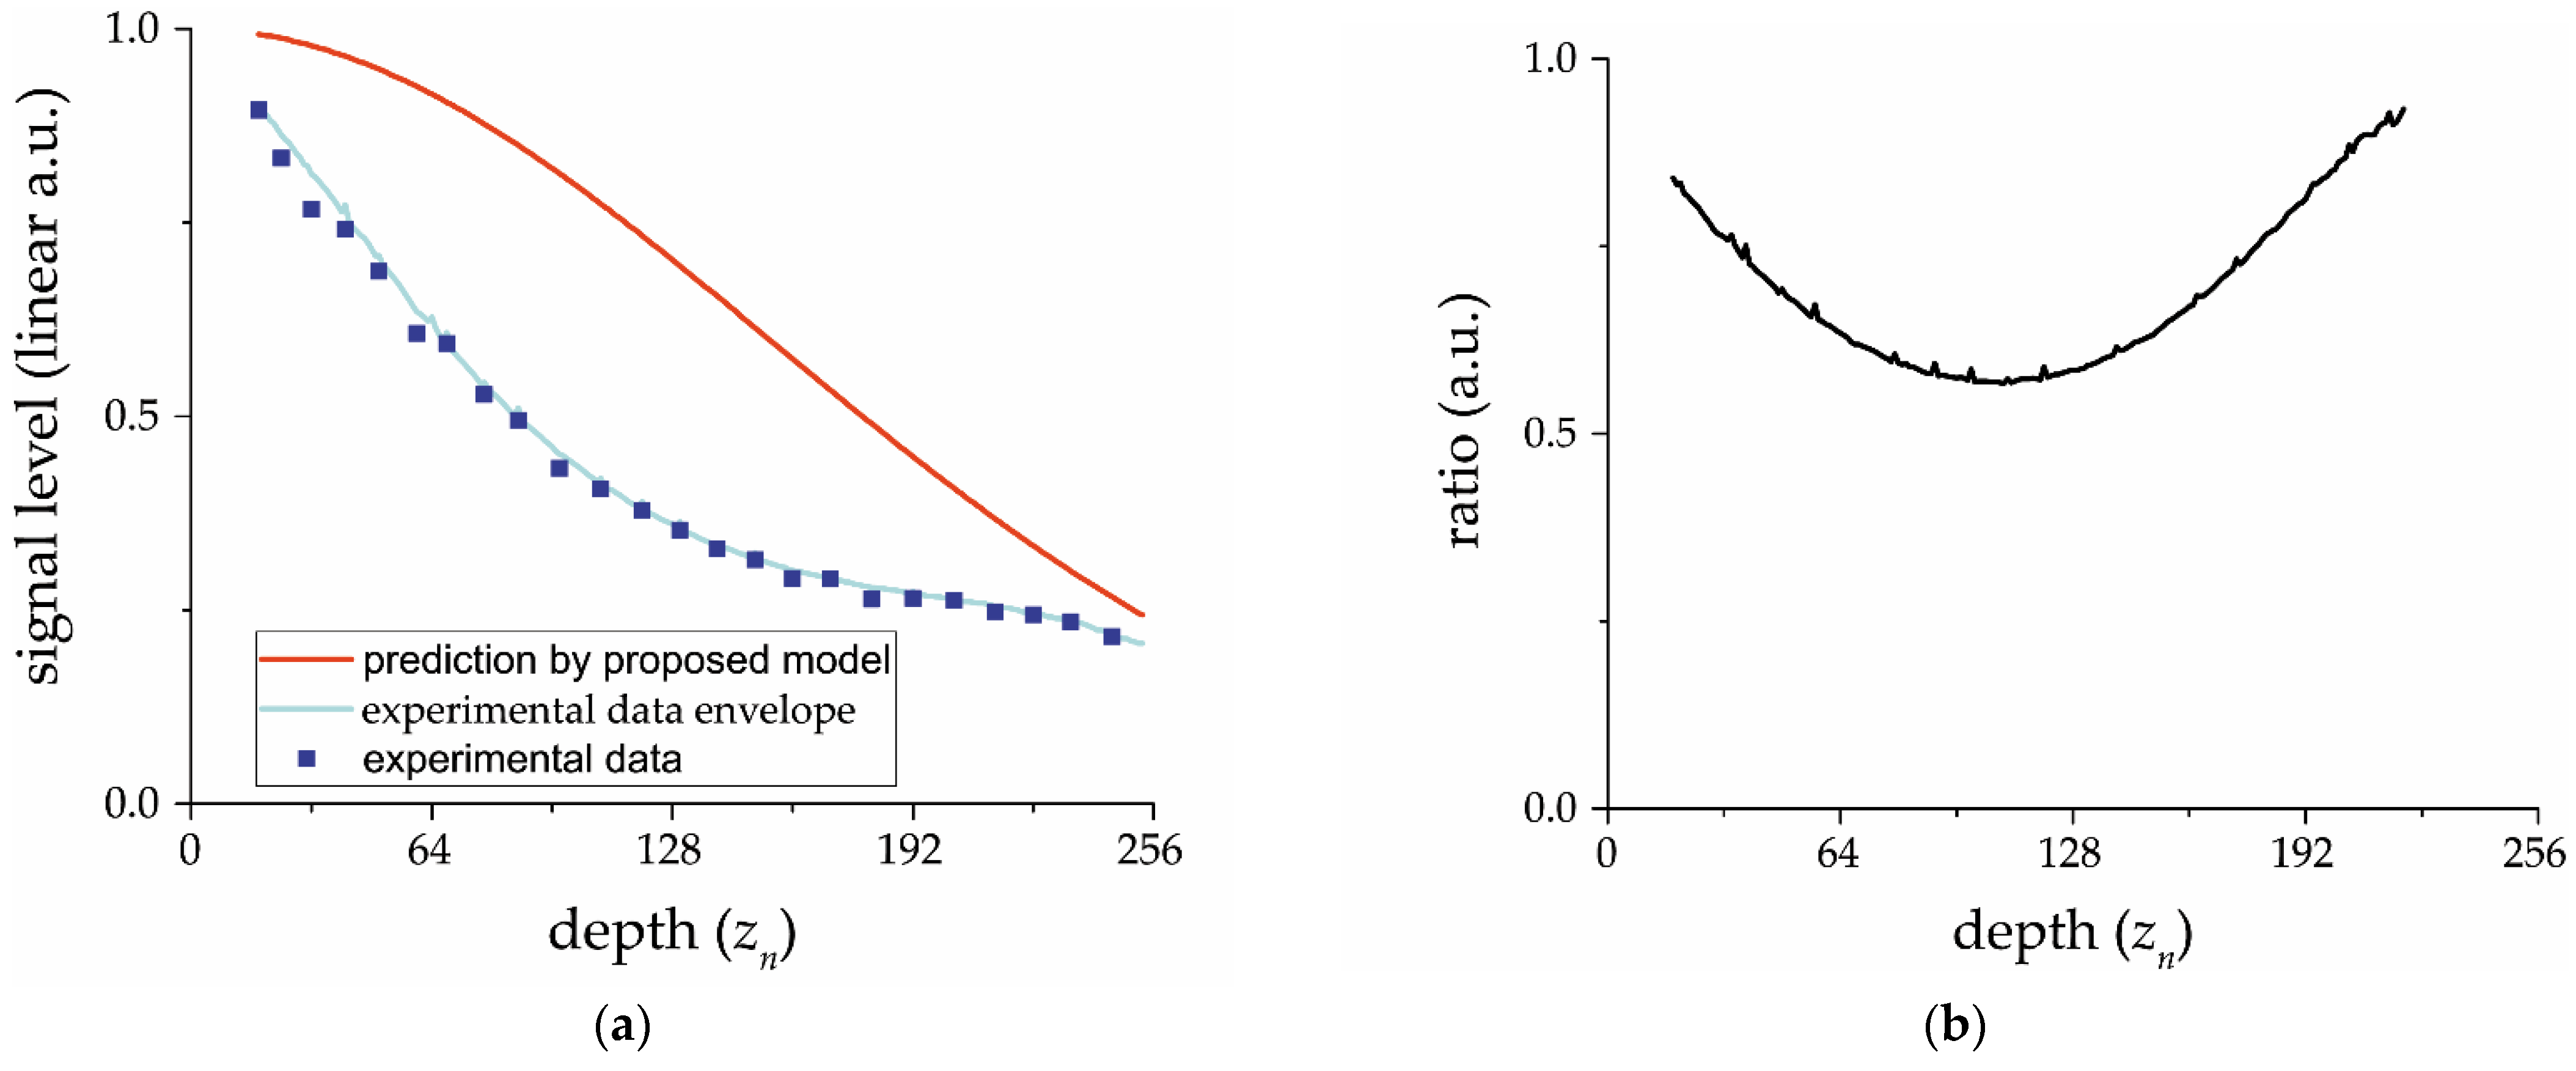
A closer look at the experimental data obtained in the validation experiment (
Figure 2) reveals a slight deviation of the experimental data from the expected level in the central part of the image. This deviation may be insignificant, but it is a result of a four-factor decreasing signal level in spectrometer-based OCT. This factor is concerned with a frequency transfer characteristic of an electrical circuit between the CCD element and analog-to-digital converter, and the higher the electrical circuit time constant, the higher the deviation. This hypothesis was confirmed by the subsequent experiment, which consists of a four-fold increase in the carrier frequency of the radio signal coming from the CCD to the ADC. The reconstructed OCT data electrical circuit frequency characteristic profile is presented in
Figure 3b. Its shape is symmetrical around the middle depth value, which also confirms the radio-technical nature of the observed signal deviation since the CCD element used in the setup has two separate output channels—one for odd and one for even pixels [
28]. The researcher must be aware of the absence of the electrical circuit influence or consider it—especially when calculating the coefficients characterizing in depth the rate of attenuation of the OCT signal, depending on the type of tissue under study. This is important, because with such a substantial non-uniformity of the envelope, as shown in
Figure 3b, the backscattering coefficient of biological tissue retrieved from OCT images can become dependent on the position of the analyzed area along the axis of the probing beam. The latter can be a potential source of diagnostic errors.
5. Conclusions
The mathematical model of the OCT spectrometer should take into account—in addition to the finite sizes of both detecting pixels in the CCD array and PSF of the focusing lens—the influence of the intrinsic spectral resolution of the dispersion element.
If the correction prism is used to minimize the inequidistance of recording spectral components in k-space, its influence on the spectrometer dispersion cannot be compensated by the use of a focusing lens with a corrected focal length, or taken into account by correcting only the dispersion formula.
The proposed improved spectrometer analytical model passed validation using experimental data obtained both from other studies and our own experiment. The validation demonstrates a very good correspondence between the experimental data and model predictions.
The influence of the frequency transfer characteristic of an electrical circuit between the CCD element and analog-to-digital converter was also detected and shown to be significant in some cases. Therefore, researchers must be aware of the absence of this influence, or consider it, especially when calculating the coefficients characterizing in depth the rate of attenuation of the OCT signal, depending on the type of tissue under study.


