Remote Laser Induced Fluorescence of Soils and Rocks

 ,
,  , , and
Abstract
:1. Introduction
2. Experiment Setup
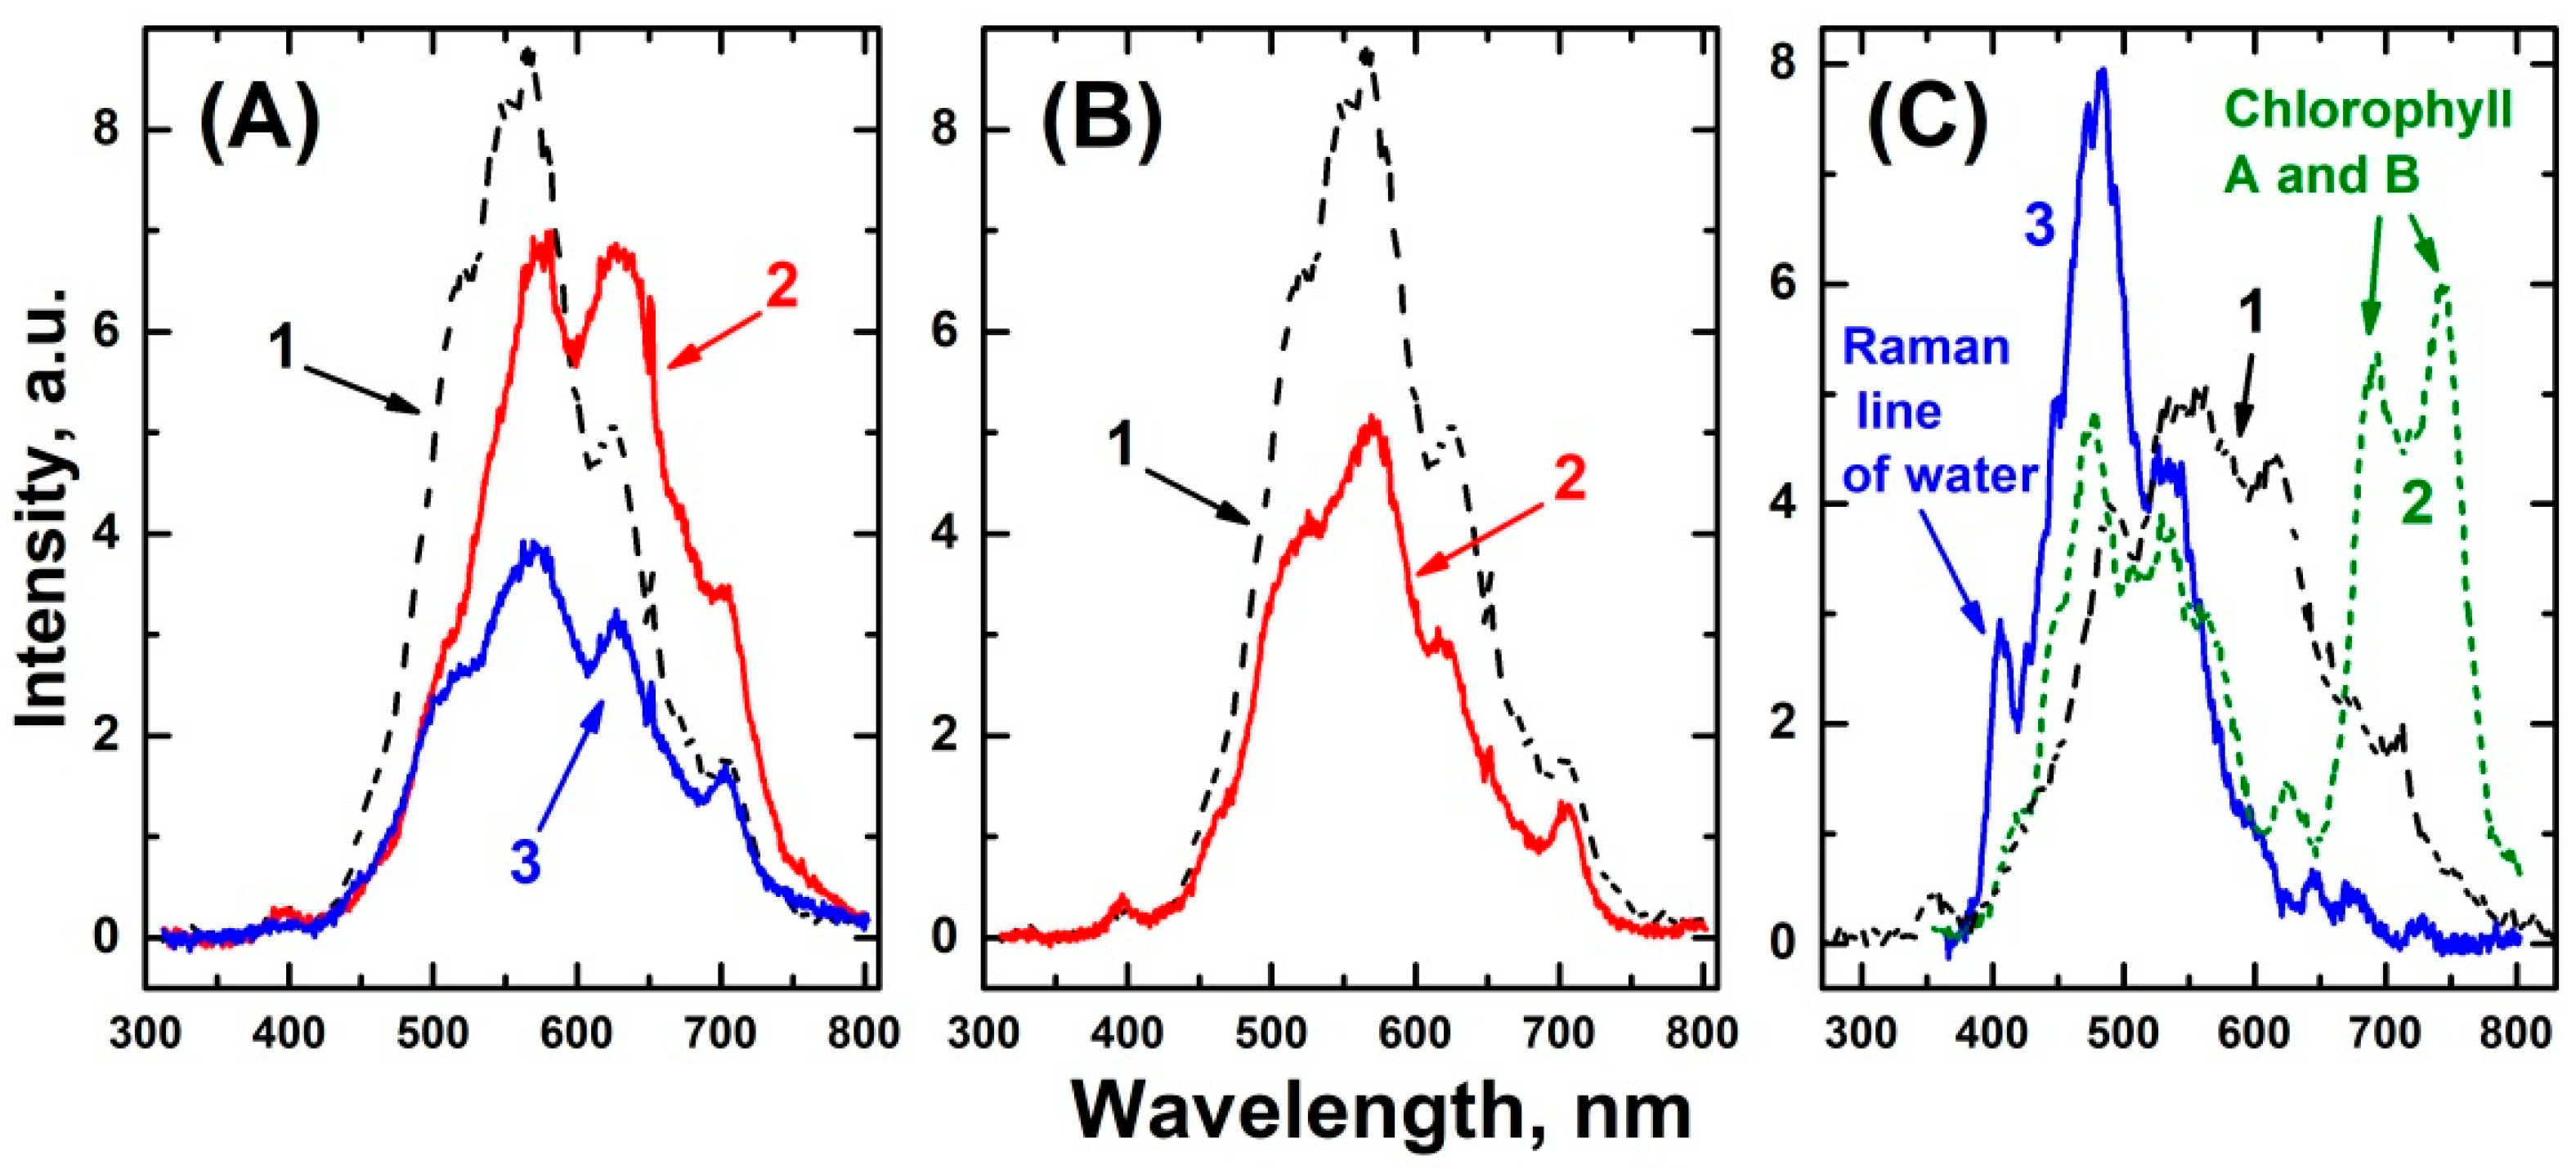
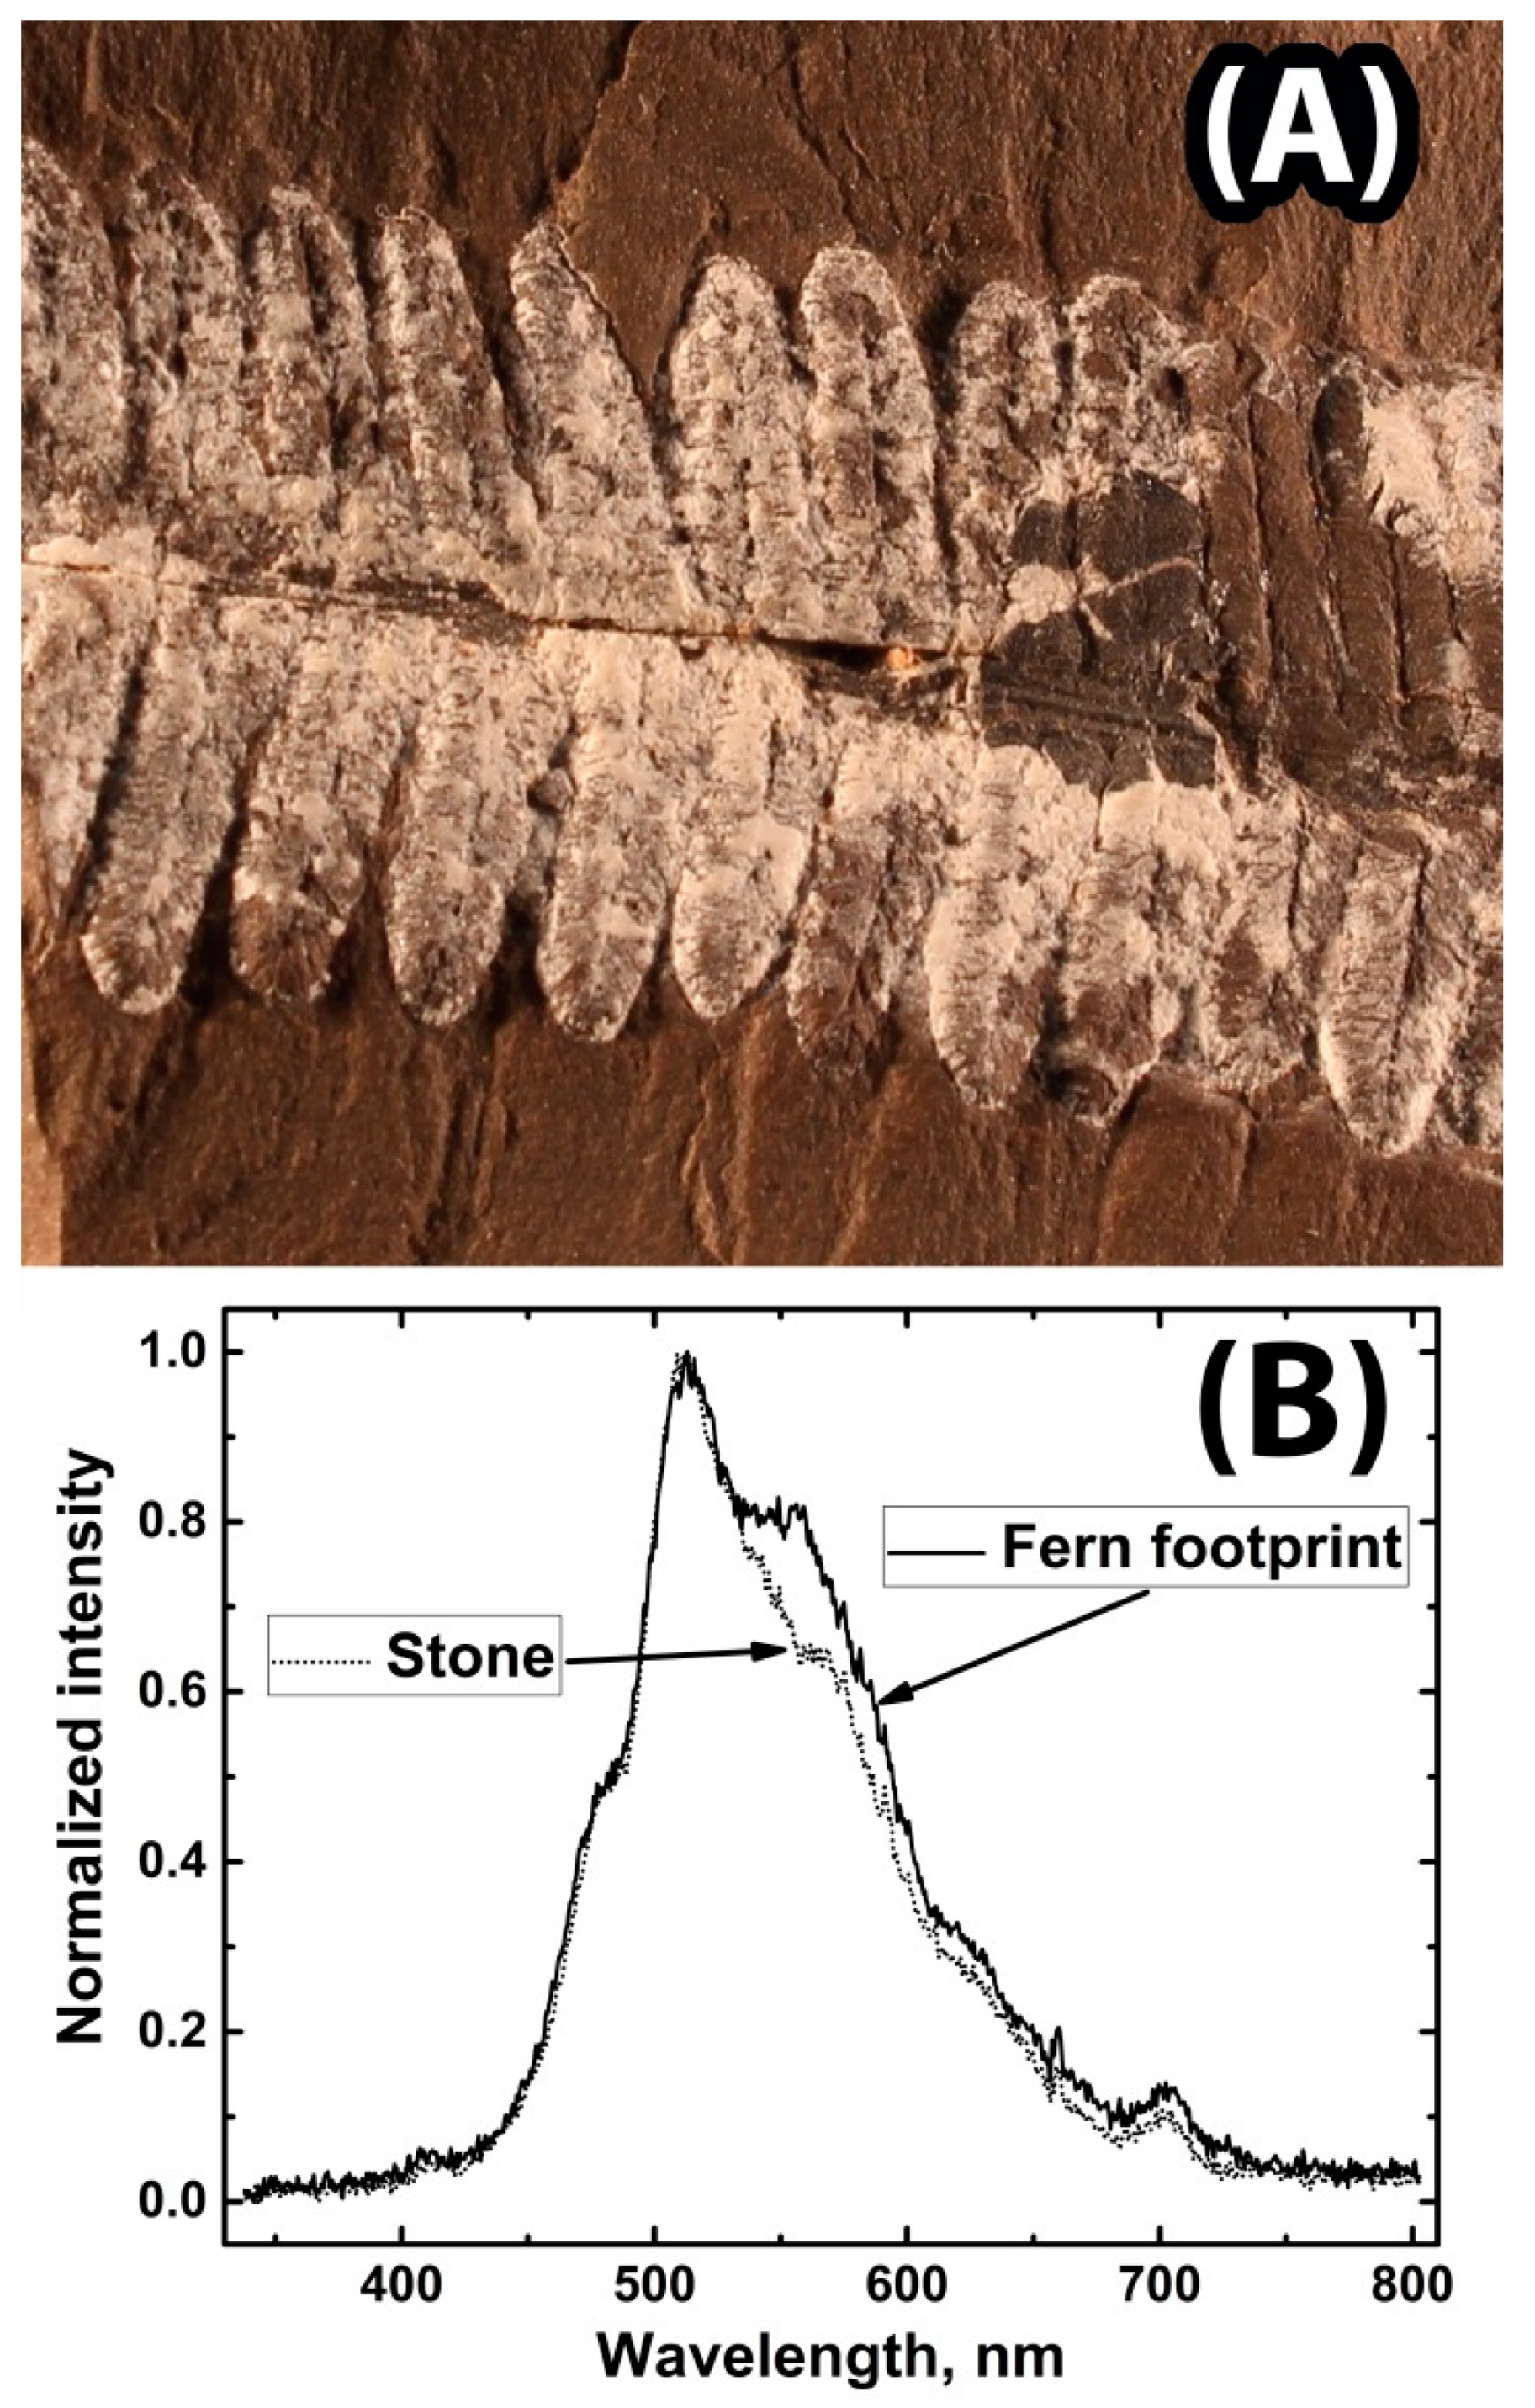
3. Results
4. Conclusions
Author Contributions
Funding
Institutional Review Board Statement
Informed Consent Statement
Data Availability Statement
Conflicts of Interest
References
- Götze, C.; Beyer, F.; Gläßer, C. Pioneer vegetation as an indicator of the geochemical parameters in abandoned mine sites using hyperspectral airborne data. Environ. Earth Sci. 2016, 75, 613. [Google Scholar] [CrossRef]
- Lassalle, G.; Fabre, S.; Credoz, A.; Dubucq, D.; Elger, A. Monitoring oil contamination in vegetated areas with optical remote sensing: A comprehensive review. J. Hazard. Mater. 2020, 393, 122427. [Google Scholar] [CrossRef] [PubMed]
- Measures, R.M. Laser Remote Sensing: Fundamentals and Applications; John Wiley & Sons, Ltd.: New York, NY, USA, 1984; ISBN 0894646192. [Google Scholar]
- Bunkin, F.A.; Voliak, K. Laser Remote Sensing of the Ocean: Methods and Applications; John Wiley & Sons, Ltd.: New York, NY, USA, 2001; ISBN 0471389277. [Google Scholar]
- Pershin, S.M.; Grishin, M.Y.; Zavozin, V.A.; Lednev, V.N.; Lukyanchenko, V.A.; Makarov, V.S. Aerosol layers sensing by an eye-safe lidar near the Elbrus summit. Laser Phys. Lett. 2020, 17, 26003. [Google Scholar] [CrossRef]
- Bukin, O.; Proschenko, D.; Alexey, C.; Korovetskiy, D.; Bukin, I.; Yurchik, V.; Sokolova, I.; Nadezhkin, A. New Solutions of Laser-Induced Fluorescence for Oil Pollution Monitoring at Sea. Photonics 2020, 7, 36. [Google Scholar] [CrossRef]
- Bunkin, A.F.; Davydov, M.A.; Rezov, A.V.; Surovegin, A.L.; Tsipenyuk, D.Y. Helicopter-based LIDAR complex for emission and fluorescence remote sensing of terrain surface. Laser Phys. 1994, 4, 1198–1201. [Google Scholar]
- Angelini, F.; Colao, F. Optimization of laser wavelength, power and pulse duration for eye-safe Raman spectroscopy. J. Eur. Opt. Soc. Publ. 2019, 15, 1–8. [Google Scholar] [CrossRef] [Green Version]
- Churnside, J.H. Review of profiling oceanographic lidar. Opt. Eng. 2014, 53, 51405. [Google Scholar] [CrossRef] [Green Version]
- Barbini, R.; Colao, F.; Fantoni, R.; Palucci, A.; Ribezzo, S. Differential lidar fluorosensor system used for phytoplankton bloom and seawater quality monitoring in Antarctica. Int. J. Remote Sens. 2001, 22, 369–384. [Google Scholar] [CrossRef]
- Churnside, J.H.; Marchbanks, R.D.; Lee, J.H.; Shaw, J.A.; Weidemann, A.; Donaghay, P.L. Airborne lidar detection and characterization of internal waves in a shallow fjord. J. Appl. Remote Sens. 2012, 6, 63611. [Google Scholar] [CrossRef] [Green Version]
- Alimov, V.S.; Kosachev, V.D.; Danilov, B.O.; Zhevlakov, P.A.; Kashcheev, V.S.; Mak, A.A.; Petrov, B.S.; Ustyugov, I.V. Aviation Raman lidar with ultraspectral resolution. J. Opt. Technol. 2009, 76, 199–207. [Google Scholar] [CrossRef]
- Raimondi, V.; Palombi, L.; Lognoli, D.; Masini, A.; Simeone, E. Experimental tests and radiometric calculations for the feasibility of fluorescence LIDAR-based discrimination of oil spills from UAV. Int. J. Appl. Earth Obs. Geoinf. 2017, 61, 46–54. [Google Scholar] [CrossRef]
- Babichenko, S. Laser remote sensing of the European marine environment: LIF technology and applications. In Remote Sensing of the European Seas; Springer: Dordrecht, The Netherlands, 2008; pp. 189–204. [Google Scholar]
- Richardson, S.D. Water analysis: Emerging contaminants and current issues. Anal. Chem. 2009, 81, 4645–4677. [Google Scholar] [CrossRef]
- Brown, C.E.; Fingas, M.F. Review of the development of laser fluorosensors for oil spill application. Mar. Pollut. Bull. 2003, 47, 477–484. [Google Scholar] [CrossRef]
- Babichenko, S.; Poryvkina, L.; Rebane, O.; Sobolev, I. Compact HLIF LiDAR for marine applications. Int. J. Remote Sens. 2016, 37, 3924–3937. [Google Scholar] [CrossRef] [Green Version]
- Fantoni, R.; Almaviva, S.; Caneve, L.; Colao, F.; De Collibus, M.F.; De Dominicis, L.; Francucci, M.; Guarneri, M.; Lazic, V.; Palucci, A.; et al. In situ and remote laser diagnostics for material characterization from plasma facing components to Cultural Heritage surfaces. J. Instrum. 2019, 14, C07004. [Google Scholar] [CrossRef]
- Gholizadeh, A.; Kopačková, V. Detecting vegetation stress as a soil contamination proxy: A review of optical proximal and remote sensing techniques. Int. J. Environ. Sci. Technol. 2019, 16, 2511–2524. [Google Scholar] [CrossRef]
- Kuenzer, C.; Ottinger, M.; Wegmann, M.; Guo, H.; Wang, C.; Zhang, J.; Dech, S.; Wikelski, M. Earth observation satellite sensors for biodiversity monitoring: Potentials and bottlenecks. Int. J. Remote Sens. 2014, 35, 6599–6647. [Google Scholar] [CrossRef] [Green Version]
- Pause, M.; Schweitzer, C.; Rosenthal, M.; Keuck, V.; Bumberger, J.; Dietrich, P.; Heurich, M.; Jung, A.; Lausch, A. In situ/remote sensing integration to assess forest health—A review. Remote Sens. 2016, 8, 471. [Google Scholar] [CrossRef] [Green Version]
- Kolesnikov, M.P.; Egorov, I.A. Porphyrins and phycobilins in precambrian rocks. Orig. life Evol. Biosph. 1977, 8, 383–390. [Google Scholar] [CrossRef]
- Kolesnikov, M.P. Molecular-Weight Distribution of Humic Acids, According To Gel Chromatography on Sephadexes. Sov. SOIL Sci. 1978, 10, 174–181. [Google Scholar]
- Kolesnikov, M.P.; Egorov, I.A. Linear Tetrapyrroles as Biomarkers in Paleo-Biochemical Investigations. J. Inf. Technol. Constr. 1977, 233, 970–973. [Google Scholar]
- Kolesnikov, M.P.; Egorov, I.A. Chlorophyll Derivatives in Recent Soils In Connection With Problem of Chemical Evolution And Origin Of Life On Earth. Dokl. Akad. Nauk SSSR 1977, 235, 228–231. [Google Scholar]
- Lee, J.K.; Park, Y.; Bunkin, A.; Nunes, R.; Pershin, S.; Voliak, K. Helicopter-based lidar system for monitoring the upper ocean and terrain surface. Appl. Opt. 2002, 41, 401–406. [Google Scholar] [CrossRef] [PubMed]
- Pan, Y.-L. Detection and characterization of biological and other organic-carbon aerosol particles in atmosphere using fluorescence. J. Quant. Spectrosc. Radiat. Transf. 2015, 150, 12–35. [Google Scholar] [CrossRef] [Green Version]
- Kolesnikov, M.P. Flavonoids and Perylene in Soils. Eurasian Soil Sci. 1992, 24, 38–46. [Google Scholar]
- Kolesnikov, M.P.; Egorov, I.A. Metalloporphyrins in The Precambrian Deposits As Probable Evidences Of The Ancient Photosynthesis. Dokl. Akad. Nauk SSSR 1979, 244, 470–473. [Google Scholar]
- Capps, R.N.; Vala, M. Luminescence studies of quinizarin and daunorubicin. Photochem. Photobiol. 1981, 33, 673–682. [Google Scholar] [CrossRef]
- Burikov, S.A.; Klimov, D.V.; Litvinov, P.N.; Maslov, D.V.; Fadeev, V.V. Shore-based lidar for monitoring coastal sea water areas. Quantum Electron. 2001, 31, 745. [Google Scholar] [CrossRef]
- Barbini, R.; Colao, F.; Fantoni, R.; Fiorani, L.; Palucci, A.; Artamonov, E.S.; Galli, M. Remotely sensed primary production in the western Ross Sea: Results of in situ tuned models. Antarct. Sci. 2003, 15, 77–84. [Google Scholar] [CrossRef]
- Maurice, S.; Wiens, R.C.; Bernardi, P.; Caïs, P.; Robinson, S.; Nelson, T.; Gasnault, O.; Reess, J.-M.; Deleuze, M.; Rull, F.; et al. The SuperCam Instrument Suite on the Mars 2020 Rover: Science Objectives and Mast-Unit Description. Space Sci. Rev. 2021, 217, 47. [Google Scholar] [CrossRef]
- Sandford, M.W.; Misra, A.K.; Acosta-Maeda, T.E.; Sharma, S.K.; Porter, J.N.; Egan, M.J.; Abedin, M.N. Detecting Minerals and Organics Relevant to Planetary Exploration Using a Compact Portable Remote Raman System at 122 Meters. Appl. Spectrosc. 2021, 75, 299–306. [Google Scholar] [CrossRef]
- Nurul Abedin, M.; Bradley, A.T.; Ismail, S.; Sharma, S.K.; Sandford, S.P. Compact remote multisensing instrument for planetary surfaces and atmospheres characterization. Appl. Opt. 2013, 52, 3116–3126. [Google Scholar] [CrossRef]
- Abedin, M.N.; Bradley, A.T.; Sharma, S.K.; Misra, A.K.; Lucey, P.G.; McKay, C.P.; Ismail, S.; Sandford, S.P. Mineralogy and astrobiology detection using laser remote sensing instrument. Appl. Opt. 2015, 54, 7598–7611. [Google Scholar] [CrossRef] [PubMed]
- Miano, T.M.; Martin, J.P.; Sposito, G. Flourescence spectroscopy of humic substances. Soil Sci. Soc. Am. J. 1988, 52, 1016–1019. [Google Scholar] [CrossRef]
- Aiken, G. Fluorescence and dissolved organic matter: A chemist’s perspective. In Aquatic Organic Matter Fluorescence; Cambridge University Press: Cambridge, UK, 2014; pp. 35–75. [Google Scholar]
- Enev, V.; Pospíšilová, L.; Klučáková, M.; Liptaj, T.; Doskočil, L. Spectral characterization of selected humic substances. Soil Water Res. 2014, 9, 9–17. [Google Scholar] [CrossRef] [Green Version]
- Miano, T.; Sposito, G.; Martin, J.P. Fluorescence spectroscopy of model humic acid-type polymers. Geoderma 1990, 47, 349–359. [Google Scholar] [CrossRef]
- Khodorenko, N.D.; Volkova, T.I.; Zvalinskii, V.I.; Tishchenko, P.Y. Extraction kinetics and quantitative analysis of bottom sediments for humic substances. Geochem. Int. 2012, 50, 385. [Google Scholar] [CrossRef]
- Oesterhelt, D. The Biology of Photoreception; Cosens, D.J., Vince-Price, D., Eds.; Cambridge University Press: New York, NY, USA, 1983; pp. 207–222. Available online: https://books.google.ru/books?id=LJrlzQEACAAJ (accessed on 16 September 2021).
- Kritsky, M.S.; Telegina, T.A.; Vechtomova, Y.; Kolesnikov, M.P.; Lyudnikova, T.A.; Golub, O.A. Excited flavin and pterin coenzyme molecules in evolution. Biochemistry 2010, 75, 1200–1216. [Google Scholar] [CrossRef] [PubMed]
- Sineshchekov, V.A.; Geiß, D.; Sineshchekov, O.A.; Galland, P.; Senger, H. Fluorometric characterization of pigments associated with isolated flagella of Euglena gracilis: Evidence for energy migration. J. Photochem. Photobiol. B Biol. 1994, 23, 225–237. [Google Scholar] [CrossRef]
- Mirkovic, T.; Ostroumov, E.E.; Anna, J.M.; van Grondelle, R.; Govindjee; Scholes, G.D. Light Absorption and Energy Transfer in the Antenna Complexes of Photosynthetic Organisms. Chem. Rev. 2017, 117, 249–293. [Google Scholar] [CrossRef]
- Cederstrand, C.N.; Rabinowitch, E. Govindjee Absorption and fluorescence spectra of spinach chloroplast fractions obtained by solvent extraction. Biochim. Biophys. Acta—Biophys. Incl. Photosynth. 1966, 120, 247–258. [Google Scholar] [CrossRef]
- Macintyre, H.L.; Lawrenz, E.; Richardson, T.L. Chlorophyll a Fluorescence in Aquatic Sciences: Methods and Applications; Springer: Dordrecht, The Netherlands, 2010; ISBN 978-90-481-9267-0. [Google Scholar]
- Kharcheva, A.V.; Zhiltsova, A.A.; Lunina, O.N.; Krasnova, E.D.; Voronov, D.A.; Savvichev, A.S.; Patsaeva, S.V. Bacteriochlorophyll Fluorescence of Green Sulfur Bacteria in Anaerobic Zone of Two Natural Water Bodies. MOSCOW Univ. Phys. Bull. 2018, 73, 377–381. [Google Scholar] [CrossRef]
- Zhiltsova, A.A.; Kharcheva, A.V.; Krasnova, E.D.; Lunina, O.N.; Voronov, D.A.; Savvichev, A.S.; Gorshkova, O.M.; Patsaeva, S.V. Spectroscopic Study of Green Sulfur Bacteria in Stratified Water Bodies of the Kandalaksha Gulf of the White Sea. Atmos. Ocean. Opt. 2018, 31, 390–396. [Google Scholar] [CrossRef]
- Wiens, R.C.; Maurice, S.; Mccabe, K.; Cais, P.; Anderson, R.B.; Beyssac, O.; Bonal, L.; Clegg, S.; Deflores, L.; Dromart, G. The SuperCam remote sensing instrument suite for Mars 2020. In Proceedings of the 47th Lunar and Planetary Science Conference, The Woodlands, TX, USA, 21–25 March 2016; p. 1322. [Google Scholar]
- Wiens, R.C.; Maurice, S.; Robinson, S.H.; Nelson, A.E.; Cais, P.; Bernardi, P.; Newell, R.T.; Clegg, S.; Sharma, S.K.; Storms, S.; et al. The SuperCam Instrument Suite on the NASA Mars 2020 Rover: Body Unit and Combined System Tests. Space Sci. Rev. 2021, 217, 1–87. [Google Scholar] [CrossRef] [PubMed]
- Pershin, S.M. Possibility of relict organic pigment detection on the Mars surface from the Earth, Mars Orbiter or Lander. Suppl. Ann. Geophys. 1998, 16, C827–C1051. [Google Scholar]
- DiGregorio, B.E. Spectroscopy; MJH Life Sciences: New York, NY, USA, 2000; pp. 48–50. [Google Scholar]
- Pershin, S.M.; Pungin, V. Water on Mars: Anomaly of a water index (1042/953) on the surface of Mars in Arcadia Planitia (181 deg W, 37 deg N). In Proceedings of the International Society for Optics and Photonics, San Diego, CA, USA, 29 July–3 August 2001; The Instruments, Methods, and Missions for Astrobiology IV.. 2002; Volume 4495, pp. 145–151. [Google Scholar]
- Pershin, S.M.; Sobisevich, A.L.; Grishin, M.Y.; Gravirov, V.V.; Zavozin, V.A.; Kuzminov, V.V.; Lednev, V.N.; Likhodeev, D.V.; Makarov, V.S.; Myasnikov, A.V.; et al. Volcanic activity monitoring by unique LIDAR based on a diode laser. Laser Phys. Lett. 2020, 17, 115607. [Google Scholar] [CrossRef]
- Blacksberg, J.; Alerstam, E.; Maruyama, Y.; Cochrane, C.J.; Rossman, G.R. Miniaturized time-resolved Raman spectrometer for planetary science based on a fast single photon avalanche diode detector array. Appl. Opt. 2016, 55, 739–748. [Google Scholar] [CrossRef] [PubMed] [Green Version]
- Akbulut, M.; Kotov, L.; Wiersma, K.; Zong, J.; Li, M.; Miller, A.; Chavez-Pirson, A.; Peyghambarian, N. An Eye-Safe, SBS-Free Coherent Fiber Laser LIDAR Transmitter with Millijoule Energy and High Average Power. Photonics 2021, 8, 15. [Google Scholar] [CrossRef]
- Hua, K.; Liu, B.; Chen, Z.; Fang, L.; Wang, H. Efficient and Noise Robust Photon-Counting Imaging with First Signal Photon Unit Method. Photonics 2021, 8, 229. [Google Scholar] [CrossRef]


| No. | λ, nm | Sample Characteristic |
|---|---|---|
| 1 | 475–480 | 6,7-dimethyl pterin adsorbed on kaolinite |
| 2 | 475–480 | NADH on kaolinite |
| 3 | 475–480 | Complex of abiogenic pterins (8:3:1, 185 °C, 8 h) |
| 4 | 475–480 and 500–520 | Same, but 6 h |
| 5 | 475–480 | X anthopterin from mixture 8:3:1 (6 h) |
| 6 | 480–520, broad band | Pterins + flavin in a wet synthetic product (8:3:1, 8 h) |
| 7 | 550 | Riboflavin on kaolinite |
| 8 | 530 | 1,4-dihydroxyanthraquinones from Penicillium funiculosum (on kaolinite) |
| 9 | 475–480 | Lipid extract from brown oak leaves |
| 10 | 475–480 | Dry leaf (powder) of Amaranthus cruentus |
| 11 | 475–480 and 500–520 | Green leaf (NADH+pterins) |
| 12 | 475–480 and 500–520 | Dark soil, Moscow Region (pterins) |
| 13 | 480–520, wide band | Pleistocene algal fossil rock, Crimea, 100,000 yr |
| 14 | 475–480 | Juvenile ashes of the Tyatya Volcano eruption of 1973 (perylen) |
| 15 | 520 and 550 | Latosole from the Amazon area, Brazil |
| 16 | 475 and 550 | Green leaf Pao Brazil |
| 17 | 475 and 550 | Seawater, Brazil |
| Pigment | Excitation, nm | Emission, nm | Solvent |
|---|---|---|---|
| Benzene rings (anthracenes) and heterocycles | 260–280 | 340–360 | Benzene, ethanol |
| Phytofluene (hexahydrolycopene) | 350–370; in the excitation spectrum are bands at 310, 350 and 370 nm | 415 | Hexane |
| Perylene | 420; in the spectrum are bands at 370, 385, 405 and 434 nm | 440 and 465 | Hexane, heptane |
| Flavonols (3-hydroxyflavones) | 370 | 470–520 | Ethanol |
| 440 | 520–540 | Ethanol + H3BO3 + citrate | |
| 2-hydroxy-5-methyl-1,4-benzoquinone | 370–390 | 480–500 | Ethanol; in 0.1N KOH absorbs at 510 nm |
| Leucopterin | 355 | 430 | Ethanol, pH 9.0; (2-amino-4,6,7-trihydroxypteridine) |
| Xanthopterin, isoxanthopterin (2-amino-4,6-dihydroxypteridine and 2-amino-4,7-dihydroxypteridine) | 375 | 460–480 | Same |
| NADH and NADPH in living microorganism cells and leaves | 340 | 455, 480 | Water, pH 7.0 |
| Flavins (riboflavin, lumiflavin, lumichrome; flavin mononucleotide and flavin adenine dinucleotide) | 370 (or 450) | 500–530 | Ethanol, CHCl3 |
| 1,4-dihydroxyanthraquinones | 370 | 500–540 | Ethanol CH3 COOH |
| 500 | 640–660 | A complex with (CH3COO)2Mg in ethanol | |
| Chlorines (related to chlorophylls) | 420 | 672, 715 | Ethanol |
| Phycoerythrins | 500 | 580–630 | Water |
| Phycocyanobilins | 600 | 660–715 | Water |
| Phycobilins-655 | 580–600 | 665 | 2,6-lutidine, amyl alcohol |
| 4,9-dihydroxyperylene-3,10-quinone | 500–520 | 660–670 | In concentrated H2SO4 |
Publisher’s Note: MDPI stays neutral with regard to jurisdictional claims in published maps and institutional affiliations. |
© 2021 by the authors. Licensee MDPI, Basel, Switzerland. This article is an open access article distributed under the terms and conditions of the Creative Commons Attribution (CC BY) license (https://creativecommons.org/licenses/by/4.0/).
Share and Cite
Lednev, V.N.; Bunkin, A.F.; Pershin, S.M.; Grishin, M.Y.; Artemova, D.G.; Zavozin, V.A.; Sdvizhenskii, P.A.; Nunes, R.A. Remote Laser Induced Fluorescence of Soils and Rocks. Photonics 2021, 8, 411. https://doi.org/10.3390/photonics8100411
Lednev VN, Bunkin AF, Pershin SM, Grishin MY, Artemova DG, Zavozin VA, Sdvizhenskii PA, Nunes RA. Remote Laser Induced Fluorescence of Soils and Rocks. Photonics. 2021; 8(10):411. https://doi.org/10.3390/photonics8100411
Chicago/Turabian StyleLednev, Vasily N., Alexey F. Bunkin, Sergey M. Pershin, Mikhail Ya. Grishin, Diana G. Artemova, Vladimir A. Zavozin, Pavel A. Sdvizhenskii, and Raul A. Nunes. 2021. "Remote Laser Induced Fluorescence of Soils and Rocks" Photonics 8, no. 10: 411. https://doi.org/10.3390/photonics8100411
APA StyleLednev, V. N., Bunkin, A. F., Pershin, S. M., Grishin, M. Y., Artemova, D. G., Zavozin, V. A., Sdvizhenskii, P. A., & Nunes, R. A. (2021). Remote Laser Induced Fluorescence of Soils and Rocks. Photonics, 8(10), 411. https://doi.org/10.3390/photonics8100411