Article

Ellipticity of High-Order Harmonics Generated by Aligned Homonuclear Diatomic Molecules Exposed to an Orthogonal Two-Color Laser Field

by
Dino Habibović
1 and
Dejan B. Milošević
1,2,3,*
1
Faculty of Science, University of Sarajevo, Zmaja od Bosne 35, 71000 Sarajevo, Bosnia and Herzegovina
2
Academy of Sciences and Arts of Bosnia and Herzegovina, Bistrik 7, 71000 Sarajevo, Bosnia and Herzegovina
3
Max-Born-Institut for Nonlinear Optics and Short Pulse Spectroscopy, Max-Born-Strasse 2a, 12489 Berlin, Germany
*
Author to whom correspondence should be addressed.
Photonics 2020, 7(4), 110; https://doi.org/10.3390/photonics7040110
Submission received: 3 October 2020 / Revised: 23 October 2020 / Accepted: 29 October 2020 / Published: 12 November 2020

Abstract

:
We investigate emission rate and ellipticity of high-order harmonics generated exposing a homonuclear diatomic molecule, aligned in the laser-field polarization plane, to a strong orthogonally polarized two-color (OTC) laser field. The linearly polarized OTC-field components have frequencies r ω and s ω , where r and s are integers. Using the molecular strong-field approximation with dressed initial state and undressed final state, we calculate the harmonic emission rate and harmonic ellipticity for frequency ratios 1:2 and 1:3. The obtained quantities depend strongly on the relative phase between the laser-field components. We show that with the OTC field it is possible to generate elliptically polarized high-energy harmonics with high emission rate. To estimate the relative phase for which the emission rate is maximal we use the simple man’s model. In the harmonic spectra as a function of the molecular orientation there are two types of minima, one connected with the symmetry of the molecular orbital and the other one due to destructive interference between different contributions to the recombination matrix element, where we take into account that the electron can be ionized and recombine at the same or different atomic centers. We derive a condition for the interference minima. These minima are blurred in the OTC field except in the cases where the highest occupied molecular orbital is modeled using only s or only p orbitals in the linear combination of the atomic orbitals. This allows us to use the interference minima to assess which atomic orbitals are dominant in a particular molecular orbital. Finally, we show that the harmonic ellipticity, presented in false colors in the molecular-orientation angle vs. harmonic-order plane, can be large in particular regions of this plane. These regions are bounded by the curves determined by the condition that the harmonic ellipticity is approximately zero, which is determined by the minima of the T-matrix contributions parallel and perpendicular to the fundamental component of the OTC field.

1. Introduction

When atomic or molecular targets are exposed to a strong laser field many nonlinear processes can happen. These processes can be divided into two groups: laser-assisted and laser-induced processes. A laser-assisted process can also happen when the laser field is not present, but the character of this process is different if the system is subjected to a strong laser field. Examples of these processes are laser-assisted electron-ion recombination and laser-assisted electron-atom scattering. In contrast, laser-induced processes can only take place if a strong laser field is present. Some of these processes are high-order harmonic generation (HHG), high-order above-threshold ionization (HATI) and nonsequential double ionization (NSDI). To observe laser-induced processes, intensities of the order 10 12 10 14 W/cm 2 are required.
To get insight into the physics of a laser-induced process, we usually use the three-step model [1,2]. When the atomic or molecular system is exposed to a strong laser field, it can absorb more laser-field photons than is necessary for ionization. If the Keldysh parameter γ = I p / ( 2 U p ) 1 , the tunneling ionization is the dominant regime. Here, I p is the ionization potential of the quantum-mechanical system, and U p is the ponderomotive energy of a free electron in the laser field. The second step describes the propagation of the liberated electron under the influence of the strong laser field. If the laser field is strong enough, the influence of the parent ion on the electron motion during this step can be neglected. This process, in which the liberated electron goes directly to the detector, is called above-threshold ionization (ATI) [3]. Because of the oscillatory character of the laser field, the electron can be driven back to the parent ion. Then, three scenarios can happen, and they correspond to the three laser-induced processes mentioned earlier. First, the returning electron can rescatter elastically off the parent ion. In this case, the electron can gain a much higher kinetic energy than in the ATI process, and the process is denoted as HATI. Second, the electron can recombine with the parent ion emitting a high-energy photon. These photons have frequencies that are integer multiples of the fundamental laser frequency. This scenario is responsible for the HHG process [4]. Finally, the returning electron can eject one more electron from the target, and this represents the third step of the NSDI process [5].
To study the ultrafast dynamics in circular dichroism of magnetic materials or chiral molecules, we need elliptically polarized high-order harmonics. Using atomic targets and a linearly polarized laser field, only linearly polarized harmonics can be obtained. However, if a so-called tailored laser field is used, significantly different polarizations may be expected. A tailored laser field is a superposition of several fields with different frequencies and polarizations. An example of such a field is the bicircular field, which is a superposition of two circularly polarized fields. The harmonics generated by this field are circularly polarized [6,7,8,9,10] and the efficiency is just slightly lower than that of the harmonics generated with linearly polarized two-color fields [10,11]. The applications of circularly polarized light are numerous. For example, using circularly polarized light, it is possible to distinguish different chiral forms because the absorption of left and right circularly polarized light is not equal. Here, it is important to mention that chirality can also be studied directly using HHG spectroscopy, as shown in [12] using the bicircular field and in [13,14] using other tailored laser fields (including fields which consist of two linearly polarized components with different frequencies and mutually orthogonal polarizations). In addition, to produce elliptically polarized harmonics, many other techniques have been developed [15,16,17,18]. Generally, the main problem is that the ellipticity is not high enough, or the intensity of the harmonic emission is low. In other words, we need a technique to produce elliptically polarized high-order harmonics having high intensity. In the context of the present paper, it should be mentioned that elliptically polarized harmonics can be generated using molecular HHG [19,20]. The ellipticity may reach 40% in N 2 molecules aligned at 60 from the polarization direction of linearly polarized laser field [20].
In this paper, we analyze the HHG process using an orthogonally polarized two-color (OTC) laser field. This field is a superposition of two linearly polarized laser fields with orthogonal polarizations and different frequencies. The OTC field with frequency ratio 1:2 ( ω 2 ω ) has been explored extensively (see [21] and references therein). It was shown that the harmonics generated using helium atoms in the ω 2 ω OTC field are stronger than those obtained in the fundamenal field [22]. Both even and odd harmonics are emitted [6] and, due to symmetry reasons, they are linearly polarized (odd harmonics in the direction of the ω component and even harmonics in the direction of the 2 ω component) [23]. Under the influence of a strong laser field, the orientation-averaged molecular medium behaves in the same way as the atomic medium. Therefore, for the orientation-averaged molecular medium exposed to the ω 2 ω OTC laser field, the harmonics are linearly polarized due to the symmetry considerations. This symmetry-based selection rule was analytically rigorously derived by Neufeld et al. [24] using a group theory approach in a general manner that includes the full symmetry of the laser-matter system. This approach is general for all molecules and is applicable regardless of the method of calculation. Elliptically polarized harmonics can be obtained in a nearly OTC field, i.e., the two linearly polarized components intersect at an angle close to 90 [25]. In addition, we mention that the ω 2 ω OTC laser field was recently investigated in the context of molecular HHG spectroscopy for probing ring-currents by Neufeld and Cohen [26] and correlations by Neufeld and Cohen [27]. The OTC field with frequency ratio 1:3 ( ω 3 ω ) has received almost no attention at all. Watanebe et al. [28] showed that the presence of a component with frequency 3 ω may significantly enhance the harmonic yield. The first theoretical results can be found in [7], where the emission rates for HHG by a zero-range-potential model atom are calculated. In addition, in [7], several other two-component driving fields are considered. For the ω 3 ω OTC field, only odd harmonics are emitted and they are elliptically polarized. More recently, the ellipticity of the emitted harmonics obtained using the ω 2 ω OTC laser field was experimentally analyzed in atomic media by Bordo et al. [29] who showed that for small ellipticity of the OTC field components the ellipticity of the emitted harmonic can be high (see also [30]).
For molecular targets there are additional degrees of freedom. More specifically, there are three new degrees of freedom, which are represented by three angles. These angles establish the mutual relationship between the laser and molecular coordinate systems. For a diatomic molecule aligned in the laser-field polarization plane, there is only one additional degree of freedom, the angle θ L between the molecular axis and one component of the OTC field. Many interesting phenomena, such as two-center interference [31,32,33], can be observed in HHG from diatomic molecules. In addition, molecular HHG contains information about the molecular structure. Itatani et al. [34] demonstrated that the three-dimensional structure of a single orbital can be imaged using high harmonics generated with laser pulses focused on aligned molecules. HHG by an OTC field with wavelengths 800 and 400 nm was considered using molecules D 2 , N 2 and CO 2 [35] as well as ethane [36]. The time at which the electron exits from the tunnelling barrier was estimated in HHG experiment with CO 2 molecules exposed to a linearly polarized field of wavelength 800 nm and its second-harmonic field which is weak and orthogonaly polarized [37]. A generalized two-center interference condition for aligned diatomic molecules exposed to an ω 2 ω OTC laser field, with emphasis on the component ellipticities, was presented by Das et al. [38]. Selection rules for molecular HHG were investigated for various field configuration, including the OTC field case in [39]. However, in [39], only numerical investigations are carried out, while the origin of the selection rules is not analyzed. This was first done analytically by Neufeld et al. [24]. HHG by OTC field and aligned H 2 + molecular ion and N 2 molecule was considered by Chen et al. [40]. Single-shot molecular orbital tomography with ω 2 ω OTC field was introduced by Zhai et al. [41]. The HHG from aligned H 2 + and oriented HeH 2 + and HeH + molecular ions in an ω 2 ω OTC laser field was analyzed by Zhang and Lein [42]. In [42], the electric-field amplitude of the component with frequency 2 ω is 10 % of the fundamental-field amplitude. Finally, particular symmetries, present for atomic targets, are violated for aligned molecules and the harmonics are elliptically polarized. Therefore, using aligned molecular targets and a strong ω 2 ω OTC laser field, it is possible to generate elliptically polarized high harmonics. Elliptically polarized harmonics can be generated using atomic (or unaligned molecular) targets and other frequency ratios r:s, but it should be taken into account that it is difficult to obtain experimentally high laser intensity of the s 3 component.
Since ab initio calculation of the high-harmonic spectra is demanding even for the simplest molecules, sophisticated models and theories have to be developed. The theories most popular for this purpose are based on the strong-field approximation (SFA), where the interaction of the ionized electron with the parent ion between ionization and recombination is neglected [2], and the electron is described by Volkov states. A limitation of the SFA is that the Coulomb effects on the electron final continuum state are neglected. However, the SFA describes well high-order processes such as HHG and HATI. In particular, SFA was successfully applied to simulate and explain molecular (H)ATI experiments [43,44,45,46,47,48,49,50,51].
This paper is devoted to the HHG process by neutral homonuclear diatomic molecules driven by an ω 2 ω or ω 3 ω OTC field. In this case, the emitted harmonics are elliptically polarized. The ω 3 ω OTC field supports only odd harmonics, while, for the ω 2 ω OTC field, both odd and even harmonics are emitted. The main body of this paper is divided into four sections. In Section 2, we briefly present the molecular strong-field approximation theory for homonuclear diatomic molecules in an orthogonally polarized two-color laser field. In Section 3, the obtained numerical results are presented, while our concluding remarks and some discussion are given in Section 4. We use the atomic system of units ( ħ = e = m e = 4 π ε 0 = 1 ).

2. Theory

The theory of strong-field ionization of diatomic molecules is presented in [52]. The diatomic molecule is modeled as a three-particle system which includes two atomic centers and one active electron. Two forms of the molecular strong-field approximation (MSFA) have been introduced. The first form uses a field-free initial bound state, while the second one uses a field-dressed initial bound state. The MSFA formalism is applied to high-order harmonic generation in [32], where the interference effects are analyzed extensively for HHG by a linearly polarized laser field. This theory is generalized to the case of polyatomic molecules in [53,54].

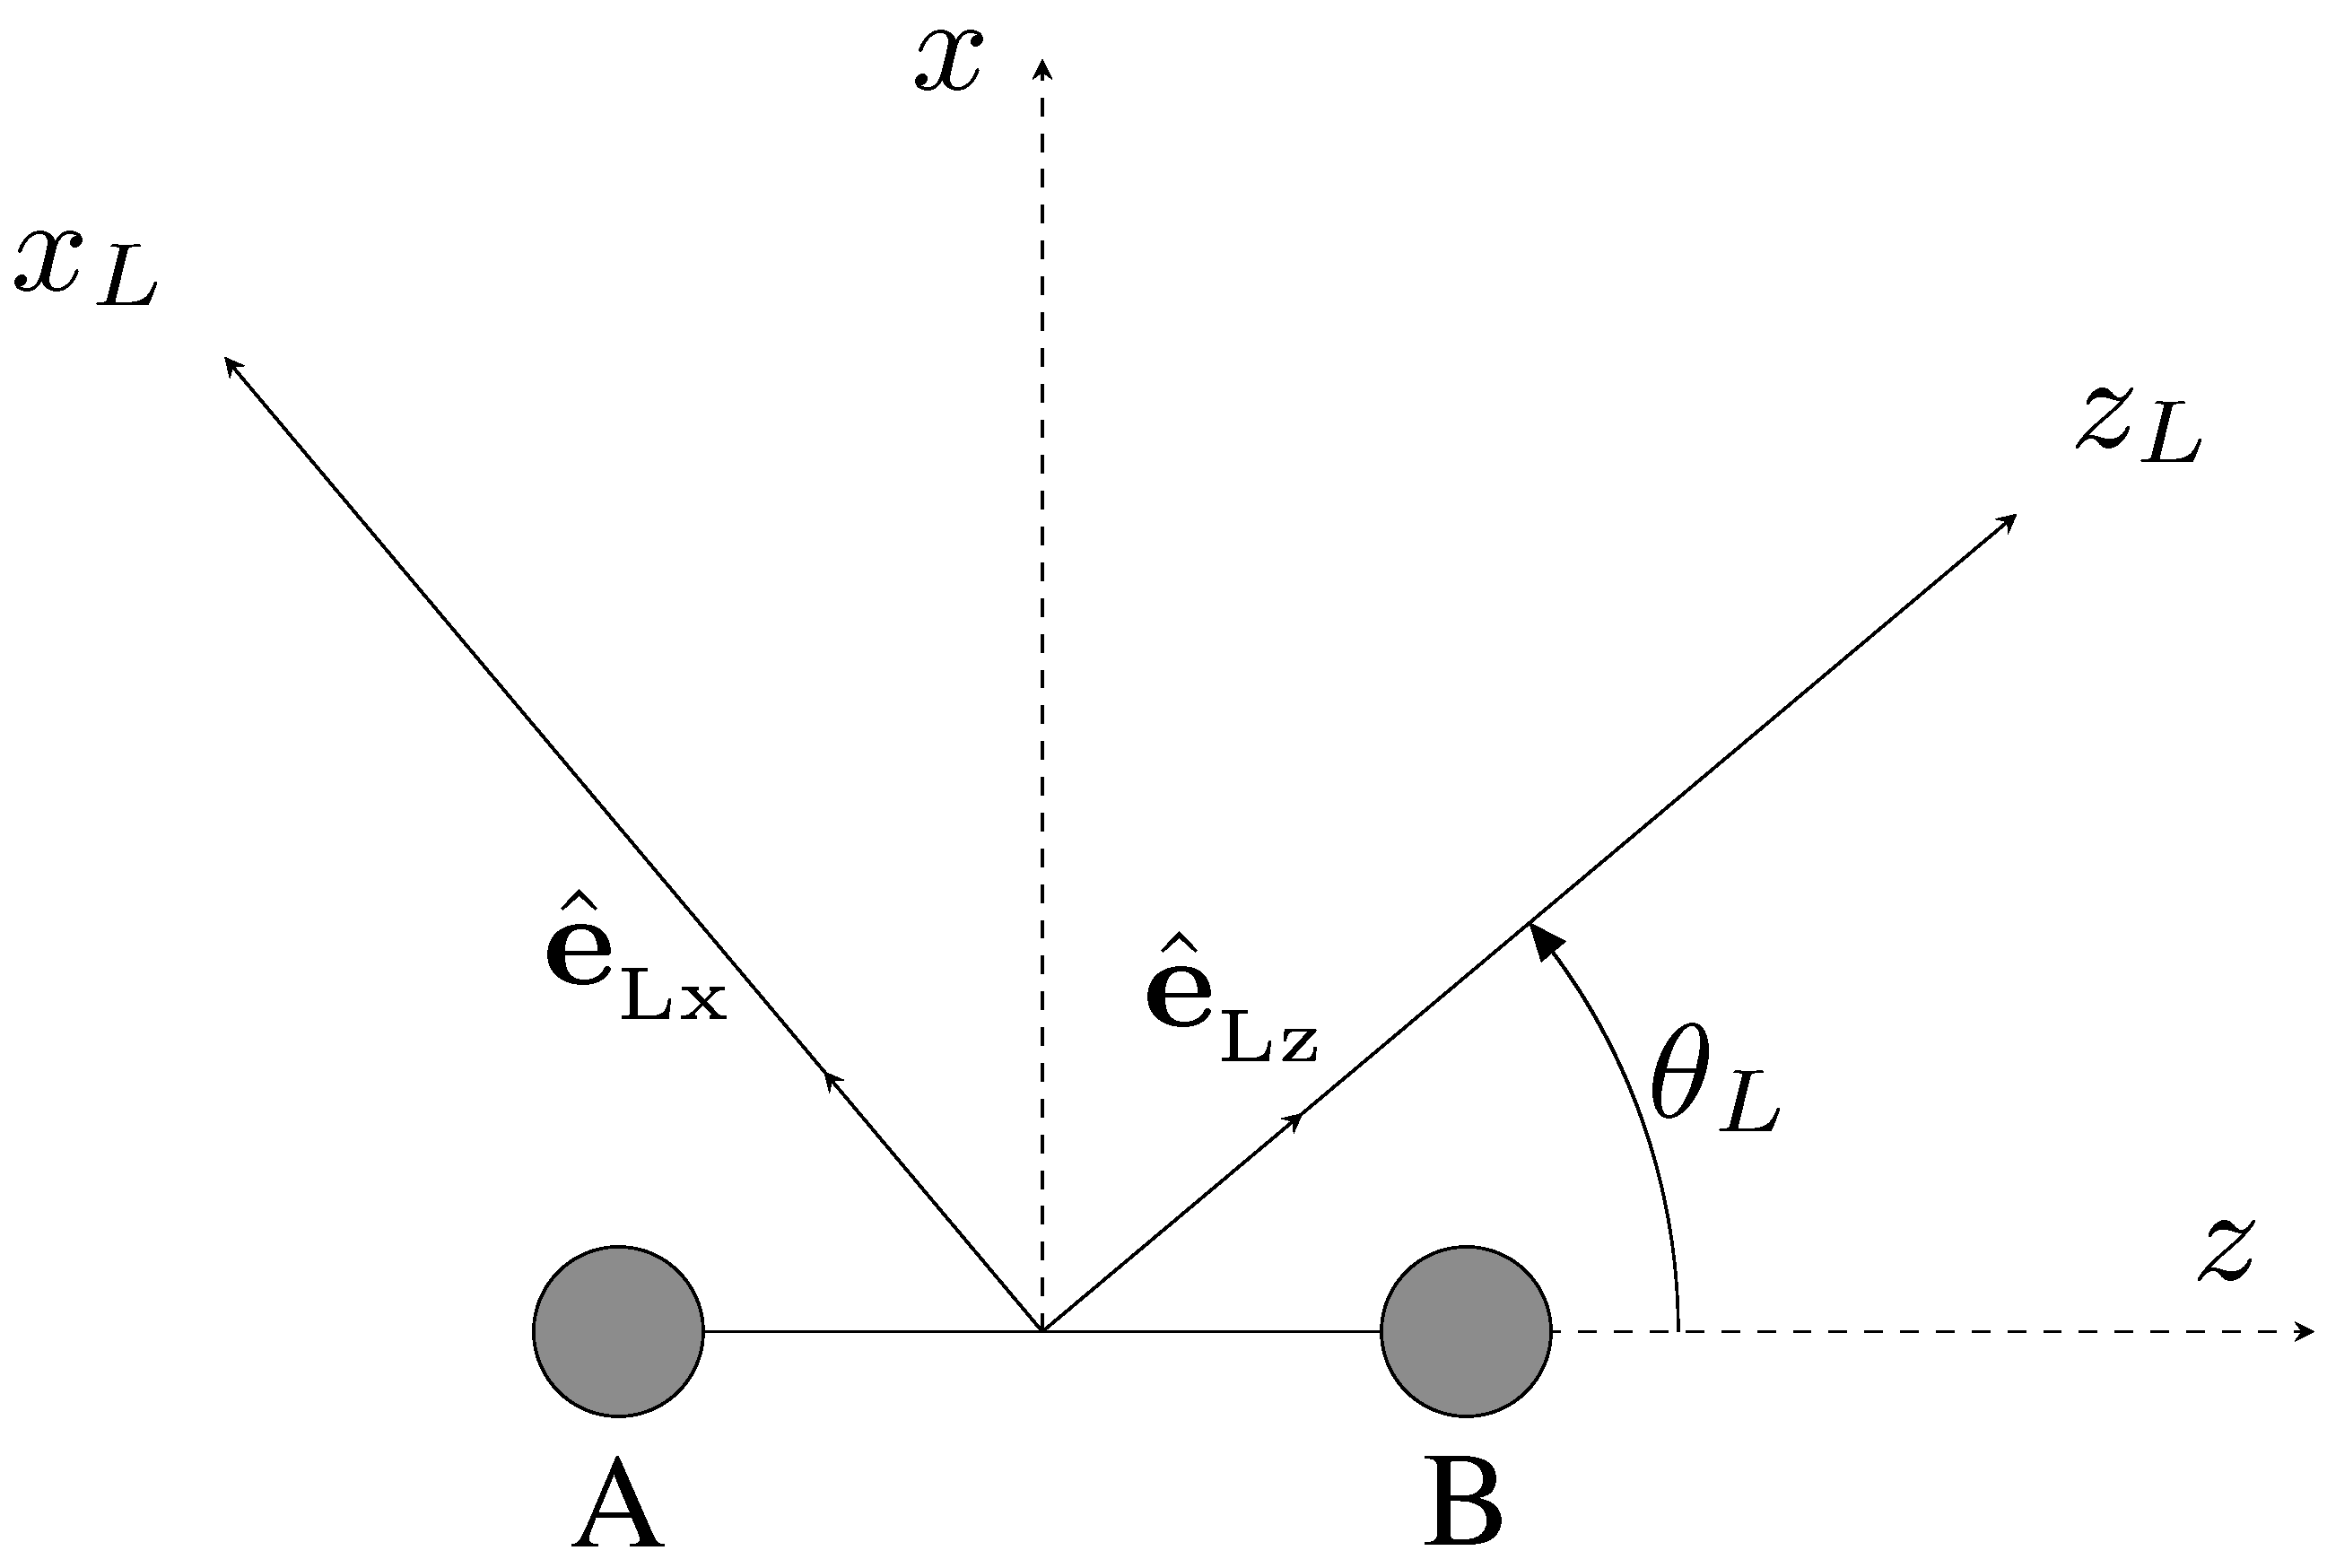
2.1. Definition of the OTC Field, Diatomic Molecules and the Geometry of the HHG Process

In the present paper, we apply the MSFA theory to the OTC laser field described by
E ( t ) = E 1 sin ( r ω t ) e ^ Lz + E 2 sin ( s ω t + φ ) e ^ Lx ,
where E 1 2 and E 2 2 are the intensities of the field components, ω is the fundamental frequency, r and s are integers and φ is the relative phase between the laser-field components. We suppose that the laser field and the molecule are in the same plane ( x z plane, i.e., the x L z L plane). In this case, the position of the molecule, relative to the laser field, can be described by the angle θ L , which is the angle between the molecular axis and the z L component of the OTC laser field (see Figure 1).
Laser-field real unit vectors can be expressed in terms of the molecular coordinate system unit vectors z ^ and x ^
e ^ Lz = cos θ L z ^ + sin θ L x ^ , e ^ Lx = sin θ L z ^ + cos θ L x ^ .
We present the molecular orbital as a linear combination of atomic orbitals (LCAO) [52,55], s a c s a ψ a ( 0 ) ( r + s R 0 / 2 ) , where r is the relative electron coordinate and R 0 is the equilibrium internuclear distance. We use the Born–Oppenheimer approximation [55] and the electronic energy and wave function are evaluated at the equilibrium nuclear position [52]. The Slater-type orbitals ψ a ( 0 ) and the expansion coefficients c s a are obtained using the Hartree–Fock–Roothan method. The sum over s is the sum over the atomic centers, while the sum over a is the sum over the atomic orbitals. The coefficients at the atomic centers A and B are equal, up to a sign, i.e., c 1 a = s λ c 1 a . Here, s λ = ( 1 ) m λ for g symmetry and s λ = ( 1 ) m λ + 1 for u symmetry [56], where m λ is the value of the projection of the orbital angular momentum on the internuclear axis. To include the laser-field dressing, the atomic orbitals have to be multiplied by a factor that comes from the potential energy of the electron in the presence of the center A or the center B [52]. As examples, we use the N 2 and Ar 2 molecules. For N 2 (Ar 2 ), the highest occupied molecular orbital (HOMO) is the 3 σ g ( 5 σ u ) orbital. The equilibrium internuclear distance and the ionization potential for N 2 are R 0 = 2.068 a.u. and I p = 15.58 eV, respectively, while for Ar 2 these quantities are R 0 = 7.2 a.u. and I p = 16.074 eV. Twelve atomic orbitals are taken into account for the N 2 molecule: five s, three p, three d and one f orbital. The HOMO of Ar 2 is modeled using only p orbitals.

2.2. Harmonic Emission Rate

For a laser field with the period T = 2 π / ω , the harmonic emission rate for the photon having frequency ω K = n ω , wave vector K and the polarization e ^ K is given by [32,57,58]
w n q q = 1 2 π n ω c 3 | T n q q | 2 ,
where the superscript q ( q ) tells us if the laser-field dressing is taken into account or not for the final (initial) state. The initial state and the final state may be dressed or undressed. However, Odžak and Milošević [32] showed that, to get clear two-center interference minima, the final state should be treated as undressed. On the other hand, the initial state should be treated as a dressed state, at least for large internuclear distances [59]. The T-matrix element with the dressed initial and the undressed final state is given by the following complex vector [32]
T n = i 2 π i 3 / 2 0 T e i n ω t d t T 0 d τ τ 3 / 2 R ( k st , t ) e i S ( k st ; t , t τ ) I ( k st , t τ ) ,
where its recombination and ionization parts are
R ( k st , t ) = i s = ± 1 a c s a e i s [ k st + A ( t ) ] · R 0 / 2 m a ( k st , t ) ,
I ( k st , t ) = i s = ± 1 a c s a e i s k st · R 0 / 2 m a * ( k st , t ) · E ( t ) ,
respectively. Here, m a ( k st , t ) = ψ a ( 0 ) | r | k st + A ( t ) is the dipole matrix element, S ( k st ; t , t ) = t t { [ k st + A ( t ) ] 2 / 2 + I p } d t is the action, I p is the ionization potential, time t (t) is the time of ionization (recombination), while the time τ = t t is the so-called travel time. The vector potential is A ( t ) = t E ( t ) d t and the stationary momentum k st = t t A ( t ) d t / τ . We numerically calculate the components of the complex vector T n along the axes, which are determined by e ^ Lz and e ^ Lx . These components are denoted as T n Lz and T n Lx , respectively.

2.3. Harmonic Ellipticity

Using the components T n Lz and T n Lx , we calculate the quantity
M n = 2 ( T n Lz ) * T n Lx ,
so that we can find the degree of circular polarization
ξ n = Im M n | T n | 2 .
the harmonic ellipticity can be written in the following form [30,60,61]:
ε n = sgn ( ξ n ) 1 1 ξ n 2 1 + 1 ξ n 2 1 / 2 .

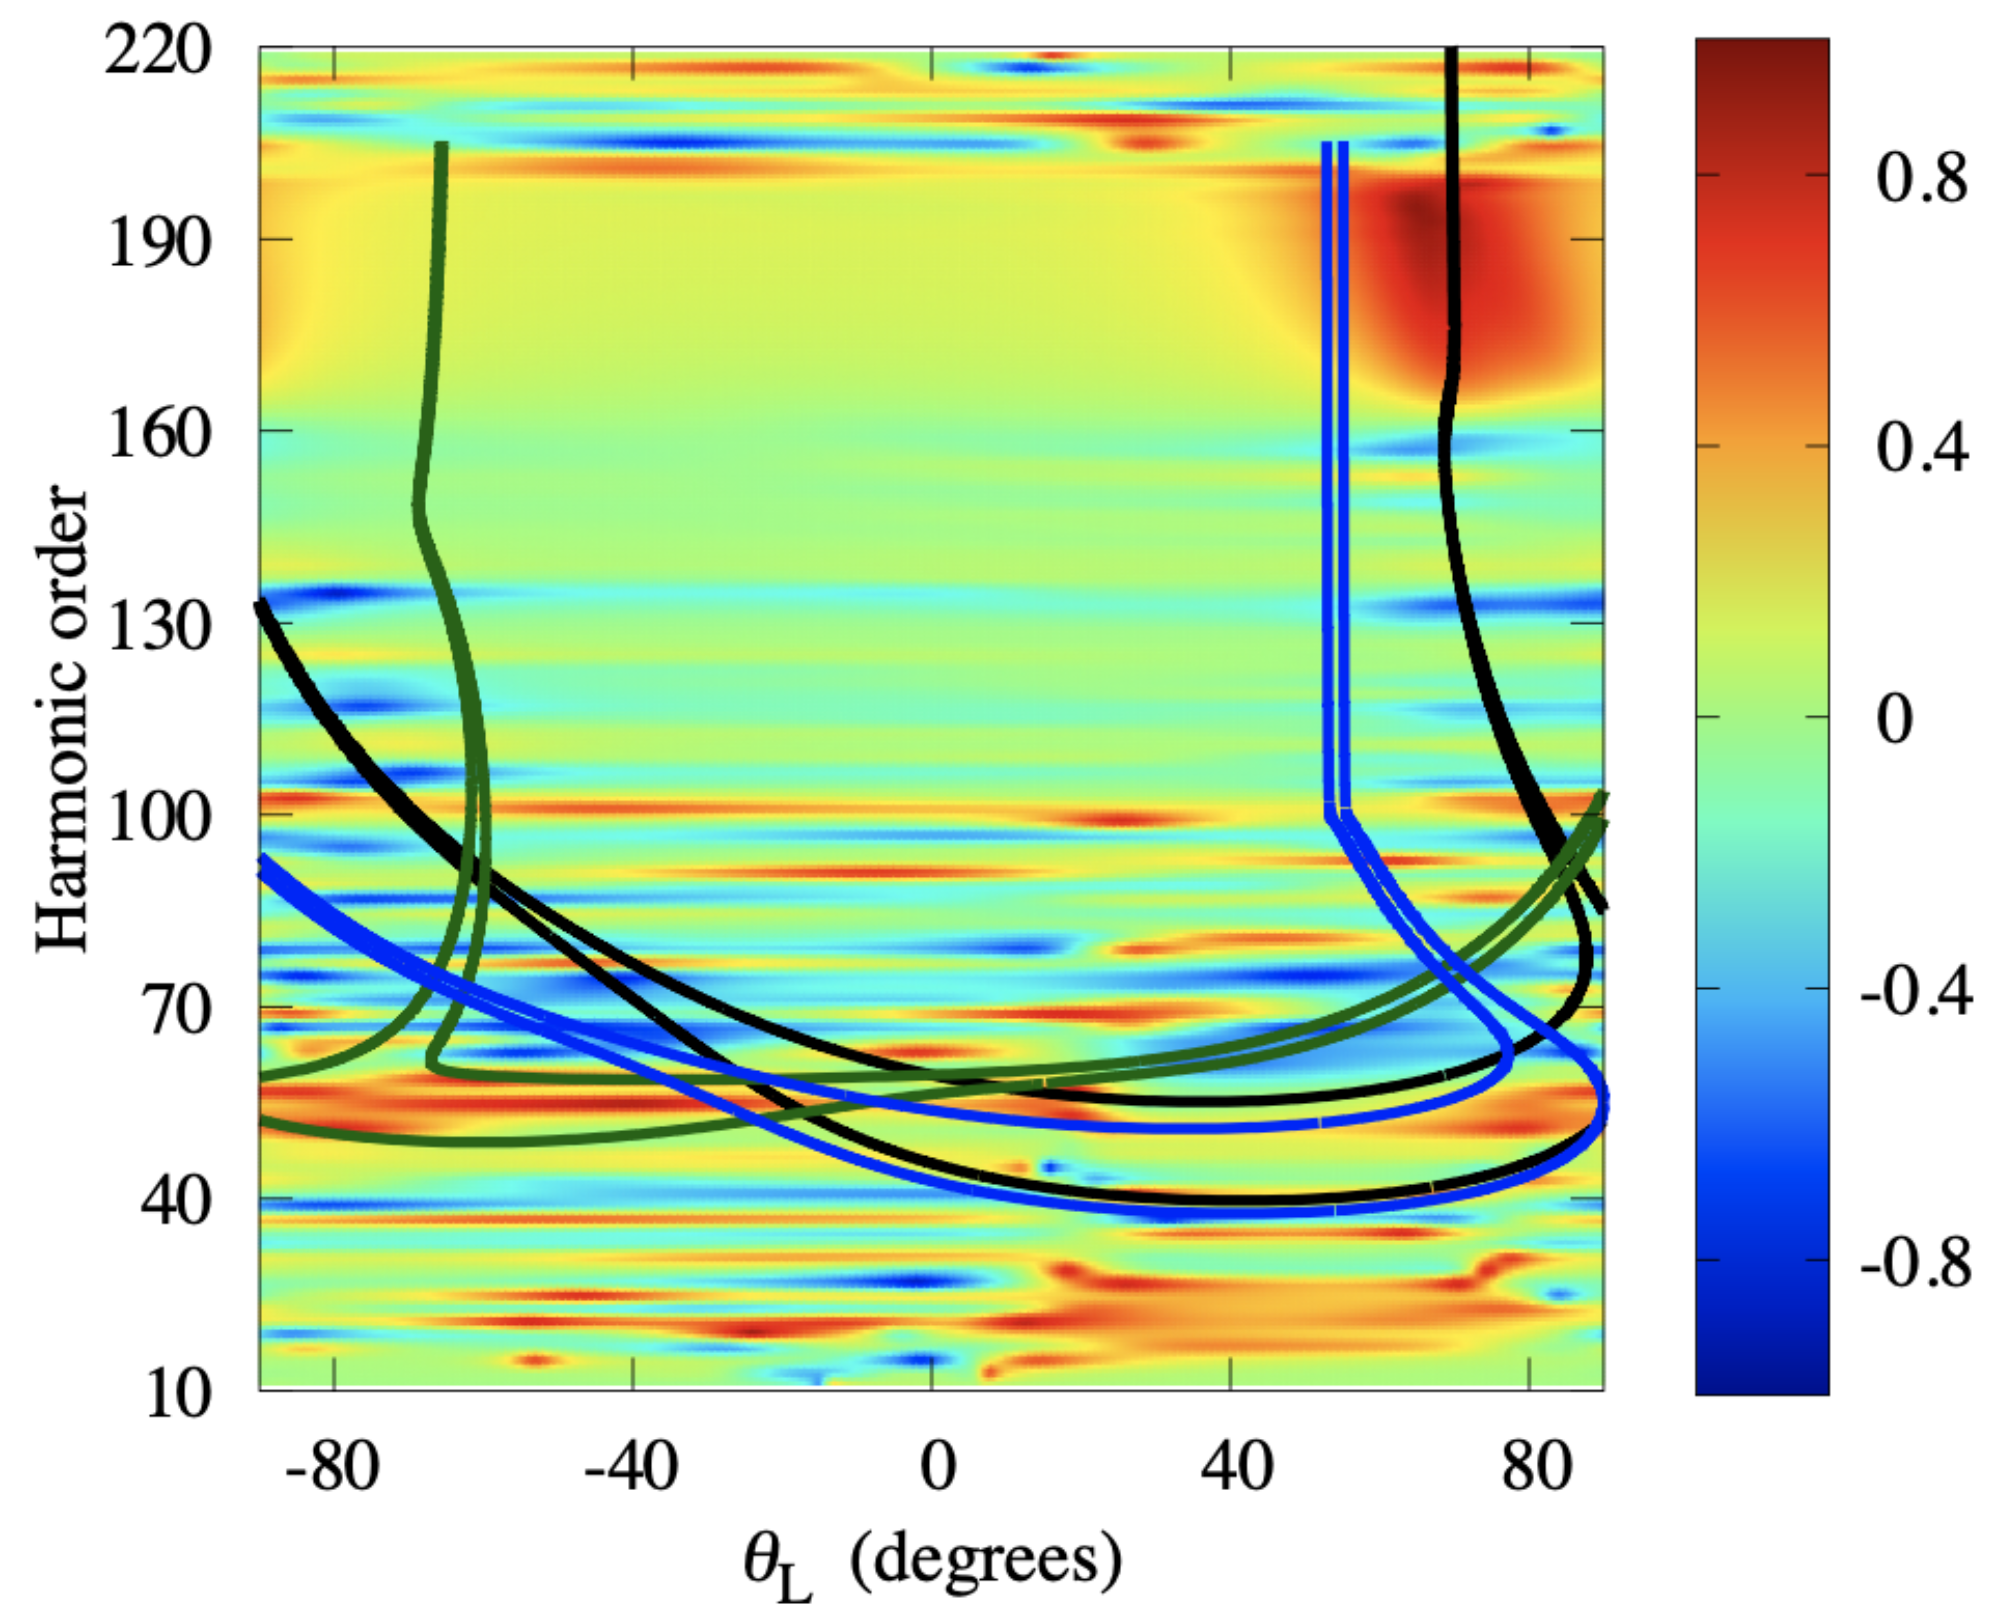
2.4. Interference Minima Conditions

Let us now analyze the two-center destructive interference condition for the OTC laser field. For a linearly polarized laser field, interference minima are present in the harmonic spectra for specific values of the molecular orientation angle θ L . The corresponding interference condition is derived in [32] for the component of the T-matrix element along the direction of the laser-field polarization. For the component of the T-matrix element along the direction perpendicular to the laser-field polarization, the interference condition is derived in [62]. The corresponding spectra can also exhibit minima which are the consequences of the symmetry properties of the molecular orbital. In addition, Odžak and Milošević [62] showed that in an elliptically polarized laser field the interference minima are blurred. In this subsection, we derive analogous interference conditions for the OTC field.
To derive the destructive interference conditions, we use the recombination part of the T-matrix element (Equation (5)). Using the connection c 1 a = s λ c 1 a and introducing the notation 2 x = R 0 · [ k st + A ( t ) ] , we get
R ( k st , t ) = i a c 1 a ( e i x + s λ e i x ) m a ( k st , t ) = 2 i cos x a + c 1 a + m a + ( k st , t ) 2 sin x a c 1 a m a ( k st , t ) ,
where we separate the contribution of even ( s λ = + 1 ) and odd ( s λ = 1 ) orbitals and denote the corresponding atomic orbital by a ± a ( s λ = ± 1 ) . The matrix element m a ± ( k st , t ) is
m a ± ( k st , t ) = m a ± Lz ( k st , t ) e ^ Lz + m a ± Lx ( k st , t ) e ^ Lx ,
where m a ± Lz ( k st , t ) [ m a ± Lx ( k st , t ) ] is the component of the matrix element along the unit vector e ^ Lz ( e ^ Lx ). For our Slater-type orbitals, the dipole matrix element is equal to (see Appendix A in [32]) m a ± ( k st , t ) = i p ψ ˜ a ± * ( p ) , p = k st + A ( t ) , where ψ ˜ a ± ( p ) are the momentum–space Slater-type orbitals, which are real (imaginary) for s λ = + 1 and g symmetry (u symmetry) or for s λ = 1 and u symmetry (g symmetry). To separate the Lz and Lx components, we introduce the following notation
C ± κ = 2 a ± c 1 a ± p ψ ˜ a ± * ( p ) · e ^ κ , z κ = i C + κ / C κ , κ = Lz , Lx ,
and get the following expression for the Lz and Lx components of the vector R ( k st , t )
R κ ( k st , t ) = C + κ cos x i C κ sin x = ( C + κ ) 2 ( C κ ) 2 sin ( x + arctan z κ ) .
Then, the interference minima condition takes the form
x + arctan z κ = m κ π , m κ = 0 , ± 1 , , κ = Lz , Lx .
If this condition is satisfied, then the corresponding component of the T-matrix element T n κ is zero and the harmonics are linearly polarized along the axis perpendicular to the κ axis. The stationary momentum k st is two-dimensional. It can be calculated using the quantum-orbit theory and the saddle-point method [23]. The saddle-point equations are: [ k st + A ( t ) ] 2 = 2 ( n ω I p ) and [ k st + A ( t ) ] 2 = 2 I p (see Appendix A). The first equation, together with the interference condition (14), leads to a curve in the ( θ L , n ) plane. The contributions R κ ( k st , t ) are either real or purely imaginary. If the contribution is purely imaginary, it can be redefined by adding the imaginary unit. This was thoroughly examined by Odžak and Milošević [63] for the linearly polarized laser field.

2.5. Simple Man’s Model

An intuitive explanation of the HHG process can be gained using the solution of the Newton equation of motion for the electron in a laser field. This model is formulated for a linearly polarized laser field and one-dimensional trajectories in [64,65] and applied to three-step processes in [1,66]. The two-dimensional generalization of this model for atomic targets and the OTC laser field was presented by Milošević and Becker [21]. In this paper, we apply this two-dimensional model to molecular targets. The solution of the Newton equation of motion r ¨ = E ( t ) is
r ( t ) = r ( t ) + v ( t ) ( t t ) A ( t ) ( t t ) + t t A ( t ) d t ,
where v ( t ) is the initial electron velocity. The position of the electron at the moment of ionization is r ( t ) = s R 0 2 z ^ , where s = + 1 ( s = 1 ) corresponds to the situation where the electron is ionized at the right (left) atomic center. The condition for the recombination is r ( t ) = s R 0 2 z , where s = + 1 ( s = 1 ) for the right (left) atomic center. The electron’s kinetic energy at the moment of recombination is
E k = [ K s s ( t , t ) + A ( t ) ] 2 2 , K s s ( t , t ) = k st ( t , t ) + ( s s ) R 0 2 ( t t ) z ^ .
The ionization probability is highest for zero initial velocity v ( t ) = 0 , so that the harmonic intensity is optimal for the harmonic-photon energy
n opt ω = I p + 1 2 [ A ( t ) A ( t ) ] 2 .
An algorithm for the calculation of n opt is described in [21].
To calculate the maximal harmonic order, we do not require that the initial electron velocity be zero. We require that the electron trajectory is extremal with respect to the kinetic energy, i.e., E k ( t , t ) / t = 0 and E k ( t , t ) / t = 0 . Then, using Equation (16), we obtain the following system of equations
[ K s s ( t , t ) + A ( t ) ] · [ K s s ( t , t ) + A ( t ) ] = 0 ,
[ K s s ( t , t ) + A ( t ) ] · [ K s s ( t , t ) + A ( t ) + E ( t ) ( t t ) ] = 0 .
Solving this system, we get t m and t m . The maximal harmonic-photon energy is E k , m + I p , with
E k , m = 1 2 [ K s s ( t m , t m ) + A ( t m ) ] 2 .

3. Numerical Results

In this section, we present the high-order harmonic spectra of the N 2 molecule, obtained using an orthogonally polarized two-color laser field. The fundamental wavelength is λ = 2000 nm, and the intensity of both field components is equal unless otherwise stated. We analyze the harmonic emission rate and the ellipticity of the emitted harmonics as functions of the relative phase between the laser-field components and the molecular orientation for the ω 2 ω and ω 3 ω OTC fields. To illustrate the destructive interference minima, we also use the harmonic spectra of the Ar 2 molecule.

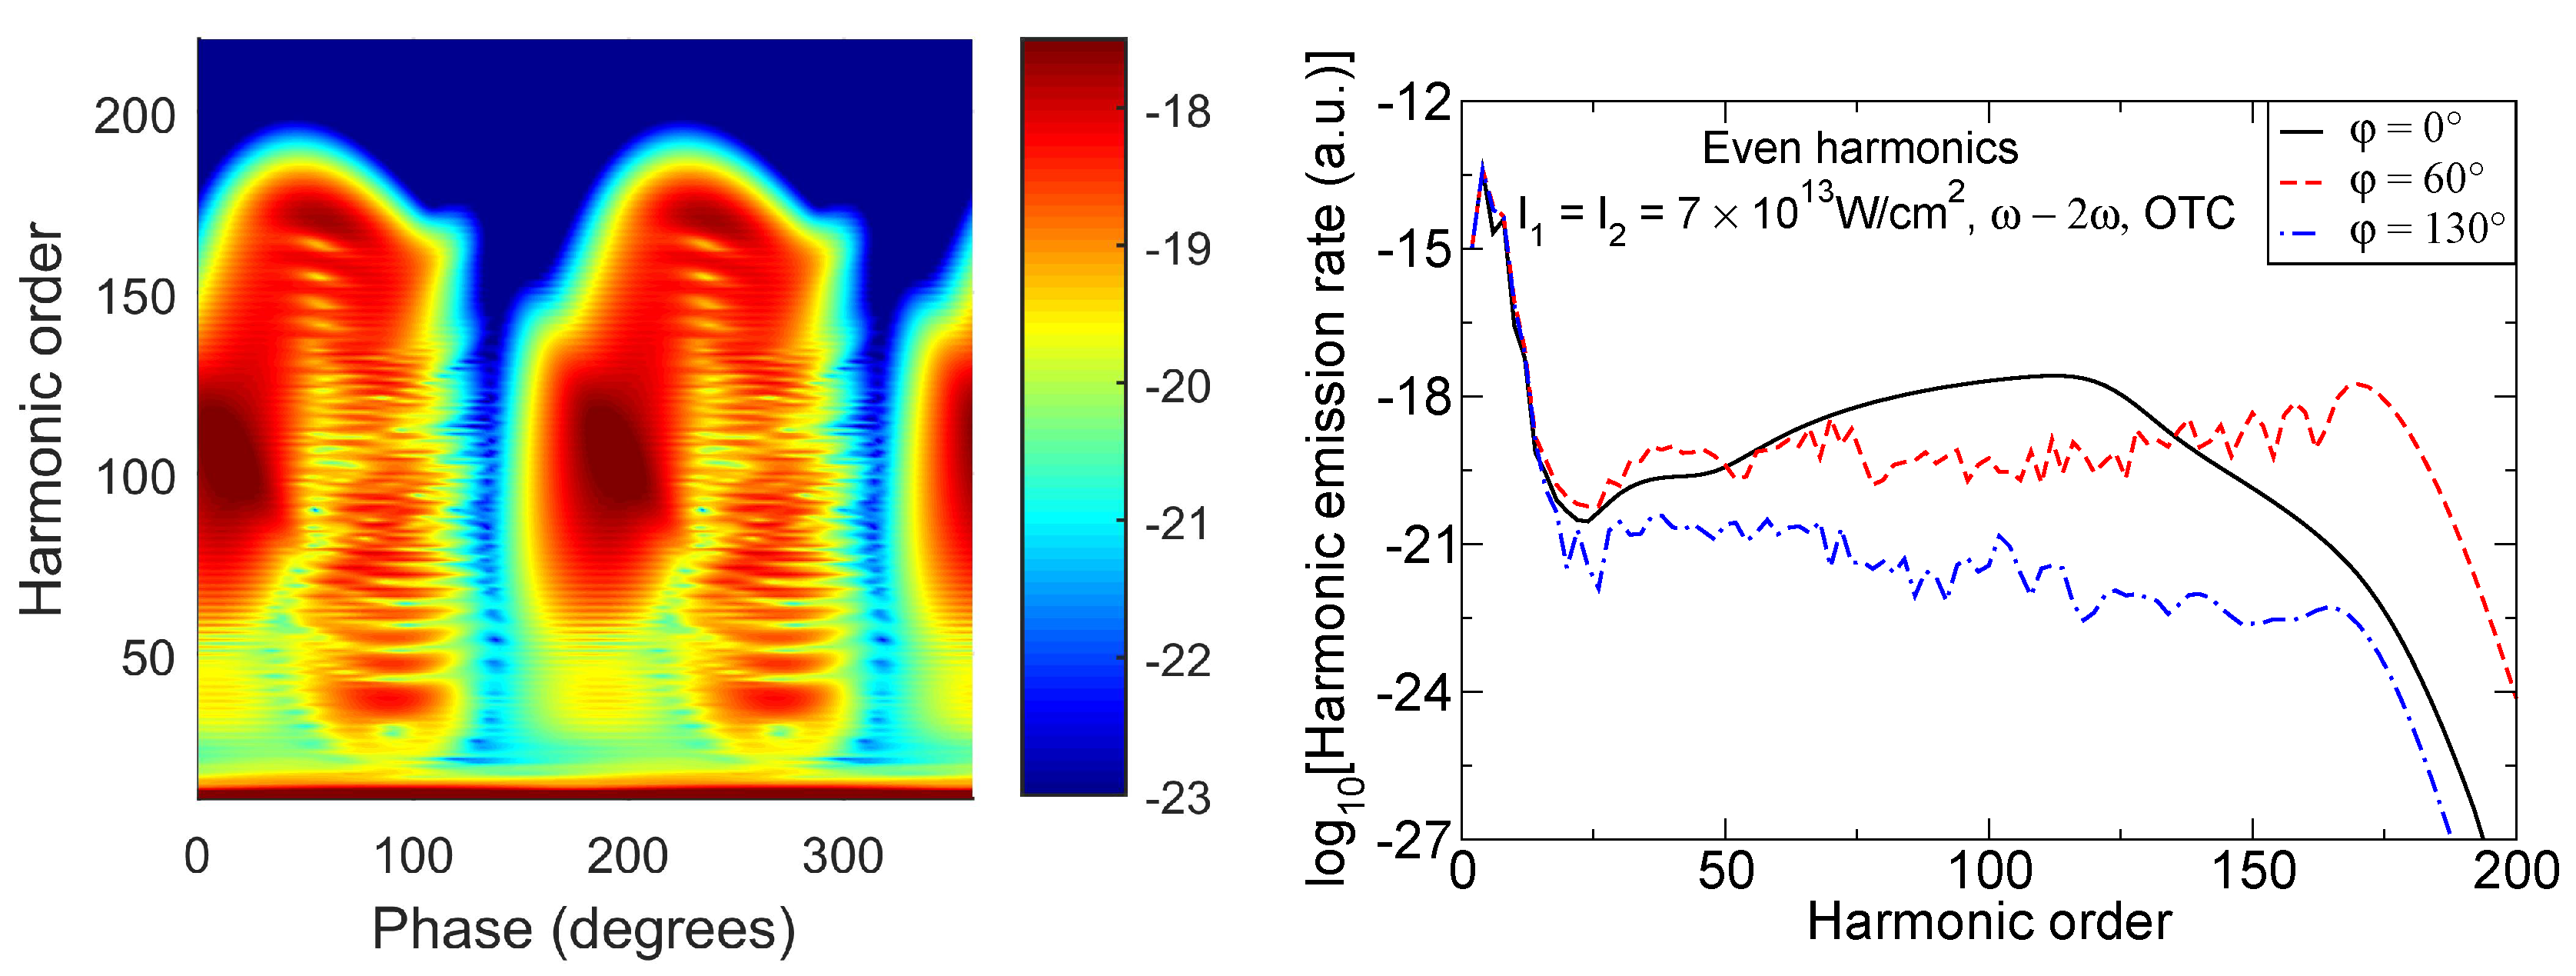
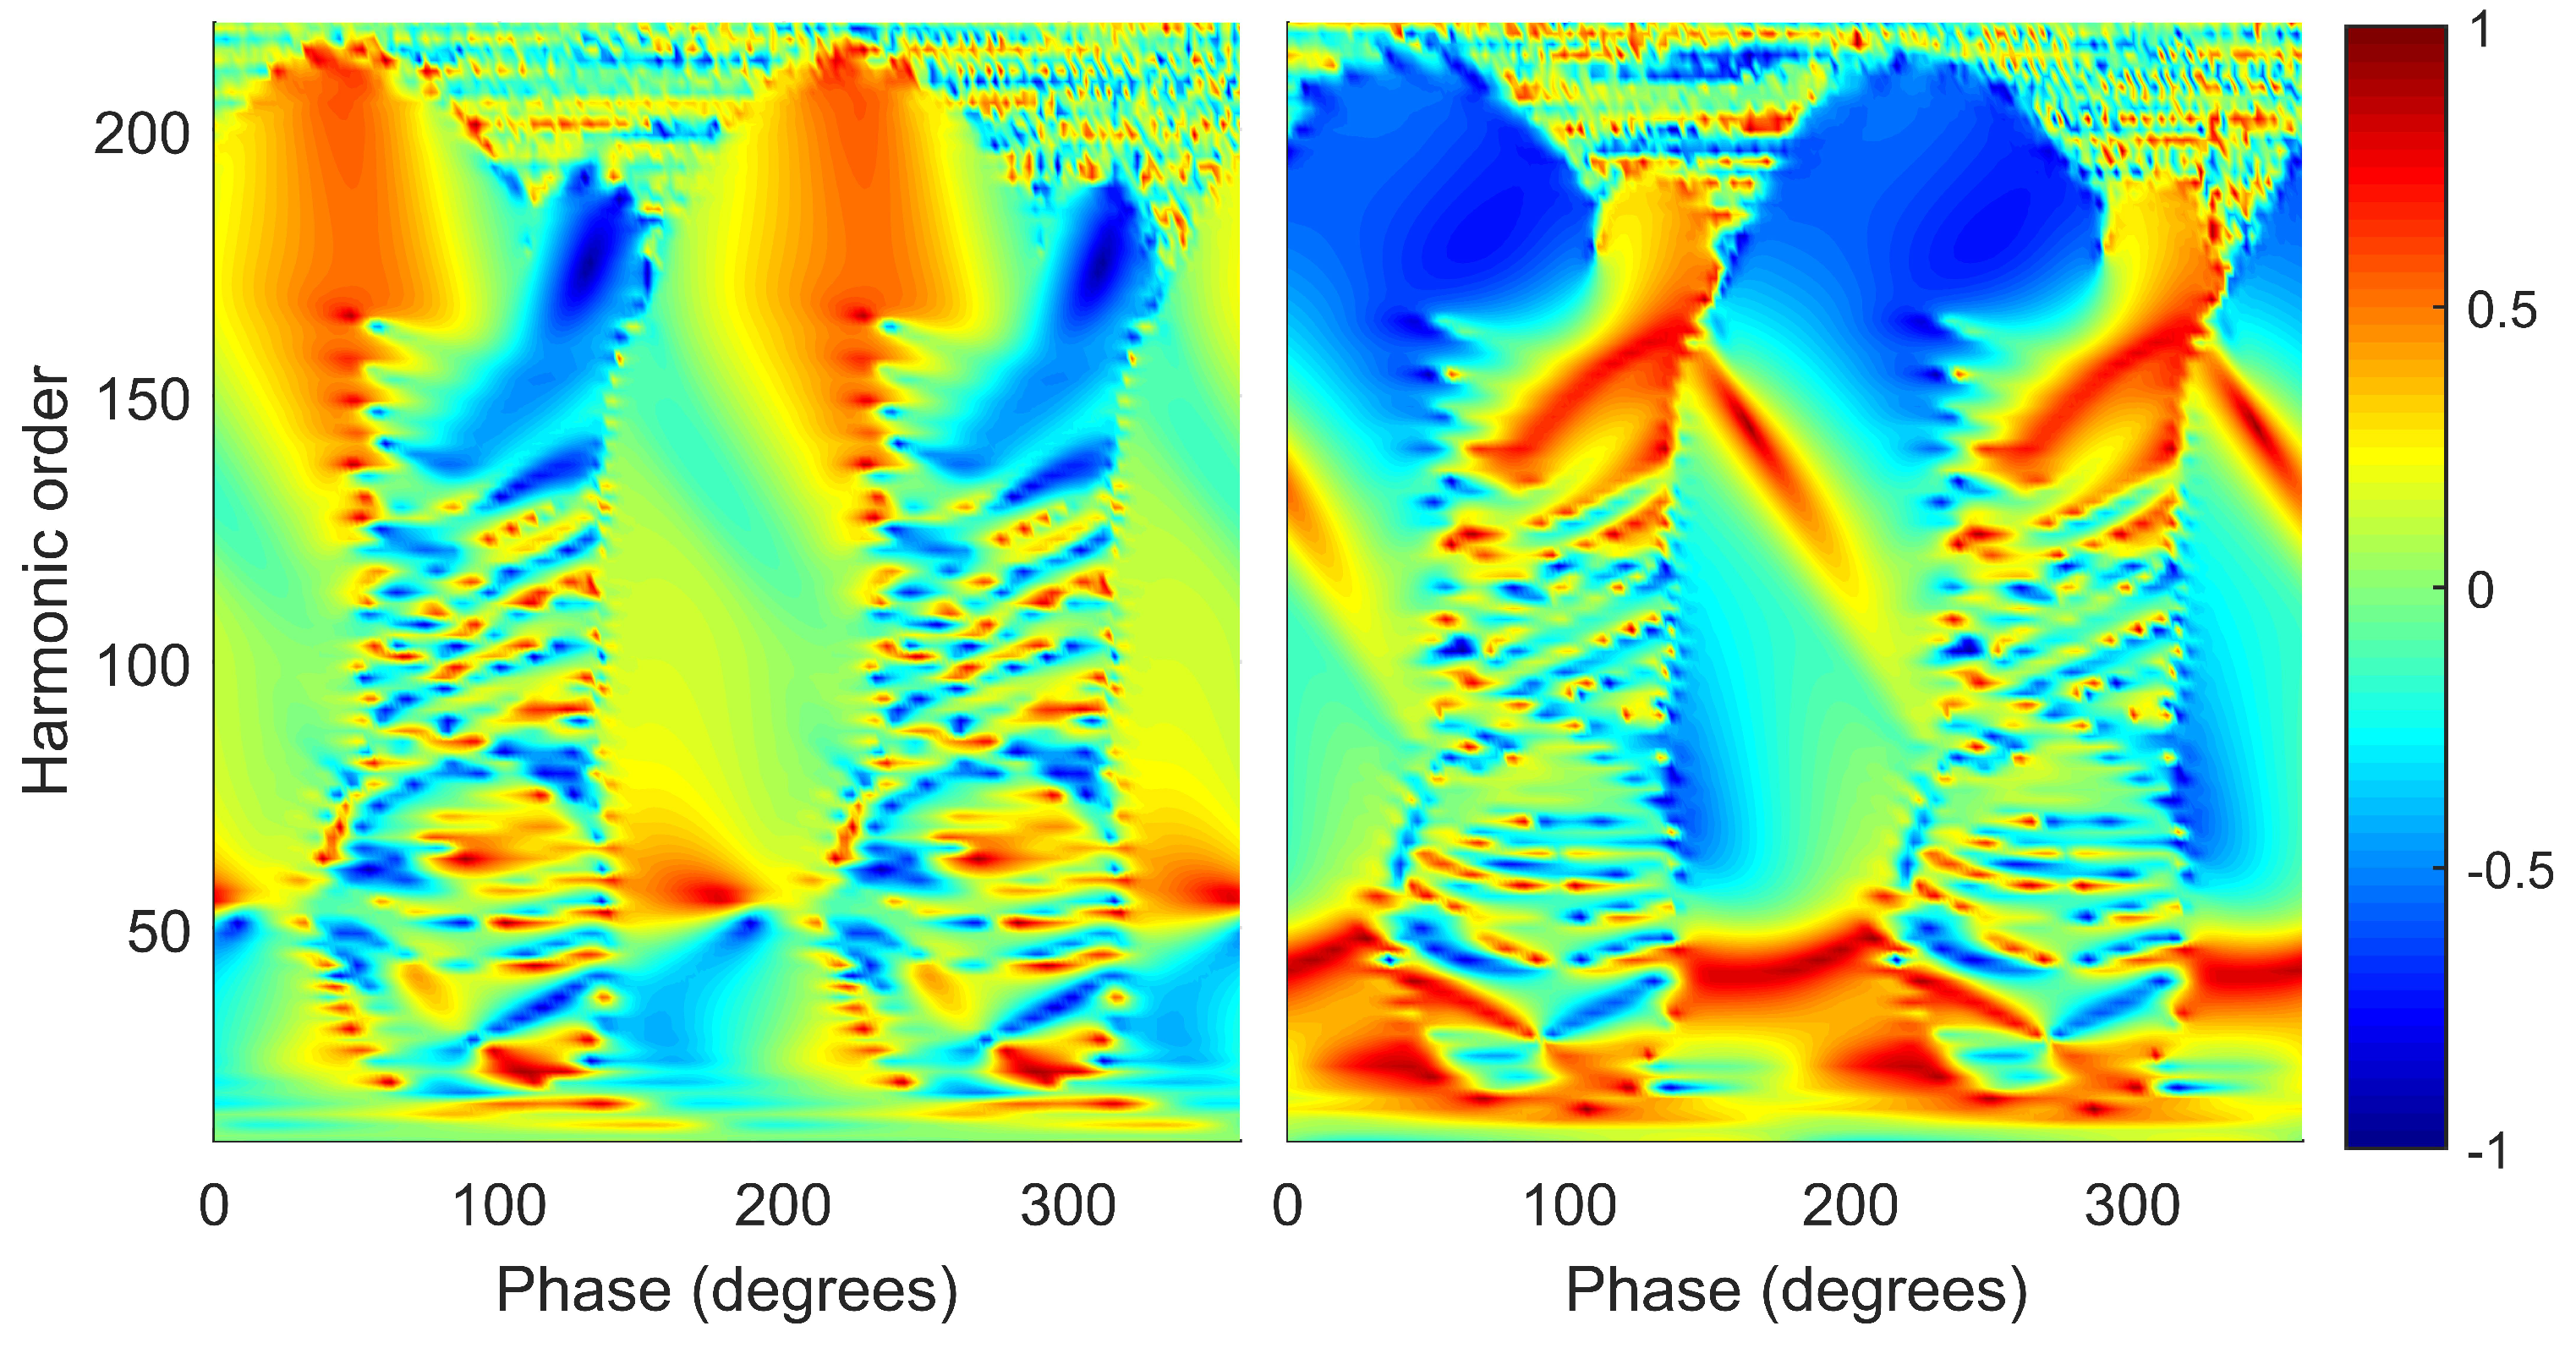
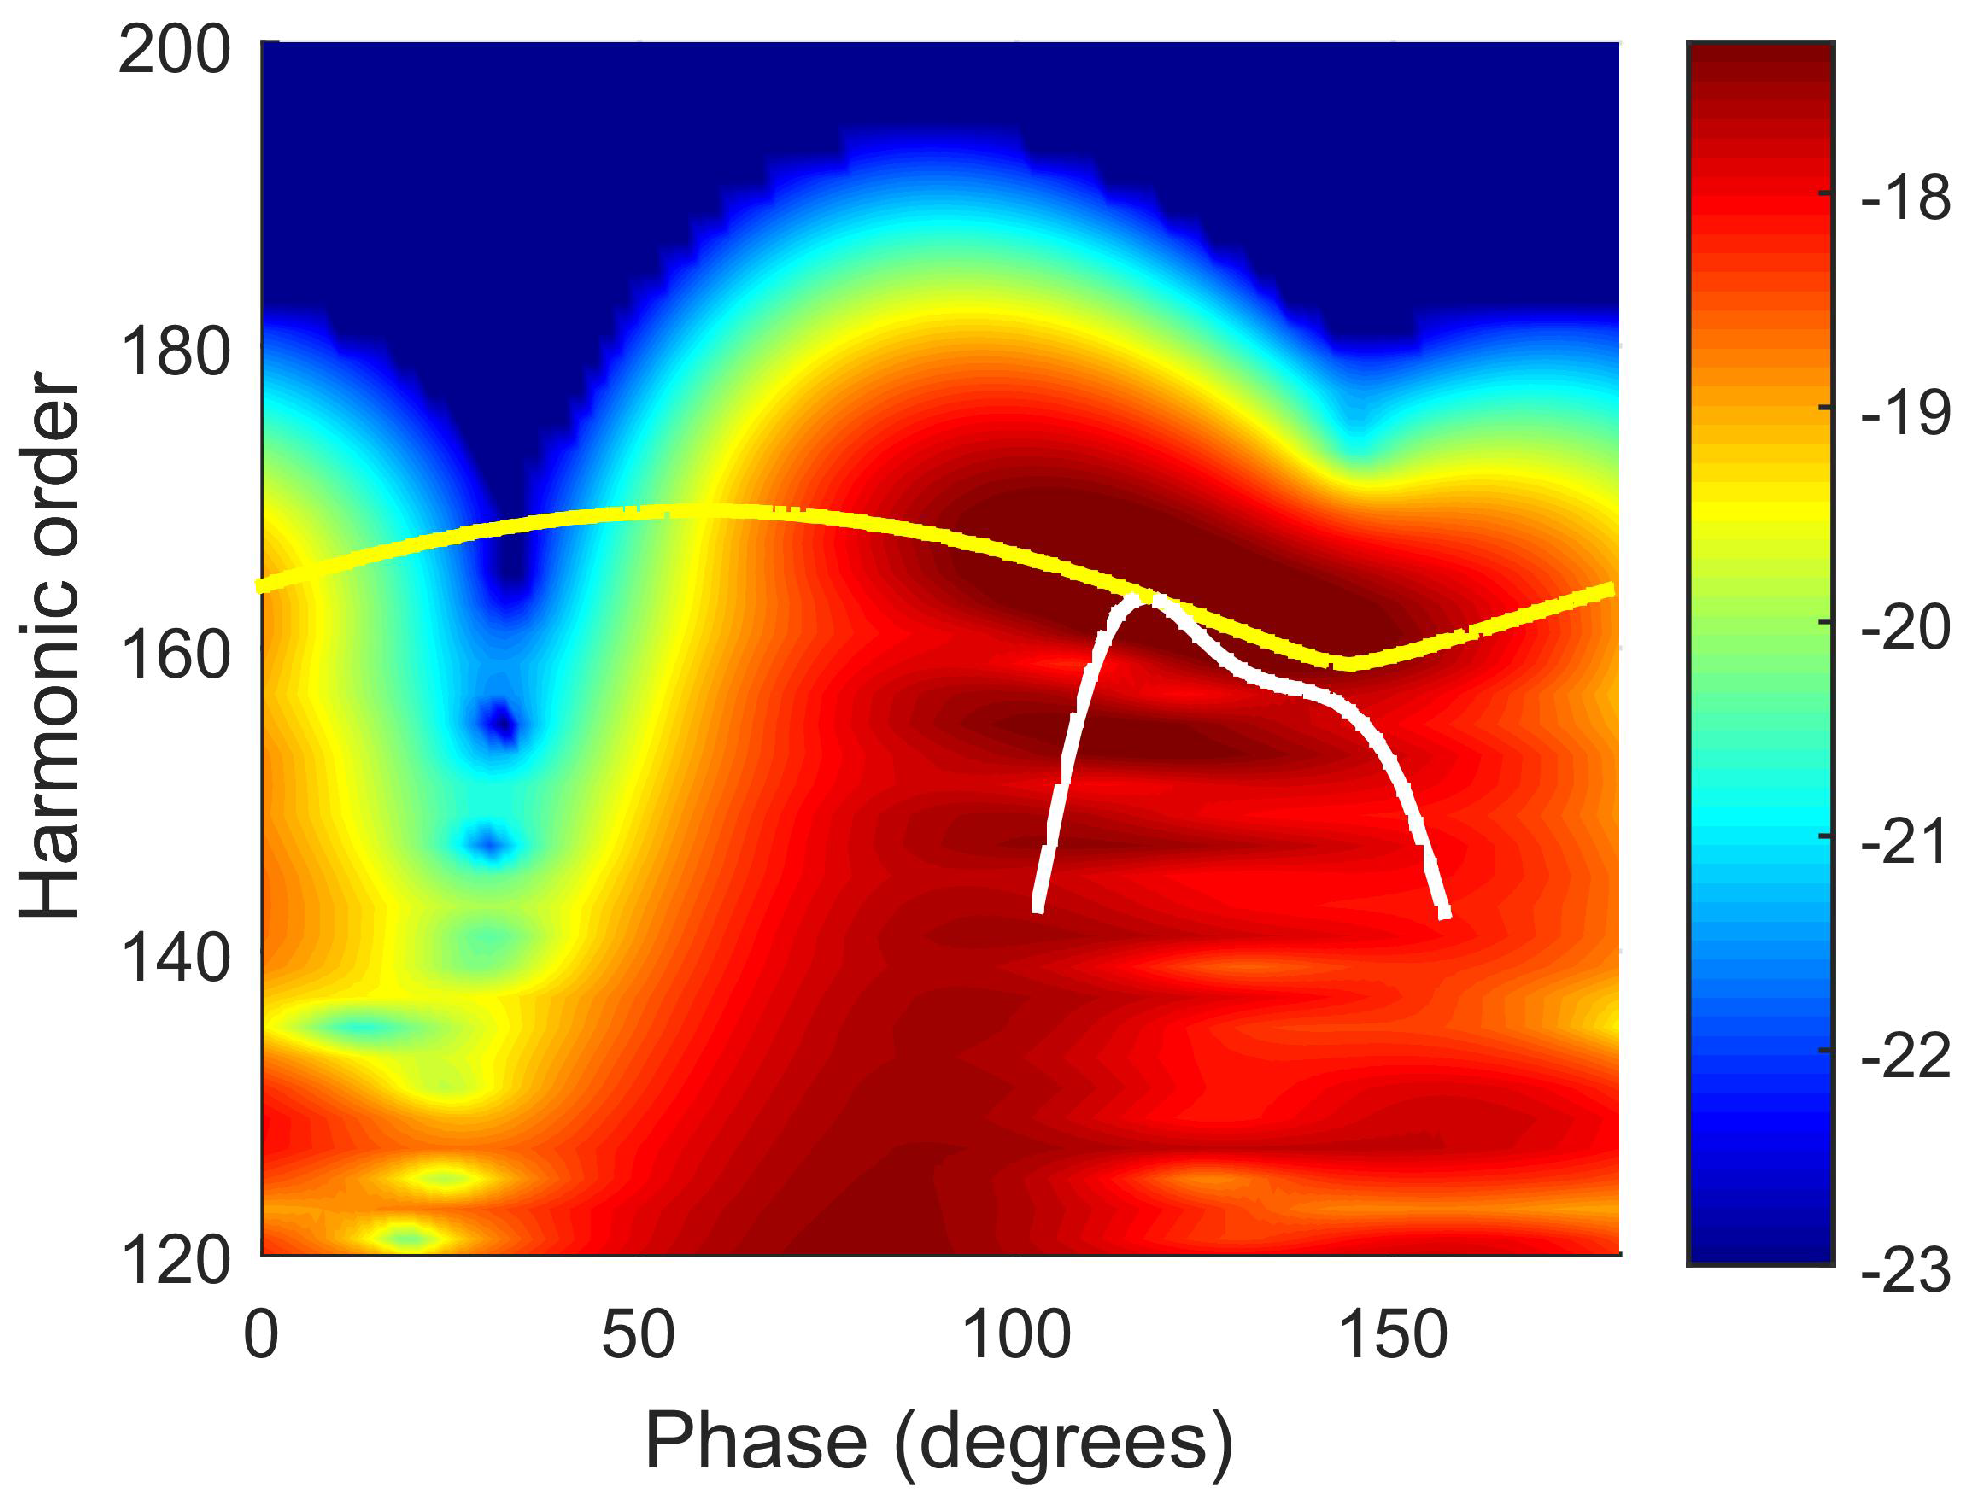
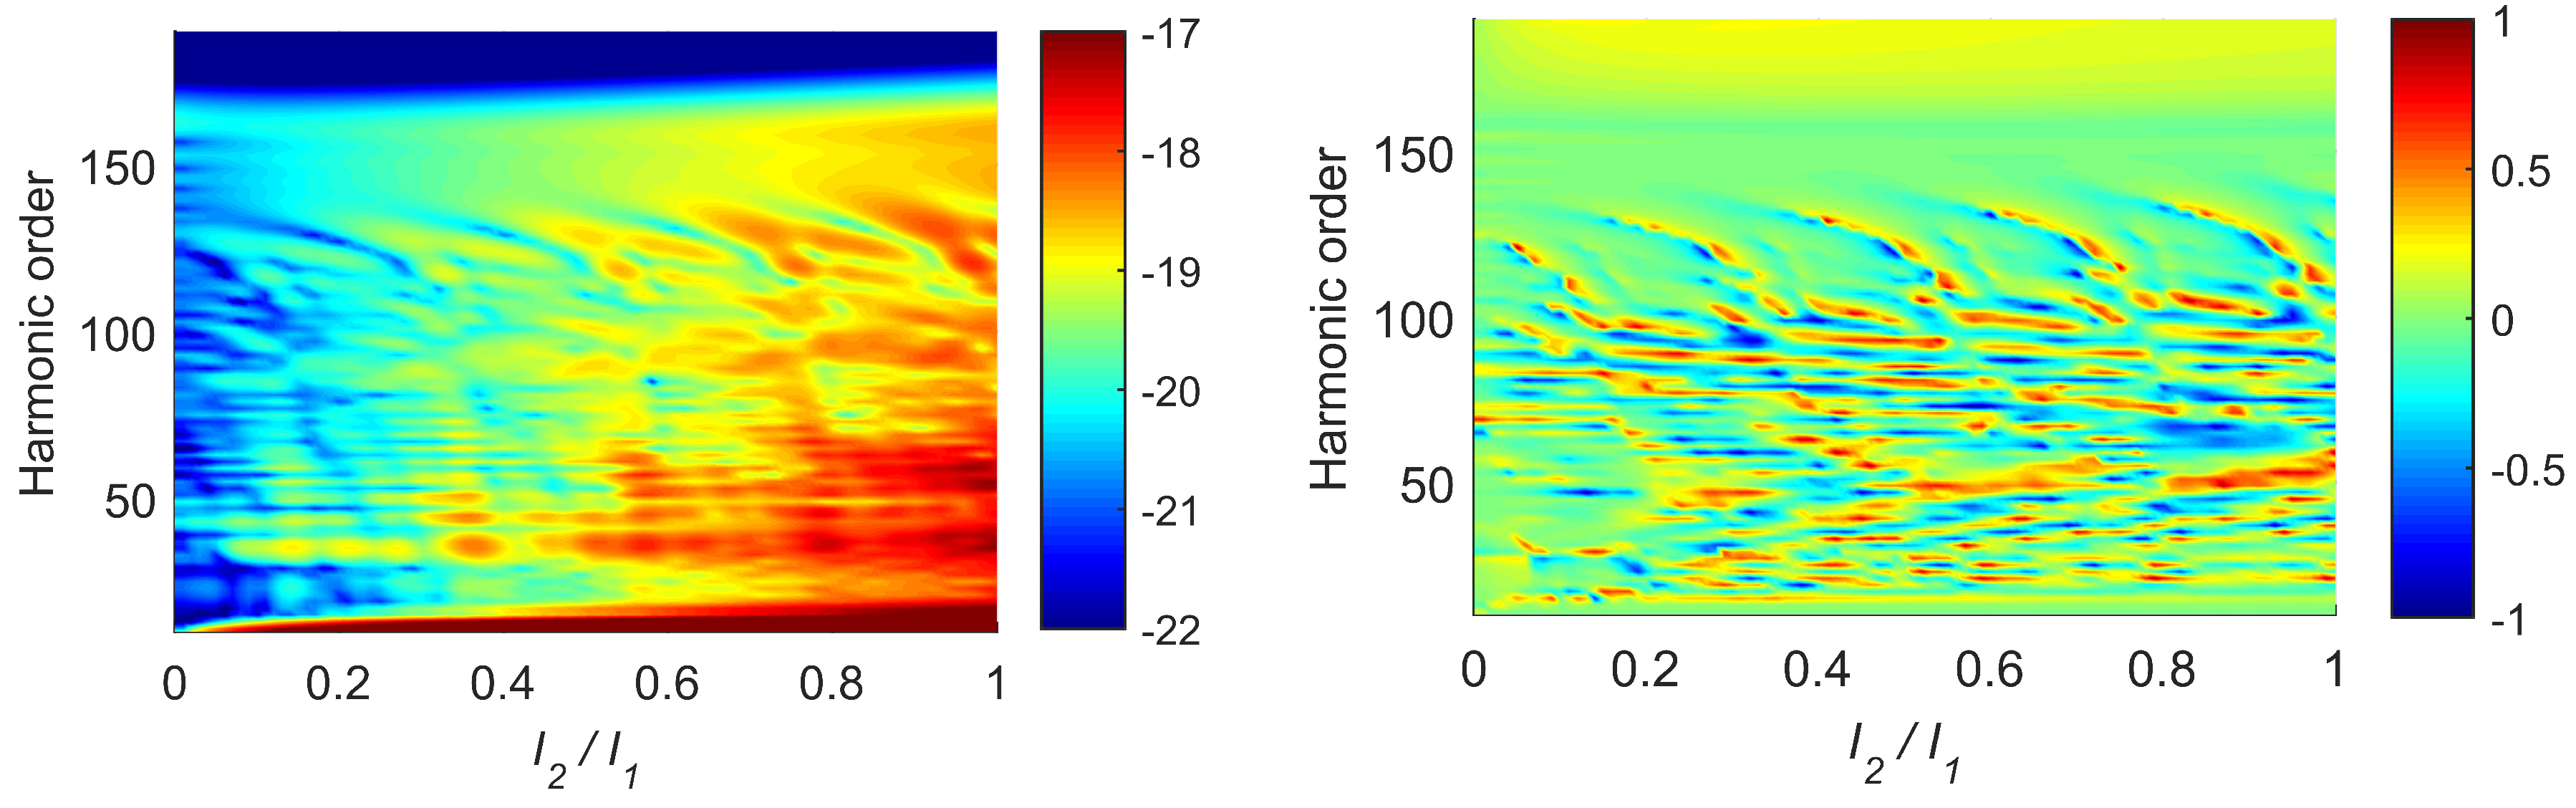
3.1. Harmonic Emission Rate and Ellipticity as Functions of the Relative Phase φ

The high-order harmonic emission rate and ellipticity strongly depend on the relative phase φ between the OTC laser field components. We analyze separately the cases of the ω 2 ω and ω 3 ω OTC fields.

3.1.1. ω 2 ω OTC Field

First, we analyze the high-order harmonic spectra for the ω 2 ω OTC laser field. The time transformation t t + T / 2 changes the sign of the Lz component of the laser field, while the Lx component remains unchanged. As a consequence, both odd and even harmonics are emitted. The Lz ( Lx ) component of the OTC laser field generates the odd (even) harmonics. In Figure 2, we present the logarithm of the harmonic emission rate as a function of the harmonic order and the relative phase φ between the laser-field components (left) and the logarithm of the emission rate for even harmonics as a function of the harmonic order for the specified relative phases (right). The molecular orientation angle is θ L = 45 . In the left panel of Figure 2, all high-harmonics are presented. It is clear that for certain relative phases the harmonic emission rate is low. The shape of the harmonic yield strongly depends on the relative phase. To illustrate this, we present the harmonic emission rate of even harmonics as a function of the harmonic order for the relative phases φ = 0 , 60 and 130 . When the relative phase is φ = 0 , the shape of the spectra is unusual. Following a typical fast decrease for the low-order harmonics, the spectrum exhibits an intensity increase with a maximum near the harmonic n = 120 . This is similar to the behavior of the harmonic spectra for the atomic targets [23]. For the relative phase φ = 60 , the spectrum forms a typical plateau with a sharp cutoff. The emission rate slightly increases in the cutoff region. Finally, the relative phase φ = 130 corresponds to the region where the harmonic emission rate is low. The odd harmonics exhibit a similar behavior.
To analyze the ellipticity of the emitted harmonics, it is illustrative to present it as a function of the relative phase and the harmonic order separately for odd and even harmonics. The left (right) panel of Figure 3 shows the harmonic ellipticity as a function of the harmonic order and the relative phase for odd (even) harmonics. There are regions where both the harmonic emission rate and the ellipticity are large. These regions are important for applications, as explained in the Introduction.

3.1.2. ω 3 ω OTC Field

Now, we analyze the high-order harmonic spectra for the ω 3 ω OTC laser field with equal intensities of the laser-field components. In this case, the time transformation t t + T / 2 leads to the electric field transformation E ( t ) E ( t ) , which is the same as for a monochromatic linearly polarized laser field. As a consequence, only odd harmonics are emitted. For the ω 3 ω OTC field, they are elliptically polarized both for atomic and molecular targets. In Figure 4, we present the logarithm of the harmonic emission rate (top) and the ellipticity of the emitted harmonics (bottom) as a function of the harmonic order and the relative phase φ between the laser-field components. The left column corresponds to the N 2 molecule with the molecular orientation angle θ L = 70 . The right column corresponds to the Ar atom, which has almost the same ionization potential as the N 2 molecule. For both targets, it is possible to find regions where the emission rate and the harmonic ellipticity are large. For the Ar atom target, the regions with large ellipticity are narrow, while, for the N 2 molecular target, it is possible to choose the orientation angle in such a way that the regions with large ellipticity are wider. An example is the region with the harmonic order around sixty-five and the relative phase from zero to seventy degrees. For the N 2 molecular target, the regions with large ellipticity also exist just below the cutoff where the harmonic emission rate starts to decrease. Here, the relative contribution of the components of the T-matrix element becomes small, so that, according to the Equations (7)–(9), the harmonic ellipticity becomes large. This is analyzed in more detail below, when we explain the results presented in Figure 12.
The simple man’s model can be used to estimate the optimal parameters for efficient HHG. In addition, it can be used to estimate the maximal harmonic order. The classical model developed in Section 2.5 accounts for the possibility that the electron can be ionized and recombine either at the right or at the left atomic center. However, the contribution of the term which accounts for the scenario where the electron is ionized and recombined at different atomic centers is small for internuclear distances small in comparison with the electron excursion in the laser field. The electron excursion increases with the increase of the laser intensity and wavelength. To illustrate how the simple man’s model estimates the maximal harmonic order and the maximal emission rate, in Figure 5, we present the logarithm of the harmonic emission rate of the N 2 molecule, obtained using the ω 3 ω OTC laser field, as a function of the harmonic order and the relative phase. We include only the harmonics near the cutoff region. The molecular orientation angle is θ L = 0 . For this molecular orientation, the spectra are π periodic, so that we present only the results for the relative phase from zero to π . In this figure, we add a curve (white line) which determines the maximal harmonic intensity and a curve (yellow line) which corresponds to the maximal harmonic order. The curves for different values of s and s in Equations (16) and (20) are practically the same for the N 2 molecule. The white curve nicely follows the region with the highest harmonic emission rate, while the yellow curve gives the classical estimate of the maximal harmonic order. We see that for the relative phase around φ = 30 the classical model predicts the high-energy photons. However, the corresponding emission rate is low. This behavior is also present for the atomic targets [21]. To conclude, it is possible to use the classical model to approximately find the regions where the harmonic intensity is high, as well as estimate the cutoff position.

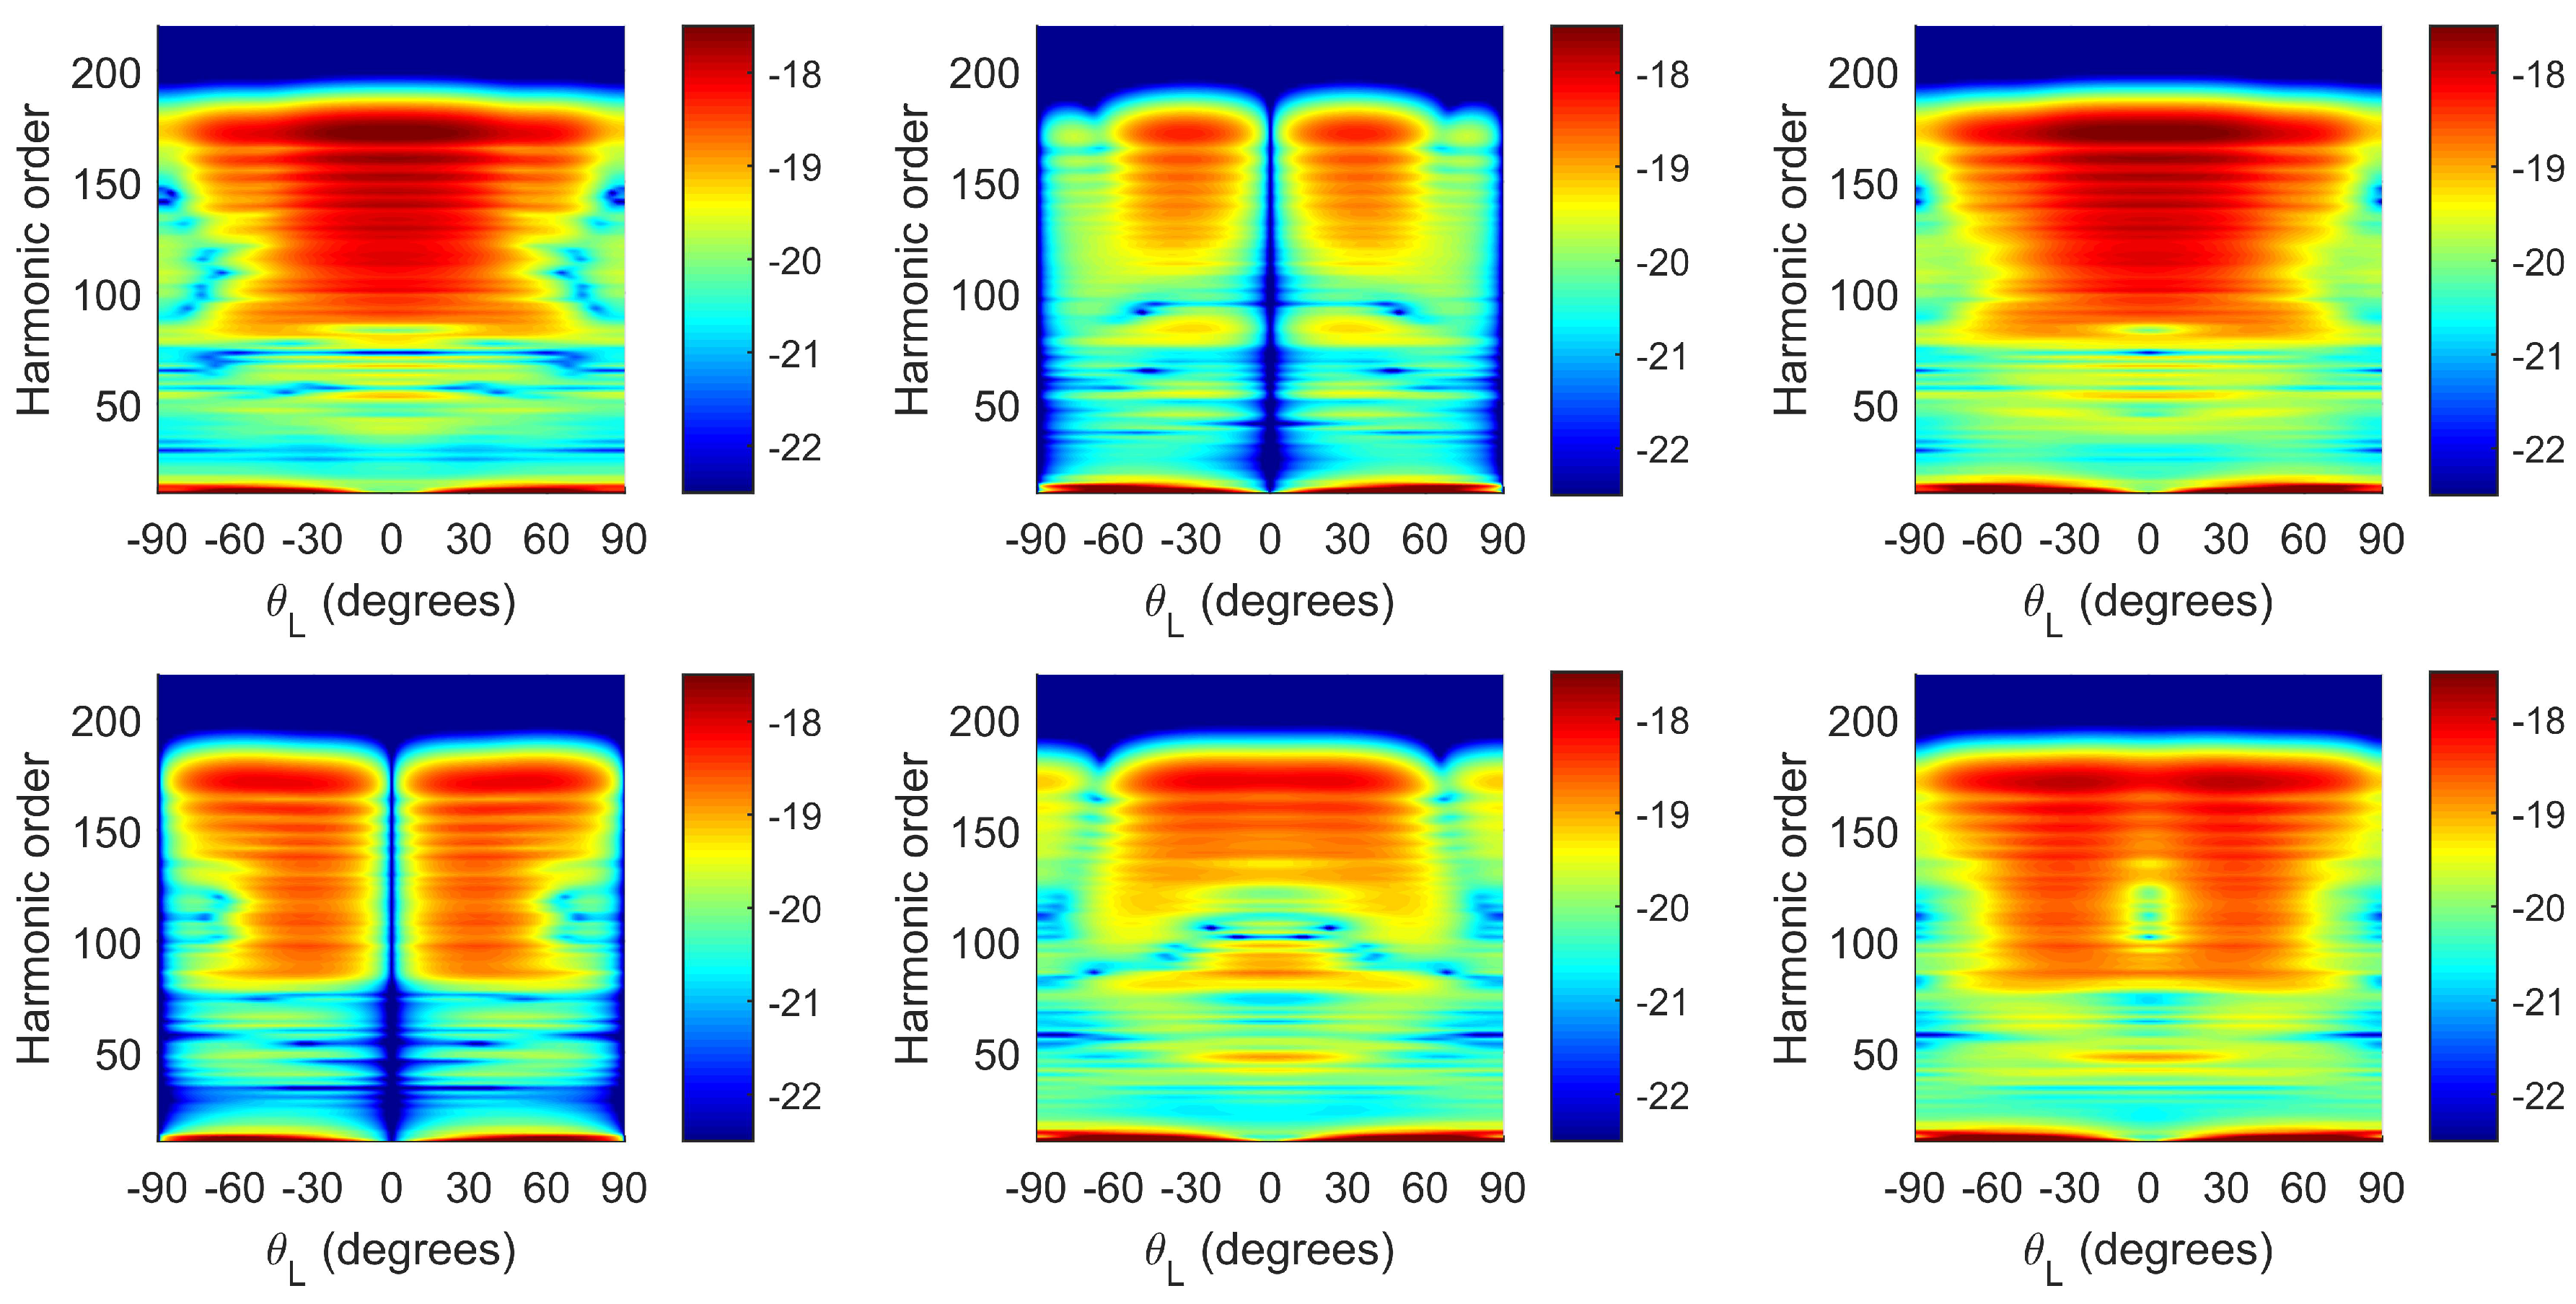
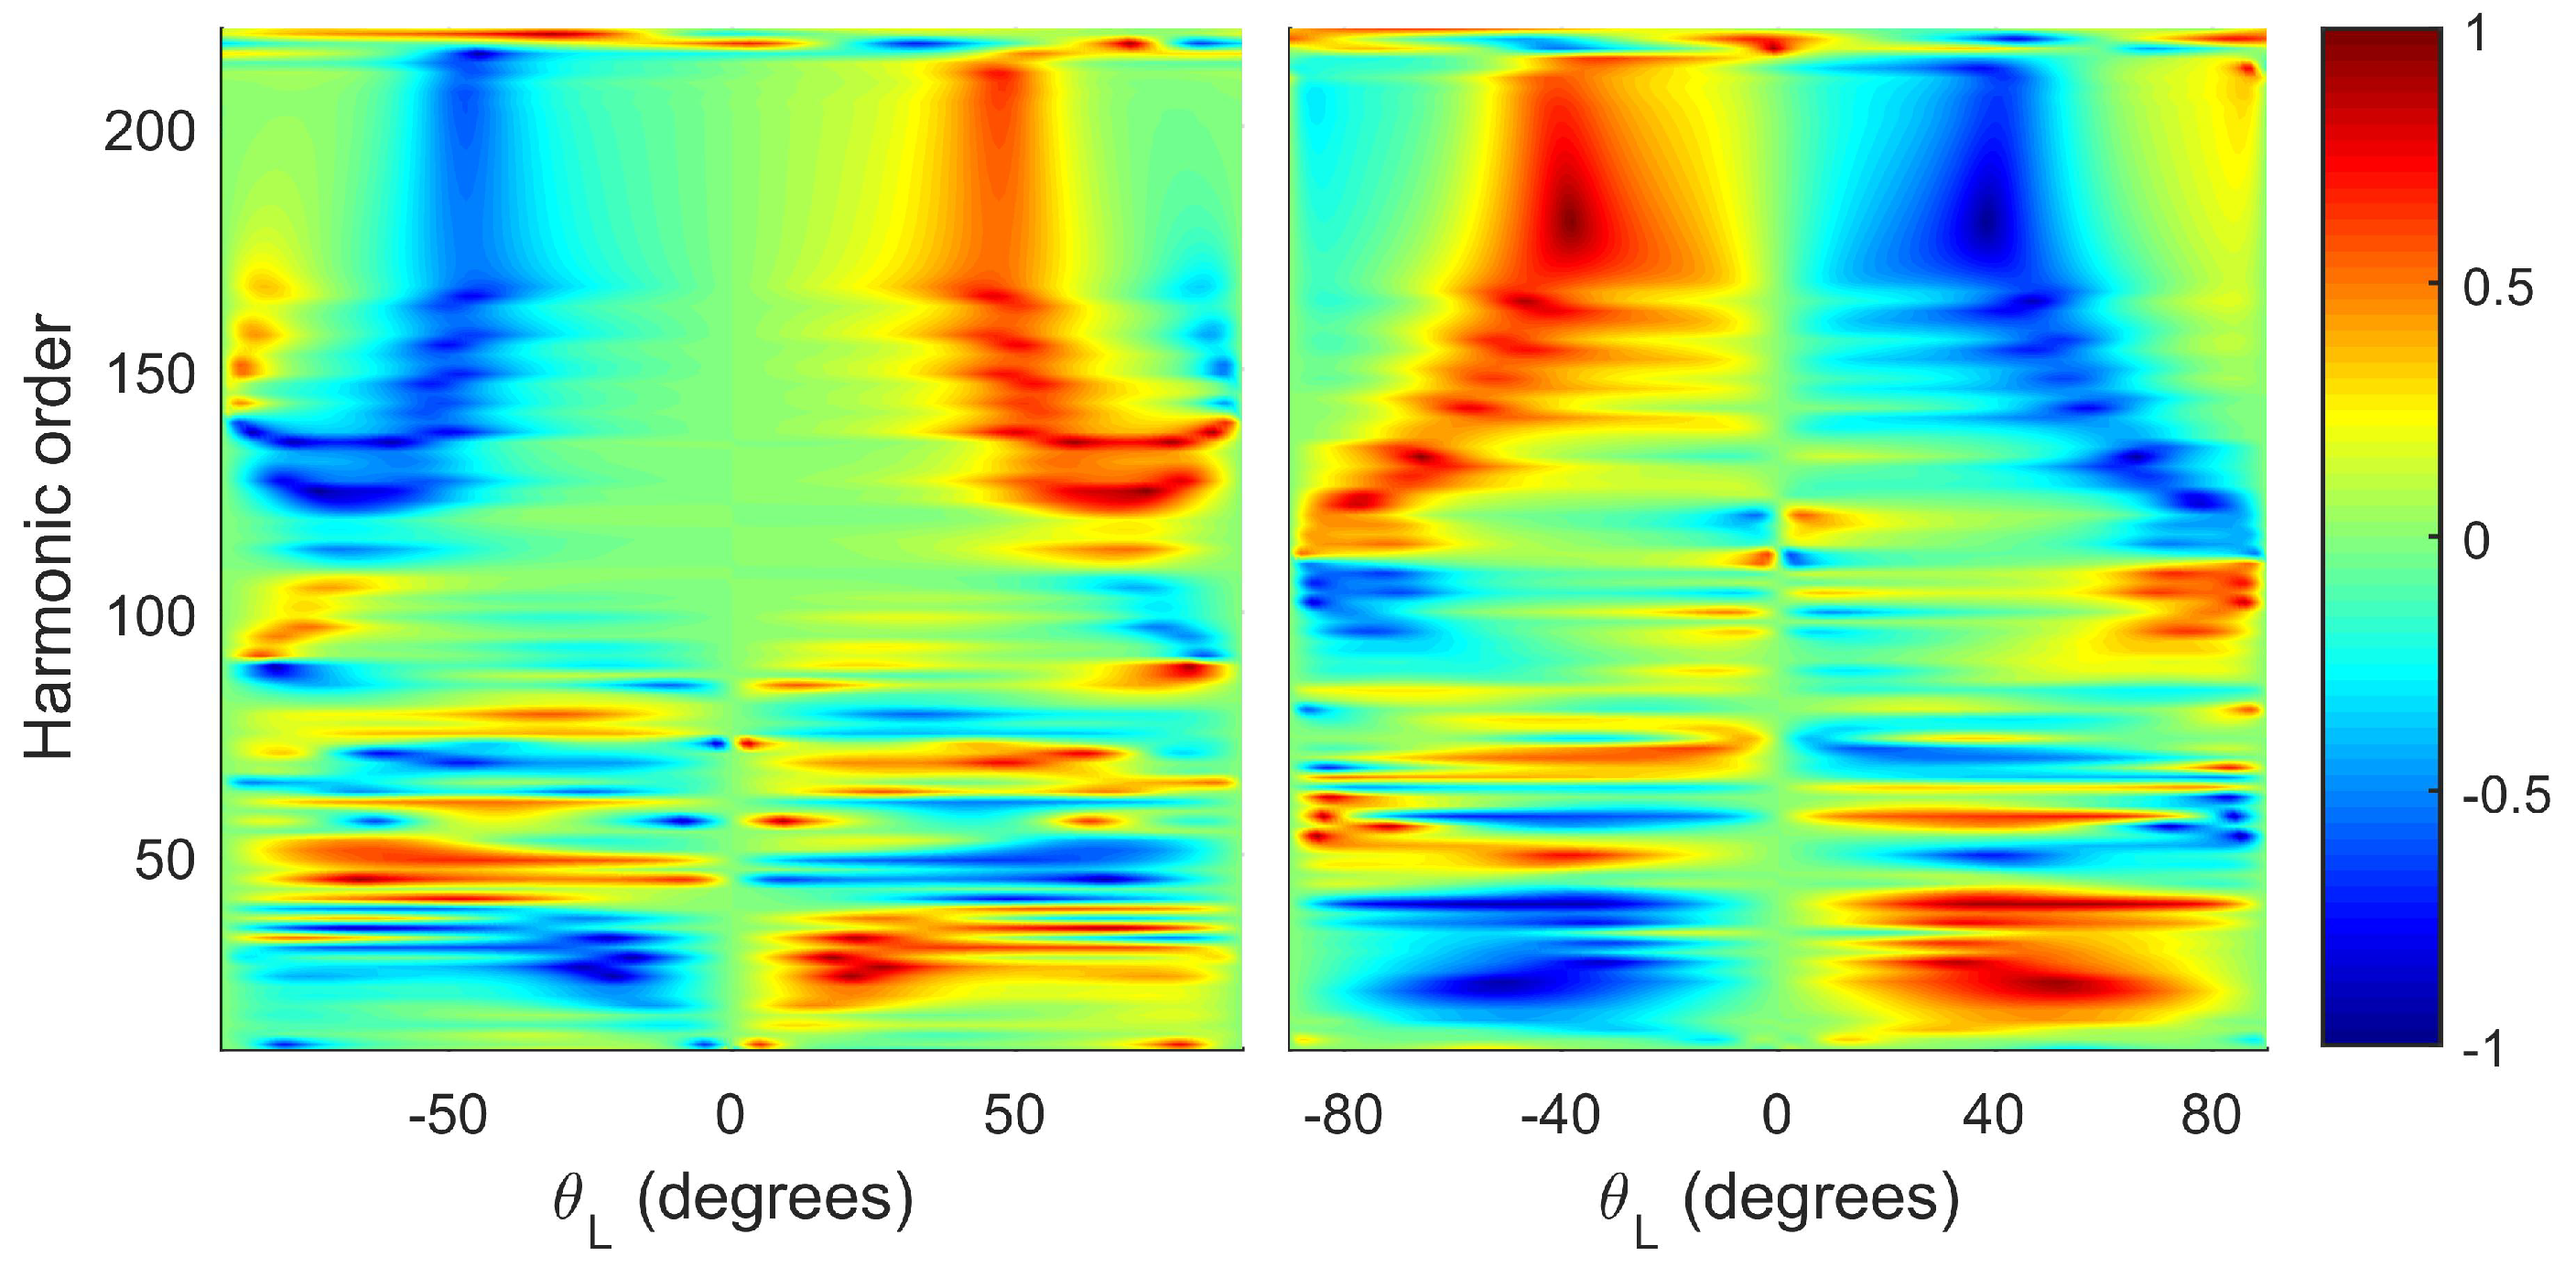
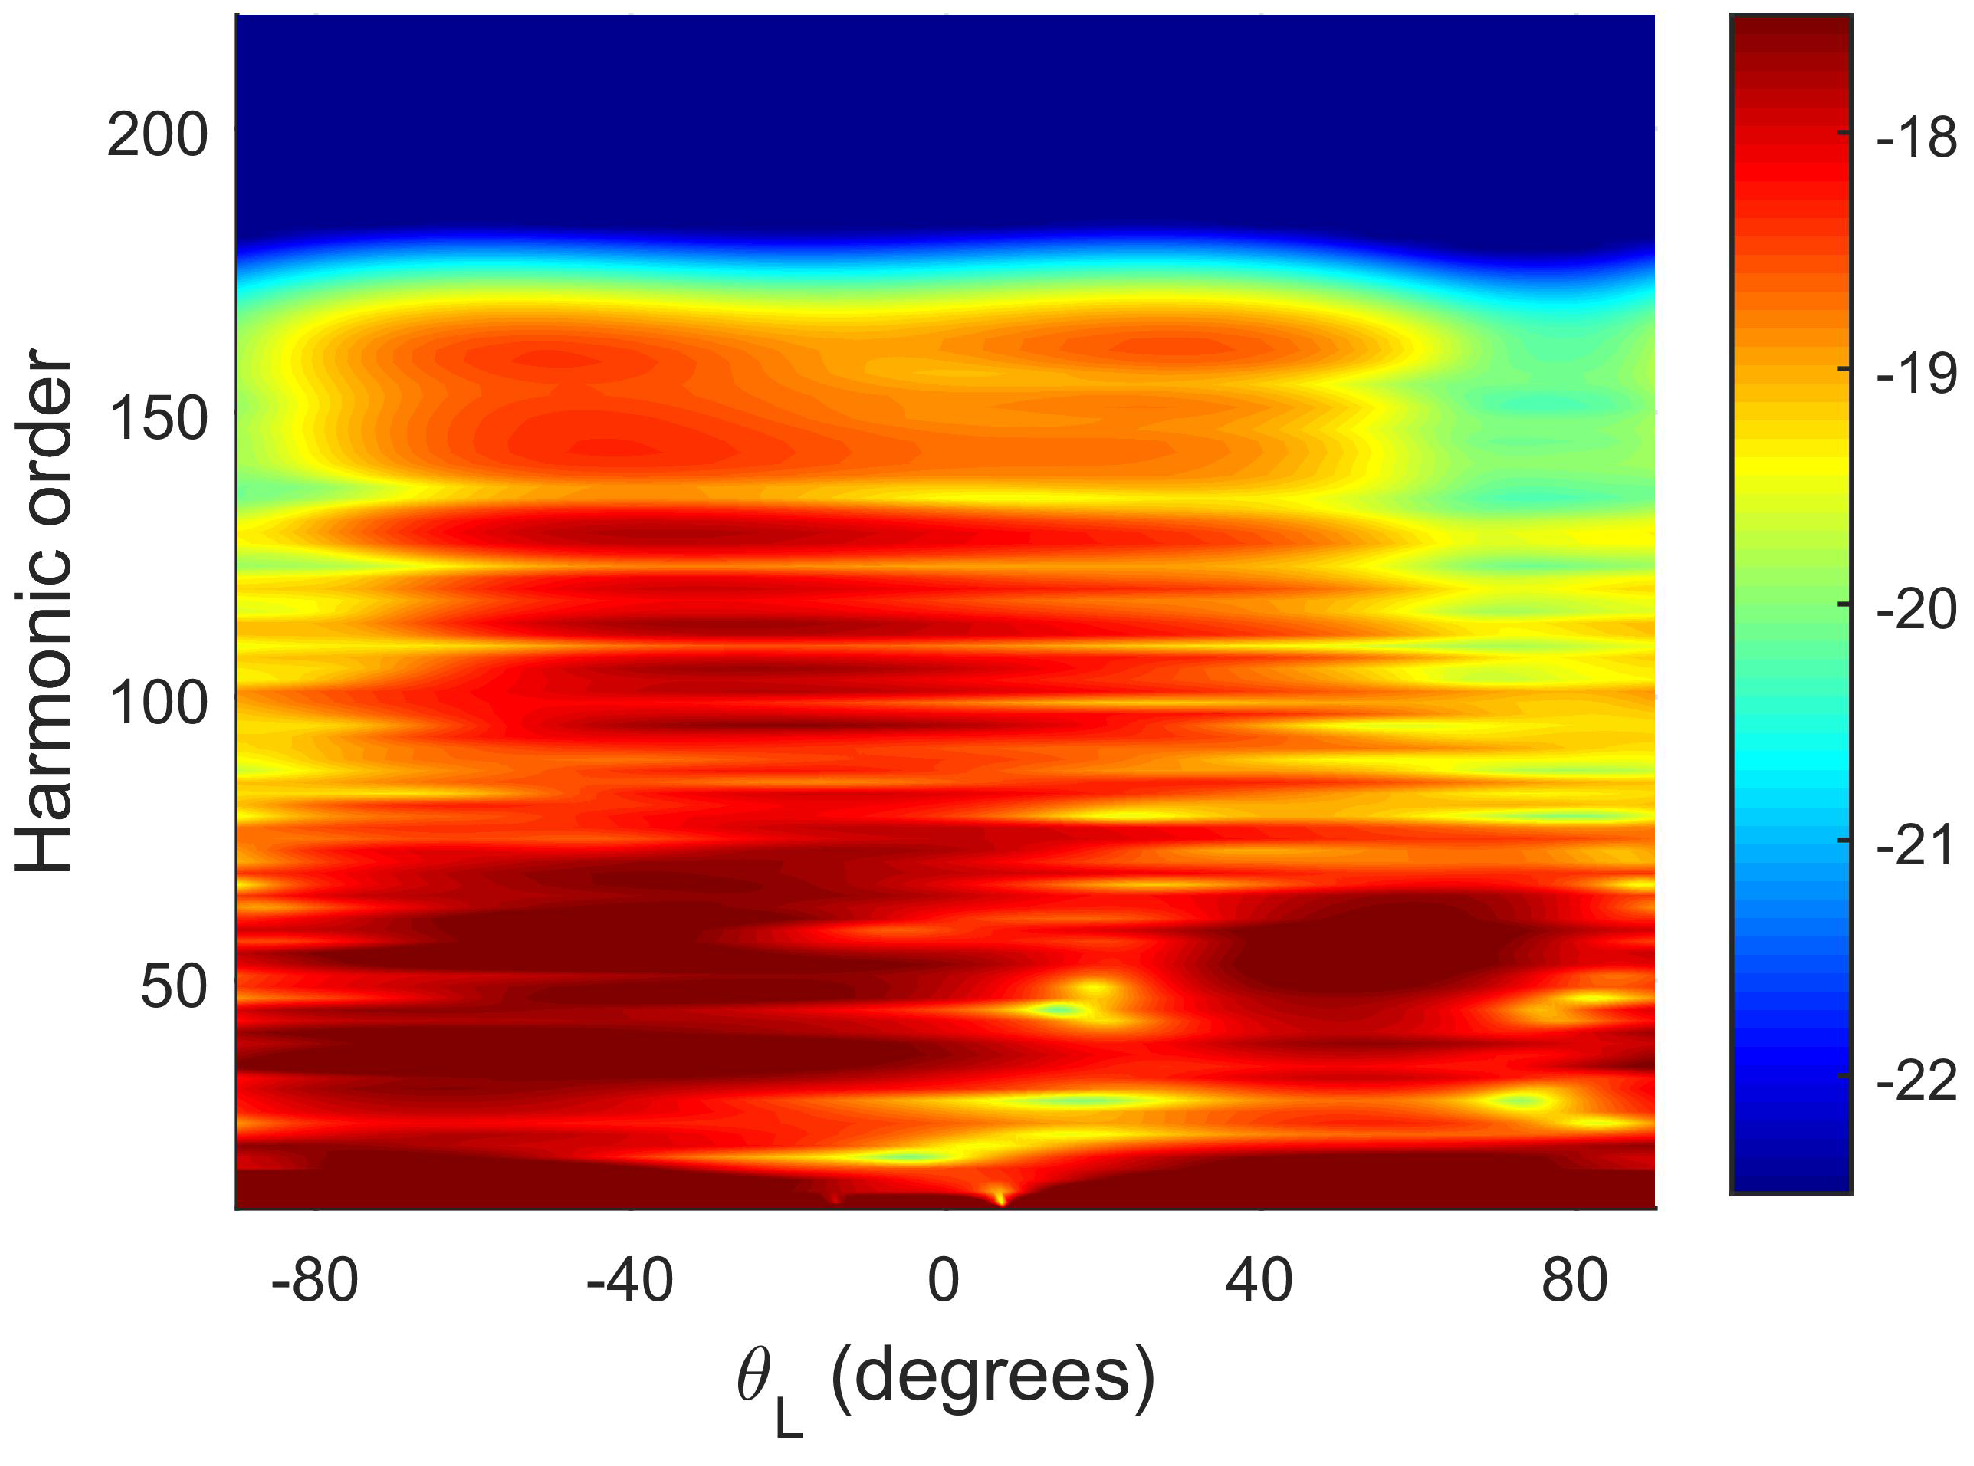
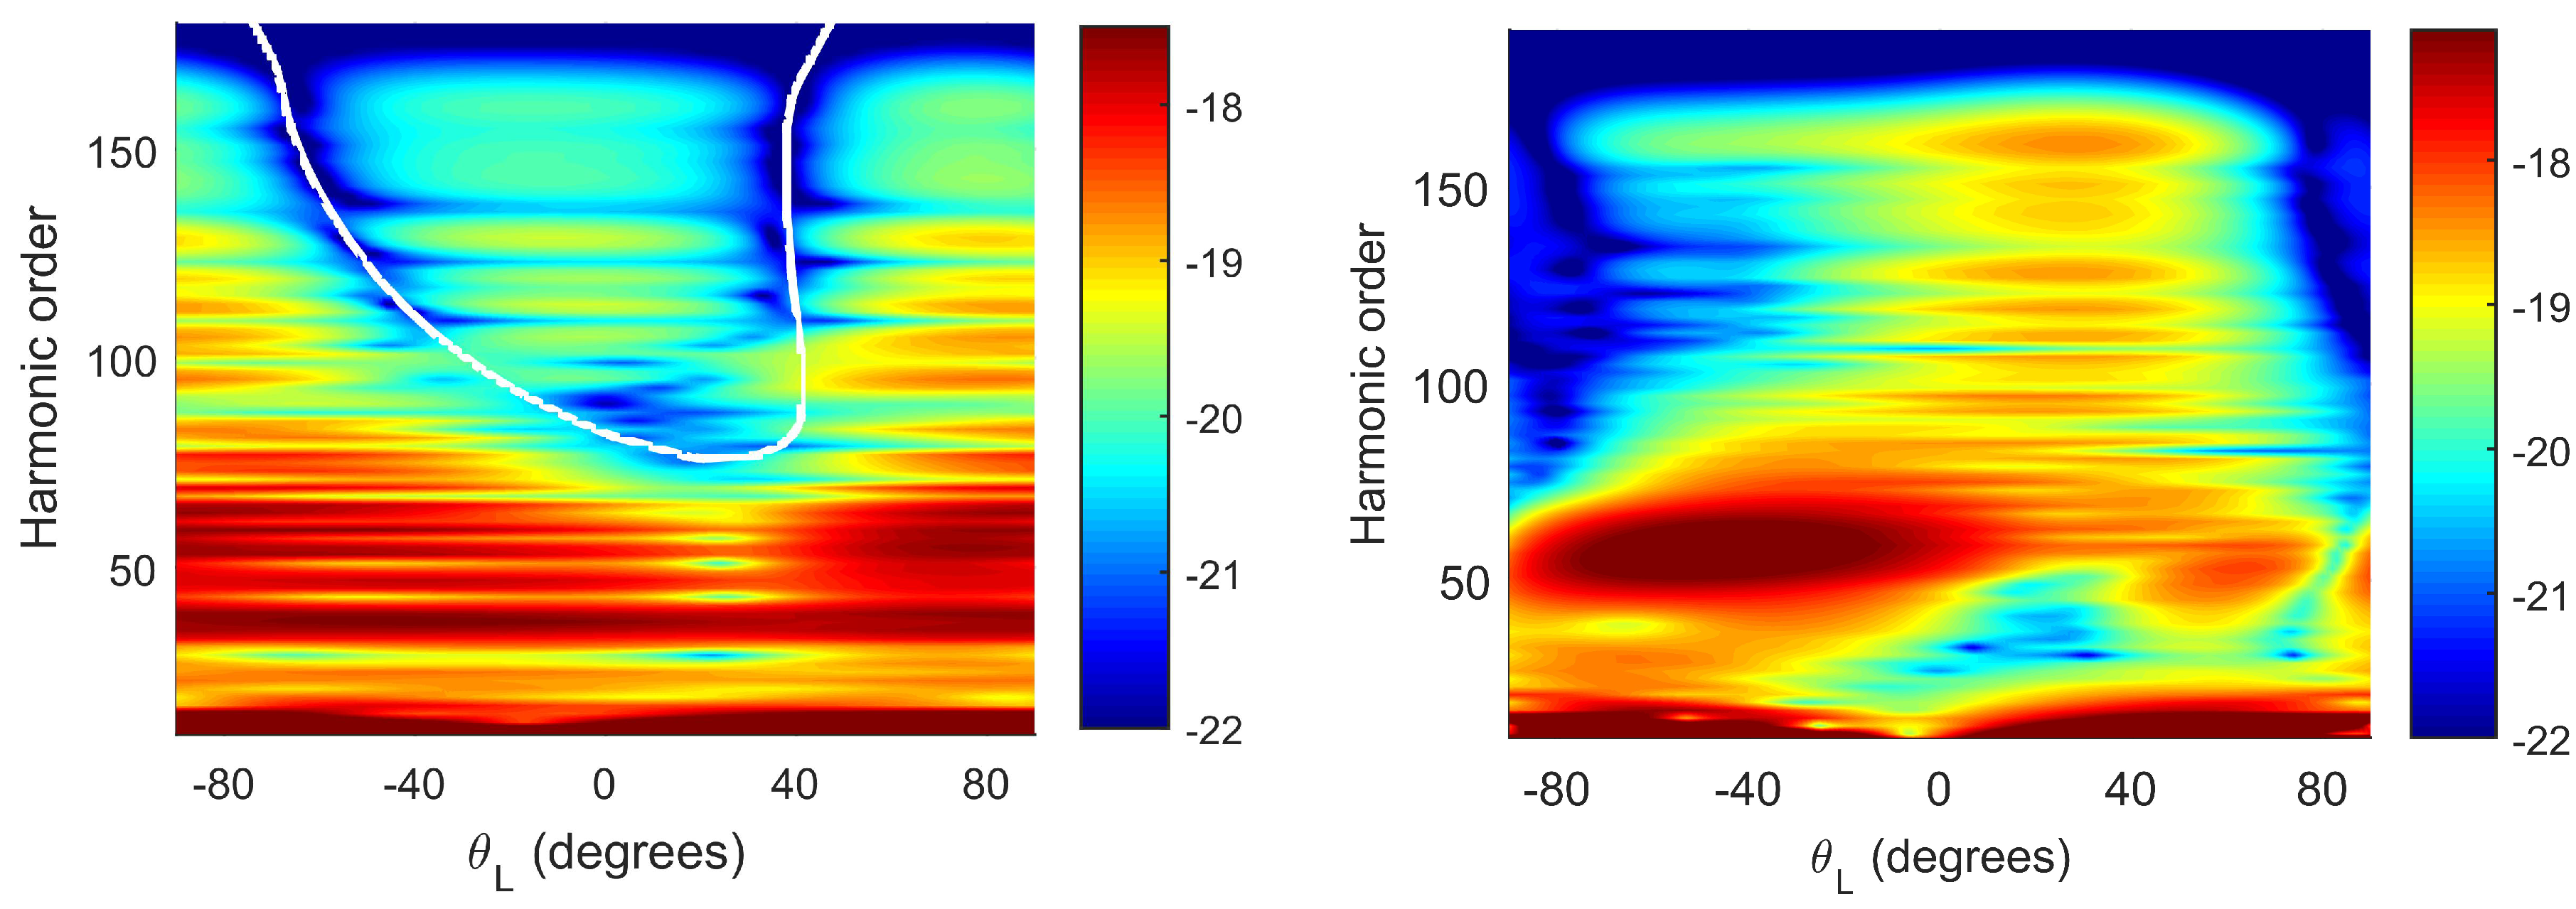
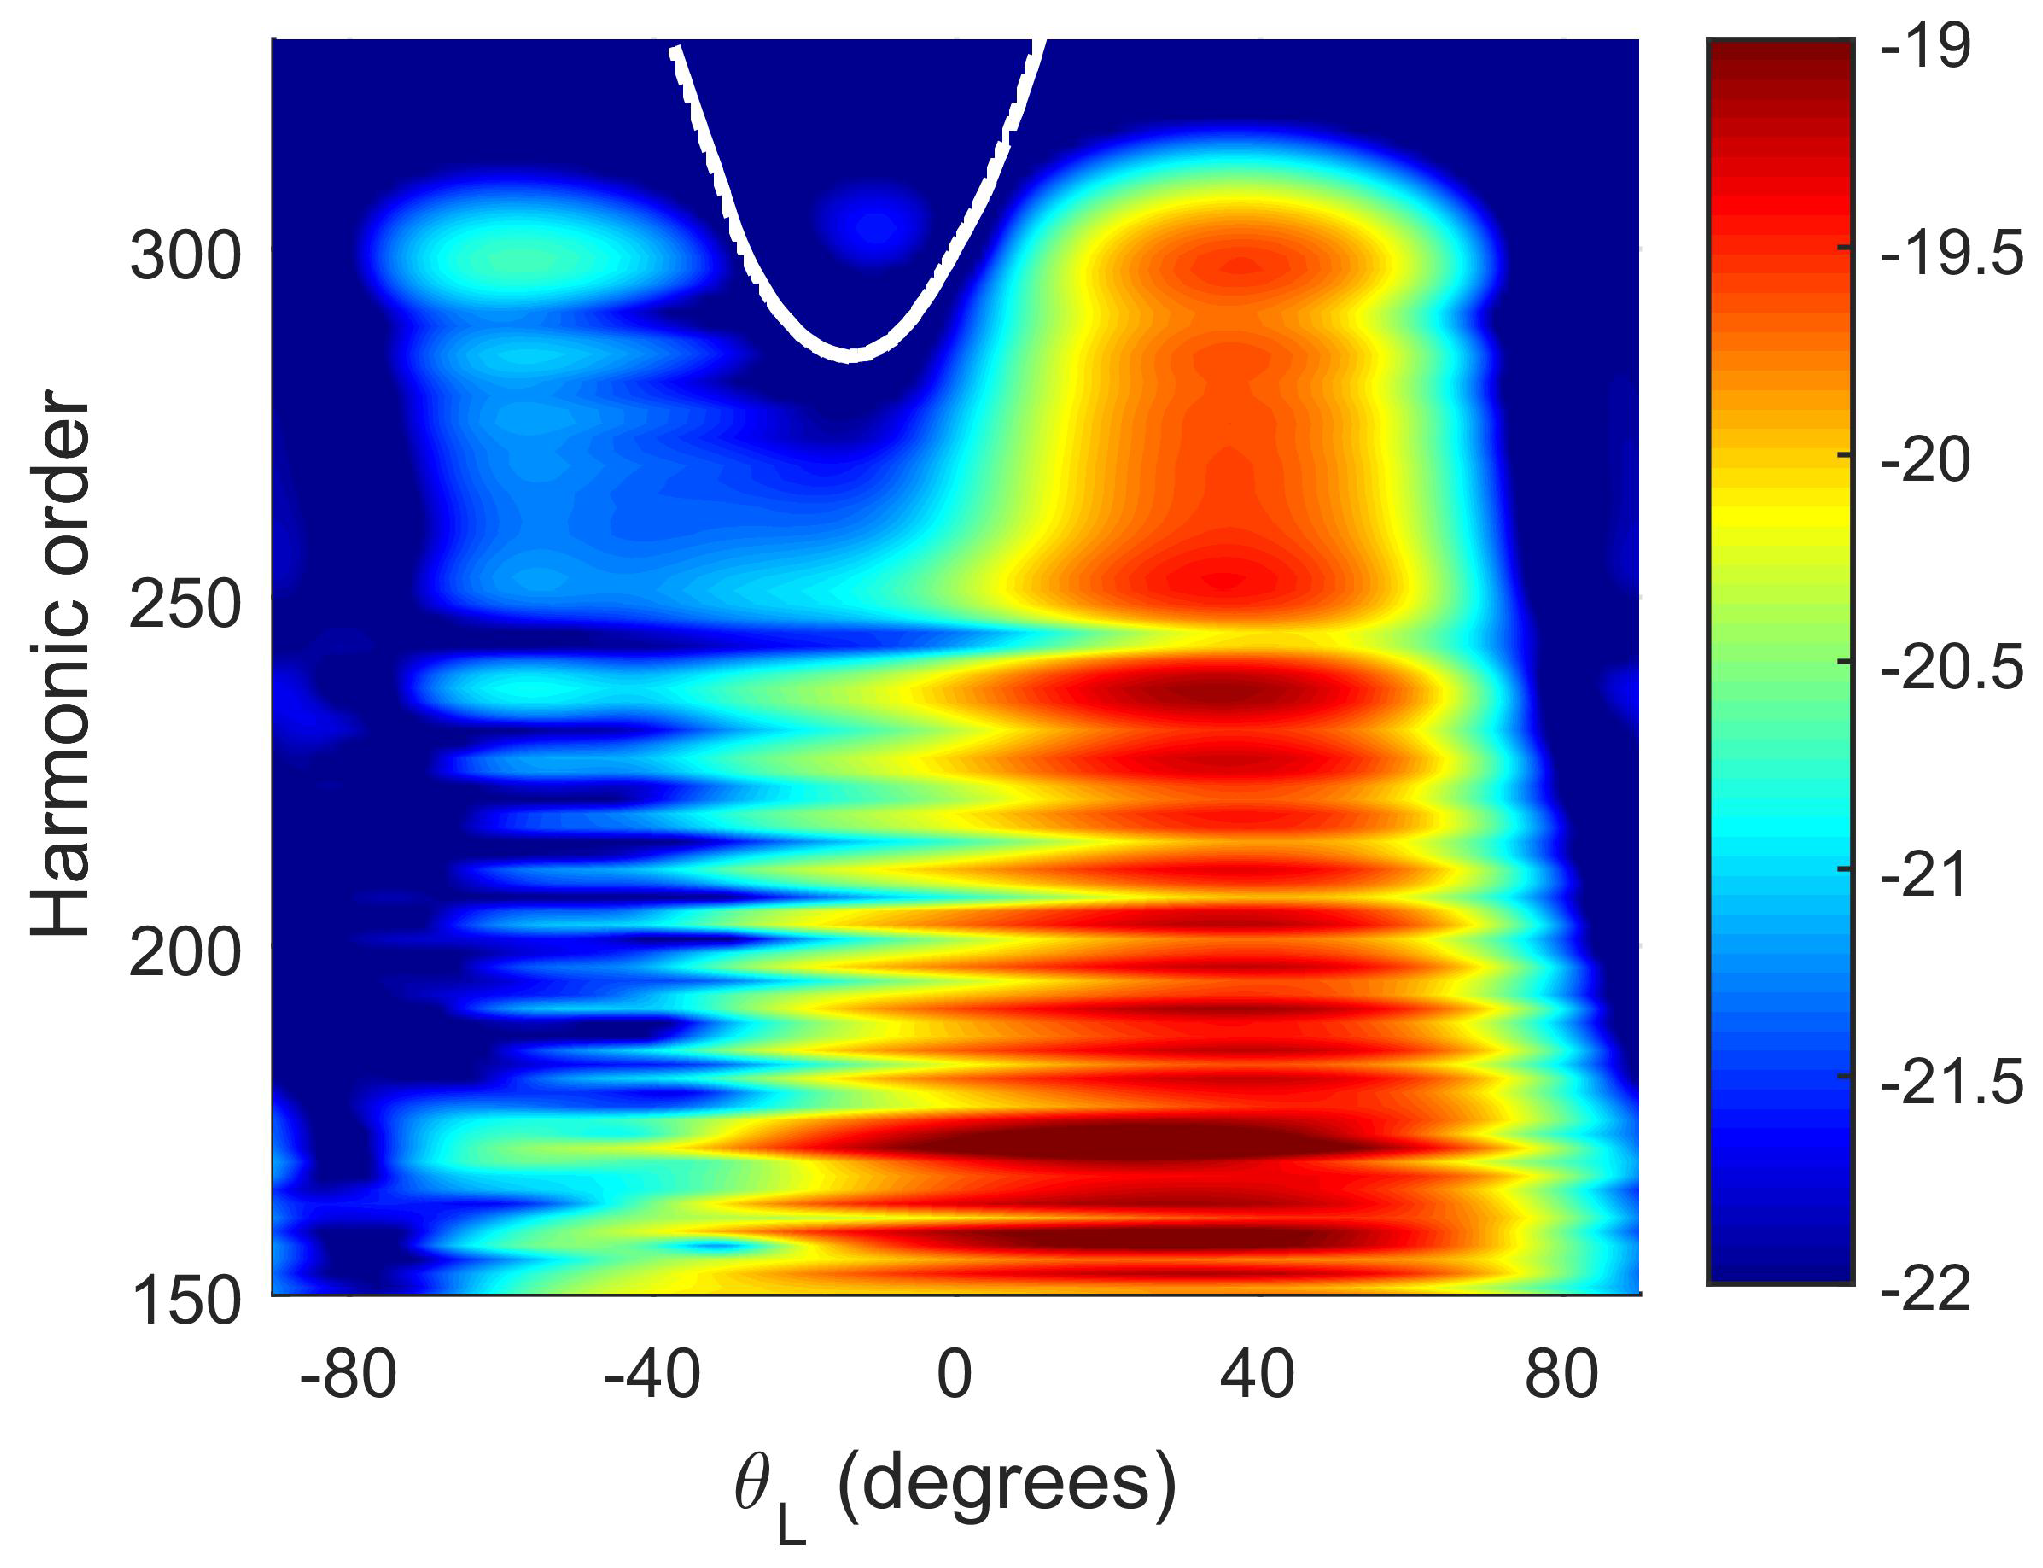
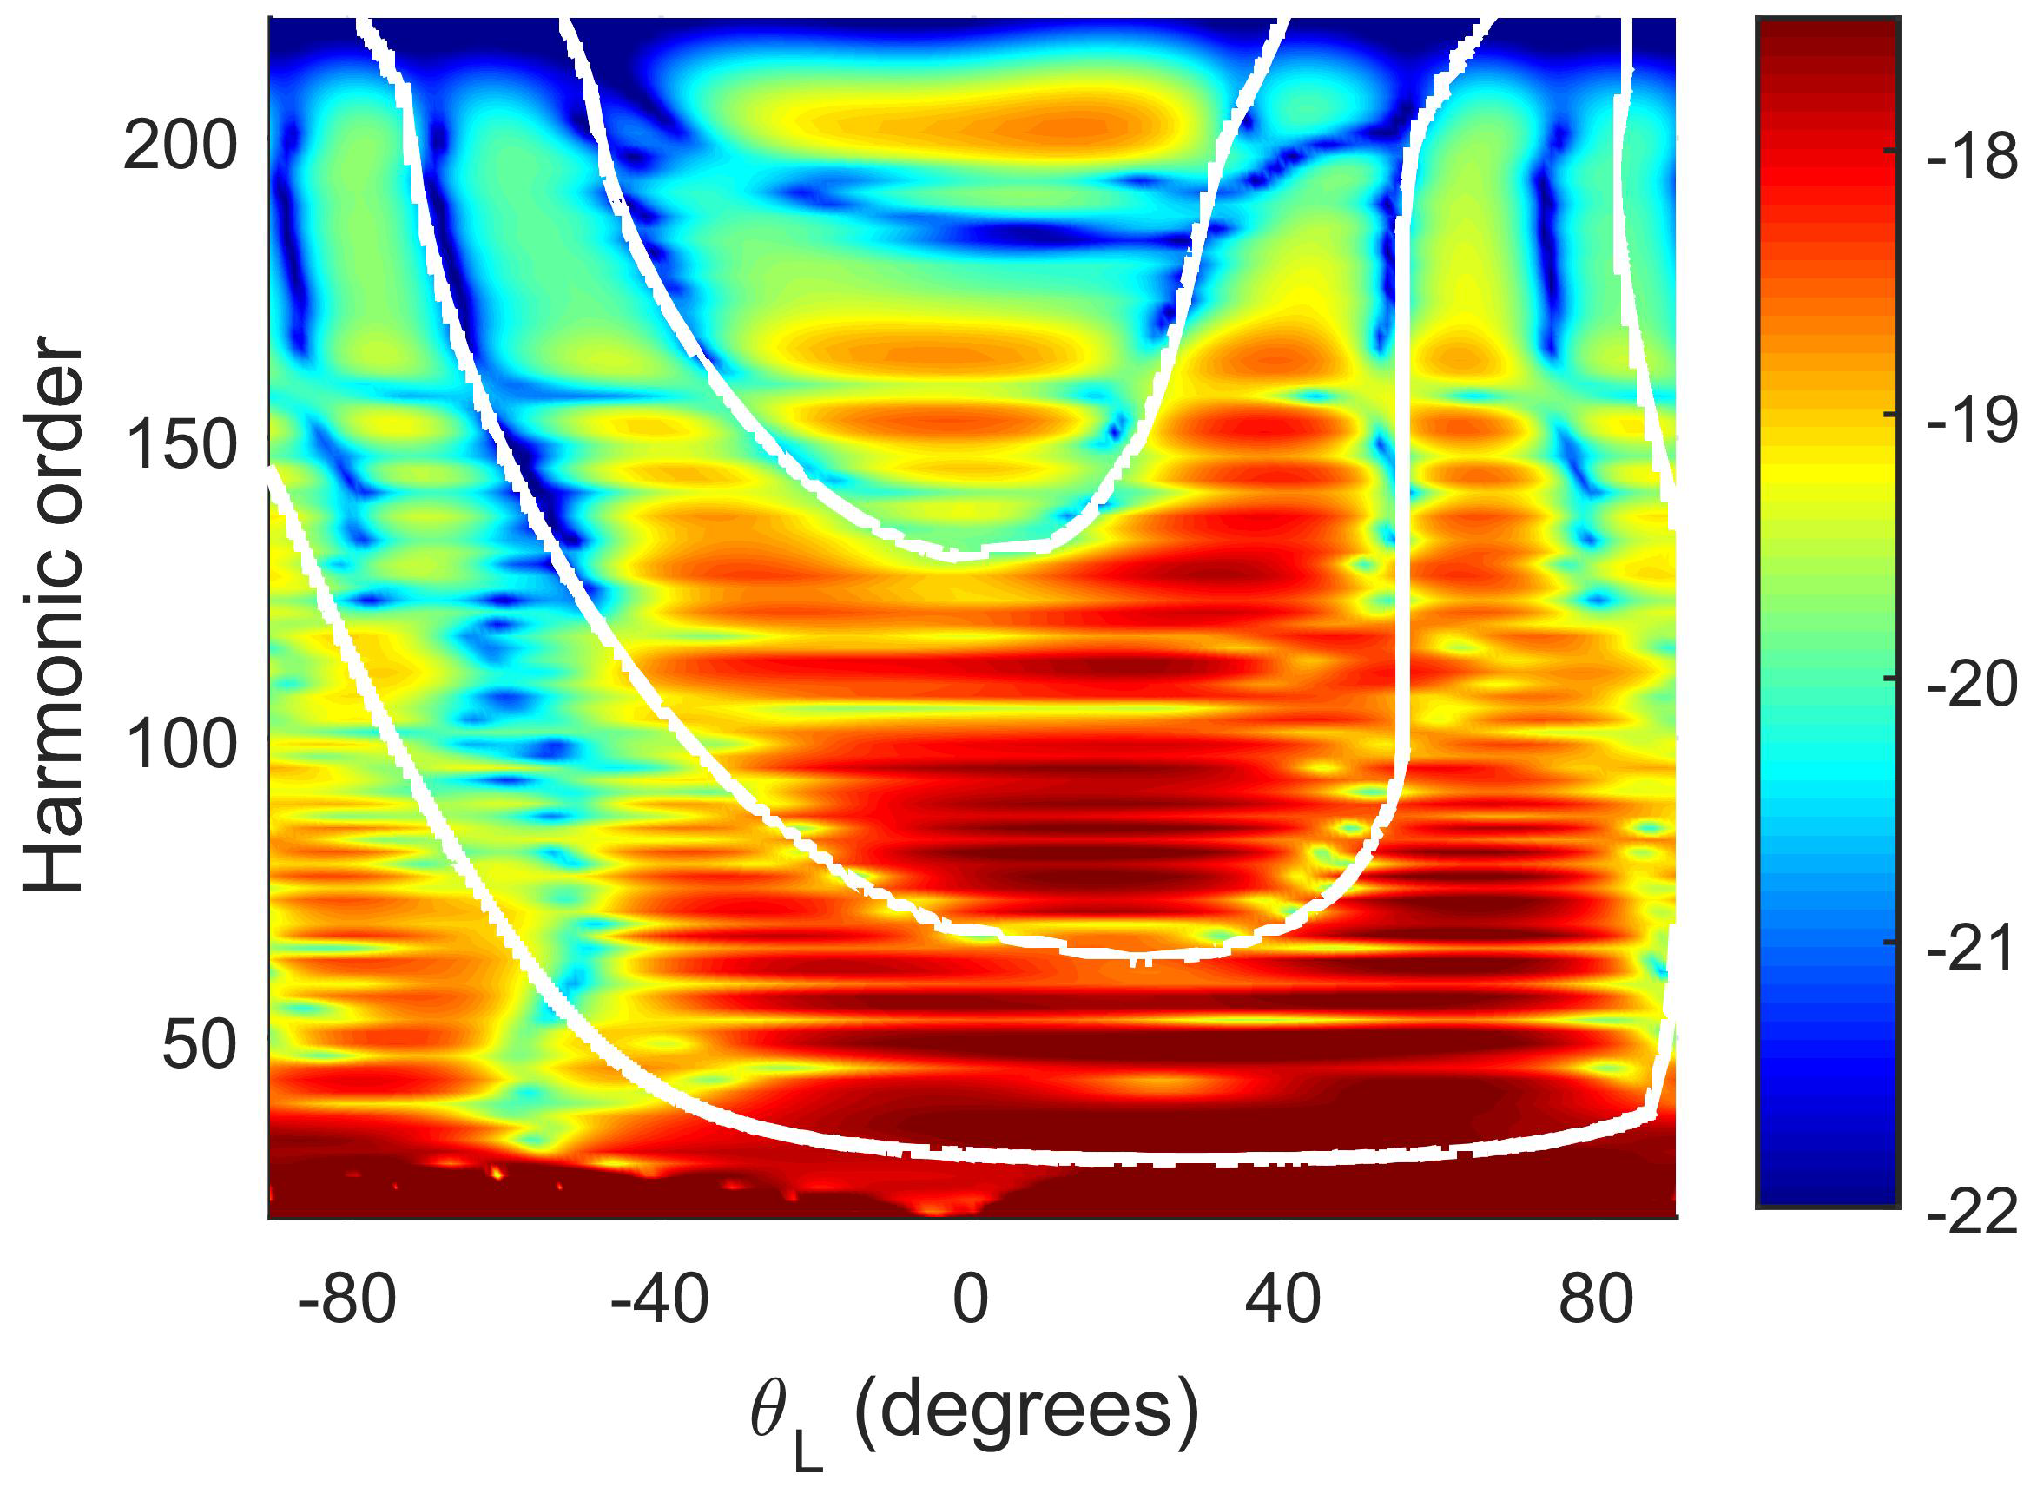
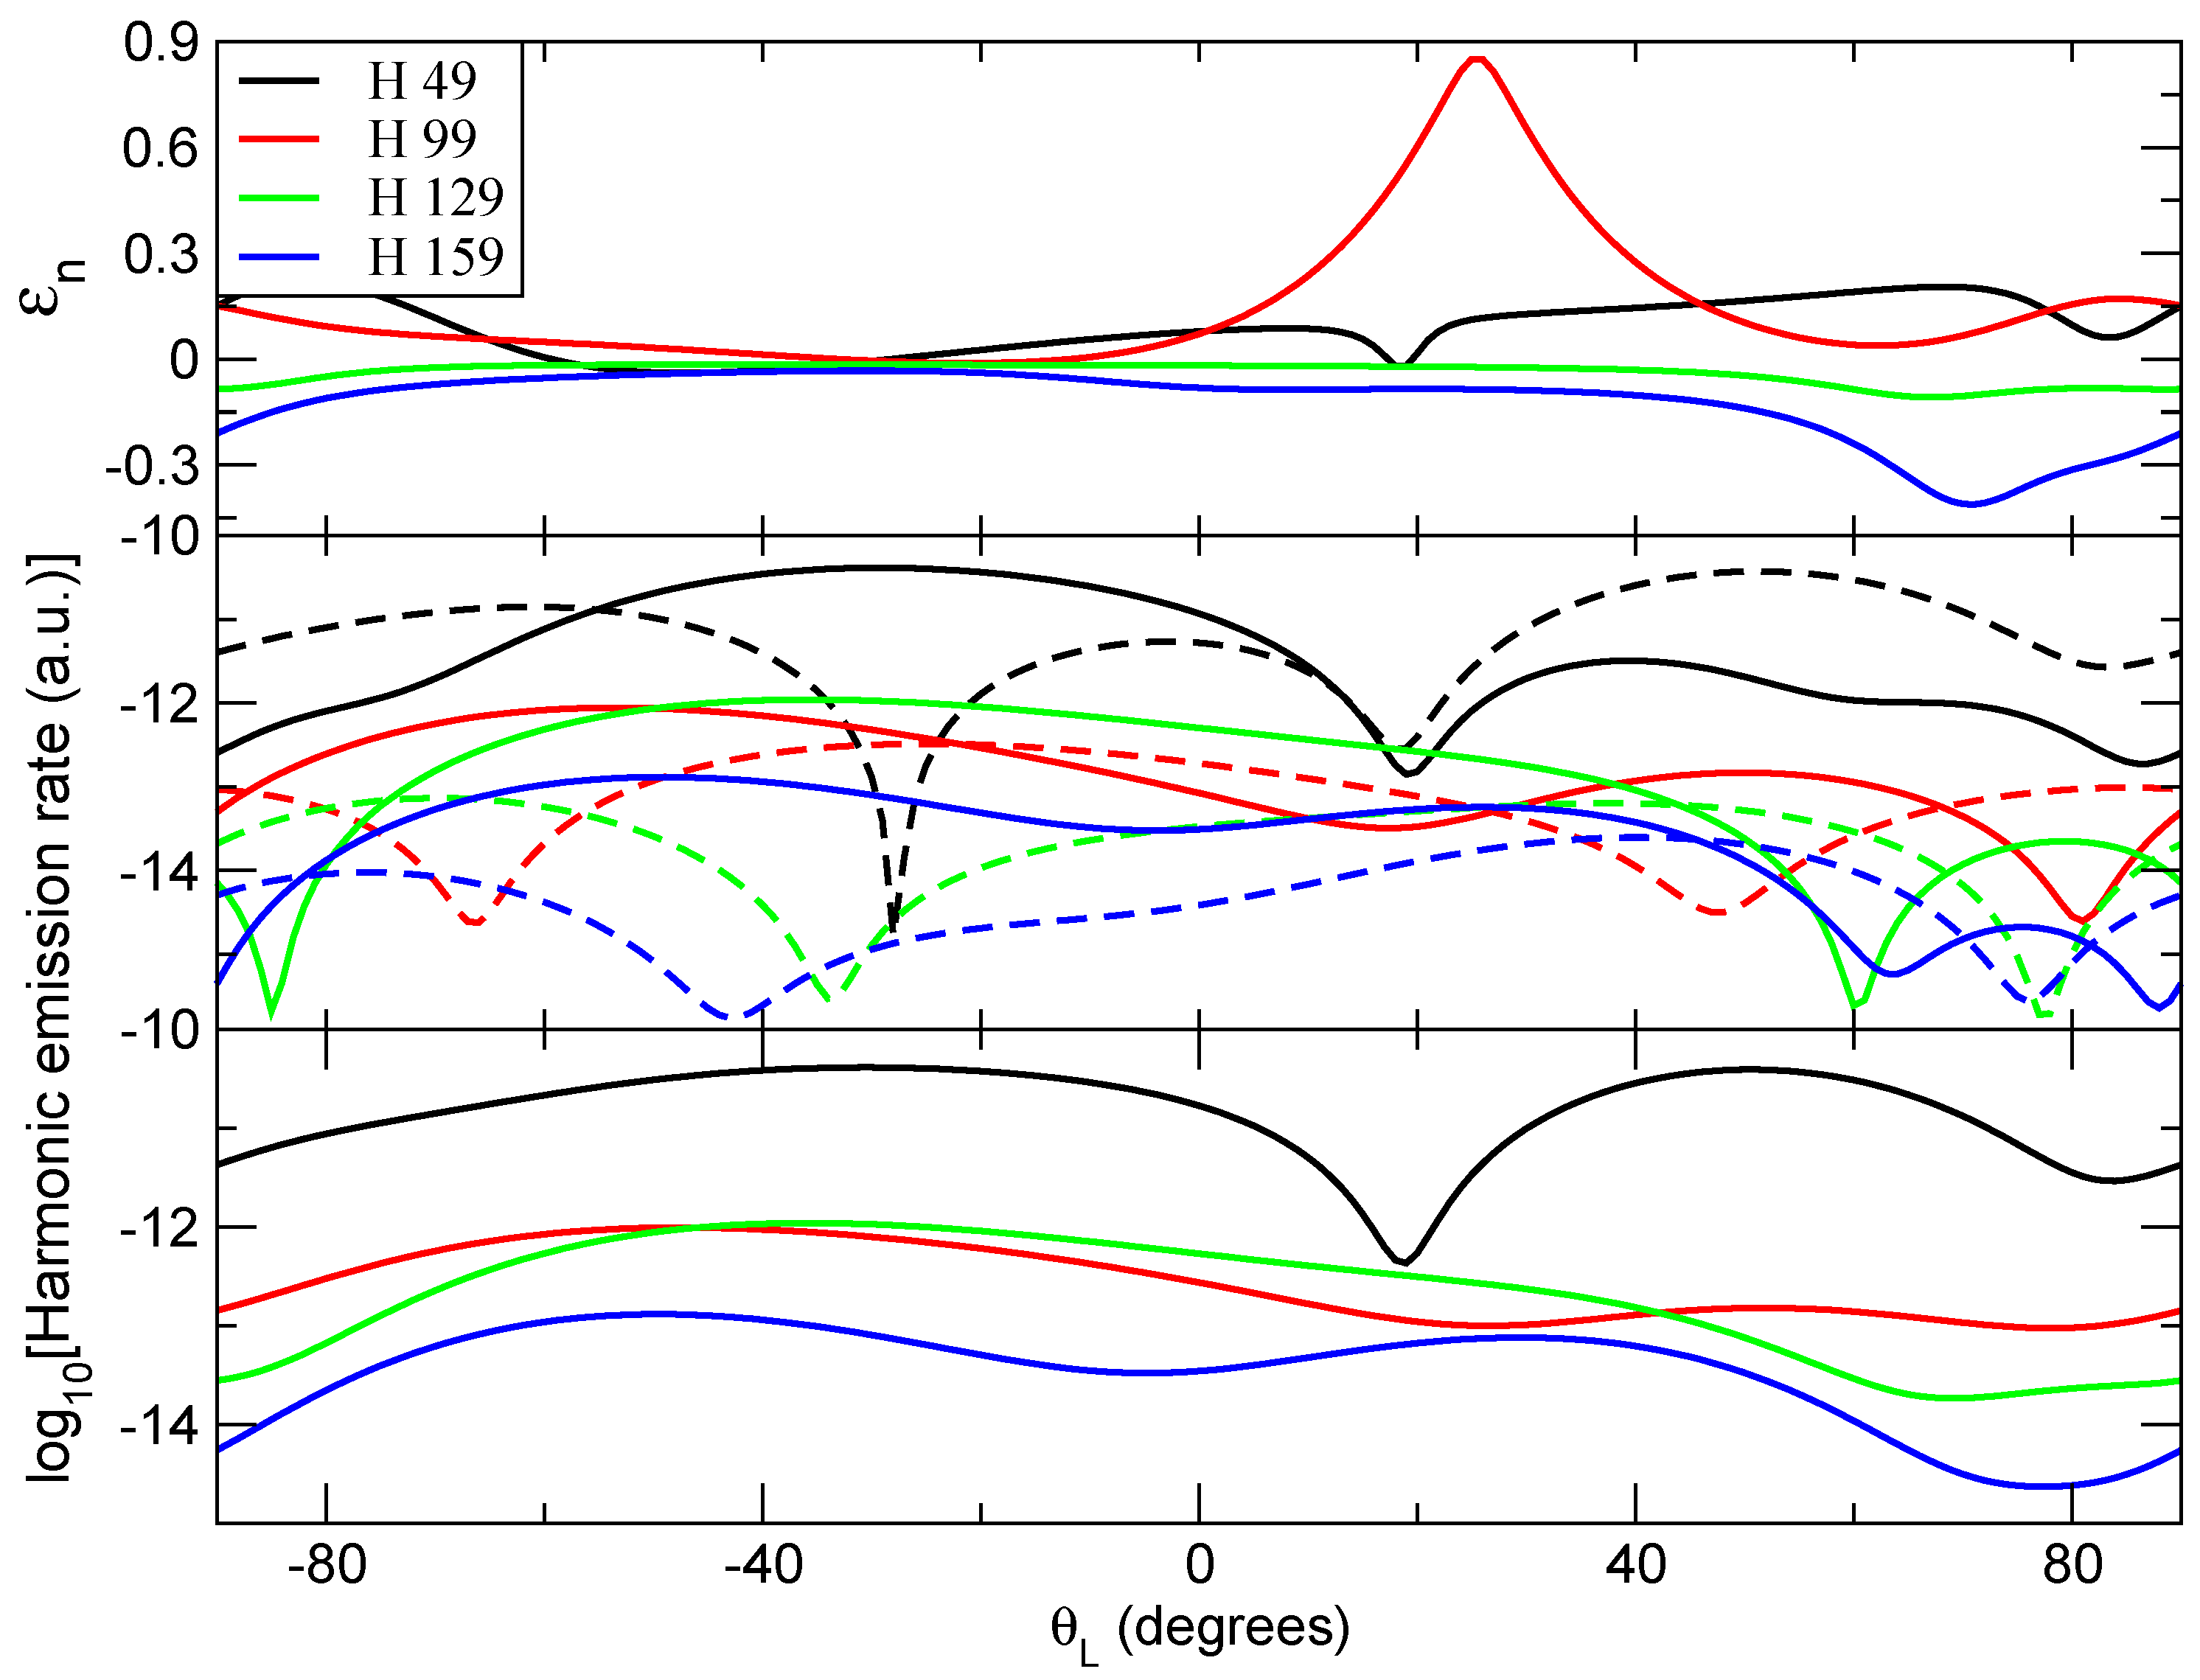
3.2. Harmonic Emission Rate and Ellipticity as Functions of the Molecular Orientation Angle
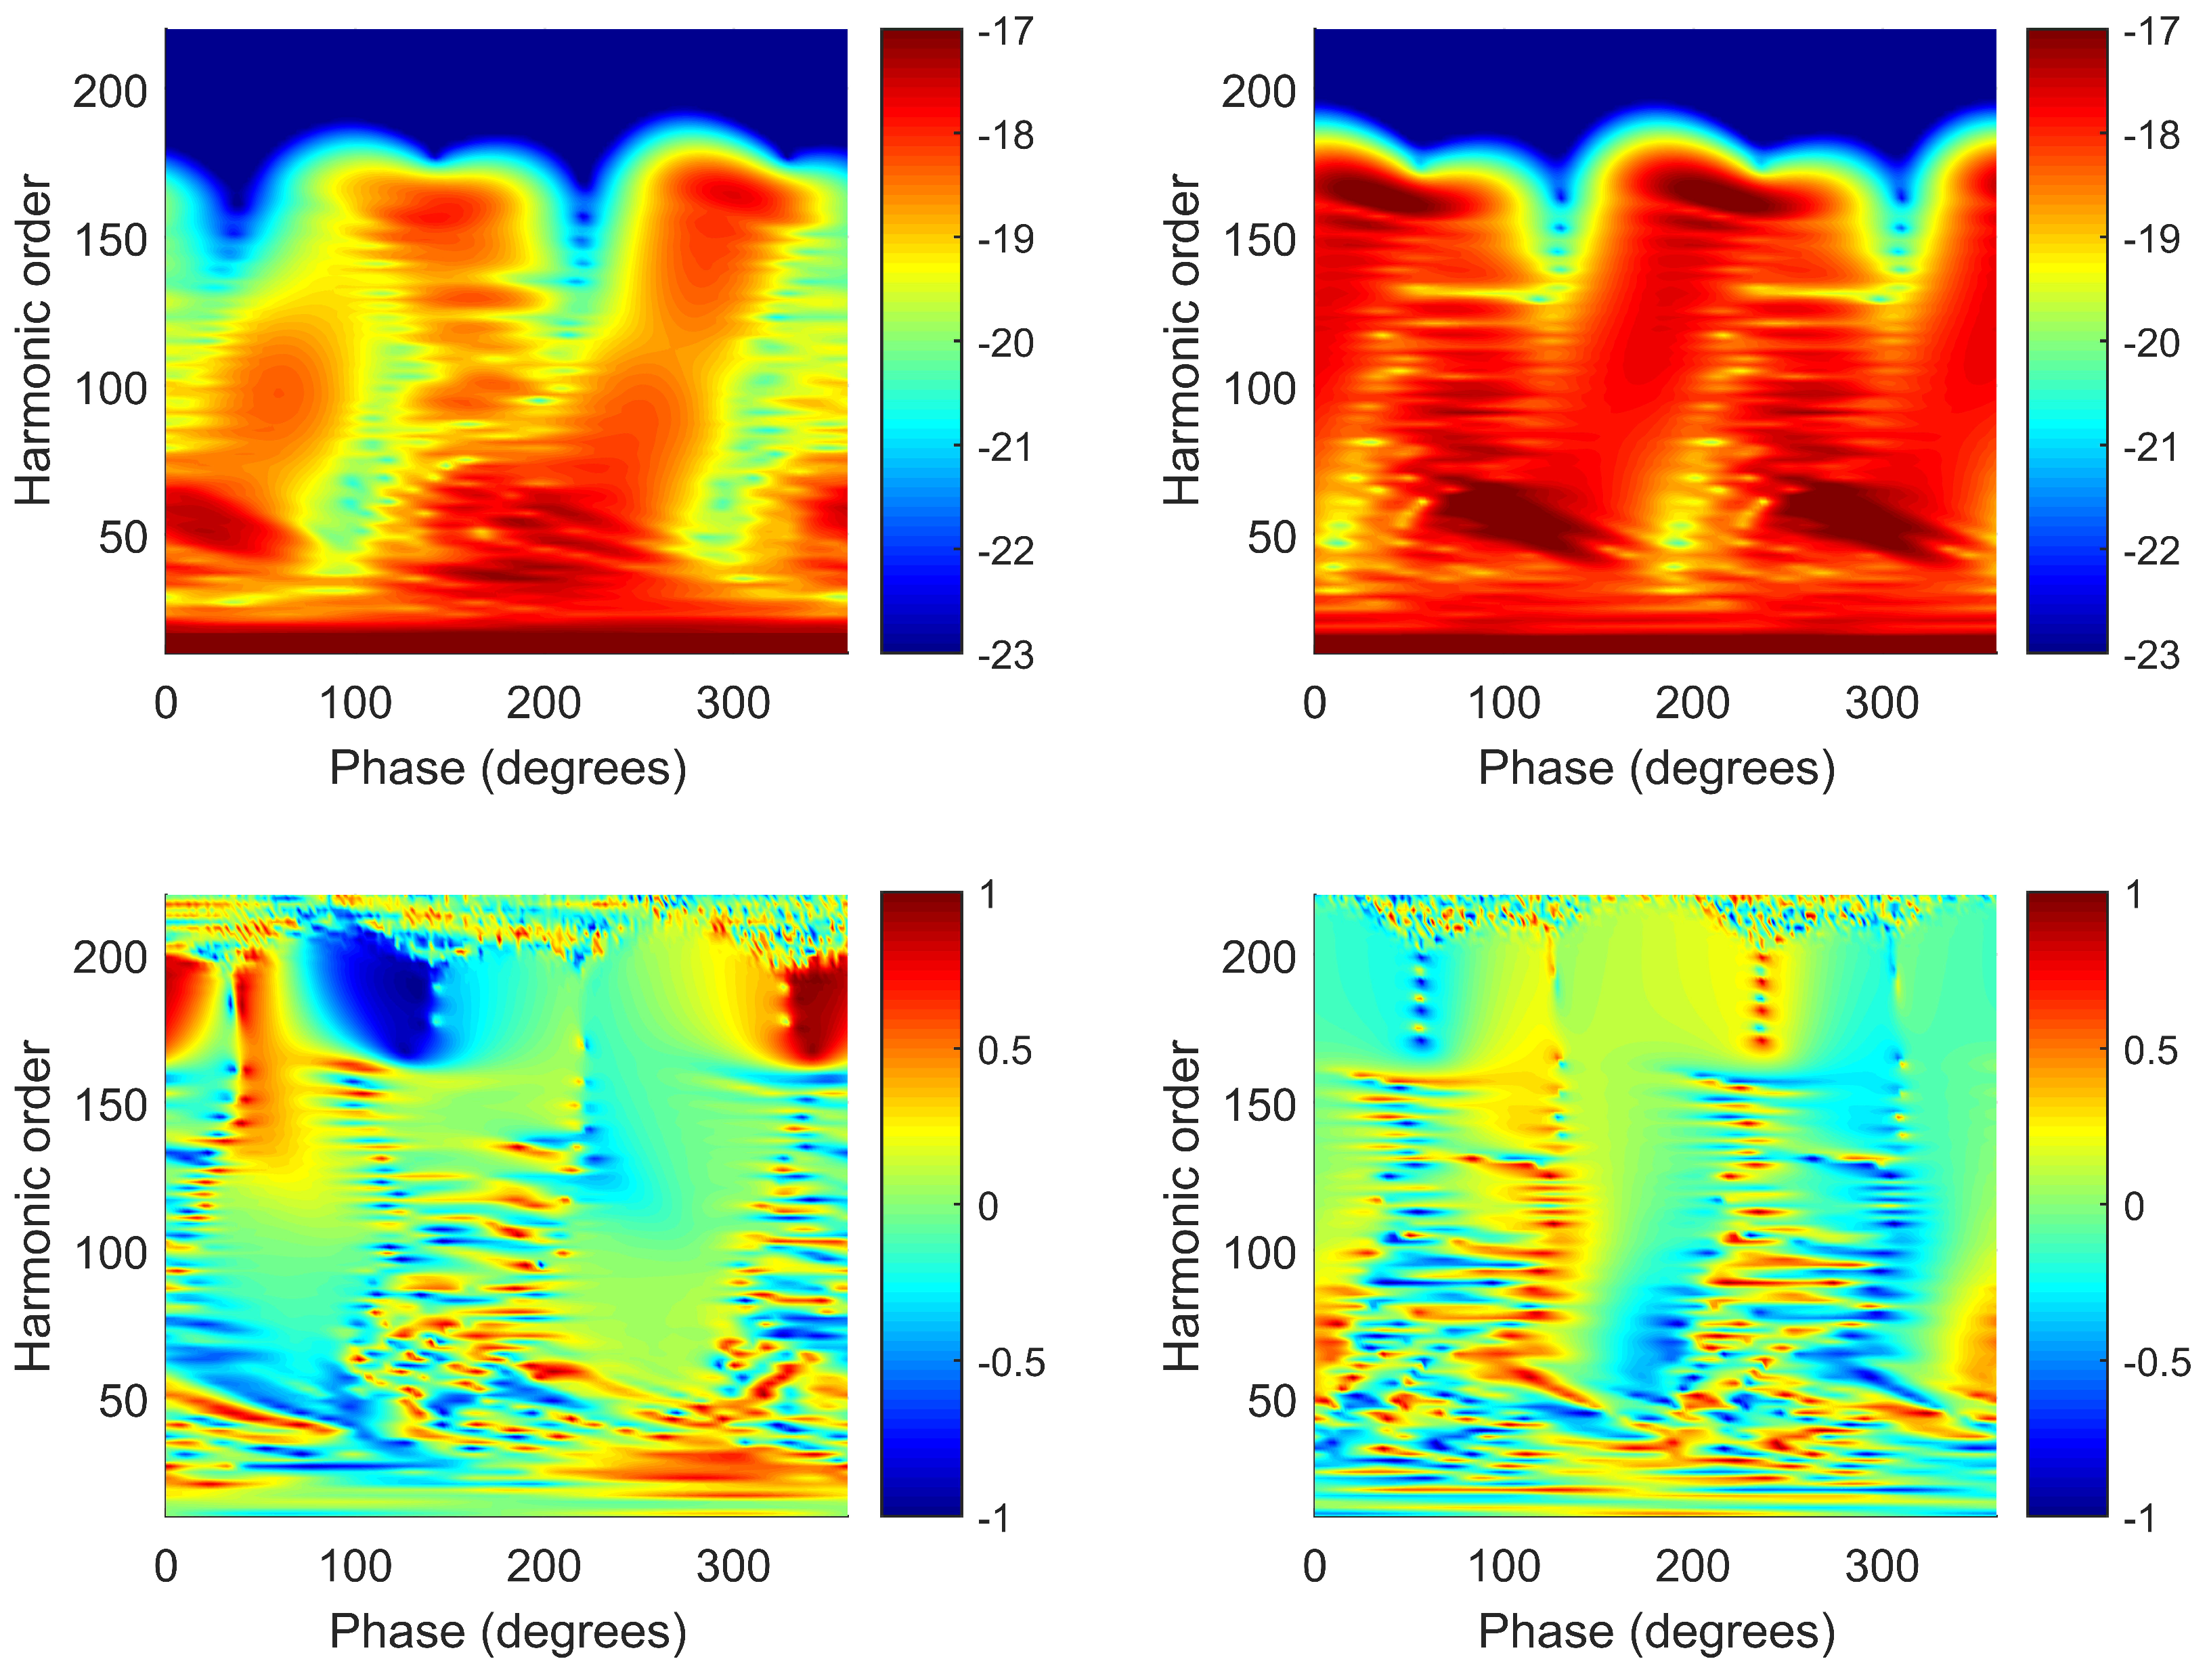
 θ L

Now, we analyze the harmonic emission rate and harmonic ellipticity as functions of the molecular orientation and harmonic order.

3.2.1. ω 2 ω OTC Field

For the ω 2 ω OTC laser field, both even and odd harmonics are emitted. In Figure 6, we present the harmonic emission rate of the N 2 molecule for odd (top row) and even (bottom row) harmonics calculated using only the T n Lz (first column) or the T n Lx (second column) contribution. The results in the third column correspond to the sum of both contributions according to | T n | 2 = | T n Lz | 2 + | T n Lx | 2 . The relative phase is φ = 45 , so that, according to Figure 2, we can expect high-energy photons.
Two types of minima can appear in the harmonic spectrum. The first type corresponds to the minima which appear because of the molecular orbital symmetry, while the second type corresponds to the minima due to the destructive interference. For odd (even) harmonics, the interference minima in the spectrum calculated using only the T n Lz ( T n Lx ) component, which are present for a linearly polarized laser field, are blurred now. This is also the case for an elliptically polarized laser field (see the top and middle panels of Figure 1 in [62]). However, the minima for the molecular orientations θ L = 0 , ± 90 in the spectrum of odd harmonics calculated using only the T n Lx component are still present. To explain these minima, we recall that the momentum-space Slater-type orbitals ψ ˜ a = ψ ˜ n a l a m a satisfy the relation [62]
ψ ˜ n a l a m a θ p sin λ 1 θ p ν = 0 [ ( l a λ ) / 2 ] ω ν l a λ [ λ + ( 2 ν l a ) sin 2 θ p ] cos l a λ 2 ν 1 θ p .
where λ = | m λ | = | m a | . The angle θ p is the angle between the molecular axis and the Lz axis, because the Lz component of the laser field generates the odd harmonics.
The contribution of the Lz laser-field component to the Lx component of the T-matrix element is T n Lx ψ ˜ a / θ p , while the s orbitals do not contribute to the T n Lx because ψ ˜ s / θ p = 0 . In addition, for a = p , d , f , we have ψ ˜ a / θ p sin θ p , so that these orbitals do not contribute to T n Lx for θ p = 0 . For θ p = ± 90 , we get ψ ˜ d / θ p cos θ p = 0 . Finally, analogously to Odžak et al [62], it is possible to show that the p and f orbitals also do not contribute to T n Lx when θ p = ± 90 . Summarizing all this, we conclude that the T n Lx component is zero for odd harmonics, and for θ L = 0 , ± 90 , which is in agreement with the results presented in the second top panel of Figure 6. The situation is similar for even harmonics. These harmonics are generated by the Lx component of the laser field, so the minima for the molecular orientations θ L = 0 , ± 90 are present in the spectrum calculated using the T n Lz component alone (see the first bottom panel in Figure 6).
Let us now analyze how the ellipticity of the emitted harmonics depends on the molecular orientation. We present the ellipticity of the emitted harmonics in Figure 7 as a function of the harmonic order and the molecular orientation. The relative phase is φ = 45 . The left (right) panel corresponds to the odd (even) harmonics. We see that for some molecular orientations both the harmonic ellipticity and the emission rate are large. One possible approach to find these regions is, first, to determine the optimal relative phase, using the simple man’s model or the MSFA numerical calculations, and then to change the molecular orientation to get the harmonics with desired ellipticity.
Analyzing Figure 6 and Figure 7, we see that the presented harmonic emission rates are invariant with respect to the transformation θ L θ L , while the corresponding harmonic ellipticities change the sign. This symmetry is exact. This can be checked using relations (3)–(9): Lz or Lx component of the T-matrix element changes the sign so that M n , Equation (7), and, consequently, the ellipticity ε n , Equation (9), changes the sign, while | T n | 2 and, therefore, the harmonic emission rate, remains unchanged.

3.2.2. ω 3 ω OTC Field

A similar analysis can be done for the ω 3 ω OTC laser field. In Figure 8, we present the harmonic emission rate of the N 2 molecule as a function of the harmonic order and the molecular orientation angle θ L . The relative phase is φ = 0 . For this relative phase, according to the top left panel of Figure 4, we expect harmonics of the order up to n = 180 .
Because of the form of the contributions (13), the interference minima in the total spectrum are not clearly visible. The interference minima are also not visible if only the contribution to the T-matrix element parallel or perpendicular to the polarization of the fundamental field is taken into account. However, if only the orbitals with s λ = + 1 contribute to the molecular orbital, we have R Lz e ^ Lz + R Lx e ^ Lx = ( C + Lz e ^ Lz + C + Lx e ^ Lx ) cos x . Similarly, if only the orbitals with s λ = 1 contribute, we get R Lz e ^ Lz + R Lx e ^ Lx = i ( C Lz e ^ Lz + C Lx e ^ Lx ) sin x . In these case, both components (parallel and perpendicular to the polarization of the fundamental field) are proportional to the same function, so that we expect interference minima in the total spectrum. For the orbitals with s λ = + 1 , the interference condition becomes
[ k st + A ( t ) ] · R 0 = ( 2 j + 1 ) π ,
while, for the orbitals with s λ = 1 , we have
[ k st + A ( t ) ] · R 0 = 2 j π ,
where j is an integer.
To illustrate this, in Figure 9, we present the logarithm of the total harmonic emission rate of the N 2 molecule obtained using the ω 3 ω OTC laser field with the relative phase φ = 0 as a function of the harmonic order and the molecular orientation. The HOMO of N 2 is modeled using only s (p) orbitals in the left (right) panel. For high-energy photons, only one quantum orbit gives a significant contribution to the harmonic intensity (black line in the left panel of Figure A1). For this quantum orbit, we calculate the ionization and recombination times for different harmonic orders n, which is a continuous parameter in the saddle-point method. This allows us to calculate the stationary momentum. The curve (white line) which corresponds to the destructive interference condition (22) with j = 0 is added in Figure 9. We see that the obtained curve nicely follows the minima in the spectrum obtained using numerical integration. The minima are not visible in the harmonic spectrum calculated using only p orbitals, so that, when both s and p orbitals are used to model the HOMO of the N 2 molecule, the minima are blurred.
For p orbitals, the interference minima appear for higher harmonic order, i.e., higher laser intensities or longer wavelengths are needed to observe these minima. To illustrate this, in Figure 10, we present the logarithm of the total harmonic emission rate of the N 2 molecule obtained using the ω 3 ω OTC laser field with the fundamental wavelength λ = 2500 nm and the relative phase φ = 0 as a function of the harmonic order and the molecular orientation. Only the p orbitals are included. Even for this wavelength, the white curve, corresponding to the interference minima (23) with j = 1 , is in the cutoff region.
Next, we analyze the particularly interesting example of the Ar 2 molecule for the equilibrium internuclear distance R 0 = 7.2 a.u. In this case, only p orbitals (having s λ = + 1 ) contribute to the HOMO of Ar 2 . Because of the longer internuclear distance in this example, the conditions for the observation of the interference minima are favorable, i.e., we expect interference minima for lower harmonic orders. This is clearly visible in Figure 11, where the harmonic emission rate of the Ar 2 molecule is presented as a function of the harmonic order and the molecular orientation angle θ L . The fundamental wavelength and the relative phase are λ = 2000 nm and φ = 0 , respectively. The intensity of the fundamental laser-field component is I 1 = 9 × 10 13 W/cm 2 , while the intensity of the second component is I 2 = 0.3 I 1 . We use an example with I 2 I 1 to confirm that the interference minima are present for an arbitrary intensity ratio of the laser-field components.
Similar to the case of the N 2 molecule, we take into account only the quantum orbit that contributes significantly to the harmonic intensity for high-energy photons (black line in the right panel of Figure A1) and calculate the ionization and recombination times for different harmonic orders. The curves obtained using the interference minima condition (22) with j = 0 , 1 , 2 nicely follow the minima obtained by numerical integration. This allows one to assess which atomic orbitals are contained in the molecular orbital. If the interference minima are present in the calculated spectra, then the molecular orbital contains predominantly only even or odd atomic orbitals. Using the interference minima condition, it is possible to determine which orbitals (odd or even) are present in the given molecular orbital. Finally, let us remark that the interference-minima curves poorly fit the minima in the low-energy part of the spectrum. This happens because, besides the dominant quantum path, some other paths have to be taken into account (see the right panel of Figure A1).
Now, we analyze the ellipticity of the emitted harmonics. In Figure 12, we present the harmonic ellipticity as a function of the harmonic order and the molecular orientation angle θ L for HHG by the N 2 molecule exposed to the ω 3 ω OTC field. For the lower-order harmonics, we see that the ellipticity can be large for certain molecular orientations θ L . The region around θ L = 70 supports the high-energy harmonics with the ellipticity close to one. However, in this region, the emission rate is low. In Figure 12, we also add the curves that correspond to the solutions of the equations R Lz = 0 and R Lx = 0 , where R Lz and R Lx are given in (13). The black, blue and green curves are calculated for the quantum orbits s = SP 1 , SP2 and SP0, respectively (see Appendix A). Solving the system of equations (A1) for fixed n, we find the times t s and t s and introduce their real parts into equation R κ = 0 . For fixed n, this equation is solved over θ L , which gives a curve in the ( θ L , n ) plane (there are two such curves which correspond to κ = Lx , Lz ). In the cutoff region, only the contribution of the quantum orbit SP1 is significant. In this region, for the molecular orientation close to θ L = 70 , both contributions to the T-matrix element are small and, as a consequence, the emission rate is also small. One contribution is smaller, which leads to the large degree of circular polarization and the large ellipticity. One can try to overcome the drawback of small emission rate by choosing another relative phase (for example, φ = 90 or 270 ) where the cutoff is higher, and then to analyze the ellipticity as a function of the molecular orientation. For lower energies, the other quantum orbits also give a significant contribution. For example, the quantum orbit SP0 is dominant for the harmonic order around n = 60 (see the left panel of Figure A1). The green curves in Figure 12, which correspond to this quantum orbit, enclose a wide region with large ellipticity for the angles 90 < θ L < 15 . The black and blue curves, which correspond to the orbits SP1 and SP2, respectively, enclose another region of large ellipticities for the angles 55 < θ L < 90 , and n 60 . This allows us to assess the regions with large ellipticity and large emission rate without calculating the whole spectrum.
Finally, let us analyse the harmonic emission rate and the harmonic ellipticity as functions of the ratio of the intensities of the laser-field components. In Figure 13 we present the harmonic emission rate (left) and the harmonic ellipticity (right) as functions of the harmonic order and the ratio of the intensities of the laser-field components. The spectrum is calculated using the N 2 molecule exposed to the ω 3 ω OTC laser field with the relative phase φ = 0 and the fundamental wavelength λ = 2000 nm. The molecular orientation angle is θ L = 60 . The intensity of the fundamental field component is I 1 = 7 × 10 13 W/cm 2 , while the intensity of the second component is changed from zero to I 1 . As the ratio I 2 / I 1 increases, the emission rate and the cutoff position also increase. The cutoff energy is proportional to the ponderomotive energy which consists of the contributions of both laser-field components. These contributions are proportional to the intensity of the corresponding component and inversely proportional to the square of the frequency of the corresponding laser-field component. For the ω 3 ω OTC laser field, the contribution of the second field component to the ponderomotive energy is nine times smaller than the contribution of the fundamental field component. This is the reason the cutoff position changes only slightly with the change of the ratio I 2 / I 1 . For the I 2 / I 1 = 1 , we find that the ellipticity of the emitted harmonics is large for the harmonic order around n = 60 (see Figure 12). In the right panel of Figure 13, we see that this is also valid in the case when the intensity of the second component is lower than the intensity of the fundamental component. Generally, the harmonic emission rate and the ellipticity depend on the ratio of the intensities of the laser field components, and this parameter can also be used to control the emission rate and the ellipticity of the emitted harmonics.
To get a better understanding of how the harmonic ellipticity depends on the molecular orientation, we present it for a few representative harmonics. Particularly, we choose the harmonics with n = 49, 99, 129 and 159. Figure 14 shows the harmonic ellipticity (top) as a function of the molecular orientation angle θ L . In addition, we present in the middle panel log 10 | T n Lz | 2 (solid line) and log 10 | T n Lx | 2 (dashed line). The logarithm of the total emission rate is presented in the bottom panel. It is obvious that the ellipticity of the emitted harmonics strongly depends on the molecular orientation. For some molecular orientations the ellipticity is large (for example for θ L = 25 , n = 99 ). The contributions log 10 | T n Lz | 2 and log 10 | T n Lx | 2 generally exhibit minima for different molecular orientations. To illustrate this we can use, as an example, the harmonic with n = 159 . In this case, the contribution log 10 | T n Lz | 2 ( log 10 | T n Lx | 2 ) exhibits maxima (minima) for the orientation around θ L = 45 , so the contribution to the total ionization rate from log 10 | T n Lx | 2 is negligible. A similar conclusion holds for the harmonic n = 49 and the molecular orientation θ L = 30 . However, for some harmonic orders and some molecular orientations, both contributions to the T-matrix element behave in a similar way. An example is the harmonic n = 49 for the orientation around θ L = 20 . For the orientations where the total ionization rate exhibits minima, the harmonic ellipticity changes rapidly. A particularly illustrative example is the harmonic n = 159 and the orientation θ L = 75 . For this orientation, the harmonic emission rate exhibits minima, while the harmonic ellipticity changes rapidly around this θ L . A similar analysis can also be done for the ω 2 ω OTC laser field.

4. Conclusions

Using the molecular strong-field approximation, we investigate high-order harmonic generation from aligned homonuclear diatomic molecule exposed to a strong orthogonally polarized two-color laser field. The harmonic emission rate and the harmonic ellipticity are calculated for the ω 2 ω and ω 3 ω OTC laser fields. These quantities can be controlled using the relative phase between the field components and the molecular orientation angle as control parameters.
Using the example of the N 2 molecule, we show that the shape and the cutoff of the spectrum strongly depend on the relative phase. For a particular relative phase, the shape of the spectrum is very different from the usual one which has the sharp cutoff. Following a fast decrease for the low-order harmonics, the corresponding spectra exhibit an intensity increase, and then the emission rate continuously decreases up to the harmonic order where the harmonic intensity is negligible. The emitted harmonics are elliptically polarized, and it is possible to find regions in the relative phase vs. harmonic-order plane where both the harmonic ellipticity and the emission rate are large. These regions are particularly important for applications, as explained in the Introduction. For the ω 2 ω OTC laser field, both odd and even harmonics are emitted and the ellipticities of these harmonics have opposite sign. Near the cutoff, there is a broad region where the ellipticity is large. For the ω 3 ω OTC laser field, only odd harmonics are generated and their ellipticities also strongly depend on the relative phase.
We develop a classical two-dimensional simple man’s model for diatomic molecules. Using this model, we estimate the harmonic order for which the harmonic intensity is maximal. We also show how the maximal harmonic photon energy (i.e., the cutoff position) can be calculated using this model.
In addition, we examine the influence of the molecular orientation on the harmonic emission rate and ellipticity. In the harmonic spectrum, two types of minima can appear. One type of minima is a consequence of the molecular orbital symmetry (we call them structural minima), while the other one appears due to the destructive interference in the recombination part of the T-matrix element (Equations (4) and (5)). For the ω 2 ω OTC field, the structural minima in the spectrum calculated using only the T n Lz ( T n Lx ) contribution are blurred for odd (even) harmonics. However, the minima in the spectrum of the N 2 molecule calculated using the T n Lx ( T n Lz ) contribution for odd (even) harmonics are still present for the molecular orientations θ L = 0 , ± 90 . These minima are explained using the particular form of the Slater-type orbitals of which the HOMO consists. In the total spectrum, the structural minima are not visible. The ellipticity of the emitted harmonics strongly depends on the molecular orientation. For some molecular orientations and harmonic orders, both the ellipticity and the emission rate are large. We also notice that, for the ω 2 ω OTC field, the ellipticity of the emitted harmonics changes sign for the molecular orientations θ L θ L (see Figure 7).
For the ω 3 ω OTC laser field, similar conclusions can be derived. The interference minima are blurred in the harmonic spectra calculated using only the partial contributions T n Lz or T n Lx and, as a consequence, in the total harmonic spectrum. However, we show that the interference minima are still visible in the total spectrum if we include only the odd or only the even orbitals. These minima are explained using the destructive interference condition derived for the OTC laser field. If the interference minima are present in the high-harmonic spectra, then the molecular orbital contains predominantly only even or odd atomic orbitals. Thus, the molecular orbital structure is imprinted in the HHG data and analyzing the HHG spectra we can assess which atomic orbitals are contained in the molecular orbital.
The ellipticity of the emitted harmonics depends on the molecular orientation. We find that the regions where the ellipticity and the emission rate are large can be assessed using the condition that one component of the recombination part of the T-matrix element be approximately equal to zero. This condition can be obtained using the quantum-orbit theory (see Appendix A). Thus, without calculating the whole spectrum, one can find the above regions of large high-harmonic ellipticities. In addition, we briefly analyze the harmonic yield and the harmonic ellipticity as functions of the ratio of the intensities of the laser-field components, and we show that this ratio can be used as a control parameter for the harmonic emission. Finally, we also calculate the harmonic ellipticity as a function of the molecular orientation for a few representative harmonics and find that the harmonic ellipticity changes rapidly for those orientations for which the total ionization rate exhibits minima.
To summarize, we show that, using the relative phase as a control parameter, it is possible to generate high-energy elliptically polarized harmonics with large emission rate using aligned homonuclear diatomic molecules as targets. We also show that the molecular orientation can be used as an additional control parameter.

Author Contributions

Conceptualization, D.H. and D.B.M.; methodology, D.H. and D.B.M.; software, D.H. and D.B.M.; validation, D.B.M.; formal analysis, D.H. and D.B.M.; investigation, D.H. and D.B.M.; supervision, D.B.M.; vizualization, D.H. and D.B.M.; writing–original draft preparation, D.H. and D.B.M.; writing–review and editing, D.H. and D.B.M.; project administration, D.B.M.; funding acquisition, D.B.M. All authors have read and agreed to the published version of the manuscript.

Funding

We gratefully acknowledge support by the Ministry for Education, Science and Youth, Canton Sarajevo, Bosnia and Herzegovina, and by the Alexander von Humboldt Foundation.

Acknowledgments

The authors are grateful to Wilhelm Becker for illuminating discussions and for careful reading of the manuscript.

Conflicts of Interest

The authors declare no conflict of interest.

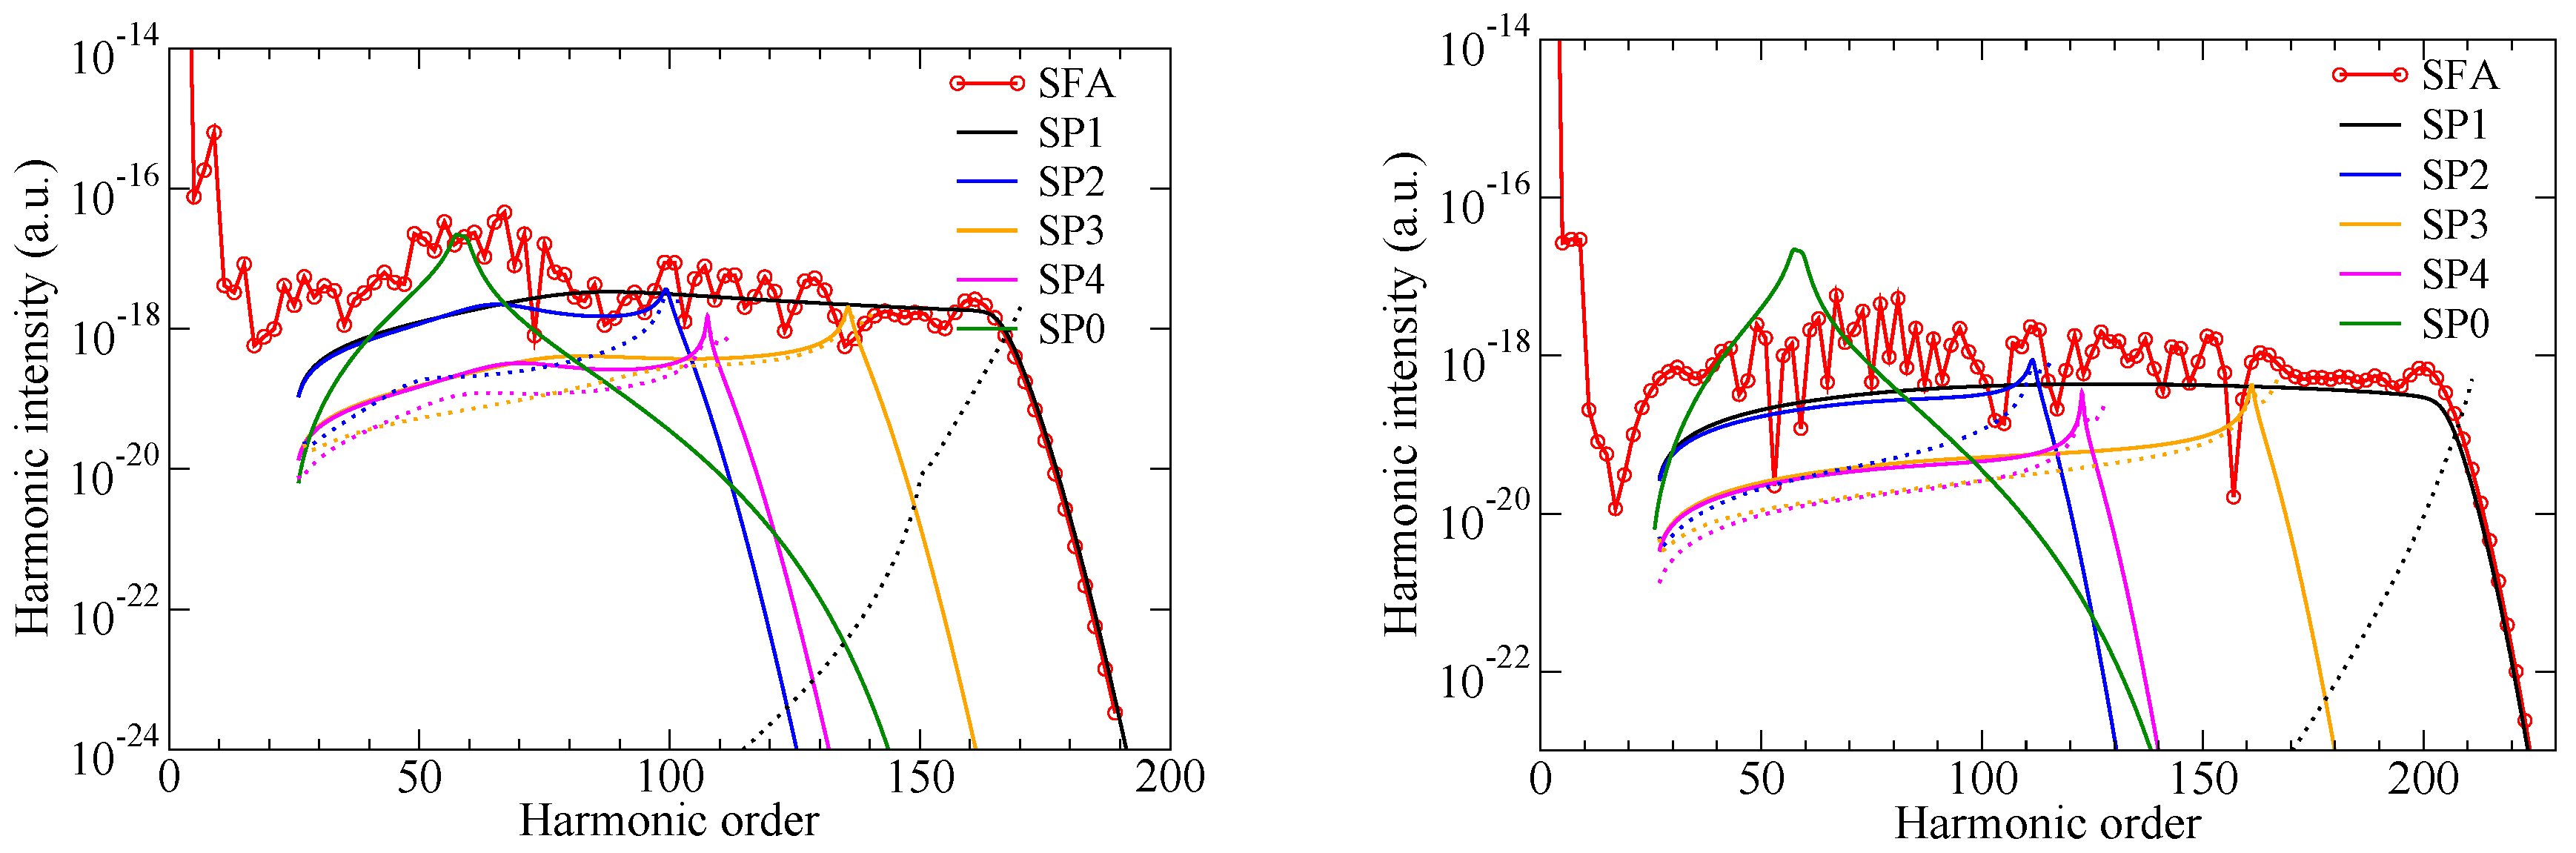
Appendix A. Saddle-Point Method and Quantum-Orbit Theory

The harmonic emission rate and the harmonic ellipticity are expressed via the T-matrix element, which is written in the form of the double integral over the ionization time t and the recombination time t (Equation (4)). Since the action S in the exponent of this equation is large for the strong-field processes, this two-dimensional integral can be solved using the saddle-point method, according to which the two-dimensional integral over time can be expressed as the sum over the saddle-point solutions t s and t s of the system of stationary equations ( S + n ω t ) / t = 0 and ( S + n ω t ) / t = 0 . For the HHG process, this system takes the form
1 2 [ k st + A ( t ) ] 2 = I p , 1 2 [ k st + A ( t ) ] 2 + I p = n ω .
Physically, these two equations express, respectively, the energy-conserving condition at the ionization time t and the energy-conserving condition at the recombination time t (the electron kinetic energy at the time when it returns to the parent ion plus the ionization potential is equal to the energy of the emitted harmonic photon). Since I p is negative, the first condition in (A1) can be satisfied only for the complex times t . The complex solutions of Equation (A1) are the same as in the atomic case. For large internuclear distances, the R 0 -dependent term in the exponents of the T-matrix element (4) can become large. In this case, an R 0 -dependent term should be added to the stationary momentum [67]. The T-matrix element is expressed as
T n = s a s e i ( S s + n ω t s ) { t s , t s } e i n ω t s t s t s 3 / 2 R ( k st , t s ) e i S ( k st ; t s , t s ) I ( k st , t s ) .
This result is interpreted in terms of Feynman’s path integral [68]. The probability amplitude of the HHG process is represented as a coherent superposition of contributions of all possible paths that connect the initial and the final state of the system. In our case, we are able to find all partial contributions to this amplitude which come from the solutions { t s , t s } of the system (A1). Quantum orbits are obtained as the solution of the classical equation of motion for the electron in the laser field, r ¨ ( t ) = E ( t ) . These solutions are r n ( t ) = ( t t s ) k st + t s t d τ A ( τ ) . Electron trajectories are defined as real parts of r n ( t ) for real time t [ Re t s , Re t s ] [69,70,71,72]. These electron trajectories behave in accordance with the three-step model, as mentioned in the Introduction. In the present paper, for fixed laser parameters and fixed harmonic order, we find the solutions t s and t s . We use the real parts of these solutions in the destructive interference condition (14) and obtain curves in the ( θ L , n ) plane, which are depicted in Figure 9, Figure 10, Figure 11 and Figure 12.
Using Equations (A1) and (A2), we are able to calculate the partial contributions of quantum orbits to harmonic intensity. Each of these orbits has a particular physical meaning with an associated electron trajectory and the maximum allowed harmonic photon energy (the cutoff). To illustrate this, in Figure A1, we present the harmonic intensity calculated using the SFA and using the partial contributions of quantum orbits to the harmonic intensity, as functions of the harmonic order obtained using the ω 3 ω OTC field. The left (right) panel corresponds to the N 2 (Ar 2 ) molecule and to the intensities of the laser-field components I 1 = I 2 = 7 × 10 13 W/cm 2 ( I 1 = 9 × 10 13 W/cm 2 , I 2 = 0.3 I 1 ). The relative phase is φ = 0 .
In the cutoff region, only one quantum orbit gives a significant contribution (black line), which explains the smooth and flat shape of the spectrum in this region. For the harmonics in the plateau region, the contributions of other quantum orbits can become significant. For low-energy harmonics, the shortest quantum orbit is dominant (green line). The contributions of the dotted lines, which are divergent after the intersection with the corresponding solid lines, i.e., after the cutoff, should be neglected [21,73]. For more details and classification of quantum orbits, see the work of Milošević and Becker [73] for a linearly polarized laser field and that of Milošević [74] for bicircular field.
Figure A1. Harmonic intensity obtained using numerical integration (SFA, circles) and using the partial contributions of quantum orbits to the harmonic intensity, as functions of the harmonic order obtained using ω 3 ω OTC field. The left (right) panel corresponds to the N 2 (Ar 2 ) molecule and the intensities of the laser-field components are I 1 = I 2 = 7 × 10 13 W/cm 2 ( I 1 = 7 × 10 13 W/cm 2 , I 2 = 0.3 I 1 ). The relative phase and the fundamental wavelength are φ = 0 and λ = 2000 nm, respectively. Contributions of four pairs of quantum orbits are denoted by s = SP 1 , SP2, SP3 and SP4. The contribution of low-energy orbit (analog of L orbit from [73]) is denoted by SP0.
Photonics 07 00110 g0a1

References

  1. Corkum, P.B. Plasma perspective on strong field multiphoton ionization. Phys. Rev. Lett. 1993, 71, 1994–1997. [Google Scholar] [CrossRef] [PubMed] [Green Version]
  2. Lewenstein, M.; Balcou, P.; Ivanov, M.Y.; L’Huillier, A.; Corkum, P.B. Theory of high-harmonic generation by low-frequency laser fields. Phys. Rev. A 1994, 49, 2117–2132. [Google Scholar] [CrossRef] [PubMed]
  3. Becker, W.; Grasbon, F.; Kopold, R.; Milošević, D.B.; Paulus, G.G.; Walther, H. Above-Threshold Ionization: From Classical Features to Quantum Effects. Adv. At. Mol. Opt. Phys. 2002, 48, 35–98. [Google Scholar] [CrossRef]
  4. Kohler, M.; Pfeifer, T.; Hatsagortsyan, K.; Keitel, C. Frontiers of Atomic High-Harmonic Generation. Adv. At. Mol. Opt. Phys. 2012, 61, 159–208. [Google Scholar] [CrossRef] [Green Version]
  5. Becker, W.; Liu, X.; Ho, P.J.; Eberly, J.H. Theories of photoelectron correlation in laser-driven multiple atomic ionization. Rev. Mod. Phys. 2012, 84, 1011–1043. [Google Scholar] [CrossRef]
  6. Eichmann, H.; Egbert, A.; Nolte, S.; Momma, C.; Wellegehausen, B.; Becker, W.; Long, S.; McIver, J.K. Polarization-dependent high-order two-color mixing. Phys. Rev. A 1995, 51, R3414–R3417. [Google Scholar] [CrossRef] [PubMed]
  7. Long, S.; Becker, W.; McIver, J.K. Model calculations of polarization-dependent two-color high-harmonic generation. Phys. Rev. A 1995, 52, 2262–2278. [Google Scholar] [CrossRef]
  8. Zuo, T.; Bandrauk, A.D. High-order harmonic generation in intense laser and magnetic fields. J. Nonlinear Opt. Phys. Mat. 1995, 04, 533–546. [Google Scholar] [CrossRef]
  9. Milošević, D.B.; Becker, W.; Kopold, R. Generation of circularly polarized high-order harmonics by two-color coplanar field mixing. Phys. Rev. A 2000, 2000. 61, 063403. [Google Scholar] [CrossRef]
  10. Fleischer, A.; Kfir, O.; Diskin, T.; Sidorenko, P.; Cohen, O. Spin angular momentum and tunable polarization in high-harmonic generation. Nat. Photon. 2014, 8, 543–549. [Google Scholar] [CrossRef]
  11. Ke, Q.; Zhou, Y.; Tan, J.; He, M.; Liang, J.; Zhao, Y.; Li, M.; Lu, P. Direct probing of tunneling time in strong-field ionization processes by time-dependent wave packets. Opt. Express 2019, 27, 32193–32209. [Google Scholar] [CrossRef] [PubMed]
  12. Baykusheva, D.; Wörner, H.J. Chiral Discrimination through Bielliptical High-Harmonic Spectroscopy. Phys. Rev. X 2018, 8, 031060. [Google Scholar] [CrossRef] [Green Version]
  13. Neufeld, O.; Ayuso, D.; Decleva, P.; Ivanov, M.Y.; Smirnova, O.; Cohen, O. Ultrasensitive Chiral Spectroscopy by Dynamical Symmetry Breaking in High Harmonic Generation. Phys. Rev. X 2019, 9, 031002. [Google Scholar] [CrossRef] [Green Version]
  14. Ayuso, D.; Neufeld, O.; Ordonez, A.F.; Decleva, P.; Lerner, G.; Cohen, O.; Ivanov, M.Y.; Smirnova, O. Locally and globally chiral fields for ultimate control of chiral light matter interaction. Nat. Photon. 2019, 13, 866–871. [Google Scholar] [CrossRef] [Green Version]
  15. Levesque, J.; Mairesse, Y.; Dudovich, N.; Pépin, H.; Kieffer, J.C.; Corkum, P.B.; Villeneuve, D.M. Polarization State of High-Order Harmonic Emission from Aligned Molecules. Phys. Rev. Lett. 2007, 99, 243001. [Google Scholar] [CrossRef] [Green Version]
  16. Ferré, A.; Handschin, C.; Dumergue, M.; Burgy, F.; Comby, A.; Descamps, D.; Fabre, B.; Garcia, G.A.; Géneaux, R.; Merceron, L.; et al. A table-top ultrashort light source in the extreme ultraviolet for circular dichroism experiments. Nat. Photon. 2015, 9, 93–98. [Google Scholar] [CrossRef]
  17. Hickstein, D.D.; Dollar, F.J.; Grychtol, P.; Ellis, J.L.; Knut, R.; Hernández-García, C.; Zusin, D.; Gentry, C.; Shaw, J.M.; Fan, T.; et al. Non-collinear generation of angularly isolated circularly polarized high harmonics. Nat. Photon. 2015, 9, 743–750. [Google Scholar] [CrossRef]
  18. Hernández-García, C.; Durfee, C.G.; Hickstein, D.D.; Popmintchev, T.; Meier, A.; Murnane, M.M.; Kapteyn, H.C.; Sola, I.J.; Jaroń-Becker, A.; Becker, A. Schemes for generation of isolated attosecond pulses of pure circular polarization. Phys. Rev. A 2016, 93, 043855. [Google Scholar] [CrossRef] [Green Version]
  19. Smirnova, O.; Patchkovskii, S.; Mairesse, Y.; Dudovich, N.; Villeneuve, D.; Corkum, P.; Ivanov, M.Y. Attosecond circular dichroism spectroscopy of polyatomic molecules. Phys. Rev. Lett. 2009, 102, 063601. [Google Scholar] [CrossRef] [Green Version]
  20. Zhou, X.; Lock, R.; Wagner, N.; Li, W.; Kapteyn, H.C.; Murnane, M.M. Elliptically polarized high-order harmonic emission from molecules in linearly polarized laser fields. Phys. Rev. Lett. 2009, 102, 073902. [Google Scholar] [CrossRef] [Green Version]
  21. Milošević, D.B.; Becker, W. X-ray harmonic generation by orthogonally polarized two-color fields: Spectral shape and polarization. Phys. Rev. A 2019, 100, 031401. [Google Scholar] [CrossRef]
  22. Kim, I.J.; Kim, C.M.; Kim, H.T.; Lee, G.H.; Lee, Y.S.; Park, J.Y.; Cho, F.J.; Nam, C.H. Highly Efficient High-Harmonic Generation in an Orthogonally Polarized Two-Color Laser Field. Phys. Rev. Lett. 2005, 94, 243901. [Google Scholar] [CrossRef] [Green Version]
  23. Milošević, D.B.; Becker, W. Generation of elliptically polarized soft x rays using high-order harmonic generation with orthogonal two-color laser fields. J. Phys. Conf. Ser. 2020, 1508, 012001. [Google Scholar] [CrossRef]
  24. Neufeld, O.; Podolsky, D.; Cohen, O. Floquet group theory and its application to selection rules in harmonic generation. Nat. Commun. 2019, 10, 405. [Google Scholar] [CrossRef] [PubMed] [Green Version]
  25. Zhai, C.; Shao, R.; Lan, P.; Wang, B.; Zhang, Y.; Yuan, H.; Njoroge, S.M.; He, L.; Lu, P. Ellipticity control of high-order harmonic generation with nearly orthogonal two-color laser fields. Phys. Rev. A 2020, 101, 053407. [Google Scholar] [CrossRef]
  26. Neufeld, O.; Cohen, O. Background-Free Measurement of Ring Currents by Symmetry-Breaking High-Harmonic Spectroscopy. Phys. Rev. Lett. 2019, 123, 103202. [Google Scholar] [CrossRef] [PubMed]
  27. Neufeld, O.; Cohen, O. Probing ultrafast electron correlations in high harmonic generation. Phys. Rev. Res. 2020, 2, 033037. [Google Scholar] [CrossRef]
  28. Watanabe, S.; Kondo, K.; Nabekawa, Y.; Sagisaka, A.; Kobayashi, Y. Two-Color Phase Control in Tunneling Ionization and Harmonic Generation by a Strong Laser Field and Its Third Harmonic. Phys. Rev. Lett. 1994, 73, 2692–2695. [Google Scholar] [CrossRef]
  29. Bordo, E.; Kfir, O.; Zayko, S.; Neufeld, O.; Fleischer, A.; Ropers, C.; Cohen, O. Interlocked attosecond pulse trains in slightly bi-elliptical high harmonic generation. J. Phys. Photon. 2020, 2, 034005. [Google Scholar] [CrossRef] [Green Version]
  30. Milošević, D.B.; Becker, W. High-order harmonic generation by bi-elliptical orthogonally polarized two-color fields. Phys. Rev. A 2020, 102, 023107. [Google Scholar] [CrossRef]
  31. Lein, M.; Hay, N.; Velotta, R.; Marangos, J.P.; Knight, P.L. Role of the Intramolecular Phase in High-Harmonic Generation. Phys. Rev. Lett. 2002, 88, 183903. [Google Scholar] [CrossRef] [PubMed] [Green Version]
  32. Odžak, S.; Milošević, D.B. Interference effects in high-order harmonic generation by homonuclear diatomic molecules. Phys. Rev. A 2009, 79, 023414. [Google Scholar] [CrossRef]
  33. Odžak, S.; Milošević, D.B. Dressed-bound-state molecular strong-field approximation: Application to high-order harmonic generation by heteronuclear diatomic molecules. J. Opt. Soc. Am. B 2012, 29, 2147–2155. [Google Scholar] [CrossRef]
  34. Itatani, J.; Levesque, J.; Zeidler, D.; Niikura, H.; Pépin, H.; Kieffer, J.C.; Corkum, P.B.; Villeneuve, D.M. Tomographic imaging of molecular orbitals. Nature (Lond.) 2004, 432, 867–871. [Google Scholar] [CrossRef]
  35. Niikura, H.; Dudovich, N.; Villeneuve, D.M.; Corkum, P.B. Mapping Molecular Orbital Symmetry on High-Order Harmonic Generation Spectrum Using Two-Color Laser Fields. Phys. Rev. Lett. 2010, 105, 053003. [Google Scholar] [CrossRef] [Green Version]
  36. Niikura, H.; Wörner, H.J.; Villeneuve, D.M.; Corkum, P.B. Probing the Spatial Structure of a Molecular Attosecond Electron Wave Packet Using Shaped Recollision Trajectories. Phys. Rev. Lett. 2011, 107, 093004. [Google Scholar] [CrossRef] [Green Version]
  37. Shafir, D.; Soifer, H.; Bruner, B.D.; Dagan, M.; Mairesse, Y.; Patchkovskii, S.; Ivanov, M.Y.; Smirnova, O.; Dudovich, N. Resolving the time when an electron exits a tunnelling barrier. Nature 2012, 485, 243–346. [Google Scholar] [CrossRef]
  38. Das, T.; Augstein, B.B.; Figueira de Morisson Faria, C. High-order-harmonic generation from diatomic molecules in driving fields with nonvanishing ellipticity: A generalized interference condition. Phys. Rev. A 2013, 88, 023404. [Google Scholar] [CrossRef] [Green Version]
  39. Liu, X.; Zhu, X.; Li, L.; Li, Y.; Zhang, Q.; Lan, P.; Lu, P. Selection rules of high-order-harmonic generation: Symmetries of molecules and laser fields. Phys. Rev. A 2016, 94, 033410. [Google Scholar] [CrossRef] [Green Version]
  40. Chen, C.; Ren, D.X.; Han, X.; Yang, S.P.; Chen, Y.J. Time-resolved harmonic emission from aligned molecules in orthogonal two-color fields. Phys. Rev. A 2018, 98, 063425. [Google Scholar] [CrossRef]
  41. Zhai, C.; Zhang, X.; Zhu, X.; He, L.; Zhang, Y.; Wang, B.; Zhang, Q.; Lan, P.; Lu, P. Single-shot molecular orbital tomography with orthogonal two-color fields. Opt. Express 2018, 26, 2775–2784. [Google Scholar] [CrossRef] [PubMed]
  42. Zhang, B.; Lein, M. High-order harmonic generation from diatomic molecules in an orthogonally polarized two-color laser field. Phys. Rev. A 2019, 100, 043401. [Google Scholar] [CrossRef]
  43. Ansari, Z.; Böttcher, M.; Manschwetus, B.; Rottke, H.; Sandner, W.; Verhoef, A.; Lezius, M.; Paulus, G.G.; Saenz, A.; Milošević, D.B. Interference in strong-field ionization of a two-centre atomic system. New J. Phys. 2008, 10, 093027. [Google Scholar] [CrossRef] [Green Version]
  44. Busuladžić, M.; Gazibegović-Busuladžić, A.; Milošević, D.B.; Becker, W. Angle-Resolved High-Order Above-Threshold Ionization of a Molecule: Sensitive Tool for Molecular Characterization. Phys. Rev. Lett. 2008, 100, 203003. [Google Scholar] [CrossRef] [PubMed]
  45. Okunishi, M.; Itaya, R.; Shimada, K.; Prümper, G.; Ueda, K.; Busuladžić, M.; Gazibegović-Busuladžić, A.; Milošević, D.B.; Becker, W. Angle-resolved high-order above-threshold ionization spectra for N2 and O2: Measurements and the strong-field approximation. J. Phys. B 2008, 41, 201004. [Google Scholar] [CrossRef]
  46. Okunishi, M.; Itaya, R.; Shimada, K.; Prümper, G.; Ueda, K.; Busuladžić, M.; Gazibegović-Busuladžić, A.; Milošević, D.B.; Becker, W. Two-Source Double-Slit Interference in Angle-Resolved High-Energy Above-Threshold Ionization Spectra of Diatoms. Phys. Rev. Lett. 2009, 103, 043001. [Google Scholar] [CrossRef]
  47. Kang, H.; Quan, W.; Wang, Y.; Lin, Z.; Wu, M.; Liu, H.; Liu, X.; Wang, B.B.; Liu, H.J.; Gu, Y.Q.; et al. Structure Effects in Angle-Resolved High-Order Above-Threshold Ionization of Molecules. Phys. Rev. Lett. 2010, 104, 203001. [Google Scholar] [CrossRef]
  48. Gazibegović-Busuladžić, A.; Hasović, E.; Busuladžić, M.; Milošević, D.B.; Kelkensberg, F.; Siu, W.K.; Vrakking, M.J.J.; Lépine, F.; Sansone, G.; Nisoli, M.; et al. Above-threshold ionization of diatomic molecules by few-cycle laser pulses. Phys. Rev. A 2011, 84, 043426. [Google Scholar] [CrossRef]
  49. Quan, W.; Lai, X.-Y.; Chen, Y.-J.; Wang, C.-L.; Hu, Z.-L.; Liu, X.-J.; Hao, X.-L.; Chen, J.; Hasović, E.; Busuladžić, M.; et al. Resonancelike enhancement in high-order above-threshold ionization of molecules. Phys. Rev. A 2013, 88, 021401. [Google Scholar] [CrossRef]
  50. Sun, R.P.; Lai, X.Y.; Yu, S.G.; Wang, Y.L.; Xu, S.P.; Quan, W.; Liu, X.J. Tomographic extraction of the internuclear separation based on two-center interference with aligned diatomic molecules. Phys. Rev. Lett. 2019, 122, 193202. [Google Scholar] [CrossRef]
  51. Habibović, D.; Gazibegović-Busuladžić, A.; Busuladžić, M.; Čerkić, A.; Milošević, D.B. Strong-field ionization of homonuclear diatomic molecules using orthogonally polarized two-color laser fields. Phys. Rev. A 2020, 102, 023111. [Google Scholar] [CrossRef]
  52. Milošević, D.B. Strong-field approximation for ionization of a diatomic molecule by a strong laser field. Phys. Rev. A 2006, 74, 063404. [Google Scholar] [CrossRef]
  53. Odžak, S.; Hasović, E.; Milošević, D.B. Strong-field-approximation theory of high-order harmonic generation by polyatomic molecules. Phys. Rev. A 2016, 93, 043413. [Google Scholar] [CrossRef]
  54. Odžak, S.; Hasović, E.; Milošević, D.B. High-order harmonic generation in polyatomic molecules induced by a bicircular laser field. Phys. Rev. A 2016, 94, 033419. [Google Scholar] [CrossRef] [Green Version]
  55. Atkins, P.W.; Friedman, R.S. Molecular Quantum Mechanics; Oxford University Press: Oxford, UK, 2001. [Google Scholar]
  56. Wahl, A.C. Analytic Self Consistent Field Wavefunctions and Computed Properties for Homonuclear Diatomic Molecules. J. Chem. Phys. 1964, 41, 2600–2611. [Google Scholar] [CrossRef]
  57. Milošević, D.B.; Ehlotzky, F. Scattering and Reaction Processes in Powerful Laser Fields. Adv. At. Mol. Opt. Phys. 2003, 49, 373–532. [Google Scholar] [CrossRef]
  58. Milošević, D.B. A semi-classical model for high-harmonic generation. In Super-Intense Laser-Atom Physics; Piraux, B., Rza̧żewski, K., Eds.; Kluwer: Dordrecht, The Netherlands, 2001; pp. 229–238. [Google Scholar]
  59. Becker, W.; Chen, J.; Chen, S.G.; Milošević, D.B. Dressed-state strong-field approximation for laser-induced molecular ionization. Phys. Rev. A 2007, 76, 033403. [Google Scholar] [CrossRef]
  60. Odžak, S.; Milošević, D.B. Ellipticity and the offset angle of high harmonics generated by homonuclear diatomic molecules. J. Phys. B 2011, 44, 125602. [Google Scholar] [CrossRef]
  61. Odžak, S.; Milošević, D.B. Elliptic dichroism, ellipticity and the offset angle of high harmonics generated by arbitrary homonuclear diatomic molecules. Laser Phys. 2012, 22, 1780–1786. [Google Scholar] [CrossRef]
  62. Odžak, S.; Milošević, D.B. Role of ellipticity in high-order harmonic generation by homonuclear diatomic molecules. Phys. Rev. A 2010, 82, 023412. [Google Scholar] [CrossRef]
  63. Odžak, S.; Milošević, D.B. Molecular high-order harmonic generation: Analysis of a destructive interference condition. J. Phys. B 2009, 42, 071001. [Google Scholar] [CrossRef]
  64. Gallagher, T.F. Above-Threshold Ionization in Low-Frequency Limit. Phys. Rev. Lett. 1988, 61, 2304–2307. [Google Scholar] [CrossRef] [PubMed]
  65. Corkum, P.B.; Burnett, N.H.; Brunel, F. Above-threshold ionization in the long-wavelength limit. Phys. Rev. Lett. 1989, 62, 1259–1262. [Google Scholar] [CrossRef]
  66. Schafer, K.J.; Yang, B.; DiMauro, L.F.; Kulander, K.C. Above threshold ionization beyond the high harmonic cutoff. Phys. Rev. Lett. 1993, 70, 1599–1602. [Google Scholar] [CrossRef] [PubMed]
  67. Fetić, B.; Milošević, D.B. High-order above-threshold ionization of the H2+ ion: The role of internuclear distance. Phys. Rev. A 2019, 99, 043426. [Google Scholar] [CrossRef]
  68. Salières, P.; Carré, B.; Le Déroff, L.; Grasbon, F.; Paulus, G.G.; Walther, H.; Kopold, R.; Becker, W.; Milošević, D.B.; Sanpera, A.; et al. Feynman’s Path-integral approach for intense-laser-atom interactions. Science 2001, 292, 902–905. [Google Scholar] [CrossRef] [Green Version]
  69. Milošević, D.B. Cut-off law for high-harmonic generation by an elliptically polarized laser field. J. Phys. B 2000, 33, 2479–2488. [Google Scholar] [CrossRef]
  70. Kopold, R.; Milošević, D.B.; Becker, W. Rescattering processes for elliptical polarization: A quantum trajectory analysis. Phys. Rev. Lett. 2000, 84, 3831–3834. [Google Scholar] [CrossRef]
  71. Milošević, D.B.; Bauer, D.; Becker, W. Quantum-orbit theory of high-order atomic processes in intense laser fields. J. Mod. Opt. 2006, 53, 125–134. [Google Scholar] [CrossRef]
  72. Milošević, D.B. Strong-field approximation and quantum orbits. In Computational Strong-Field Quantum Dynamics: Intense Light-Matter Interactions; Bauer, D., Ed.; De Gruyter Textbook: Berlin, Germany, 2016; Chap. VII; pp. 199–221. [Google Scholar]
  73. Milošević, D.; Becker, W. Role of long quantum orbits in high-order harmonic generation. Phys. Rev. A 2002, 66, 063417. [Google Scholar] [CrossRef]
  74. Milošević, D.B. Quantum-orbit analysis of high-order harmonic generation by bicircular field. J. Mod. Opt. 2019, 66, 47–58. [Google Scholar] [CrossRef]
Figure 1. The coordinate systems used in the paper. The homonuclear diatomic molecule is placed along the z axis. The angle θ L describes the position of the molecule relative to the laser field.
Photonics 07 00110 g001
Figure 2. Logarithm of the harmonic emission rate (displayed by a vertical colorbar to the right of the panel) of the N 2 molecule obtained using the ω 2 ω OTC laser field as a function of the harmonic order and the relative phase φ between the laser field components (left). The logarithm of the emission rate for even harmonics as a function of the harmonic order for the specific relative phases (right). Molecular orientation angle is θ L = 45 . The intensities of the laser-field components are equal, I 1 = I 2 = 7 × 10 13 W / cm 2 . The fundamental wavelength is λ = 2000 nm.
Photonics 07 00110 g002
Figure 3. Harmonic ellipticity (displayed by a vertical colorbar to the right of the figure) as a function of the harmonic order and the relative phase φ for HHG by N 2 molecule obtained using the ω 2 ω OTC laser field. The left (right) panel shows the ellipticity of odd (even) harmonics. Molecular orientation angle is θ L = 45 . Other parameters are the same as in Figure 2.
Photonics 07 00110 g003
Figure 4. Logarithm of the harmonic emission rate (top) and the ellipticity of the emitted harmonics (bottom) obtained using the ω 3 ω OTC laser field as a function of the harmonic order and the relative phase φ between the laser-field components. The left (right) column corresponds to the N 2 molecule (Ar atom). The molecular orientation is θ L = 70 . Other parameters are the same as in Figure 2.
Photonics 07 00110 g004
Figure 5. Logarithm of the harmonic emission rate of the N 2 molecule, exposed to the ω 3 ω OTC laser field, as a function of the harmonic order and the relative phase φ between the laser-field components. The molecular orientation angle is θ L = 0 . The white curve determines the maximal harmonic intensity, while the yellow curve corresponds to the maximal harmonic order obtained using the simple man’s model. The laser-field parameters are the same as in Figure 2.
Photonics 07 00110 g005
Figure 6. Logarithm of the harmonic emission rate of the N 2 molecule obtained using the ω 2 ω OTC laser field as a function of the harmonic order and the molecular orientation angle θ L for odd (top row) and even (bottom row) harmonics. The results shown in the first (second) column are obtained using only the T n Lz ( T n Lx ) component. The results in the third column correspond to the sum of both contributions according to | T n | 2 = | T n Lz | 2 + | T n Lx | 2 . The relative phase is φ = 45 . Other laser-field parameters are the same as in Figure 2.
Photonics 07 00110 g006
Figure 7. Harmonic ellipticity as a function of the harmonic order and the molecular orientation angle θ L for HHG obtained using the N 2 molecule and the ω 2 ω OTC laser field. The left (right) panel shows the ellipticity of odd (even) harmonics. The relative phase is φ = 45 . Other laser-field parameters are the same as in Figure 2.
Photonics 07 00110 g007
Figure 8. Logarithm of the harmonic emission rate as a function of the harmonic order and the molecular orientation angle θ L for HHG by N 2 molecule obtained using the ω 3 ω OTC laser field. The relative phase is φ = 0 . Other laser-field parameters are the same as in Figure 2.
Photonics 07 00110 g008
Figure 9. Logarithm of the harmonic emission rate of the N 2 molecule obtained using the ω 3 ω OTC laser field as a function of the harmonic order and the molecular orientation angle θ L . The white curve corresponds to the interference minima curve. The molecular orbital is modeled using only s (left) or only p (right) orbitals. The relative phase is φ = 0 . Other parameters are the same as in Figure 2.
Photonics 07 00110 g009
Figure 10. Logarithm of the harmonic emission rate of the N 2 molecule obtained using the ω 3 ω OTC laser field as a function of the harmonic order and the molecular orientation angle θ L . The molecular orbital is modeled using only p orbitals. The fundamental wavelength and the relative phase are 2500 nm and φ = 0 , respectively. The white curve corresponds to the interference minima curve. Other parameters are the same as in Figure 2.
Photonics 07 00110 g010
Figure 11. Logarithm of the harmonic emission rate of the Ar 2 molecule obtained using the ω 3 ω OTC laser field as a function of the harmonic order and the molecular orientation angle θ L . The internuclear distance is R 0 = 7.2 a.u. The relative phase is φ = 0 . The white curves corresponds to the interference minima curve. The intensities of the OTC laser-field components are I 1 = 9 × 10 13 W/cm 2 and I 2 = 0.3 I 1 , while the fundamental wavelength is λ = 2000 nm.
Photonics 07 00110 g011
Figure 12. The harmonic ellipticity as a function of the harmonic order and the molecular orientation angle θ L for HHG by N 2 molecule obtained using the ω 3 ω OTC laser field. The relative phase is φ = 0 . The black, blue and green curves are the curves which correspond to the solutions of the equations R Lz = 0 and R Lx = 0 , and they are calculated for the quantum orbits SP1, SP2 and SP0, respectively (see Appendix A). Other laser-field parameters are the same as in Figure 2.
Photonics 07 00110 g012
Figure 13. Logarithm of the harmonic emission rate (left) and the harmonic ellipticity (right) of the N 2 molecule obtained using the ω 3 ω OTC laser field as a function of the harmonic order and the ratio I 2 / I 1 of the intensities of the laser-field components. Molecular orientation angle is θ L = 60 . The intensities of the fundamental laser-field component is I 1 = 7 × 10 13 W / cm 2 , while the fundamental wavelength and the relative phase are λ = 2000 nm and φ = 0 , respectively.
Photonics 07 00110 g013
Figure 14. The harmonic ellipticity (top), log 10 | T n Lz | 2 (middle, solid lines), log 10 | T n Lx | 2 (middle, dashed lines) and the total emission rate (bottom) as functions of the molecular orientation angle θ L for HHG by N 2 molecule obtained using the ω 3 ω OTC laser field. The relative phase is φ = 0 . Other laser-field parameters are the same as in Figure 2.
Photonics 07 00110 g014
Publisher’s Note: MDPI stays neutral with regard to jurisdictional claims in published maps and institutional affiliations.

