1. Introduction
The synthesis of semiconductor nanoparticles such as quantum dots (QDs) with desired properties is among the most rapidly developing areas in the chemistry of nanoparticles. The quantum confinement effect in nanocrystals allows for the fabrication of materials with various properties from identical precursors just by changing reaction conditions [
1]. Due to affordable methods of synthesis, high photostability, broad adsorption band and tunable luminescence capabilities, QDs are increasingly in demand as luminophores [
2], photocatalysts [
3], and luminescent markers for biological experiments [
4].
A special type of QDs are nanoparticles doped with small amounts of paramagnetic ions of transient metals (such as manganese, copper, or nickel). The presence of doped ions in semiconductor nanocrystals provides them with additional energy levels and, thus, exerts significant influence on the optical and magnetic properties of the quantum dots [
5,
6]. Also, the location of dopant ions (individual ions in a QD matrix or on the surface of nanoparticles or ions in an aggregated form) contribute to different optical and magnetic properties of the nanoparticles [
7,
8,
9,
10,
11]. A relevant problem is the determination of the environment around such doped ions. The positions of paramagnetic ions in a QD crystal lattice can be determined by electron paramagnetic resonance (EPR). This technique, however, is not a popular method for the structural characterization of nanoparticles and its application is mostly limited to detecting the paramagnetic state of impregnated ions.
High-temperature colloidal synthesis of QDs in an organic medium allows for the fabrication of nanoparticles with a narrow size distribution and higher quantum yield of luminescence. However, during the process of synthesis, it is possible to separate impurity ions from nanoparticles, change their distribution type (single particles or aggregates) in the crystal lattice, and the oxidation state,. This problem, thus, requires a more detailed study [
12].
As we have shown previously [
8], high temperature exposure can lead to an improvement in the luminescent and paramagnetic characteristics of CdS nanoparticles due to the displacement of impurity ions and a decrease in the amount of structural and surface defects in nanocrystals.
This paper is focused on the study and comparison of CdS and ZnS nanoparticles, doped with manganese ions of different concentrations (1%, 6%, and 10%) and establishing peculiarities in the process of introduction of manganese ions for various reaction times at high synthesis temperatures (220 °C). The combination of optical and EPR spectroscopy methods have made it possible to establish the specific features of the location of manganese ions in nanoparticles depending on the synthesis time.
2. Materials and Methods
Materials: Cadmium oxide (II) (99%, Vekton, Russia), zinc acetate (II) dihydrate (99%, Reahim, Russia), manganese acetate (II) (99%, Vekton, Russia), elementary sulfur (99.99%, Lenreaktiv, Russia), decanethiol (98%, Alfa Aesar, Great Britain), oleylamine (90%, Acros, Belgium), octadecene-1 (90%, Acros, Qatar), oleic acid (98%, Ekos, Russia), chloroform (99.5%, Vekton, Russia), tetrachloromethane (99%, Ekos, Russia), ethanol (96%, Vekton, Russia), acetone (99%, Ekos, Russia).
Nanoparticles doped with manganese ions were synthesized similar to the previously described method of solvothermal colloidal synthesis in octadecene-1 [
8,
13].
Sixty-four mg (0.5 mmol) of cadmium oxide (II) and 1 mL of oleic acid were mixed in 4 mL of octadecene at 170 °C to form cadmium oleate solution; 64 mg (2 mmol) of sulfur were dissolved in 10 mL of octadecene at 170 °C. The required amount of manganese acetate was dissolved in the mixture containing 0.5 mL of oleylamine and 4.5 mL of octadecene at 80 °C. The reaction was started by adding sulfur and manganese acetate solutions to the degassed mixture containing 5 mL of dodecanethiol in 10 mL of octadecene and heating the resulting mixture up to 80 °C; cadmium oleate was added in 30 s and the reaction mixture was heated up to 220 °C (20 °C/min). When the desired temperature was reached, the aliquots were taken at specific time intervals, then reprecipitated three times from the tetrachloromethane-ethanol mixture and dispersed in chloroform for further characterization. Zn0.9Mn0.1S nanoparticles were synthesized by a similar method with zinc acetate used instead of cadmium oxide.
The absorption spectra of QDs were recorded on a Perkin Elmer Lambda spectrophotometer, the luminescence spectra were recorded on a Varian Cary Eclipse spectrofluorometer. EPR studies were performed on a Bruker Elexsys E580 laboratory setup. The hydrodynamic sizes of colloidal nanoparticles were measured using the dynamic light scattering (DLS) method by a Malvern Zetasizer Nano-ZS apparatus. X-ray diffractograms were recorded on a Bruker D2 Phaser with CuKα radiation.
3. Results
3.1. Size and XRD Characteristics
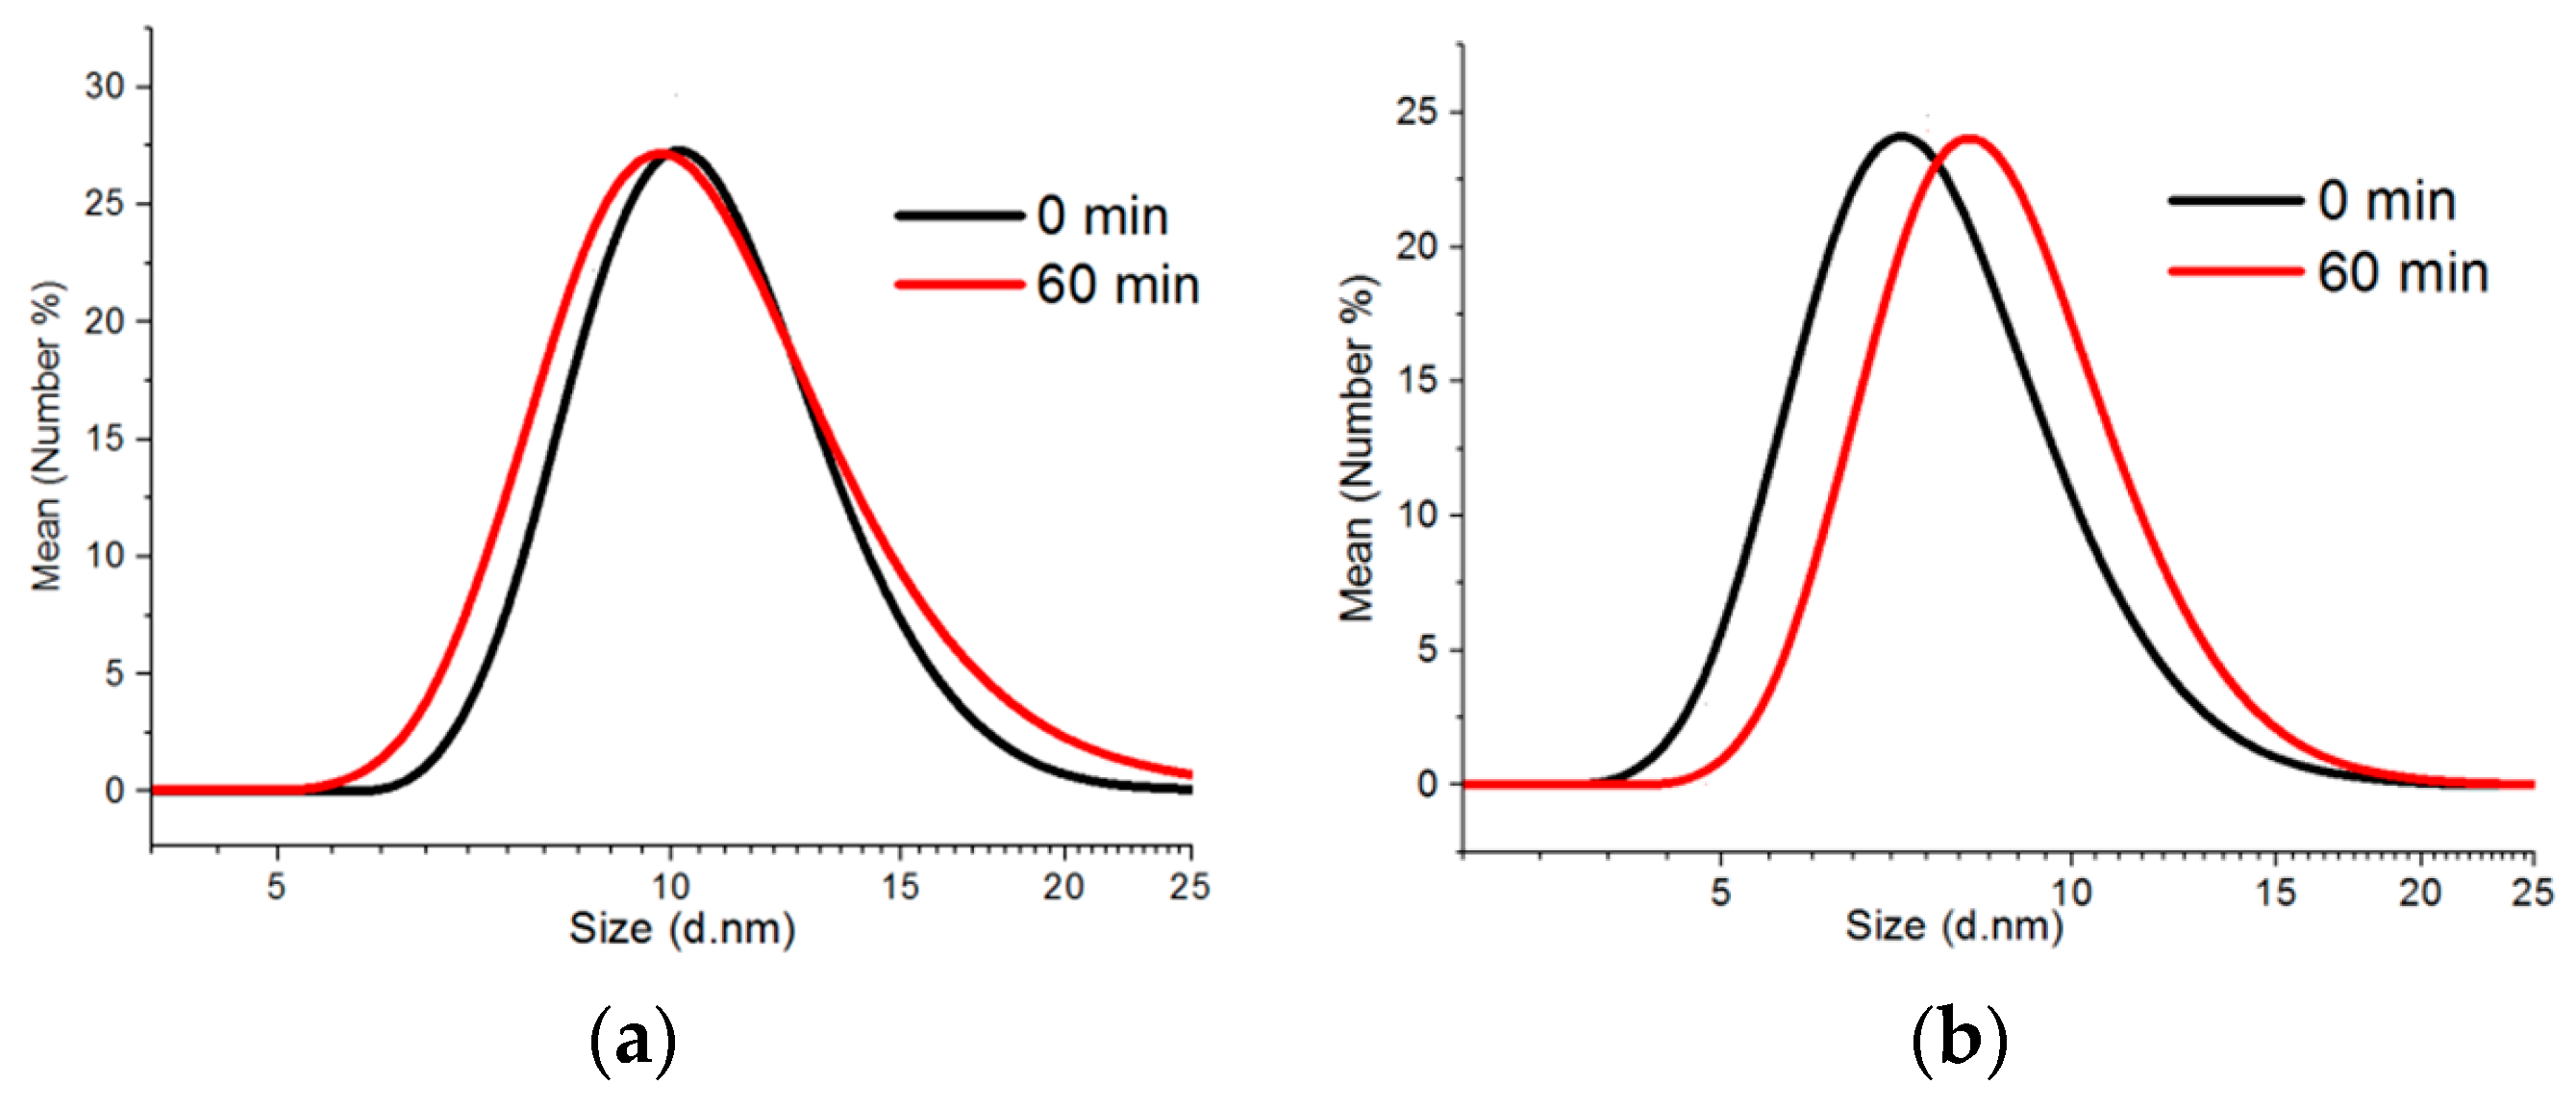
The colloidal synthesis method was applied to fabricating CdS and ZnS nanoparticles doped with up to 10% of manganese ions as compared to the total amount of cations. The synthesis process performed at 220 °C allowed for the fabrication of QDs with the CdS matrix and the particles with the average size of 9–13 nm (according to the DLS data) depending on the time of synthesis. The increase of the reaction time did not make a substantial contribution to the value of an average hydrodynamic size of Cd
0.9Mn
0.1S nanoparticles but made them more polydisperse: The polydispersity index grew from 0.542 to 0.645. (
Figure 1a).
Zn
0.9Mn
0.1S QDs are represented by smaller particles possibly due to lower reactivity of zinc ions. The average hydrodynamic size of nanoparticles was 7 nm when the 220 °C temperature was reached and 8 nm 60 min later (
Figure 1b). In contrast to Cd
0.9Mn
0.1S nanoparticles, the polydispersity index of Zn
0.9Mn
0.1S QDs decreased from 0.372 to 0.236. It should be noted that the DLS values correspond to the total size of particles with the surface shell of stabilizers (dodecanethiol and oleylamine).
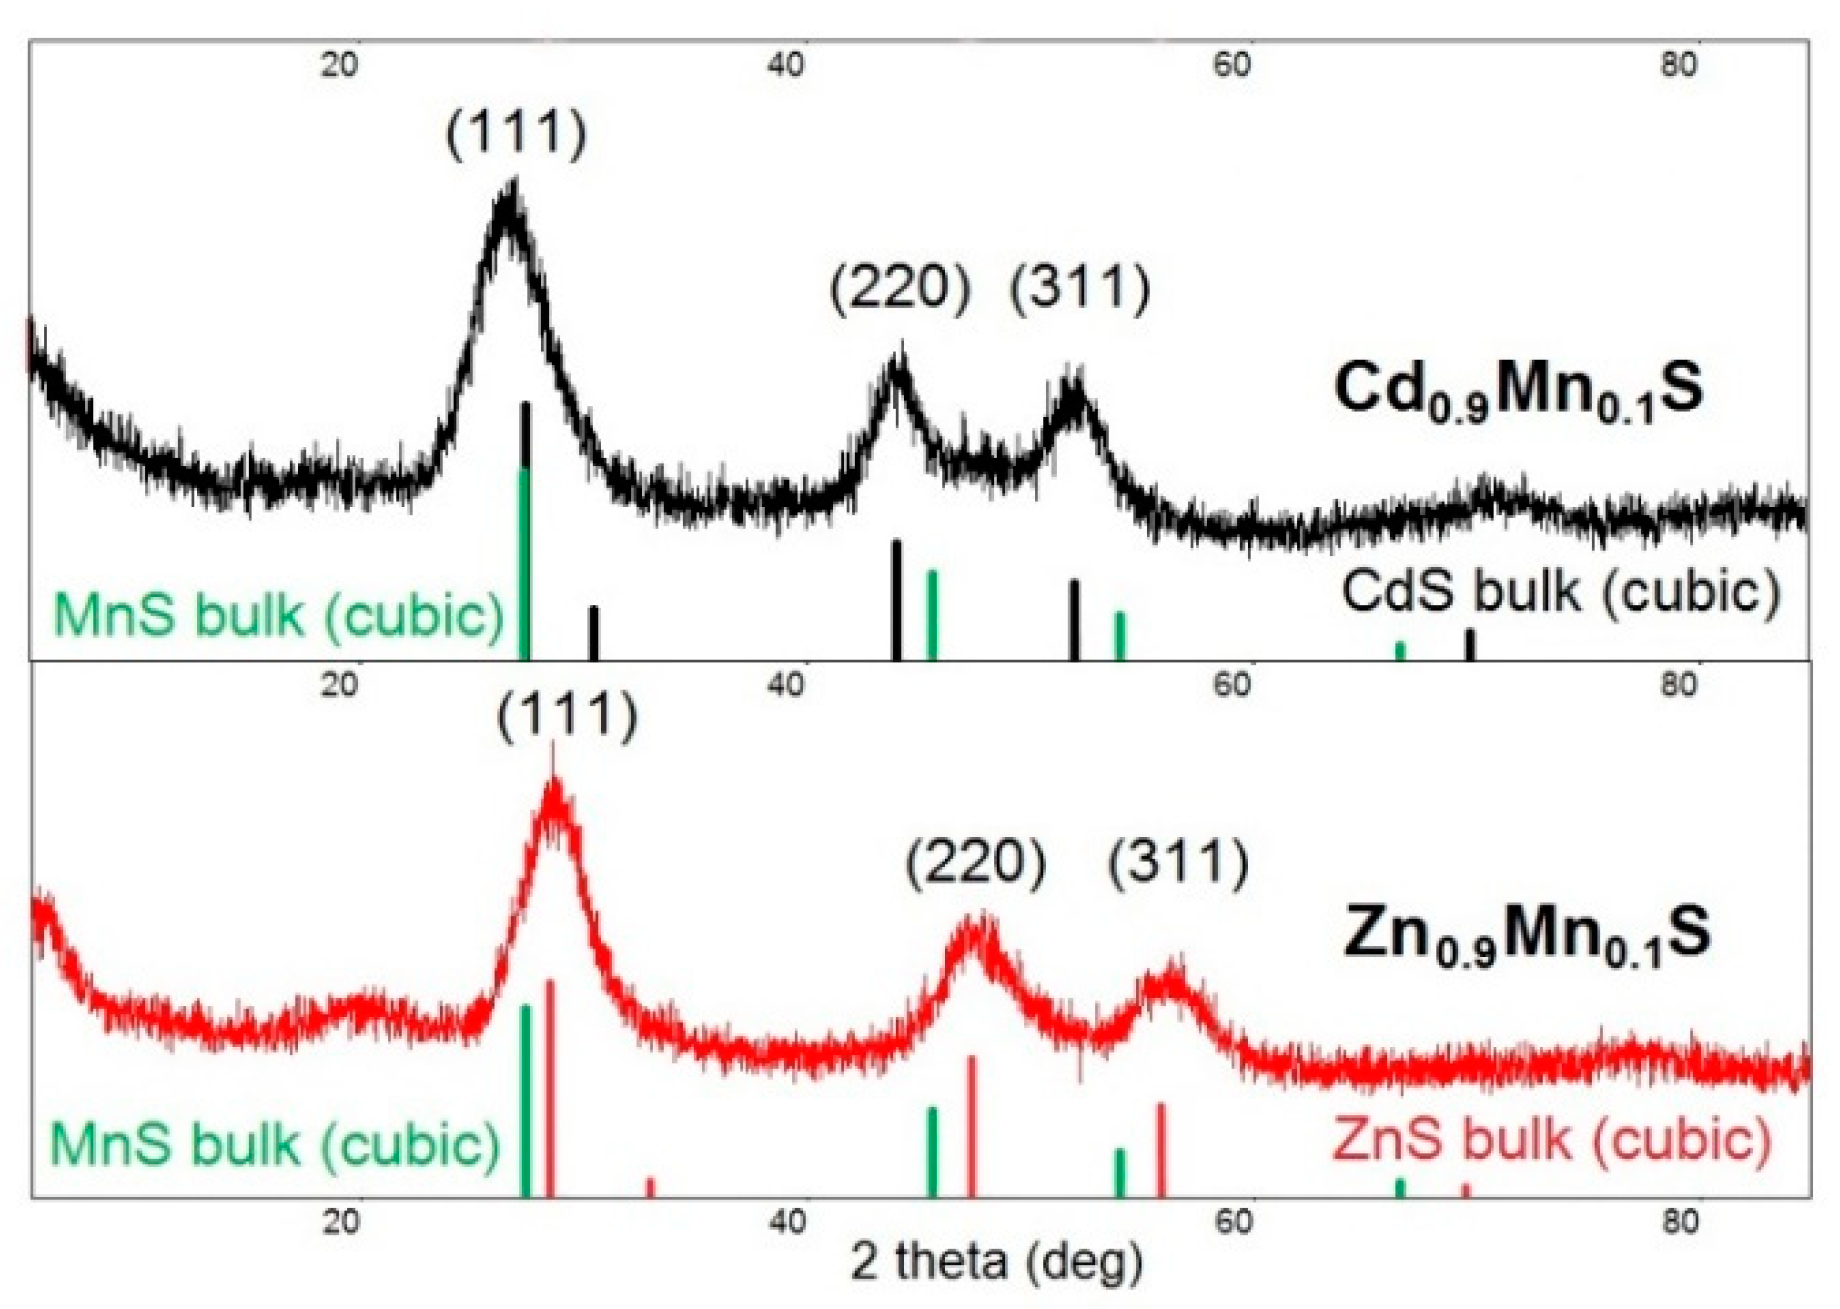
The crystalline structure of Cd
0.9Mn
0.1S and Zn
0.9Mn
0.1S nanoparticles studied by XRD has a zinc blend structure (a cubic phase); the peaks correspond to diffraction from the 111, 220, and 311 planes (
Figure 2). The signals from the MnS phase were not detected. Broadening reflections indicate that formation of nanocrystals occurs in this system. The average size of crystalline phase domains was calculated by the Debye–Scherrer formula,
where
D is the average size of crystalline phase domains,
λ is the wavelength (1.5406 Å),
K is the Debye–Scherrer’s constant (0.9),
β is the full width at half maximum of the peak (the 111 plane), and
θ is the Bragg angle.
The average size of Cd0.9Mn0.1S and Zn0.9Mn0.1S crystalline phase domains collected after 60 min of synthesis was 3 and 2.2 nm, respectively.
3.2. Optical Properties of Nanoparticles
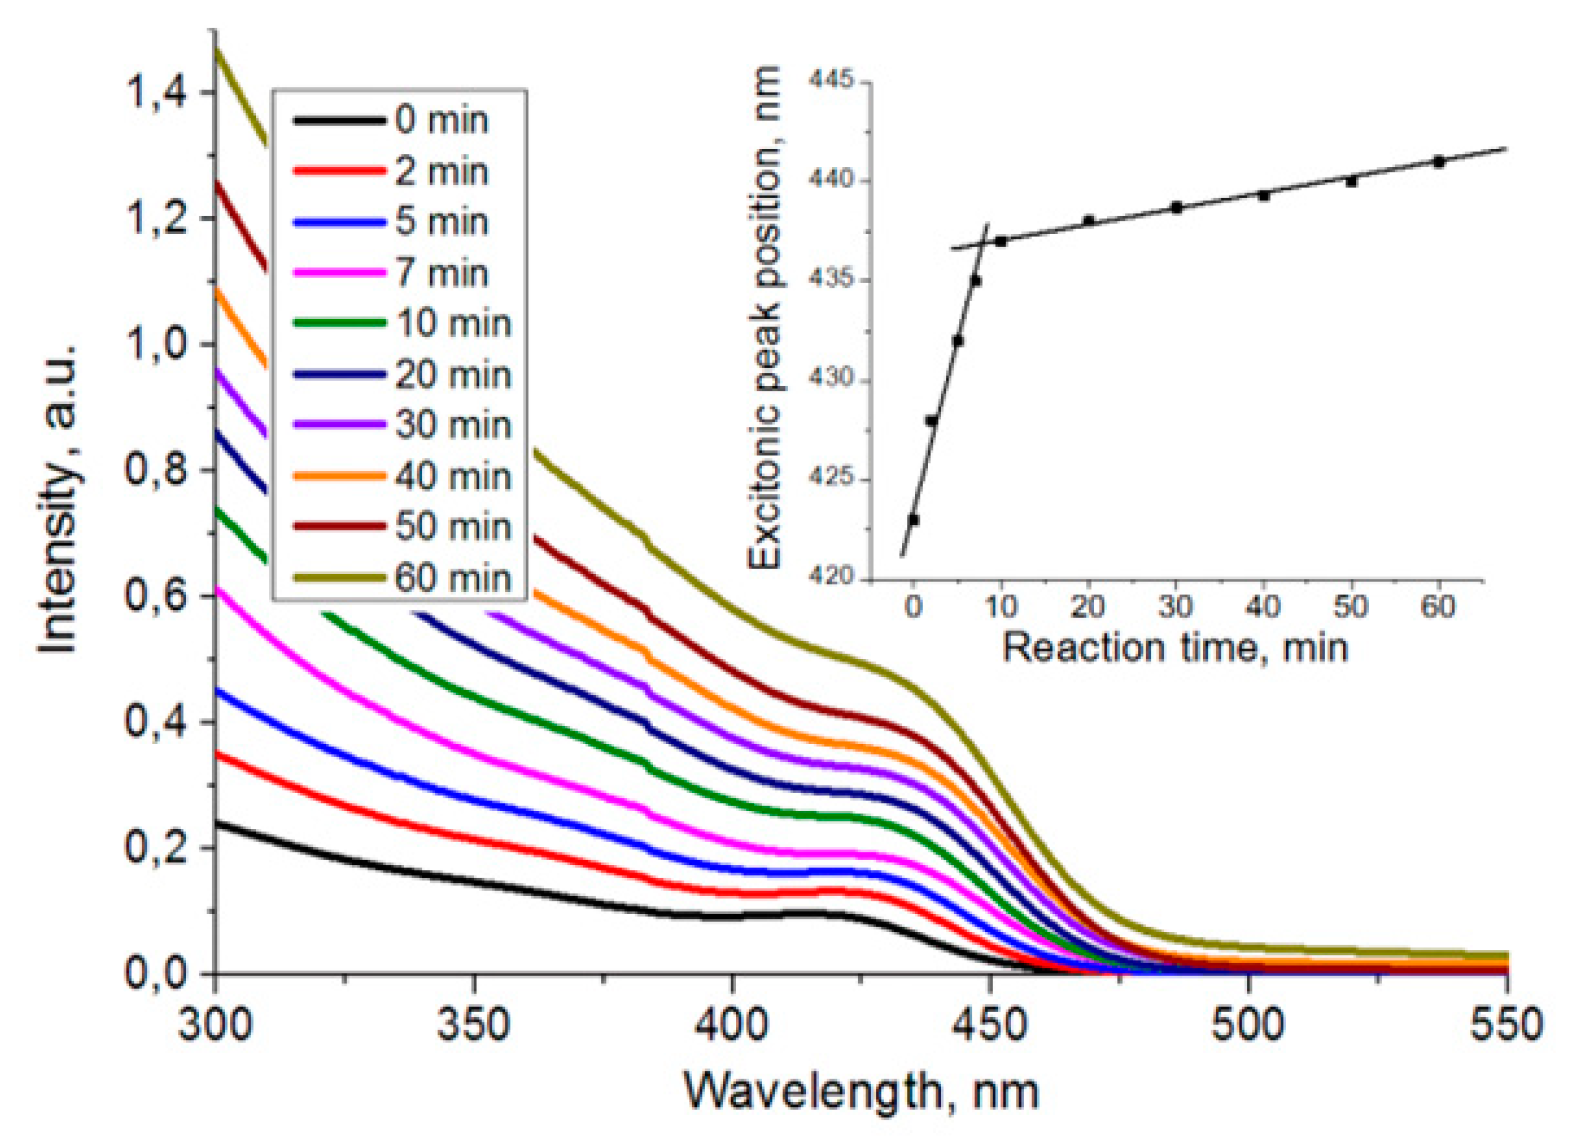
The absorption spectra of Cd
0.9Mn
0.1S nanoparticles contain shoulders in the long wave area, which correspond to the exciton absorption peak (
Figure 3). The position of the exciton peak shifts to the long wavelength region with the increase of reaction time due to narrowing of the bandgap with the growth of particles.
The maximum of exciton absorption correlates directly with the average size of nanoparticles, which can be calculated from empirical polynomials for various types of QDs [
14]. The shifts of the absorption peak indicate that nucleation and rapid growth of particles occur within 10 min after the constant temperature 220 °C is reached. For later times, the growth of particles is characterized by Ostwald ripening (
Figure 3, insertion). Absorption spectra of Zn
0.9Mn
0.1S nanoparticles have similar changes with an inflection point at 10 min.
For the synthesized Cd
xMn
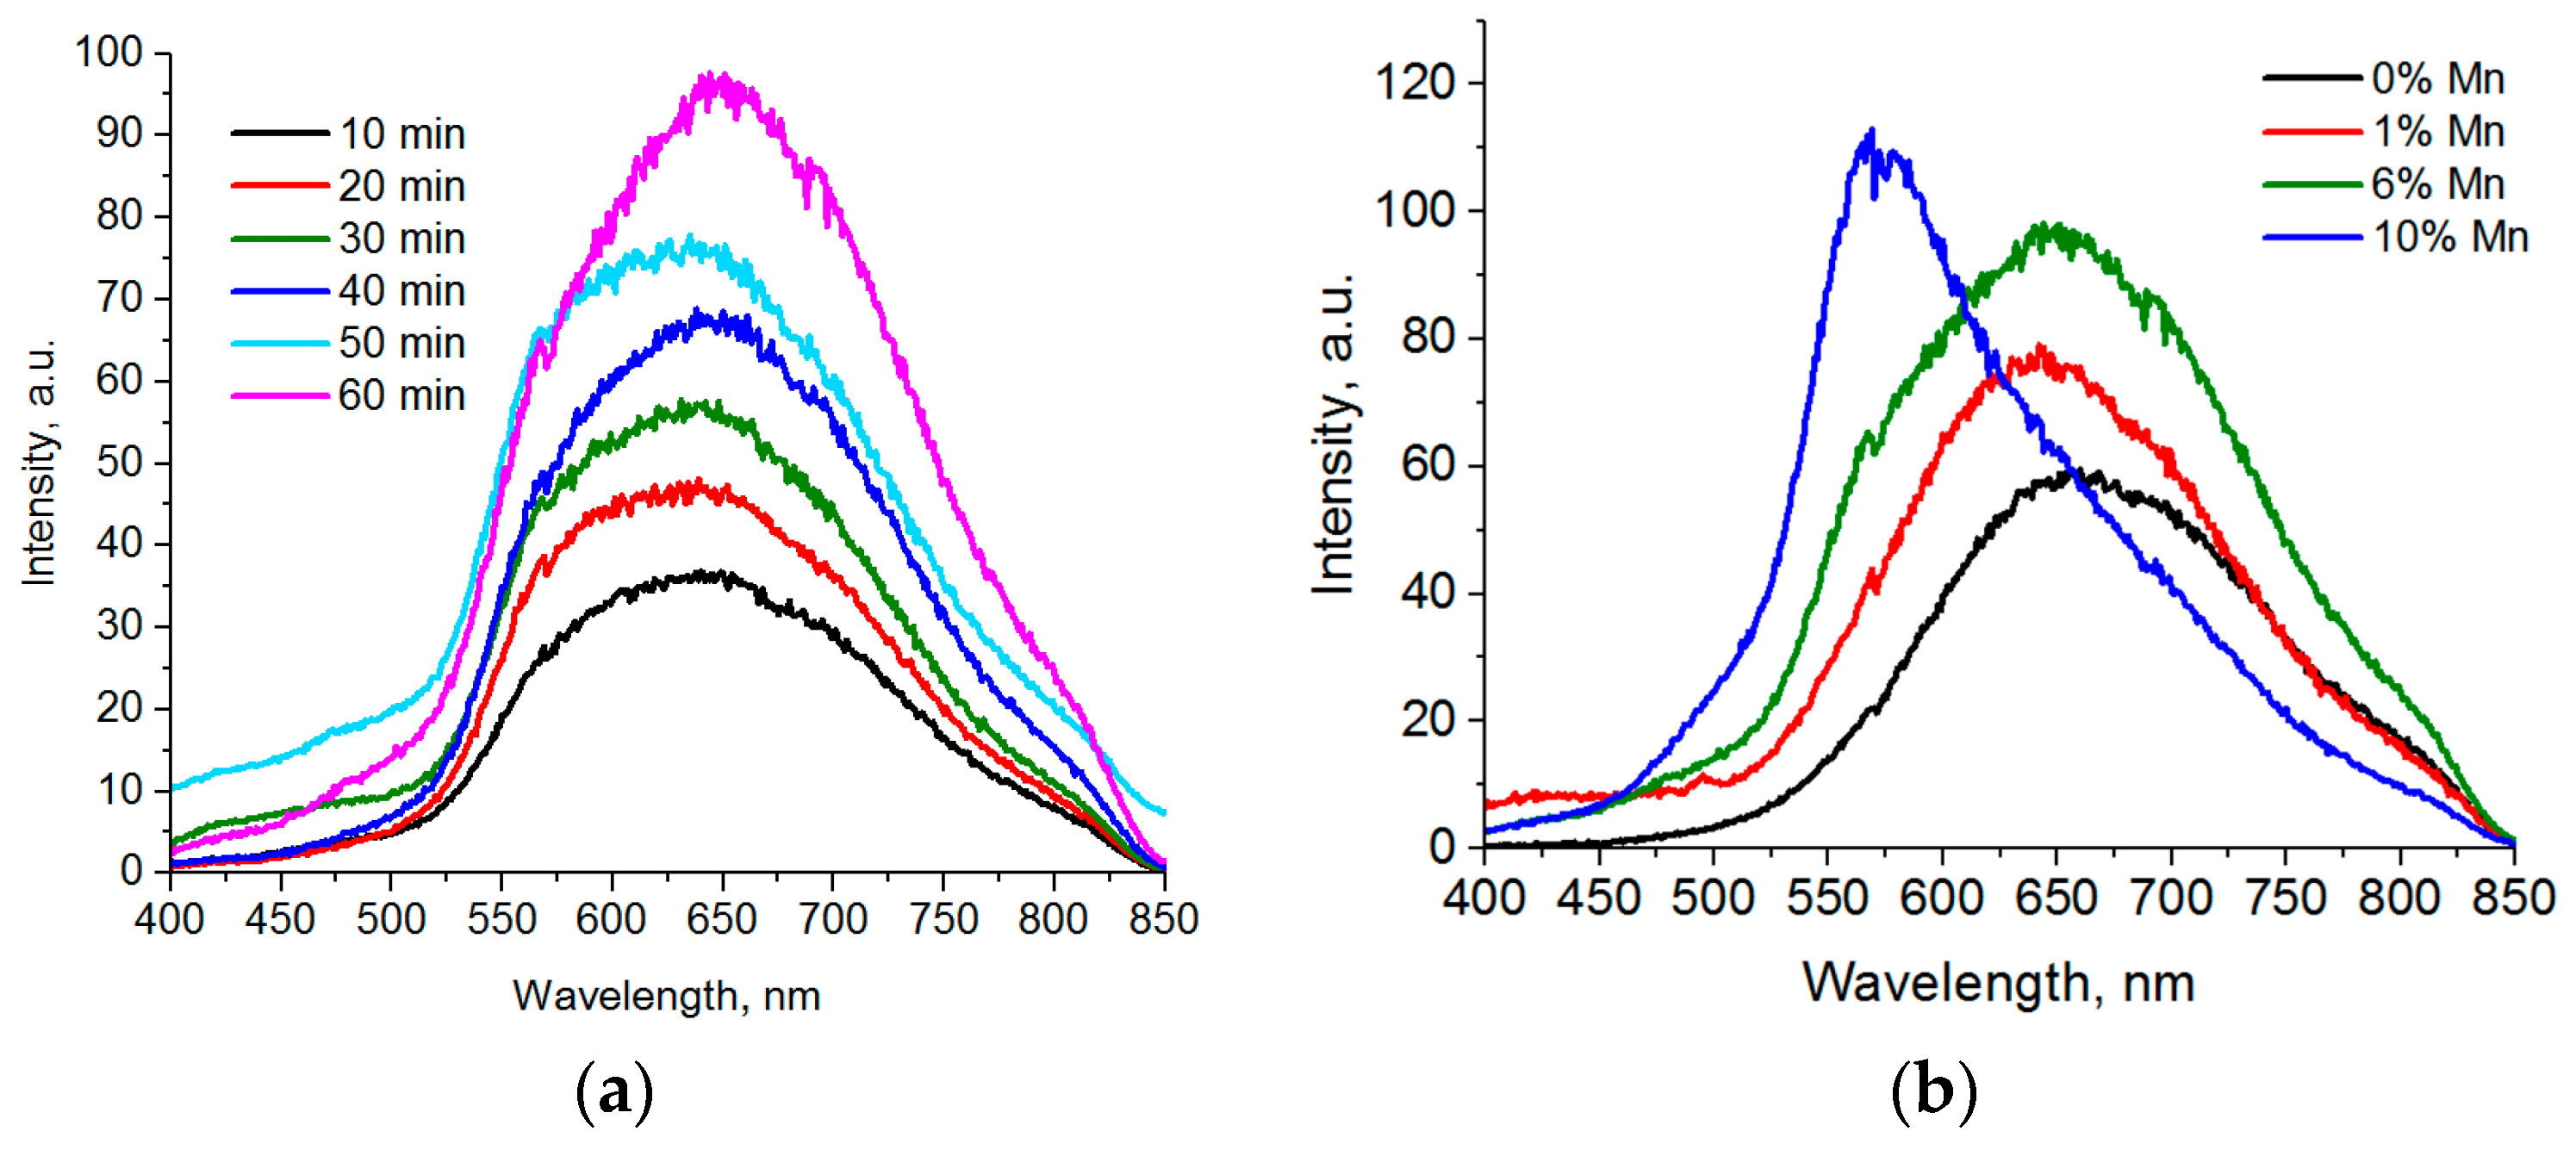
1-xS nanoparticles, a broad luminescence band in the yellow-red spectral range is quite typical. Depending on synthesis conditions, the peak position varies in the 580–640 range and variations in peak width can be also observed.
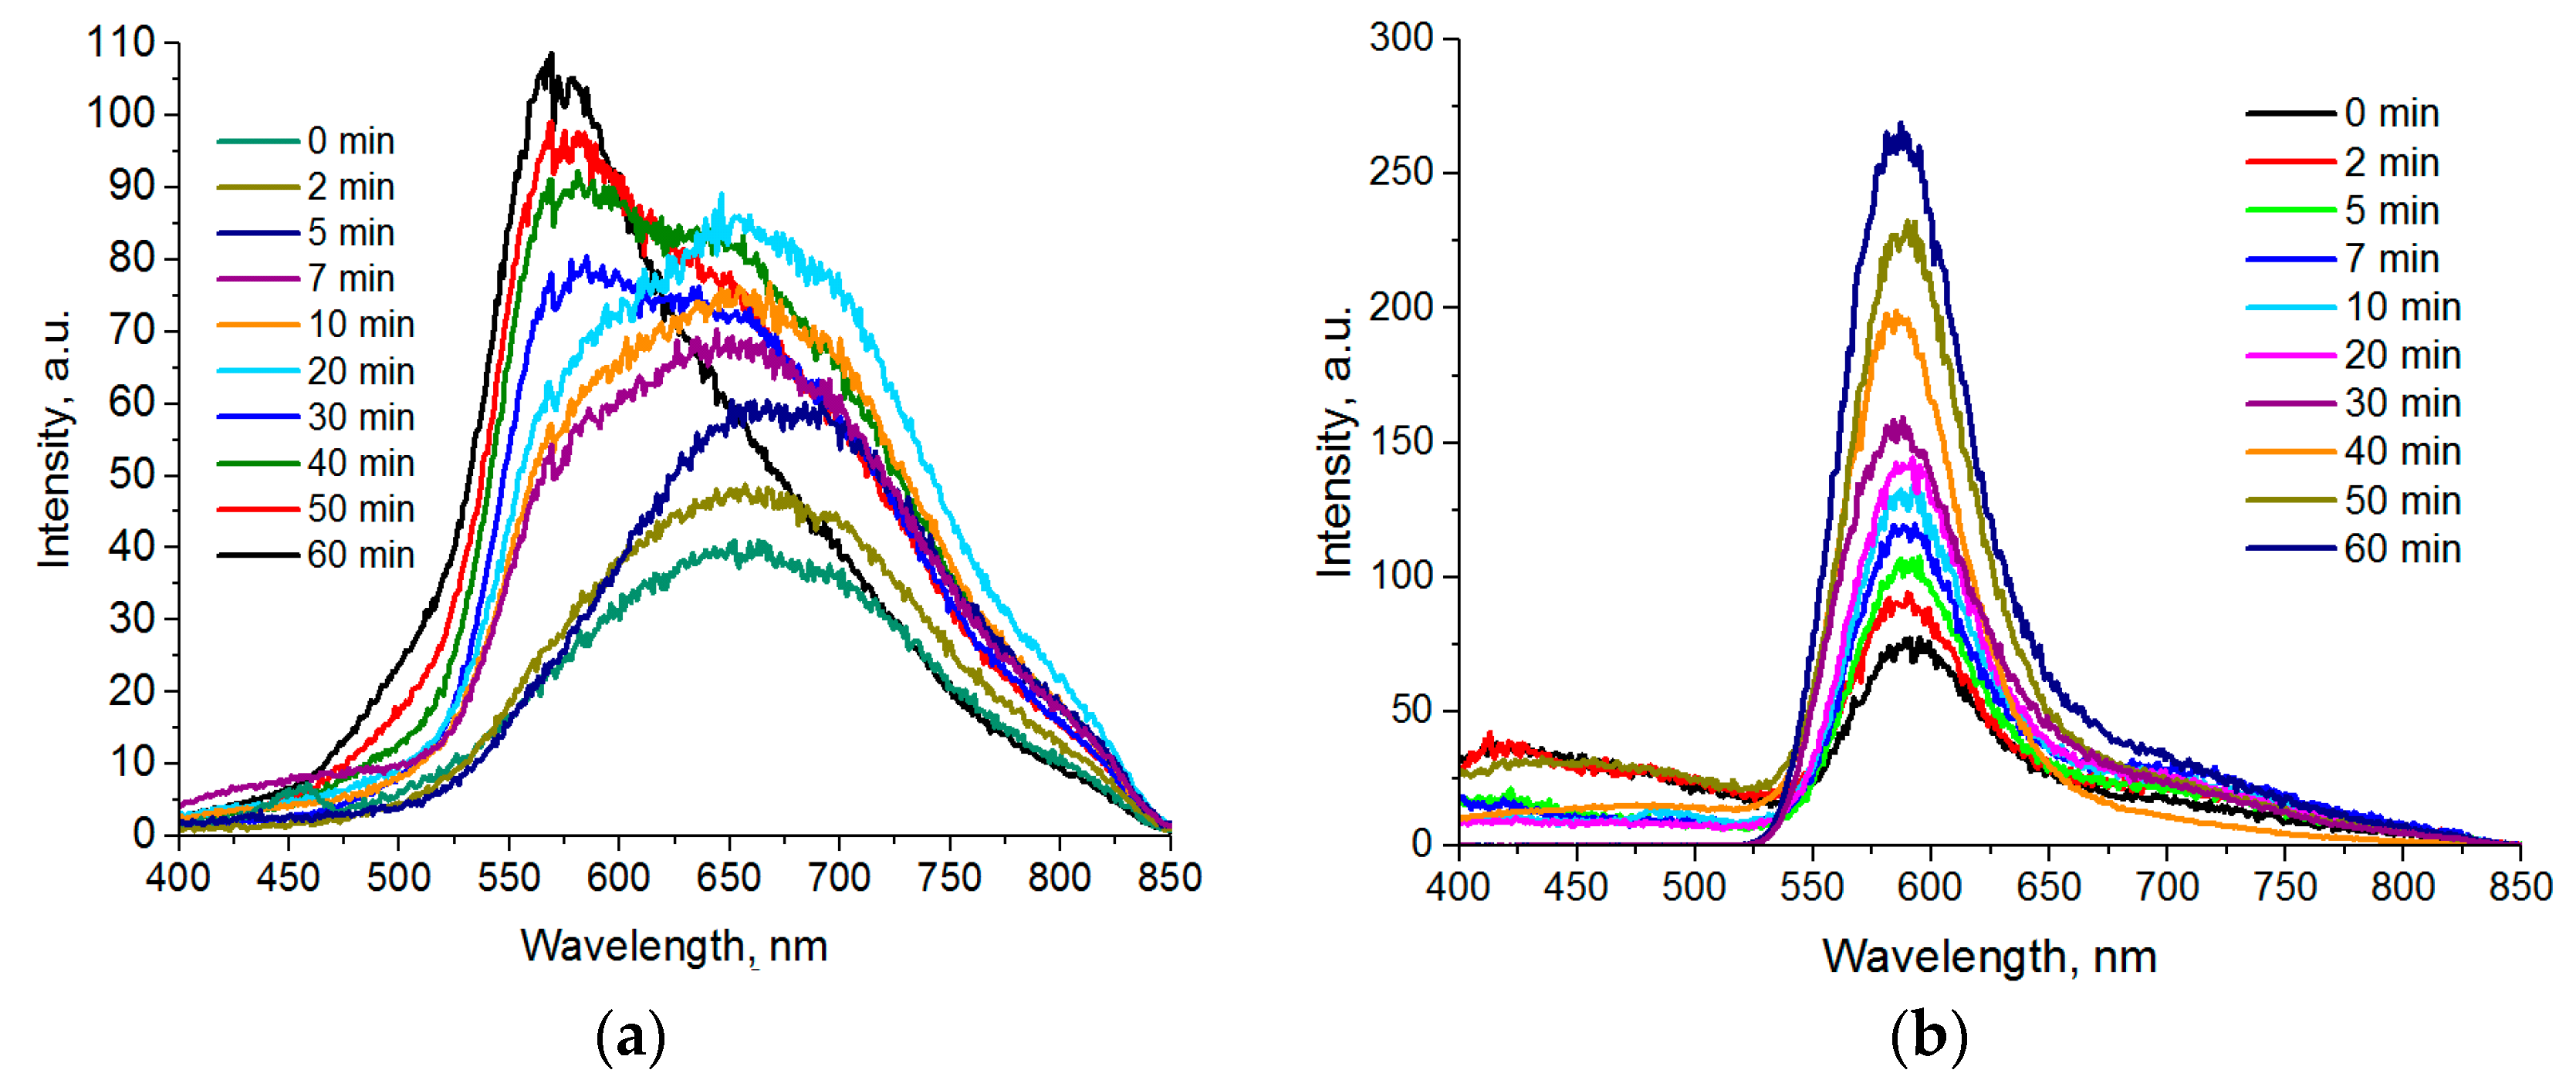
Figure 4a represents luminescence spectra of Cd
0.9Mn
0.1S nanoparticles with various sampling times after a 220 °C temperature was reached. We can see that the peak shifts to the red area at initial stages of formation and growth of particles. The reverse process can be detected 5 min later: A “blue” shift occurs, accompanied by the reduction of the long wave component of the spectrum and the growth of the peak intensity at 580 nm.
The luminescence band with the peak in the 575–590 nm range is known to correspond to d-d transitions between 4T
1 and 6A
1 states in Mn (II) ions [
5]. In turn, peak broadening and shifting to the longer wave area can occur in nanocrystals with considerable number of defects in their crystalline lattices and the variety of surface states provided by unsubstituted valence bonds, nonstoichiometric formation of nanoparticles, and incorporated dopants. We correlated the emission band in the long-wavelength part of the spectrum with luminescence of defects, since CdS nanoparticles without manganese ions synthesized by a similar method had the same emission band. During formation of nanoparticles at high synthesis temperatures, the contribution to luminescence from “traps” decreases both due to elimination of crystal lattice defects and displacement of dopant ions, resulting in the “blue” shift of the peak.
In our previous paper, it was shown that the blue shift occurs due to a decrease in the luminescence intensity of defects in the crystal lattice and an increase in the luminescence from of 4T1 and 6A1 electronic transitions of Mn (II) ions [
8].
Zinc sulfide is a wider bandgap semiconductor than cadmium sulfide and its bandgap luminescence is located in the near UV–violet range. The luminescence of crystal lattice defects is in the green spectral range. Introduction of manganese ions to the ZnS crystal lattice creates additional electron levels with lower energies as compared to crystal lattice or surface defects of nanoparticles.
The luminescence spectra of Zn
0.9Mn
0.1S QDs are demonstrated on
Figure 4b. As opposed to Cd
0.9Mn
0.1S QDs, we can see that for all synthesis times and core sizes of nanoparticles, the luminescence bands have the same peaks in the 585–590 nm range corresponding to the 4T
1–6A
1 transitions in Mn (II) ions. The ZnS QDs synthesized by the same method demonstrate crystal lattice luminescence defects with the peaks in the 460–480 nm range.
The position of a luminescence peak depends on reaction conditions and the ratio of incorporated manganese ions to cadmium ions. For Cd
0.94Mn
0.06S nanoparticles; the peak of luminescence broadens to higher energies with an increase of the reaction time (
Figure 5a). However, there is no complete split into two peaks with subsequent development of a separate peak of d-d transitions in manganese ions.
Cd
0.99Mn
0.01S nanoparticles with 1% Mn ions generate a symmetric luminescence peak at 650 nm (
Figure 5b), which does not change with an increase of the reaction time. This peak corresponds to the luminescence of crystalline lattice defects. CdS QDs synthesized in the same conditions demonstrate luminescence of the surface defects, which slightly shifts to the longer wave area (from 630 to 655 nm) with an increase of the synthesis time.
Thus, a part of Mn ions does not transfer electronic excitation over the 4T
1–6A
1 levels, but only leads to formation of luminescence of defects in the CdS crystal lattice (
Figure 5b).
3.3. The Study of Distribution of Manganese Ions by EPR
Depending on synthesis conditions, QDs can possess considerably different paramagnetic properties due to different locations of paramagnetic ions and their environment. Locations of paramagnetic ions can also change during high temperature synthesis due to self-cleaning of colloidal nanoparticles from dopant ions [
15]. This process is more typical for cadmium compounds as there is considerable difference in the radii of manganese and cadmium ions. The EPR spectroscopy method is suitable for studying the state of paramagnetic ions in nanoparticles.
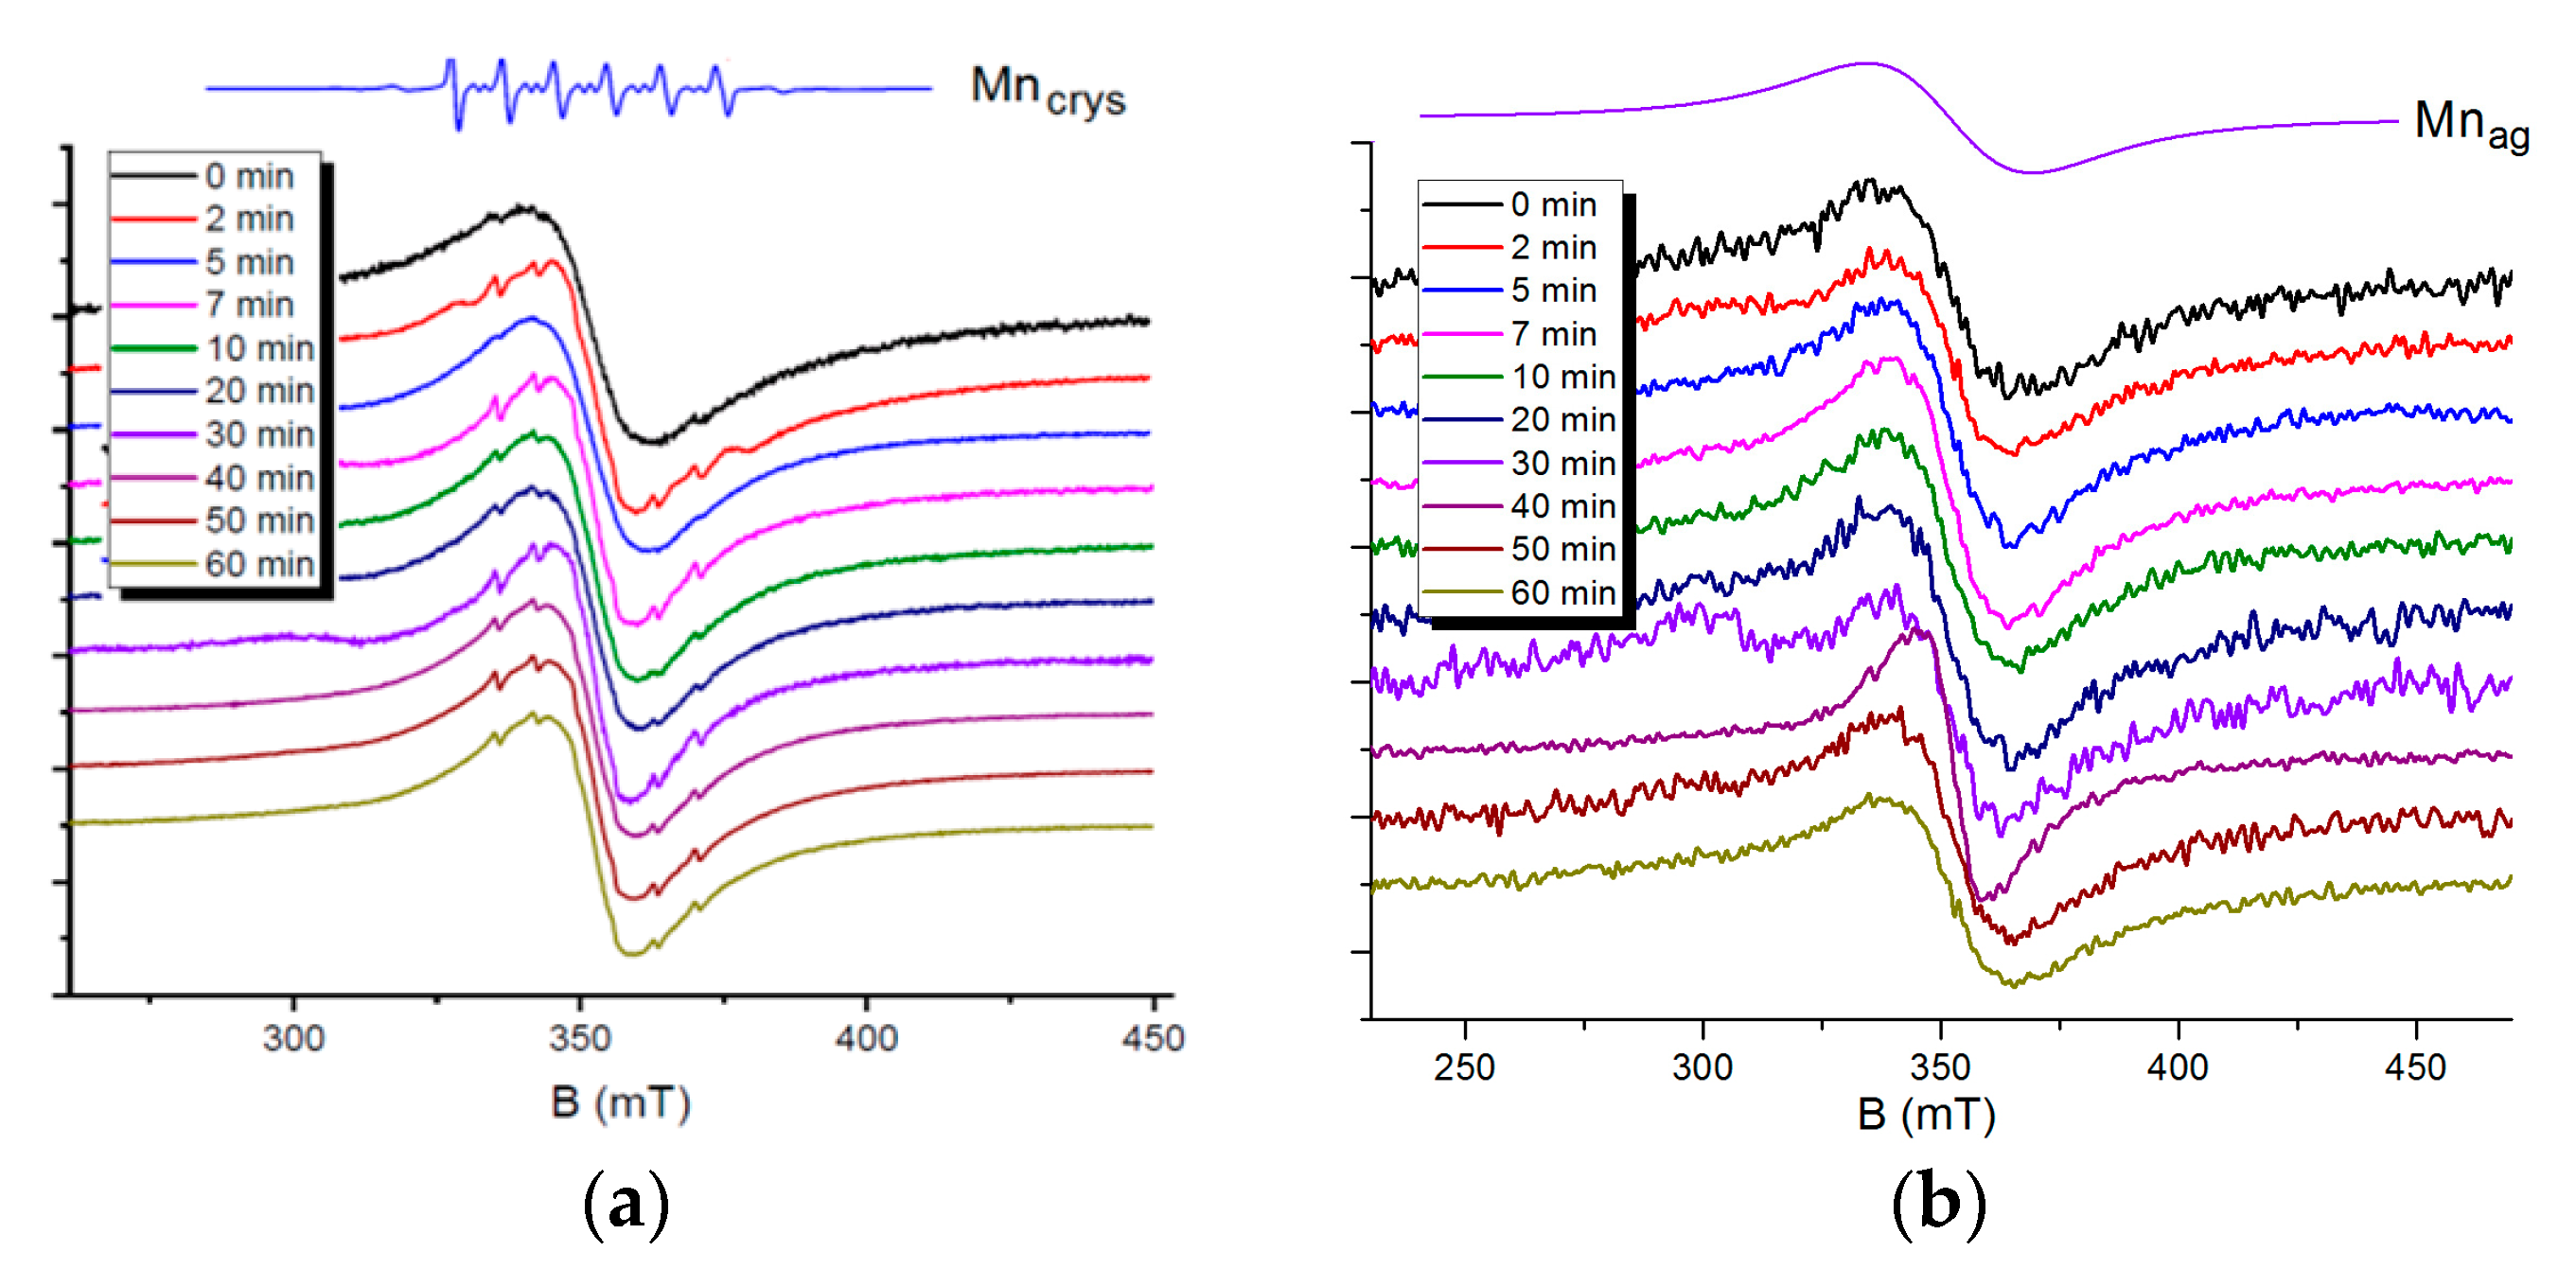
A detailed analysis of EPR spectra of quantum dots containing manganese ions is possible to perform by decomposing spectral lines generated by Mn (II) ions in different environments. A spin-Hamiltonian with S = 5/2, g = 2, and I = 5/2 was applied to characterize the EPR spectra of the samples. Individual manganese ions in a crystal lattice of nanoparticles generate well distinguishable six-component signals with the hyperfine coupling constant A = 7 mT and fine structure constant D = 7.9 mT (
Figure 6a, the Mn
crys line). Aggregated manganese ions are characterized by a single exchange-narrowed line with a signal width of 60 mT, which indicates a broad signal due to dipole–dipole interactions between ions (
Figure 6b, the Mn
ag line).
Figure 6a represents EPR spectra of Cd
0.9Mn
0.1S nanoparticles, samples taken at various times after the start of synthesis. According to the EPR data, the majority of manganese ions are involved in strong exchange interactions in all the samples. They form aggregates (clusters) inside a crystal lattice and on the surface of CdS nanoparticles. The EPR spectra also contain very weak signals from individual manganese ions. A noticeable change in the ratio of the signals from aggregated and individual manganese ions with the time of synthesis was not detected.
The EPR spectra of Zn
0.9Mn
0.1S nanoparticles contain signals only from aggregated manganese ions. An increase in the synthesis time to 60 min does not lead to the appearance of signals from single manganese ions (
Figure 6b).
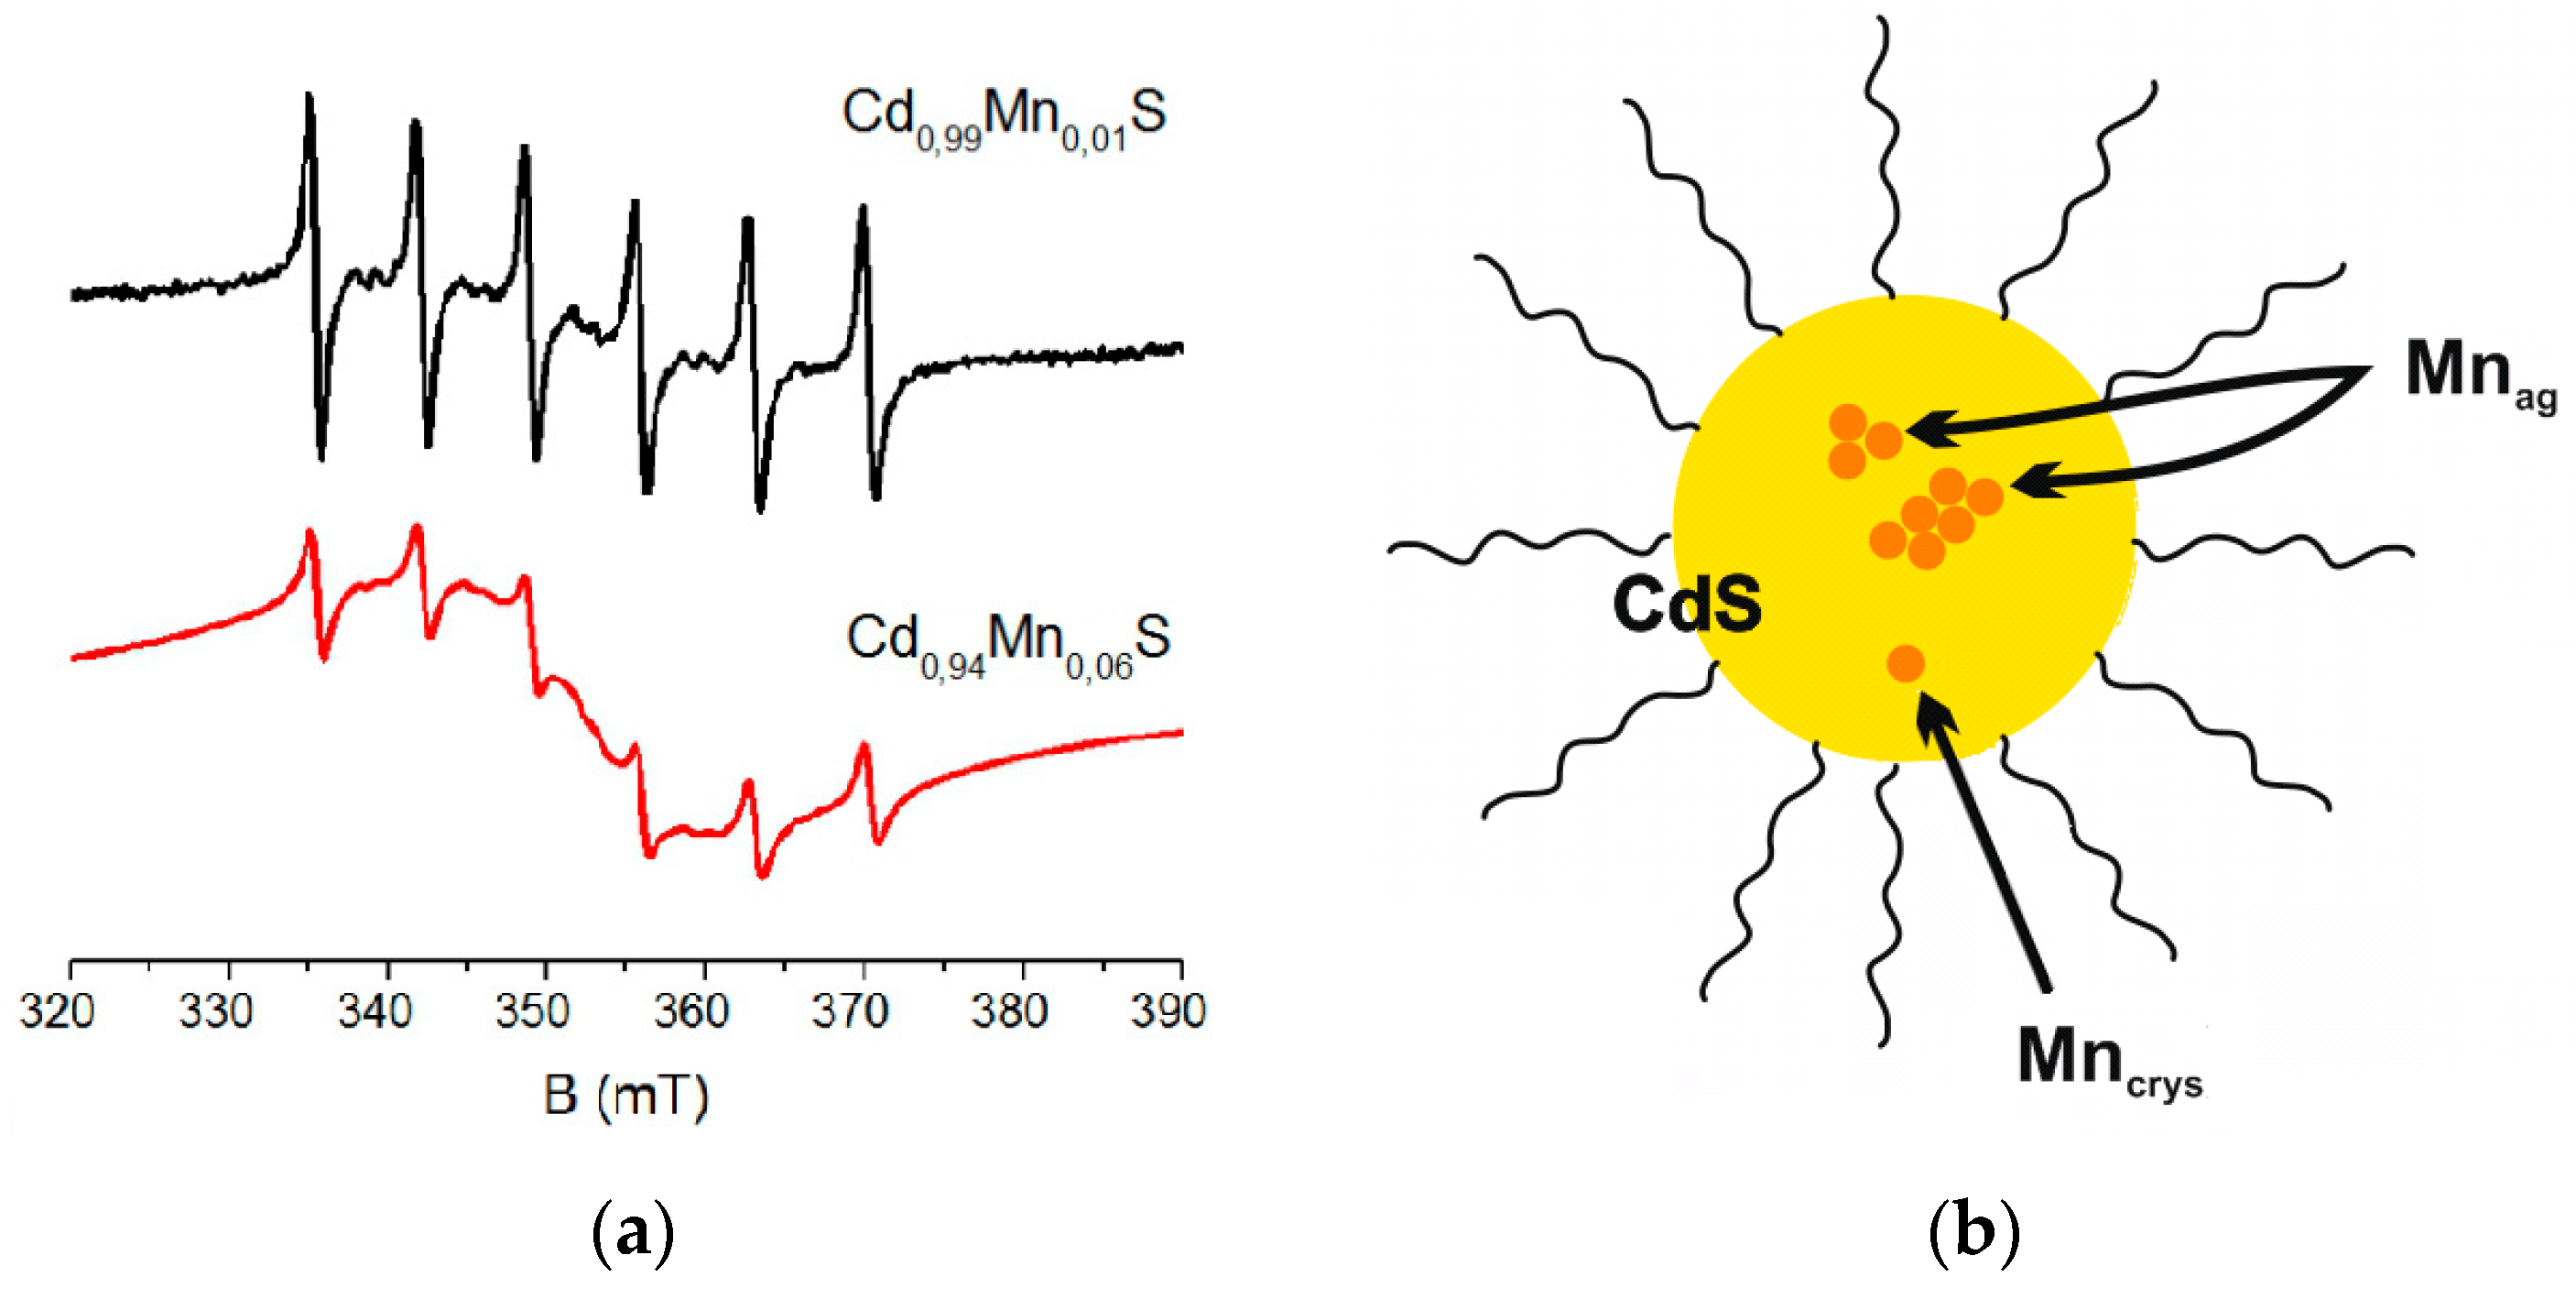
A decrease in concentration of manganese ions in nanoparticles reduces the number of ions involved in mutual dipole–dipole exchange interactions. It results in more intense signals from individual manganese ions in CdS. For example, the ratio of intensities of Mn
crys/Mn
ag signals in Cd
0.94Mn
0.06S is 1:99, this ratio for Cd
0.99Mn
0.01S nanoparticles changes to 1:24 (
Figure 7a). The model of Mn ions distribution in CdS nanoparticles is presented in
Figure 7b.
4. Discussion
CdS and ZnS nanoparticles doped with 1–10% manganese ions were synthesized. The optical and EPR spectroscopy methods used to study correlation between the structural features of quantum dots doped with Mn ions and their synthesis conditions. The absorption spectra of QDs indicate that nucleation and rapid growth of particles occur within 10 min (at 220 °C) after the start of synthesis, and then Ostwald ripening continues.
The luminescence spectra of CdS-based nanoparticles have a peak at 580 nm typical for manganese ions, which becomes more distinguished with an increase of their concentration and the time of synthesis. In zinc sulfide nanoparticles, the luminescence of Mn (II) ions does not depend on the synthesis time due to lower energies of manganese electron transitions as compared to the energy levels of defects.
The magnetic interactions of manganese ions in crystal lattices of nanoparticles formed by cadmium and zinc chalcogenides were studied by EPR. The number of manganese ions involved in dipole–dipole exchange interactions was shown to increase with the growth of their concentration in nanocrystals that results in intensification of luminescence of manganese ions in nanoparticles.


