Communication

A Novel Microtiter Plate Format High Power Open Source LED Array

1
Department of Molecular Biology and Functional Genomics, Technical University of Applied Sciences, Hochschulring 1, 15745 Wildau, Germany
2
Department of Microsystem Technology/System Integration, Technical University of Applied Sciences, Hochschulring 1, 15745 Wildau, Germany
3
Department Biochemistry and Biology, Potsdam University, Am Mühlenberg 13, 14476 Potsdam, Germany
*
Author to whom correspondence should be addressed.
Photonics 2019, 6(1), 17; https://doi.org/10.3390/photonics6010017
Submission received: 21 December 2018 / Revised: 5 February 2019 / Accepted: 14 February 2019 / Published: 25 February 2019

Abstract

:
Many photochemical or photobiological applications require the use of high power ultraviolet light sources, such as high-pressure mercury arc lamps. In addition, many photo-induced chemical, biochemical and biological applications require either a combinatorial setting or a parallel assay of multiple samples under the same environmental conditions to ensure reproducibility. To achieve this, alternative, controllable light sources, such as ultraviolet light emitting diodes (UV LEDs) with high power and spatial control are required. Preferably, LEDs are arranged in a suitable standardized 96-well microtiter plate format. We designed such an array and established the methods required for heat management and enabling stable, controllable illumination over time.

1. Introduction

Light emitting diodes (LEDs) have several advantages compared to more traditional illumination sources: They are more efficient, have a long life time, compact size, and high reliability [1] Modern LEDs allow long-term generation of irradiation of a wide range of wavelengths [2]. Recent advances in LED technology provide efficient light sources in the UV and blue wavelength region [3,4,5]. The growing importance of LEDs in industry, science and research is best demonstrated by rising numbers of publications; the number of publication about UV LEDs increased by 42 times from 2000 to 2016 [6].
The use of high-power LEDs in research is exemplified by Hölz et al. [7], who replaced a commonly used high-pressure mercury arc lamp with an ultra-high power 365 nm LED for use in photolithography, offering economic and ecological advantages, as well as lower hardware costs and a very long lifetime. Moreover, 365 nm LEDs light can be used to degrade organic pollutants, such as Malachite green dye or Diazinon, in water [8]. Also, UV radiation seems to play a role in forming DNA-protein crosslinkings that may significantly influence bacteria inactivation in correlation with the light intensity used [9]. Some applications require the use of high power illumination sources, e.g., to fabricate oligonucleotide microarrays (1000 W Hg arc lamp was used in [10]), to extend investigations of photochemical reactions which involve free radicals using higher light intensities or selective removal of photolabile protecting groups [11,12], such as with LEDs with 3 W or higher. Furthermore, determination of hydroxyl radical reaction rate constants can be facilitated using high power UV LEDs [13]. Due to their small size, high power UV LEDs are used to design new photoreactors to improve photocatalytic processes [14]. The previously presented examples demonstrate that LEDs are versatile in their applications [15], and high-power LEDs can be used in many different biochemical areas. Their illumination efficiency and spatial control can be optimized by using optical systems which can be individually adapted to each setup [16]. Also, theoretical models for high-power LED arrays for up to 8 LEDs have been developed, without the need for active cooling to achieve cost effective and optimized illumination [17].
Complex biochemical assays and their reactions are preferably run and analyzed in parallel to achieve the same environmental conditions. Combinatorial assays, especially for chemical or biochemical applications, demand arrays that allow individual control with high throughput possibilities and the option of automating. A standard format is the 96-well microtiter plate [18]. Various applications exist, e.g., microfluidic environments, demand illumination with a specific spectrum and a certain intensity, such as 365 nm UV-Light. Irradiation often requires strict limitation to a precise position.
Therefore, it is desirable to develop a 96-LED array which is suitable for microtiter plates using and managing high-power LEDs. It could be used for chemical, biochemical, as well as biological applications in a miniaturized scale under stable illumination conditions. Currently, only low-power UV-LED arrays in microtiter format are available from CETONI GmbH (CETONI GmbH, Korbussen, Germany) [18], since thermal management and maintaining stable illumination becomes more challenging with increasing LED intensities. To the best of our knowledge, no such high-power 365 nm LED array is commercially available. Nevertheless, this further demonstrates the increased usage of LEDs beyond classical illumination purposes, such as for street lights.
The challenge in designing such a large high-power LED array is mainly heat management, as overheating will decrease the intensity output and high temperatures may be opposed to the illumination task, which is e.g., a temperature-limited reaction [19]. This becomes even more demanding when a microtiter plate is mounted on top of the LEDs. It is also important to note that suppression of scattering light might influence neighboring samples. As many photochemical applications require irradiation in the UV region [20,21,22], high-power LEDs with a wavelength of 365 nm are suitable for such an array. This was the main goal of the work presented here.

2. Materials and Methods

Light sources for all experimental setups were smd3535 (All Bright International Co. Ltd., Tainan City, Taiwan), 365 nm, 3 W high-power LEDs, which were mounted on an 8 mm PCB chip. All LEDs had a silicon lens with a radiation angle of 120°, and were powered by LDD700L (Meanwell Enterprises, New-Taipeh, Taiwan) constant current sources with a constant current output of 700 mA. The constant current sources had a built-in pulse width modulation (PWM) dimming option, allowing pulsed operation mode with a frequency of up to 1 kHz. A 5 V signal is needed to disable or enable the current flow of the LDD700L constant current sources and thus trigger the PWM. The external 5 V PWM signal, to control overall runtimes, in pulsed or continued mode, was generated by a microcontroller (Arduino Uno, AZ-Delivery Vertriebs GmbH, Deggendorf, Germany). The schematic, the method by which the constant current sources were connected to the LEDs and the microcontroller can be found in the Supplementary Materials S1. The three setups, which correspond to the development steps of the LED array are presented in chronological order.

2.1. Setup 1

The first setup consisted of a 10 × 10 × 4 cm aluminum heat sink (Fischer Elektronik GmbH & Co, Mittenwalde, Germany) with a suitable fan, 12 V DC and 500 mA, underneath the aluminum block. LEDs were mounted on the aluminum block using thermal conductive, double-sided adhesive tape (Akasa Ltd., Greenford, UK) with a thermal conductivity of 0.9 W/mK. The tape will be further referred to as thermal tape for convenience.
A cavity was milled into the aluminum heat sink in which the LEDs were fixed (Figure 1). The cavity enables the user to place a microtiter plate on top of the setup and illuminate the plate from the bottom.

2.2. Setup 2

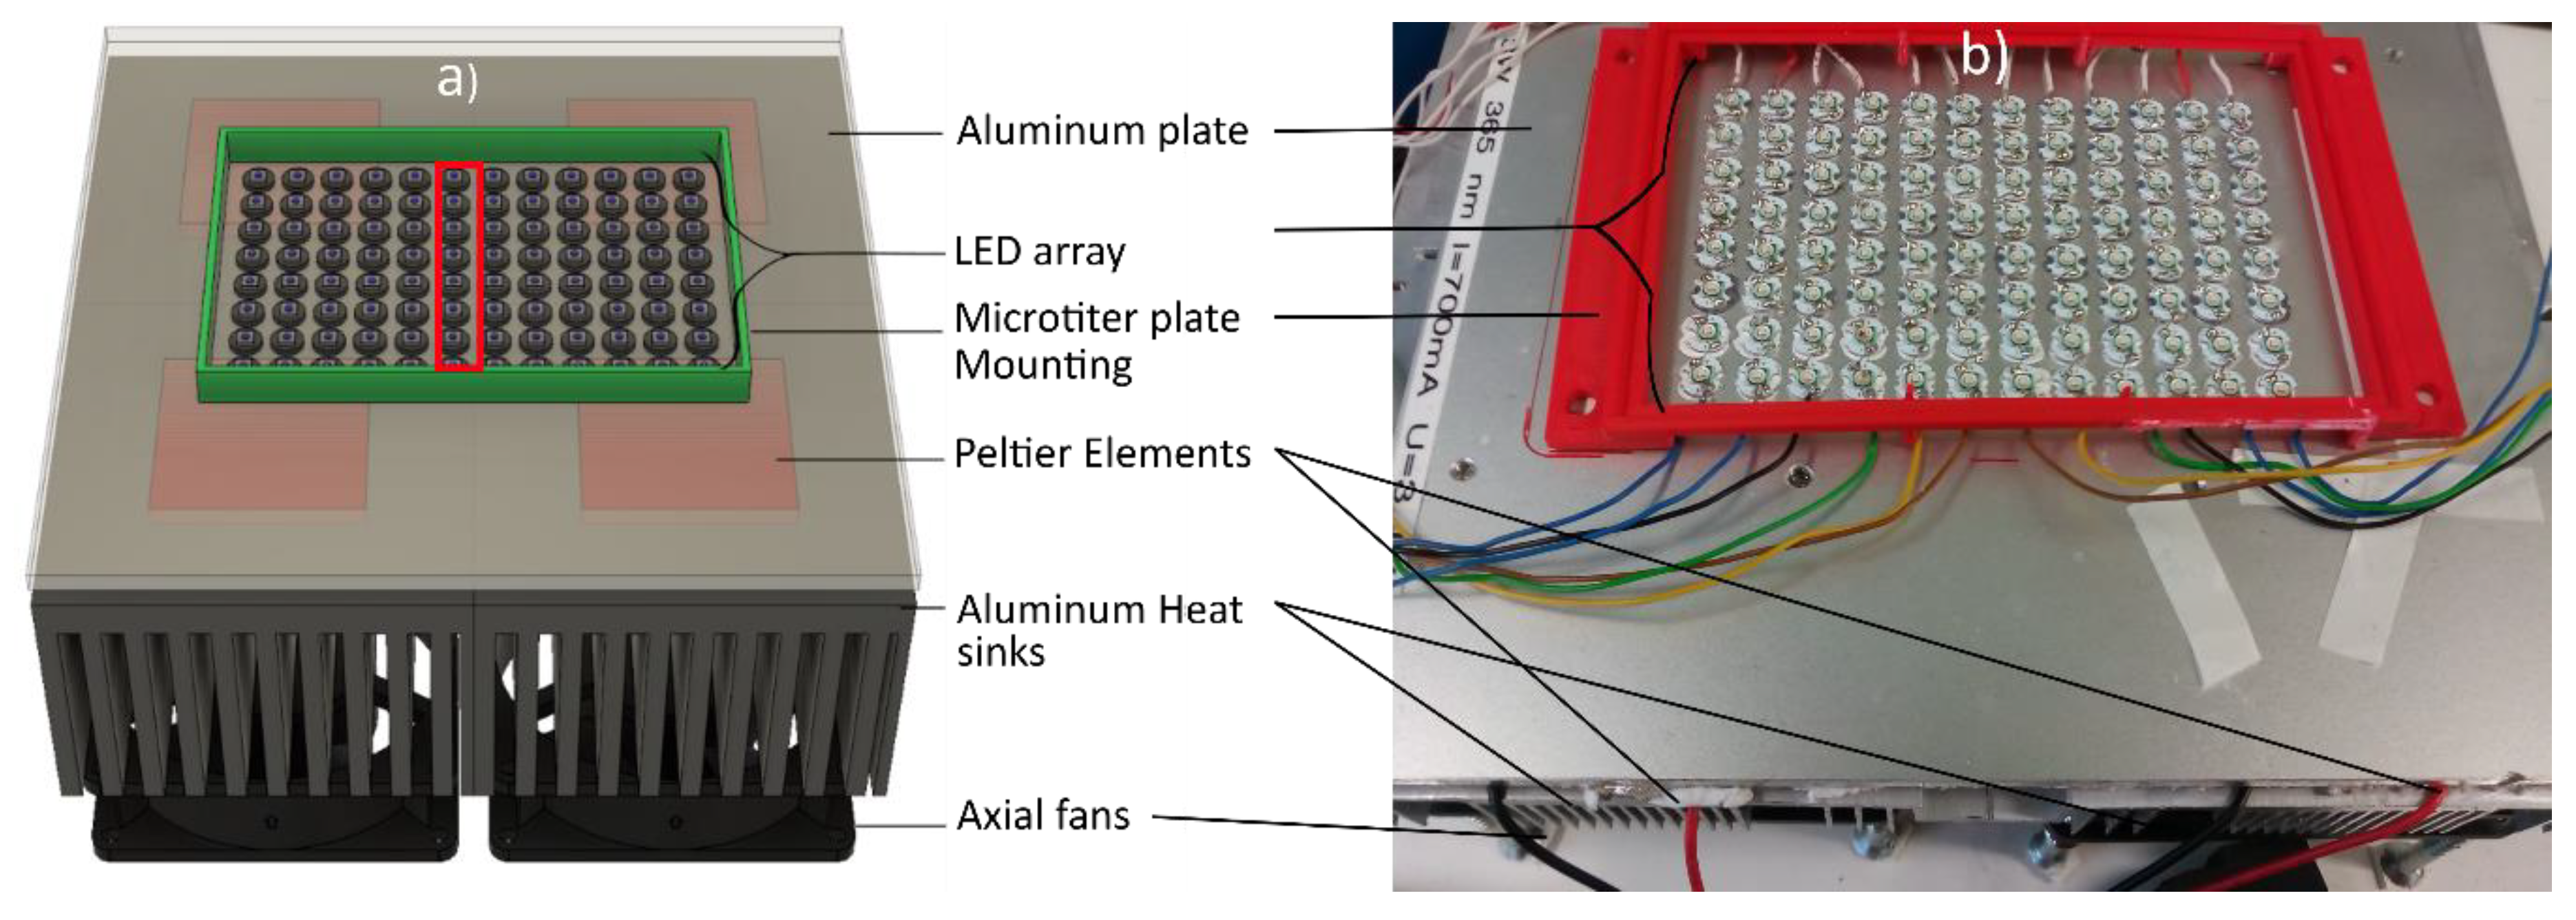
A schematic overview of the second setup can be seen in Figure 2. Both the thermal tape and thermal conductive adhesive paste STARS-922 (Stars Co. Ltd., Taoyuan, Taiwan) with a thermal conductivity of 0.925 W/mK were used to mount LEDs on a 20 × 20 × 0.05 cm aluminum plate. LEDs were placed using a 3D-printed matrix suitable to fit the wells of a 96-well microtiter plate. Underneath the aluminum plate, four TEC1-12706 Peltier Elements (Hebei I.T. (Shanghai) Co., Ltd., Shanghai, China), each with a power of 60 W, were coupled using thermal conductive paste (Conrad Electronic SE, Berlin, Germany). Peltier elements were powered using a transformer (Superlight Ltd., Sydney, Australia) with 12 V and 30 A output. A 10 × 10 × 4 cm aluminum heat sink (Fischer Elektronik GmbH & Co, Mittenwalde, Germany) was placed underneath each Peltier element. Heat sinks were actively cooled, using a CPU fan for each heat sink, 12 V, 500 mA. A mounting was constructed with the software Solid Works and printed in Acrylonitrile Butadiene Styrene using a 3D printer (Makerbot Replicator 2, Rheinmünster, Germany) to place the microtiter plate above the LEDs with a distance of 8 mm.

2.3. Setup 3

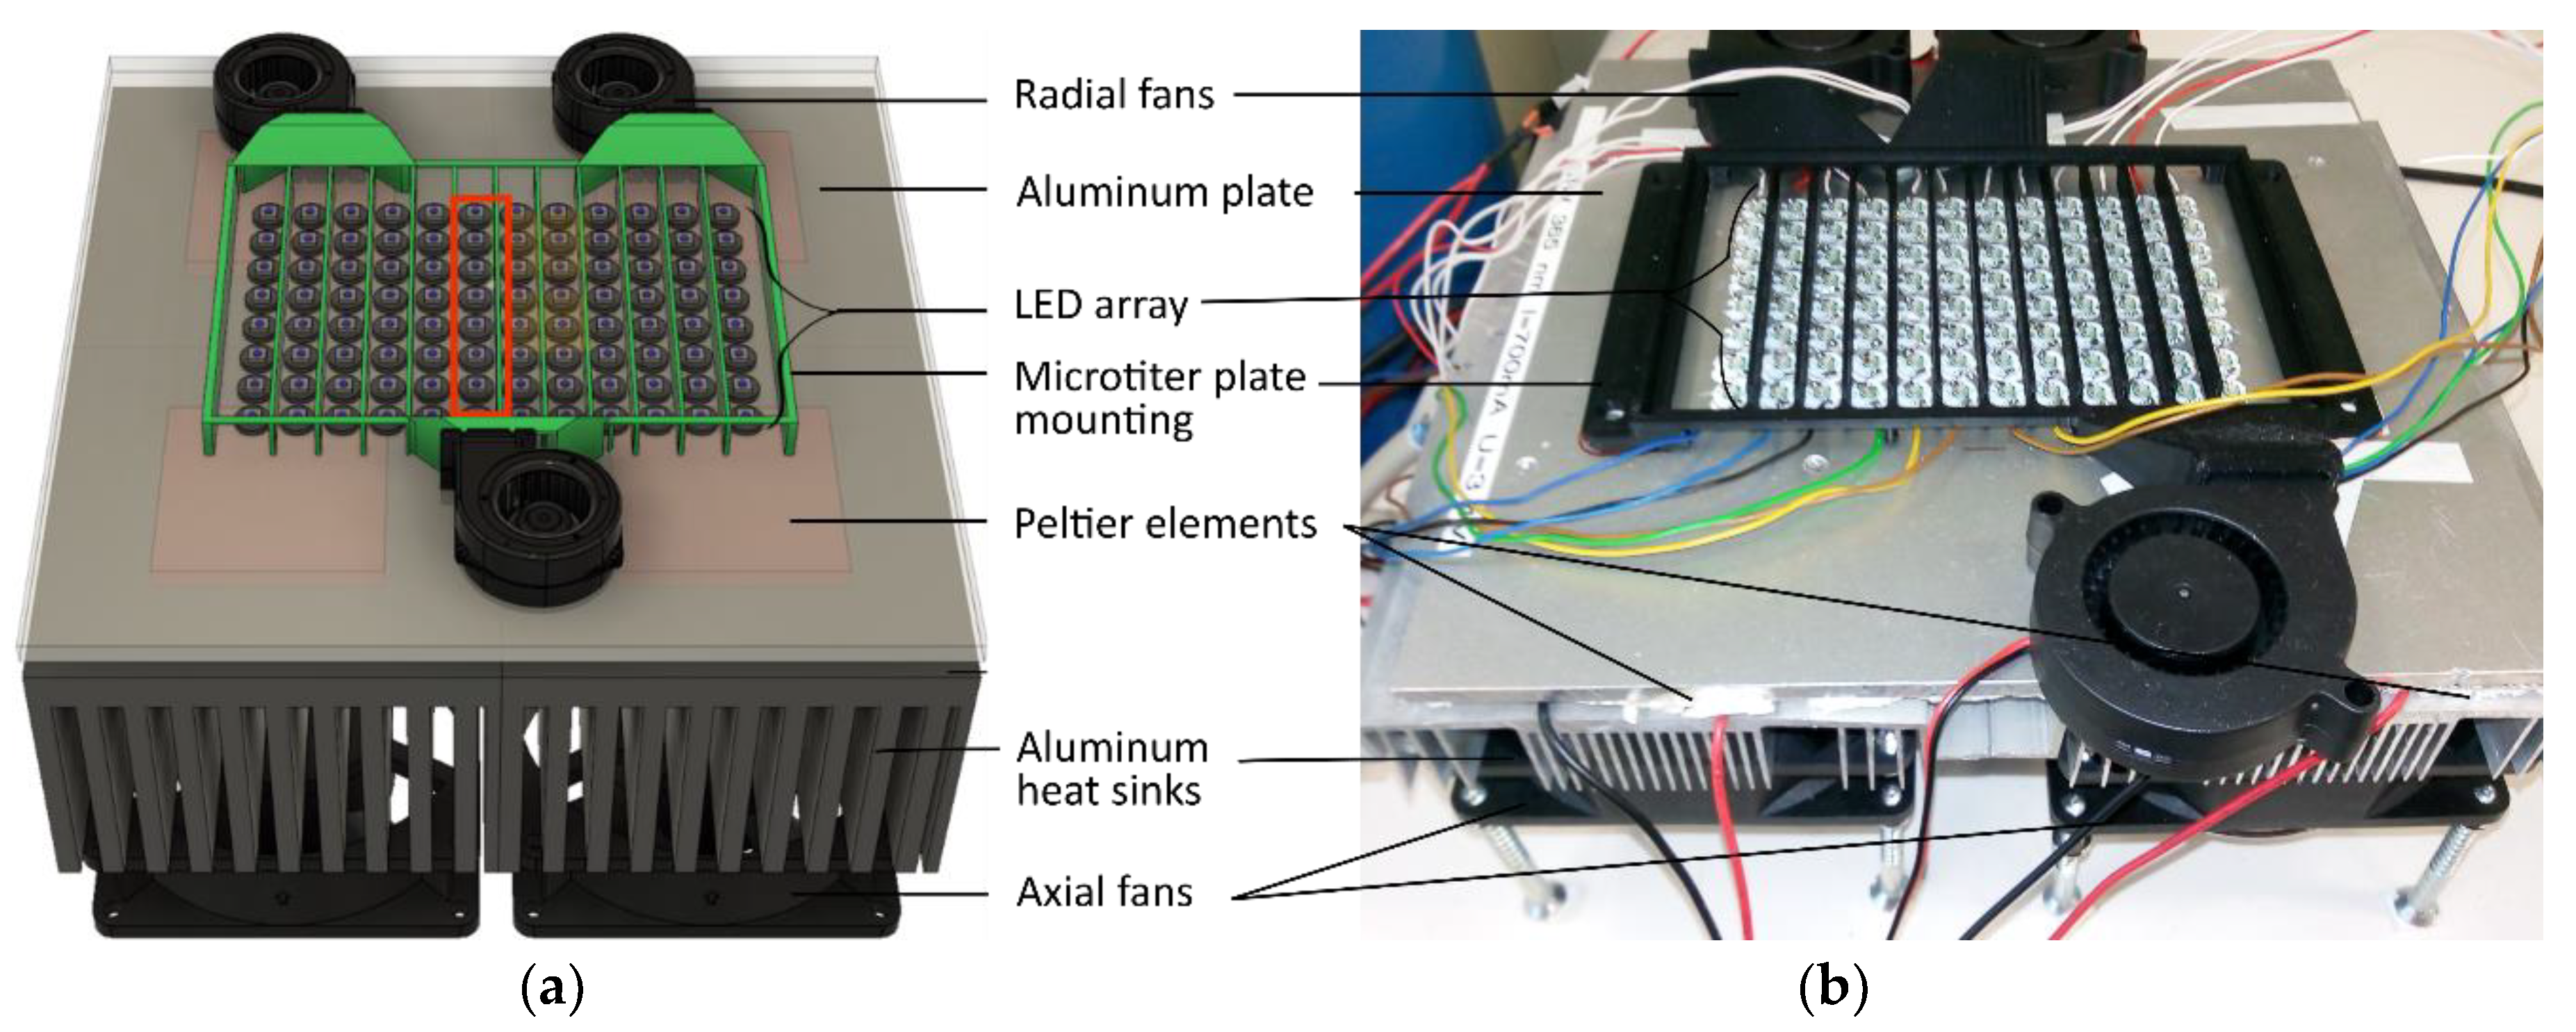
LEDs were mounted on a 20 × 20 × 0.05 cm aluminum plate using thermal conductive adhesive paste (Figure 3). Underneath the aluminum plate, four stronger Peltier elements TEC1-12710 (Hebei I.T. (Shanghai) Co., Ltd., Shanghai, China) with a cooling capacity of 85 W at room temperature were mounted. Those were thermally coupled under the aluminum plate using thermal conductive paste, and were powered using a transformer with 12 V and 30 A output. A 10 × 10 × 5 cm aluminum heat sink was placed underneath each Peltier element using thermally conductive paste. Heat sinks were actively cooled using a CPU fan, 12 V, 500 mA. Furthermore, a new microtiter plate mounting was designed and 3D-printed to allow the integration of three radial fans. In order to avoid light scattering, a crossbrace between each LED row was added. Three radial fans, i.e., 12 V, DC, 50 × 50 × 15 mm (YOTINO Co. Ltd., Shenzhen, China), run at 0.23 A/1.8 W, were integrated to ensure a constant air flow between the microtiter plate and the LEDs.
An overview of technical data of materials used in all three setups is given in Table 1. This table also lists the absolute maximum fluorescence emission values for each setup. The respective maximum emission for each setup was taken as 100% to normalize emission spectra.

2.4. LED Emision Intesity Measurement

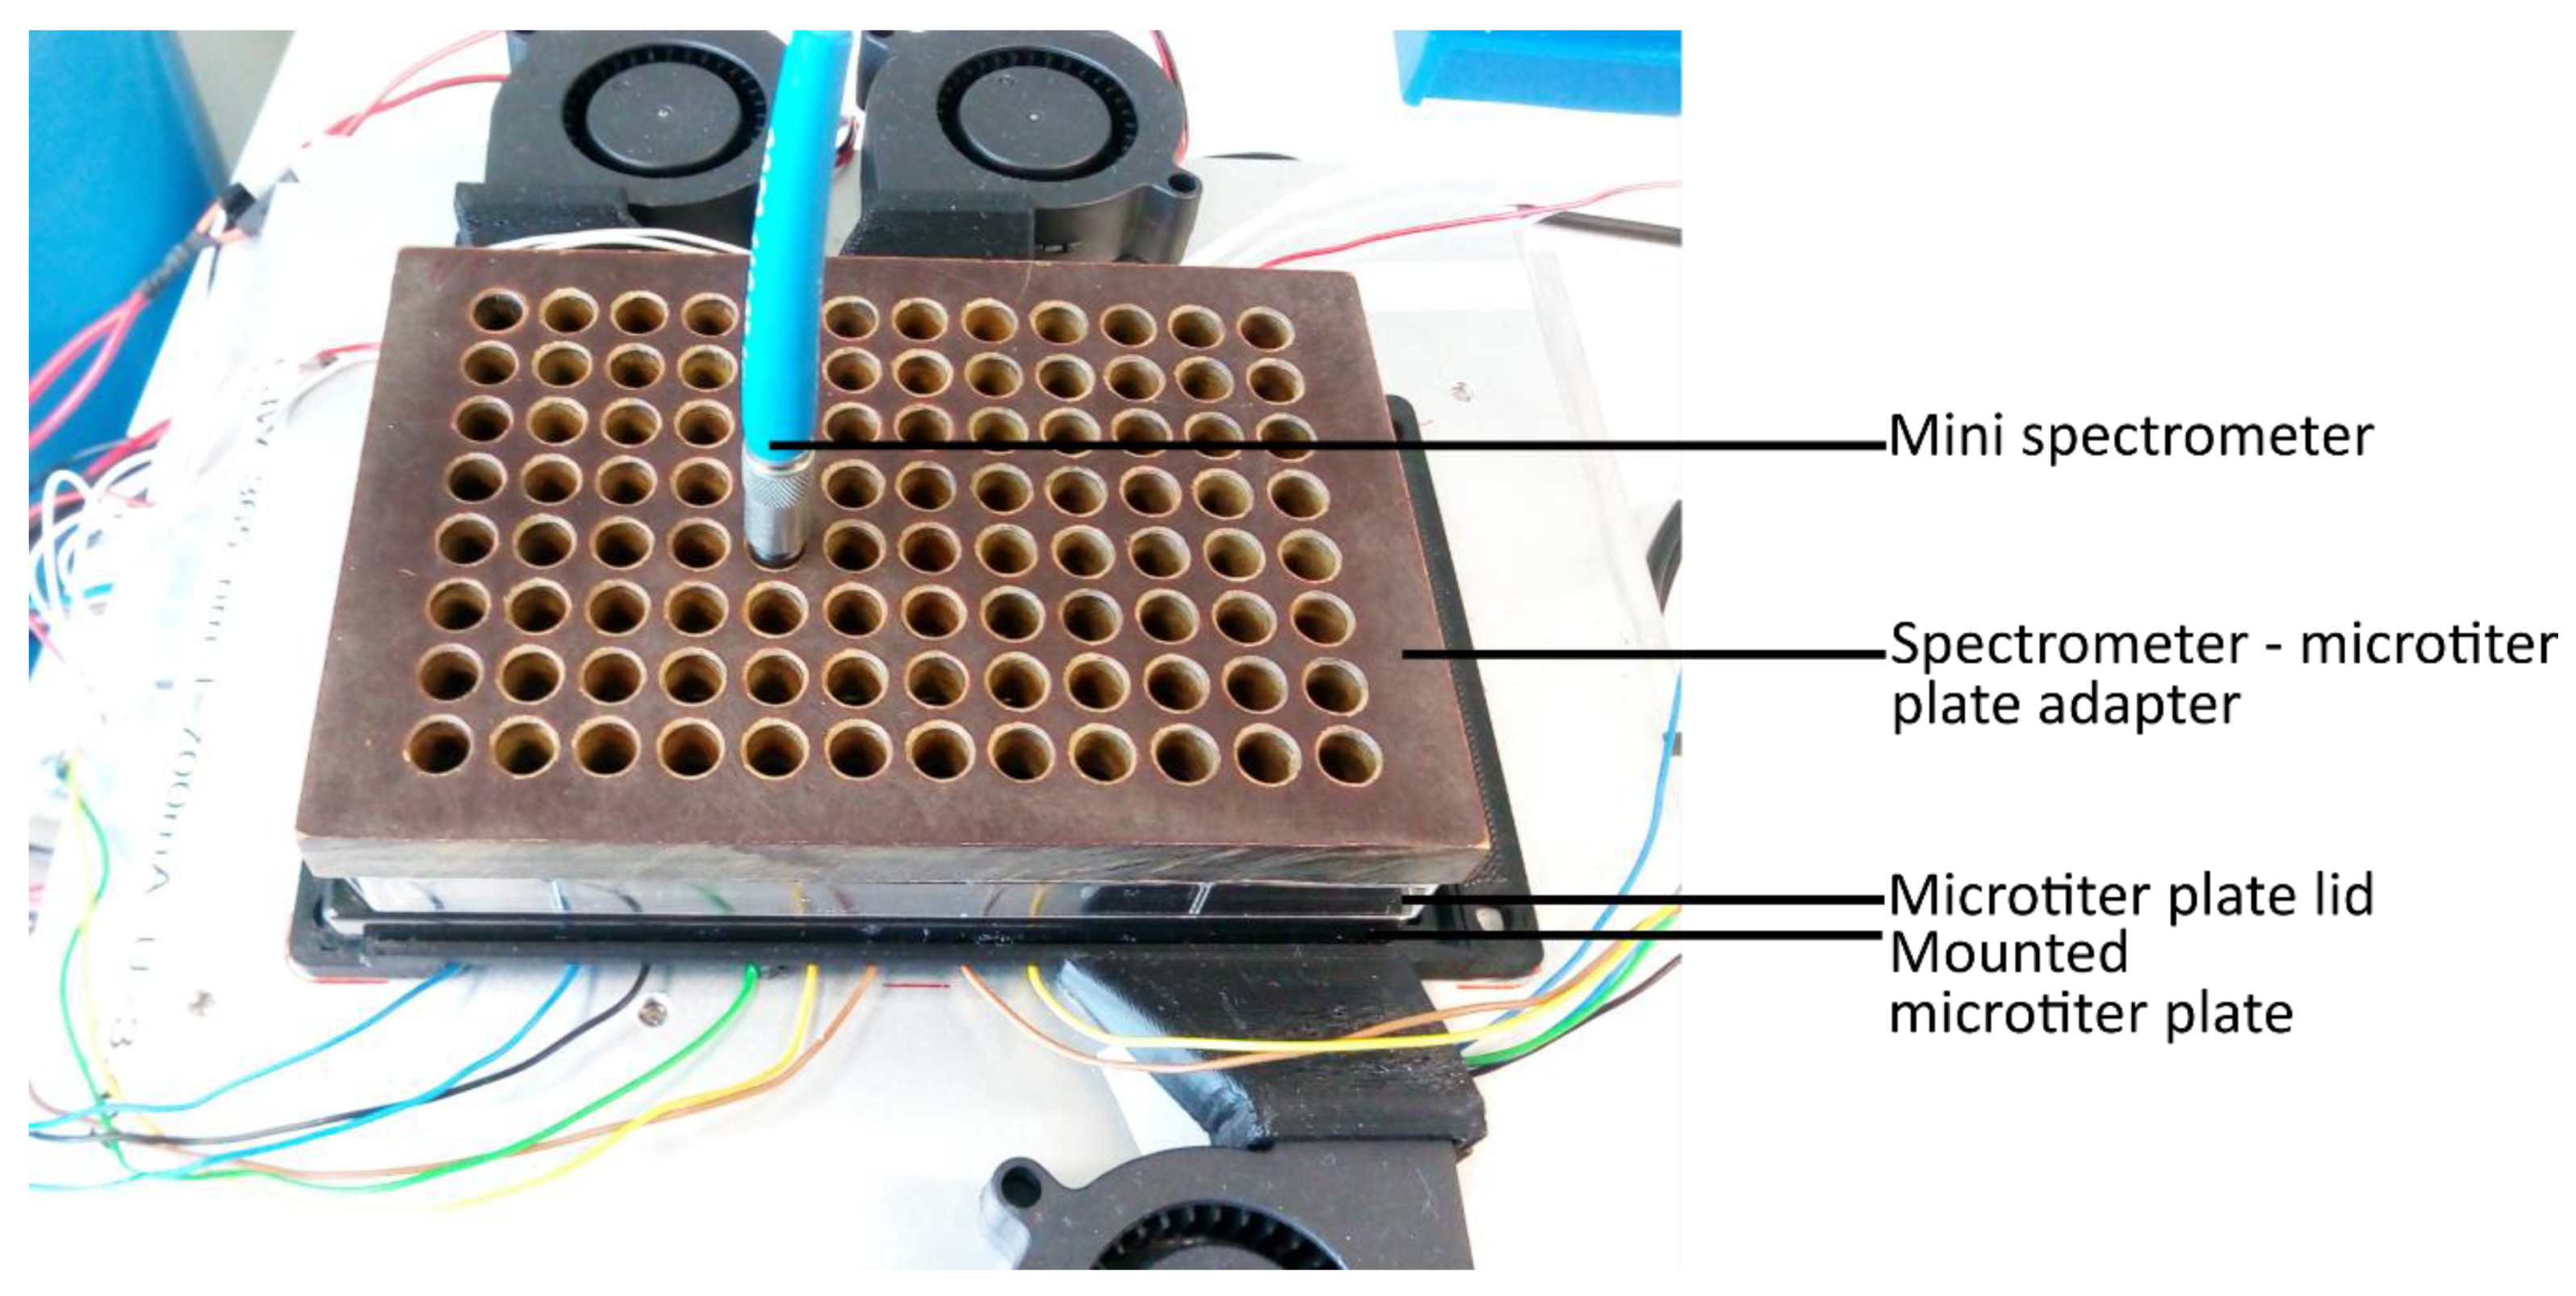
LED intensities were analyzed using an STS-VIS miniature spectrometer (Ocean Optics, Ostfildern, Germany). An adapter which fits exactly in one well of a standard 96-well flat bottom microtiter plate and the mini spectrometer was designed. The dimensions of a standard microtiter plate are 127.71 × 85.43 mm (LxW); detailed dimensions are listed in a manual by the supplier of microtiter plates used (Brand GmbH, Wertheim, Germany) [23]. The microtiter plate was placed on top of the LED array and the adapter was fixed on the microtiter plate lid while the intensities were measured. Emission intensities of LEDs were at 365 nm, while the LEDs were switched on in three cycles for 5 min of continuous illumination. LED intensities were recorded using U = 3.4 V as the LED forward voltage and 700 mA per LED. On time of each LED was 5 min continuous illumination, which was recorded for 3 cycles with 1.5 min off time between each cycle. Important Note: the LEDs used emit strong UV light; thus, eye and skin protection must be worn at all times when working with them.
A photo of how LED emission intensities were measured with the mounted microtiter plate is shown in Figure 4.

3. Results and Discussion

LEDs have a typical conversion efficiency of ca. 25% when operated with a forward current of 700 mA and a forward voltage of 3.4 V, which corresponds to a thermal dissipation of 2.38 W per LED, summing up to a power of 228.48 W for the 96 LED array. As each LED is mounted on an 8 mm PCB chip, this leaves a small surface of ~50 mm² per LED. Thus, efficient thermal management is required, especially because both the radiant flux and lifespan of LEDs are inversely related to temperature. IR images could only be recorded with no microtiter plate on top of the three LED array setups, as the microtiter plate itself strongly absorbs in the IR region.

3.1. LED Mounting and Cooling

To analyse the influence of the mounting method of the LEDs, infrared (IR) images were recorded, using an IR camera (model Ti100, Fluke Cooperation, Everett, WA, USA). Thus, the casing temperature T C could be measured directly from the IR image.
T J = θ J C P D + T C
where T J is the operating junction temperature in °C, θ J C is the junction-to-case thermal resistance in °C/W (datasheet, 10 °C/W), P d the Power dissipation in W ( P d = IF * UF = 700 mA*3.5 V) [24] and T C the case temperature in °C [25]. As seen in the above equation, the junction temperature is directly proportional to the casing temperature, which can be measured by the IR images. To minimize calibration errors of the IR camera, it was calibrated under the same conditions for all measurements. Using IR images as a method to obtain the surface temperature was chosen, as this was shown to be accurate [26].
Radiation emitted from the LEDs typically has a very low influence, as LED surfaces are fairly small and surface temperatures are relatively low (below 150 °C) [27,28]. The LEDs have stable output intensities to a maximum junction temperature of 65 °C, a maximum power dissipation of 2660 mW and a junction-to-case thermal resistance of 15 °C/W. The power dissipation and junction-to-case thermal resistance were constant throughout the experiment. Due to this fact, only the case temperature will be considered.
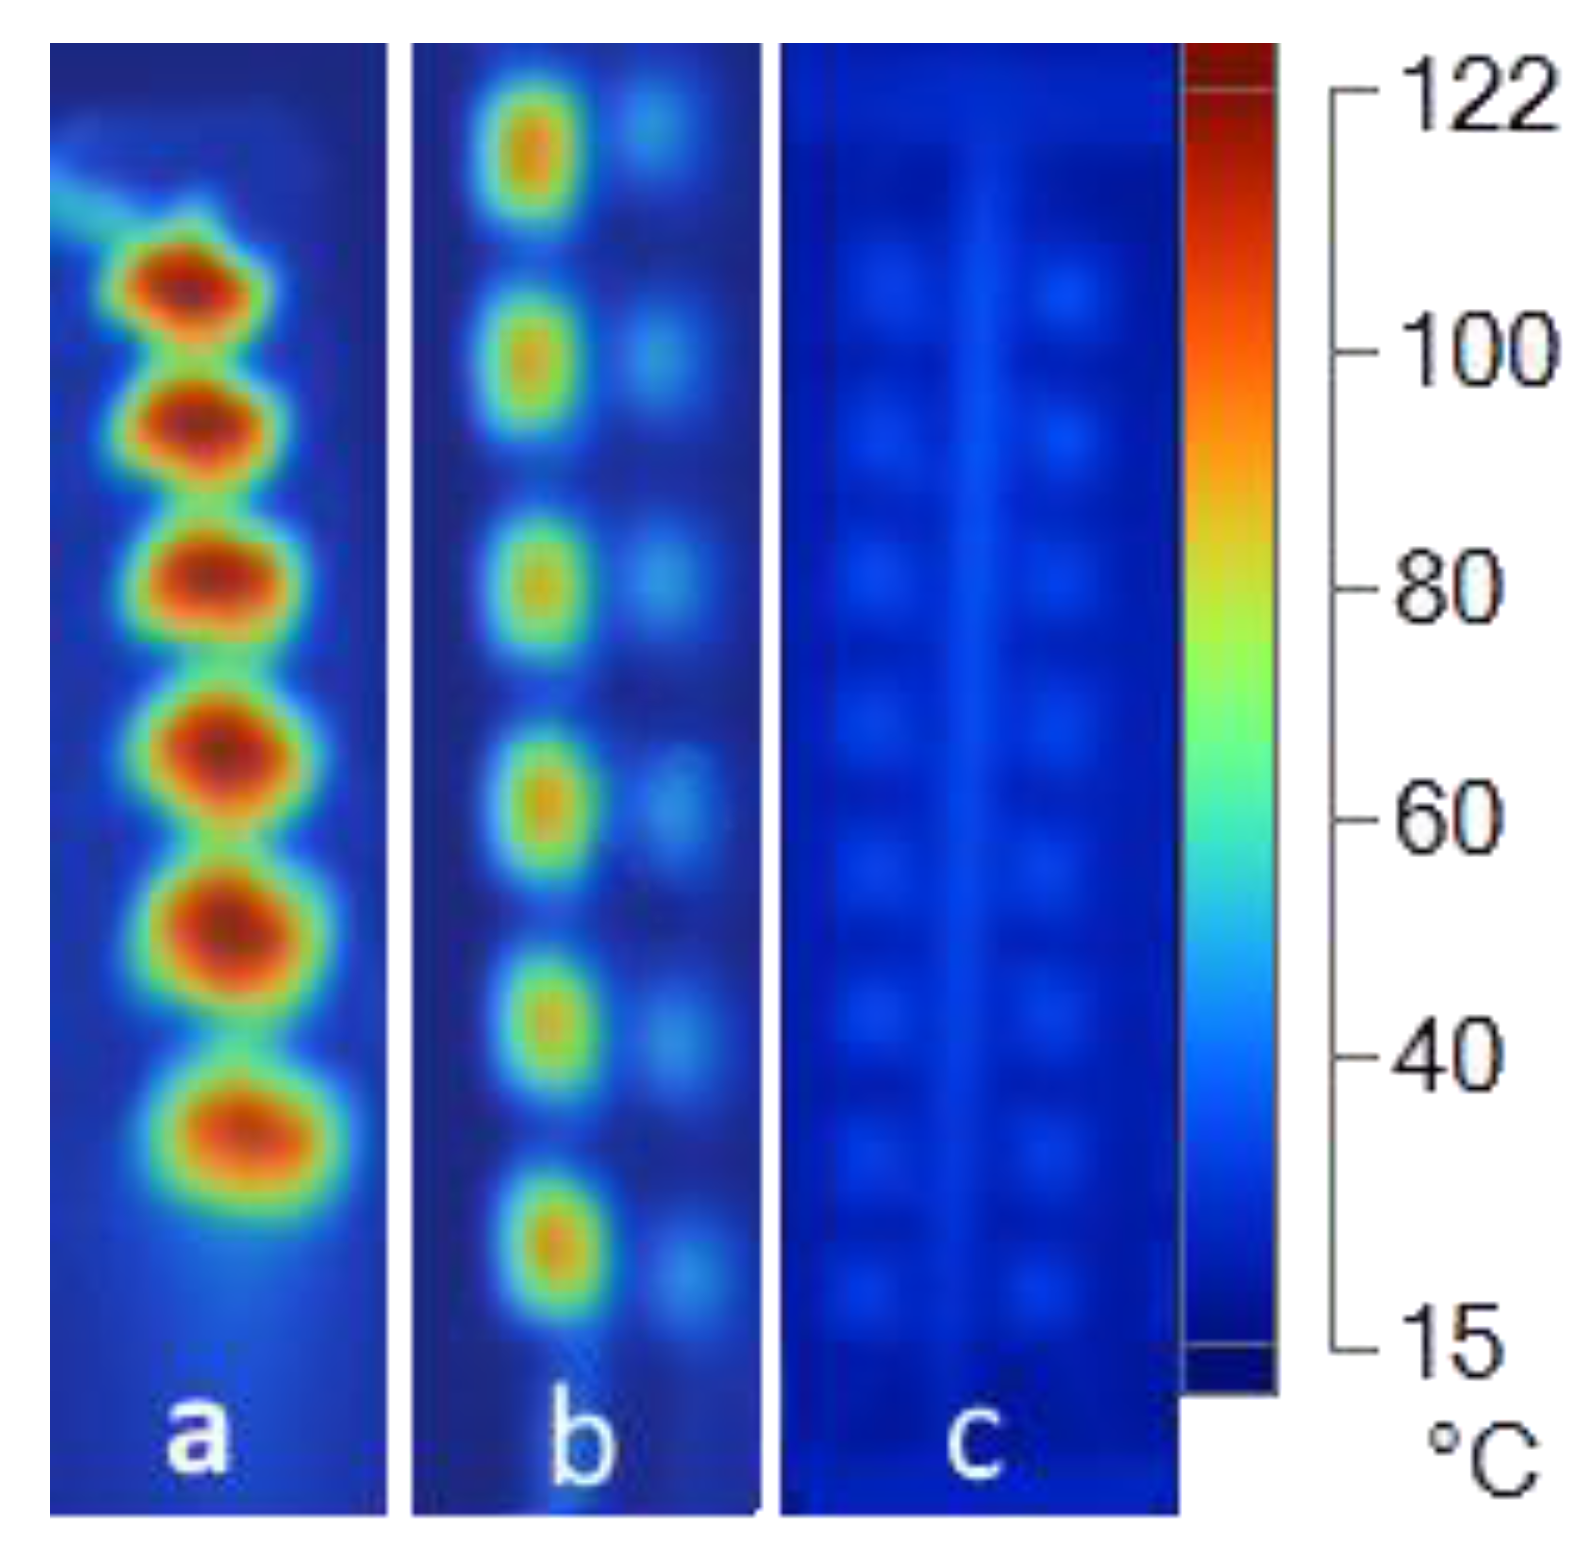
Figure 5 displays the IR images of Figure 5a one LED row from setup 1, fixed with thermal tape, Figure 5b two LED rows from setup 2, where the left LED row is fixed with thermal tape and the right row is fixed with thermally conductive adhesive paste, and Figure 5c two LED rows fixed with thermal conductive adhesive paste on setup 3. The position of the recorded IR image from the three setups is indicated in Section 2 for each setup by a red rectangle. All IR images were acquired after 5 min of continuous LED operation with 700 mA I_F and 3.4 V U_F. Casing temperature T C was measured in the spot of maximum temperature for each LED separately.
Even though the thermal tape and the thermal conductive adhesive paste have very similar thermal conductivity, T C is significantly higher when LEDs are mounted using the tape, which is displayed in Figure 5b. In setup 1, T C of Circa 122 °C was measured; see Figure 5a. In setup 2, T C could be lowered to ca. 92 °C using the thermal tape, which is displayed in Figure 5b. This was to be expected, as the surface of setup 2 was cooled to 15 °C, while in setup 1, Figure 5a, the aluminium heat sink had an average temperature of 30 °C.
T C lowered to an average temperature of 50 °C using thermally conductive adhesive paste, displayed in Figure 5b on the right-hand side. This could be further optimized with setup 3 (compare Figure 5c), where Peltier elements with higher power were used for cooling and a constant sideway airstream by radial fans was established. The average T C in setup 3 was 36 °C.

3.2. Light Intensity and Heat Management

The high TC in setup 1 and 2 resulted in an intensity loss. The effect increased when a microtiter plate was placed on top of the setups. This further raised the temperature due to heat accumulation between plate and LEDs. A black 96-well microtiter plate with flat bottom (Brand GmbH, Wertheim, Germany) was used and placed on top of each setup to measure LED emission intensity, as described in Section 2. Using a black microtiter plate minimized the effect of light scattering for the samples in the wells caused by the neighboring LEDs in the array.
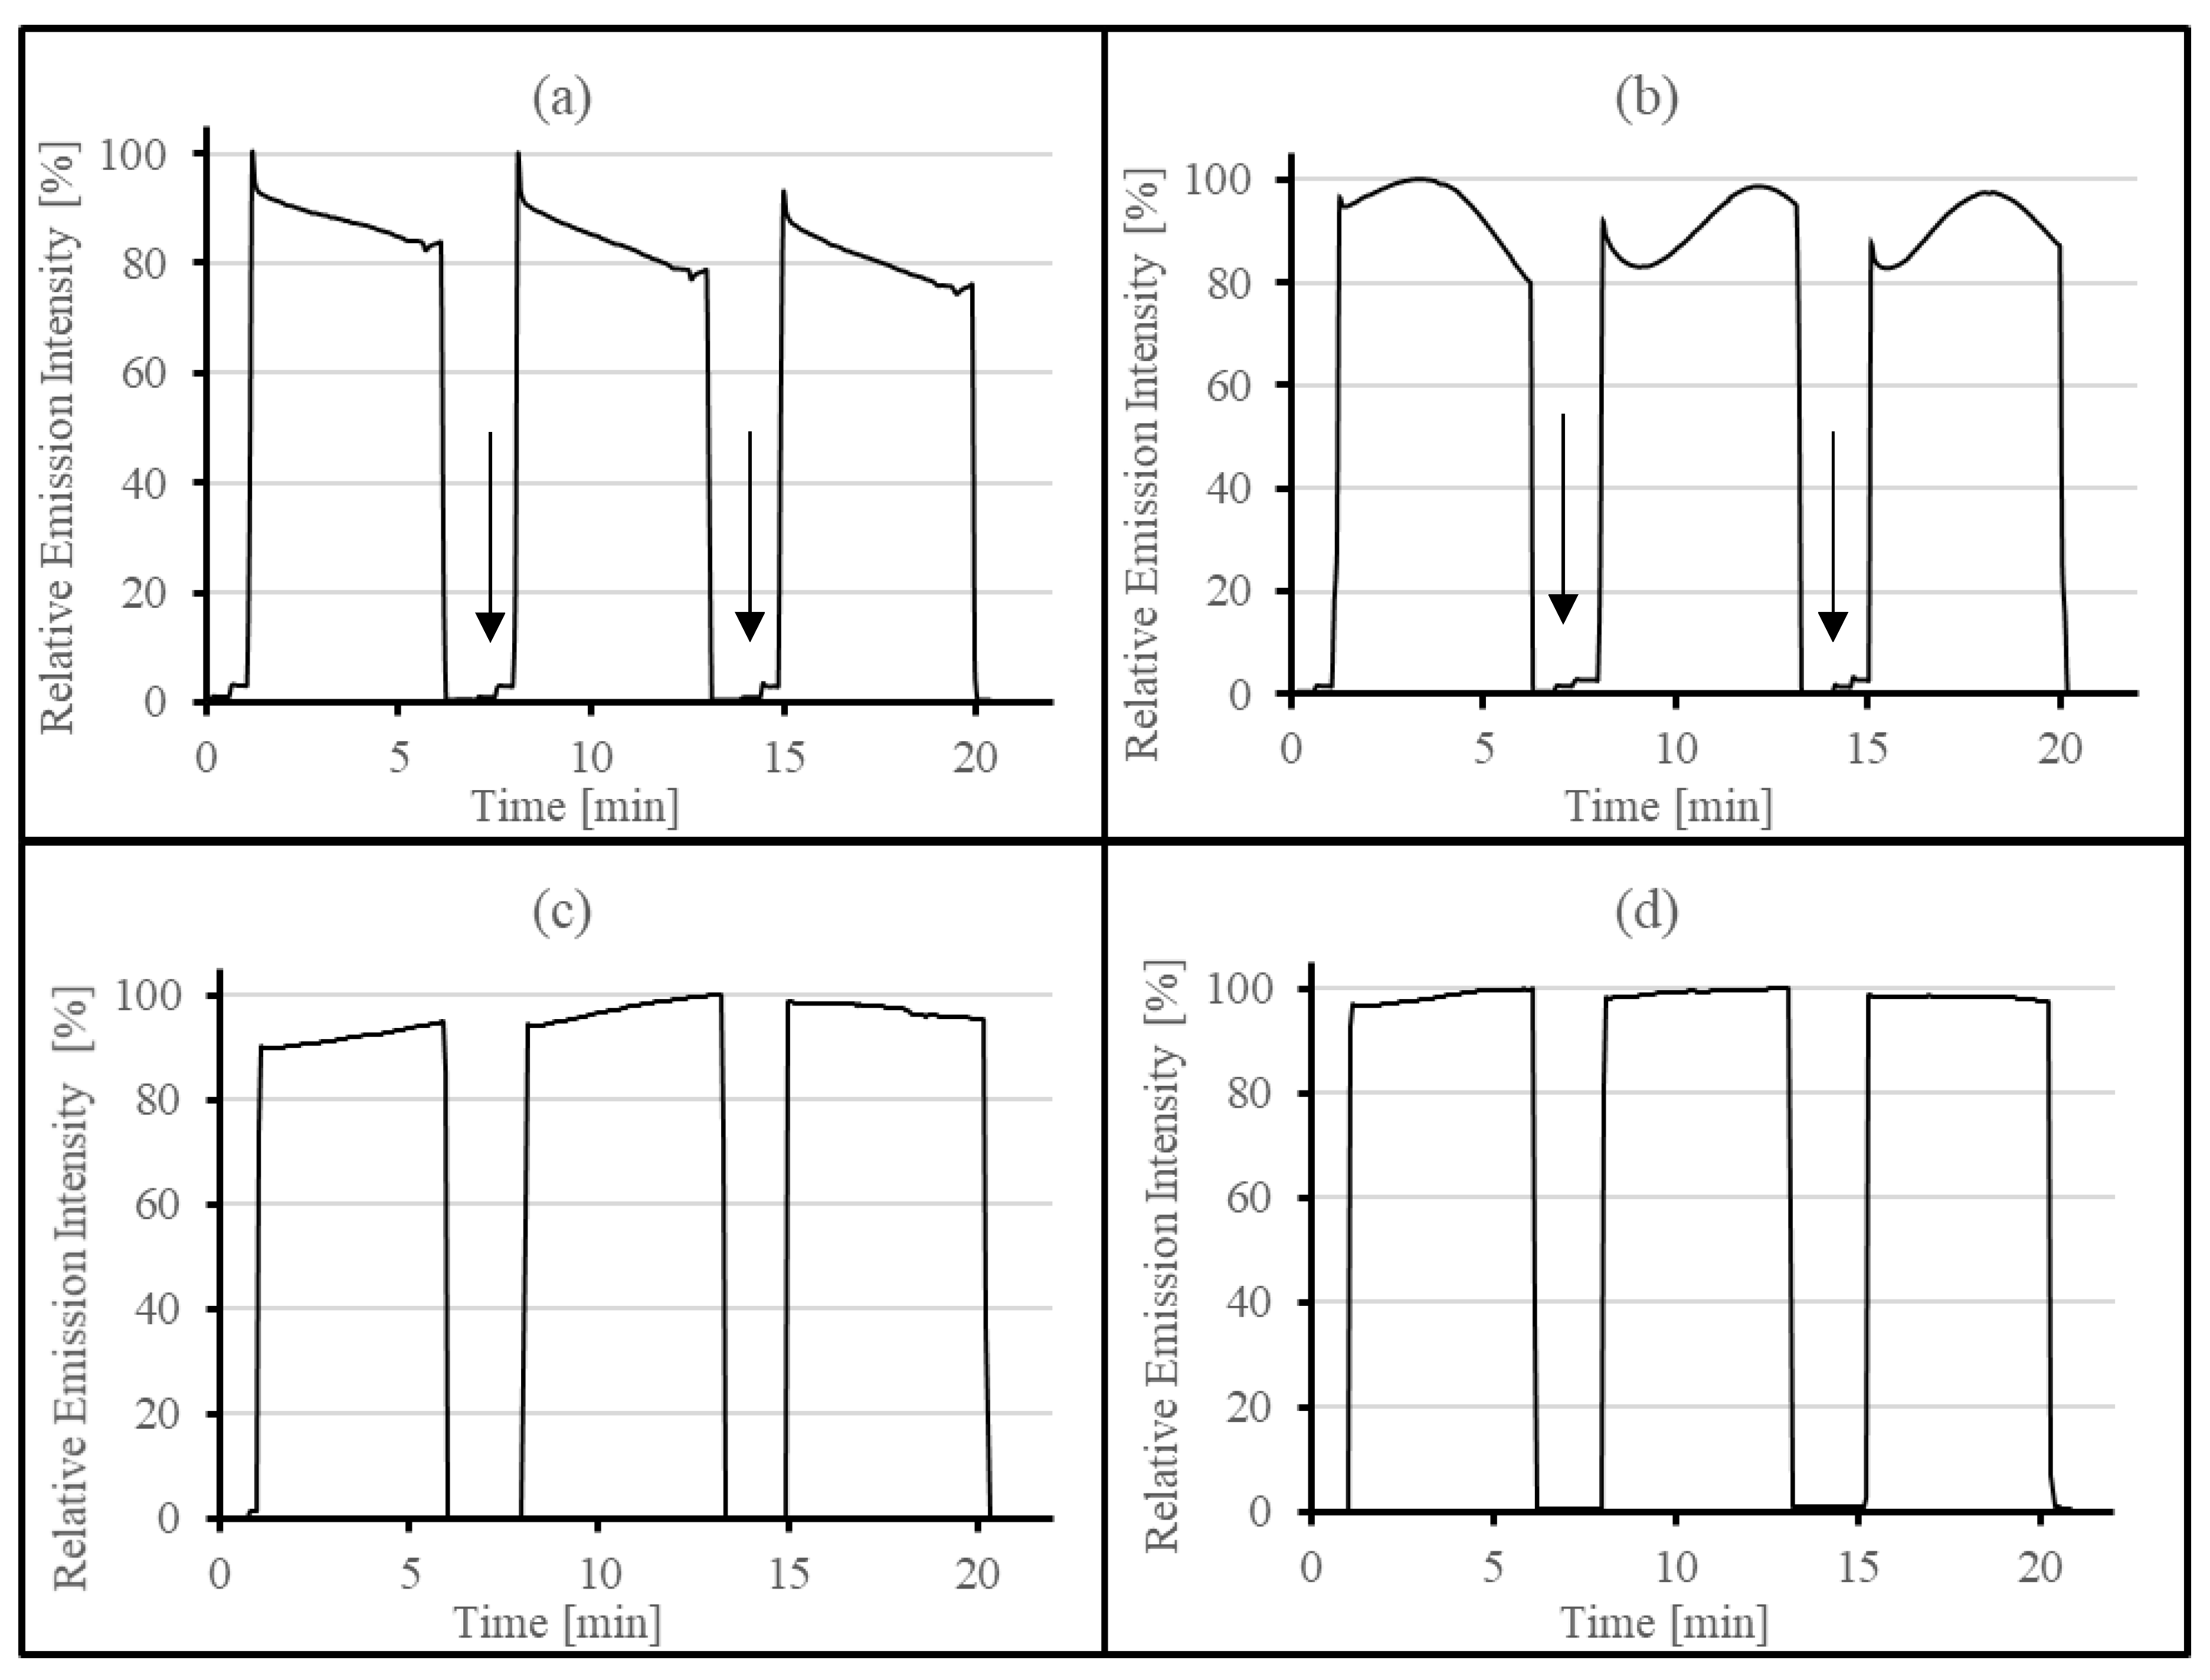
LEDs on/off times were controlled by the Arduino Uno. Recorded LED intensities for all three setups are displayed in Figure 6. For setup 1, the intensity loss over 5 min continuous illumination is ca. 20%–25%, as displayed in Figure 6a. The intensity loss is due to self-heating of the LEDs. Also, a ~4% intensity drop can be observed during each cycle due to the additional gradual warming of the heat sink in setup 1. Thus, it is necessary to reduce LED self-heating and lower the temperature to avoid an intensity loss over time. This loss was slightly reduced to an average of 18% in setup 2 (Figure 6b), where the emission intensity was only recorded when LEDs were fixed with thermal conductive adhesive paste. Due to the stronger cooling of the Peltier elements and the thermally more efficient fixing method in setup 2, the thermal management improved and the intensity losses due to self-heating decreased. In Figure 6b, the repeated cycle of LED self-overheating and cooling which is directly correlated to the LED’s intensity can be observed: The LEDs first overheat, resulting in an intensity loss. Due to the fact that lower intensity LEDs consume less power, this results in LED cooling. When cooled down, the LED junction temperature decreases and the LEDs can consume more power again, which results in a higher intensity, again generating more heat. Afterwards the cycle repeats itself. LED temperatures could not be recorded using the IR camera while the emission intensities at 365 nm were measured due to the intensity measurement setup. The long-term downward drifts disappear and LEDs alternatingly overheat and cool, resulting in intensity fluctuations and ~2% output loss in each cycle when measuring at the point of maximum intensity of each cycle. Circa 3% scattering light can be measured as a side effect, when neighboring LED rows were switched on. This is indicated by the arrows in Figure 6a,b. Scattering light was suppressed by using crossbraces in setup 3 (Figure 6c,d). Without the use of radial fans in setup 3, the long-term intensity drop was ~8% (Figure 6c). This was reduced to ~3% when radial fans were on (Figure 6d). The average output loss from cycle to cycle was reduced to ~0.5%. The absolute fluorescence intensity increases with each setup version. The more the LEDs are cooled, the higher the absolute fluorescence intensity gets. The cooling capacity increases with setup development. An overview of each setup’s absolute fluorescence intensity is given in Table 1. Considering the absolute LED intensity of setup 1 as 100%, the fluorescence increases to 131, 25% for setup 2 and to 147, 25% for setup 3. LED mounting with thermal tape and thermally conductive paste both resulted in homogeneous temperatures in all three setups. Thus, the thermal conductivity of both products seems consistent.
The LED array by Axion BioSystems [29] offers LED arrays for up to 48 wells using four different wavelengths. However, these wavelengths are not in the UV region, and no high-powered LEDs are used. The designed LED array offers sample irradiation for a full 96-well format with 365 nm. Also, the array offers spatial control, i.e., not only a homogenous irradiation of a single ultra-high-power LED, as offered by Prixmatix Ltd. [30]. The LED array can be adapted to versatile setups, e.g., by exchanging LEDs to be able to illuminate with different wavelengths. Furthermore, LED intensities, as well as illumination times, can be easily controlled and programmed by a simple and cheap microcontroller with the possibility of operating each LED row at different frequencies and runtimes. An example code of how the microcontroller (Arduino Uno, AZ-Delivery Vertriebs GmbH, Deggendorf, Germany) could be programmed to control the LED drivers, thus controlling the on/off time of each LED row, is attached in the Supplementary Material S2. The code is written using an open source software and can be adapted to the application.

4. Conclusions

The successfully designed 96-well high power UV LED array presents an opportunity for combinatorial analysis in e.g., photochemistry, where a high light intensity is needed for the investigation of various reactions. Heat management and a lateral ventilation system to avoid heat accumulation were established and a stable light intensity was achieved. The lateral ventilation system by radial fans with the suitable 3D designed and printed mounting is crucial to achieving stable illumination. Sufficient cooling is achieved using 85 W Peltier elements for the LED array. An automated LED control using a cheap microcontroller was established.
The array has the potential for miniaturized applications. It was designed for a standard 96-well microtiter plate and can be integrated into an automated robot assay system, such as a TECAN robot. The LED array can be practically built for every desired wavelength. Furthermore, an array with multiple wavelengths is possible, and thus, this design can be used and adapted for multiple applications in different areas of research interest. Moreover, depending on the application, the matrix of how the LEDs are arranged can be easily adapted.
LED output could be further optimized by using a more complex setup, which includes a control feedback loop for regulating the cooling temperature, such as a PID controller. Furthermore, the spatial precision of the array could be further enhanced by using silicon domes with a smaller irradiation angle as lenses for the LEDs. It was demonstrated that scattering light effects from LEDs into neighboring sample wells can be reduced by simply adding crossbraces in the microtiter plate mounting. In order to achieve an enhanced control and further reduce scattering light effect, the 3D designed microtiter plate mounting could be extended so that each LED is enclosed. Each LED could also be controlled individually by an LED driver, enhancing the spatial illumination control and making possible the individual illumination of each sample.

Supplementary Materials

The following are available online at https://www.mdpi.com/2304-6732/6/1/17/s1, S1: Figure S1: Schematic Control of LEDs using an Arduino Uno, S2: Code: Example code to control LED rows.

Author Contributions

Conceptualization: All Authors; Data curation: H.K. and H.J.; Formal analysis: H.K., H.J. and J.G.; Funding acquisition: All authors; Investigation: H.K. and H.J.; Methodology: H.K. and H.J.; Project administration: All authors; Resources: All authors; Software: H.K.; Supervision: M.F., F.F.B. and J.G.; Validation: All authors; Visualization: H.K.; Writing - original draft: All authors; Writing - review & editing: All authors.

Funding

The authors acknowledge the financial support by the “Europäischer Fonds für regionale Entwicklung” (EFRE) and the Investitionsbank des Landes Brandenburg (ILB); StAFF project 85000780.

Acknowledgments

We thank all people involved in this work, for facilitating the use of laboratory technical equipment.

Conflicts of Interest

The authors declare no conflict of interest.

References

  1. Quoc, T.; Peter, K.; Quang, B.; Vinh, T.; Winkler, H. LED Lighting: Technology and Perception; Wiley VCH Verlag GmbH & Co. KGaA: Weinheim, Germany, 2014. [Google Scholar] [CrossRef]
  2. Narendran, N.; Deng, L.; Pysar, R.M.; Gu, Y.; Yu, H. Performance characteristics of high-power light-emitting diodes. Anal. Biochem. 2004, 5187, 267–275. [Google Scholar] [CrossRef]
  3. Nakamura, S. Nobel lecture: Background story of the invention of efficient blue ingan light emitting diodes. Nobel Lect. 2015, 87, 1139–1151. [Google Scholar] [CrossRef]
  4. Morita, D.; Sano, M.; Yamamoto, M.; Murayama, T.; Nagahama, S.-I.; Mukai, T. High output power 365 nm ultraviolet light emitting diode of gan-free structure. Jpn. J. Appl. Phys. 2002, 41, 1434. [Google Scholar] [CrossRef]
  5. Khan, A.; Balakrishnan, K.; Katona, T. Ultraviolet light-emitting diodes based on group three nitrides. Nat. Photonics 2008, 2, 77. [Google Scholar] [CrossRef]
  6. Yole Developement. UV LEDs—Technology, Manufacturing and Application Trends 2018; Technical Report; Yole Developpement: Milpitas, CA, USA, 2018. [Google Scholar]
  7. Hoelz, K.; Lietard, J.; Somoza, M.M. High-power 365 nm UV LED mercury arc lamp replacement for photochemistry and chemical photolithography. ACS Sustain. Chem. Eng. 2017, 5, 828–834. [Google Scholar] [CrossRef] [PubMed]
  8. Matafonova, G.; Batoev, V. Recent advances in application of UV light-emitting diodes for degrading organic pollutants in water through advanced oxidation processes: A review. Water Res. 2018, 132, 177–189. [Google Scholar] [CrossRef] [PubMed]
  9. Smith, K.C. Dose dependent decrease in extractability of DNA from bacteria following irradiation with ultraviolet light or with visible light plus dye. Biochem. Biophys. Res. Commun. 1962, 8, 157–163. [Google Scholar] [CrossRef]
  10. Singh-Gasson, S.; Green, R.D.; Yue, Y.; Nelson, C.; Blattner, F.; Sussman, M.R.; Cerrina, F. Maskless fabrication of light-directed oligonucleotide microarrays using a digital micromirror array. Nat. Biotechnol. 1999, 17, 974–978. [Google Scholar] [CrossRef] [PubMed]
  11. Hansen, L.B.; Buus, S.; Schafer-Nielsen, C. Identification and mapping of linear antibody epitopes in human serum albumin using high-density peptide arrays. PLoS ONE 2013, 8, 1–10. [Google Scholar] [CrossRef] [PubMed]
  12. Forsström, B.; Axnäs, B.B.; Stengele, K.P.; Bühler, J.; Albert, T.J.; Richmond, T.A.; Hu, F.J.; Nilsson, P.; Hudson, E.P.; Rockberg, J.; et al. Proteome-wide epitope mapping of antibodies using ultra-dense peptide arrays. Mol. Cell. Proteom. 2014, 13, 1585–1597. [Google Scholar] [CrossRef] [PubMed]
  13. Takeda, K.; Fujisawa, K.; Nojima, H.; Kato, R.; Ueki, R.; Sakugawa, H. Hydroxyl radical generation with a high power ultraviolet light emitting diode (UV-LED) and application for determination of hydroxyl radical reaction rate constants. J. Photochem. Photobiol. A Chem. 2017, 340, 8–14. [Google Scholar] [CrossRef]
  14. Khademalrasool, M.; Farbod, M.; Talebzadeh, M.D. The improvement of photocatalytic processes: Design of a photoreactor using high-power LEDs. J. Sci. Adv. Mater. Devices 2016, 1, 382–387. [Google Scholar] [CrossRef] [Green Version]
  15. Bochet, C.G. Photolabile protecting groups and linkers. J. Chem. Soc. Perkin Trans. 2002, 1, 125–142. [Google Scholar] [CrossRef]
  16. Jasenak, B.S. How to Design with LEDs: Concurrent Engineering Yields Fully Optimized Lighting Systems; LED Professional: Dornbirn, Austria, 2016. [Google Scholar]
  17. Barbosa, J.L.F.; Simon, D.; Calixto, W.P. Design Optimization of a High-power LED Matrix Luminaire. Energies 2017, 10, 639. [Google Scholar] [CrossRef]
  18. CELED 96 Hardware Manual. Available online: https://www.cetoni.de/fileadmin/user_upload/Documents/Manuals/Manual_Hardware_ceLED96_EN.pdf. (accessed on 20 February 2019).
  19. Bullough, J. LED Lighting Systems; Technical Report; Lightning Research Center: Troy, NY, USA, 2003. [Google Scholar]
  20. Klàn, P.; Åolomek, T.; Bochet, C.G.; Blanc, A.; Givens, R.; Rubina, M.; Popik, V.; Kostikov, A.; Wirz, J. Photoremovable protecting groups in chemistry and biology: Reaction mechanisms and efficacy. Chem. Rev. 2013, 113, 119–191. [Google Scholar] [CrossRef] [PubMed]
  21. Naqvi, A.; Nahar, P. Photochemical immobilization of proteins on microwave-Synthesized photoreactive polymers. Anal. Biochem. 2004, 327, 68–73. [Google Scholar] [CrossRef] [PubMed]
  22. Haddon, M.; Smith, T. The chemistry and applications of UV-cured adhesives. Int. J. Adhes. Adhes. 1991, 11, 183–186. [Google Scholar] [CrossRef]
  23. Available online: https://www.brand.de/products/life-science-products/brandplatesr-microplates/technical-data-sheets/ (accessed on 20 February 2019).
  24. Available online: https://www.theseus.fi/bitstream/handle/10024/80460/Schutt_Ekaterina.pdf?sequence=1&isAllowed=y (accessed on 20 February 2019).
  25. Available online: https://www.cypress.com/file/38656/download (accessed on 20 February 2019).
  26. Priante, D.; Elafandy, R.T.; Prabaswara, A.; Janjua, B.; Zhao, C.; Alias, M.S.; Tangi, M.; Alaskar, Y.; Albadri, A.M.; Alyamani, A.Y.; et al. Diode junction temperature in ultraviolet algan quantum-disks-in-nanowires. J. Appl. Phys. 2018, 124, 015702. [Google Scholar] [CrossRef]
  27. Perera, I.; Liu, Y.-W.; Narendran, N. Accurate measurement of LED lens surface temperature. Proc. SPIE Int. Soc. Opt. Eng. 2013, 8835. [Google Scholar] [CrossRef]
  28. Available online: https://www.cree.com/led-components/media/documents/XLampThermalManagement.pdf (accessed on 20 February 2019).
  29. Available online: https://www.axionbiosystems.com/products/lumos (accessed on 20 February 2019).
  30. Available online: https://www.prizmatix.com/UHP/UHP-LED-for-96-Wells-Microplate-Illumination.htm (accessed on 20 February 2019).
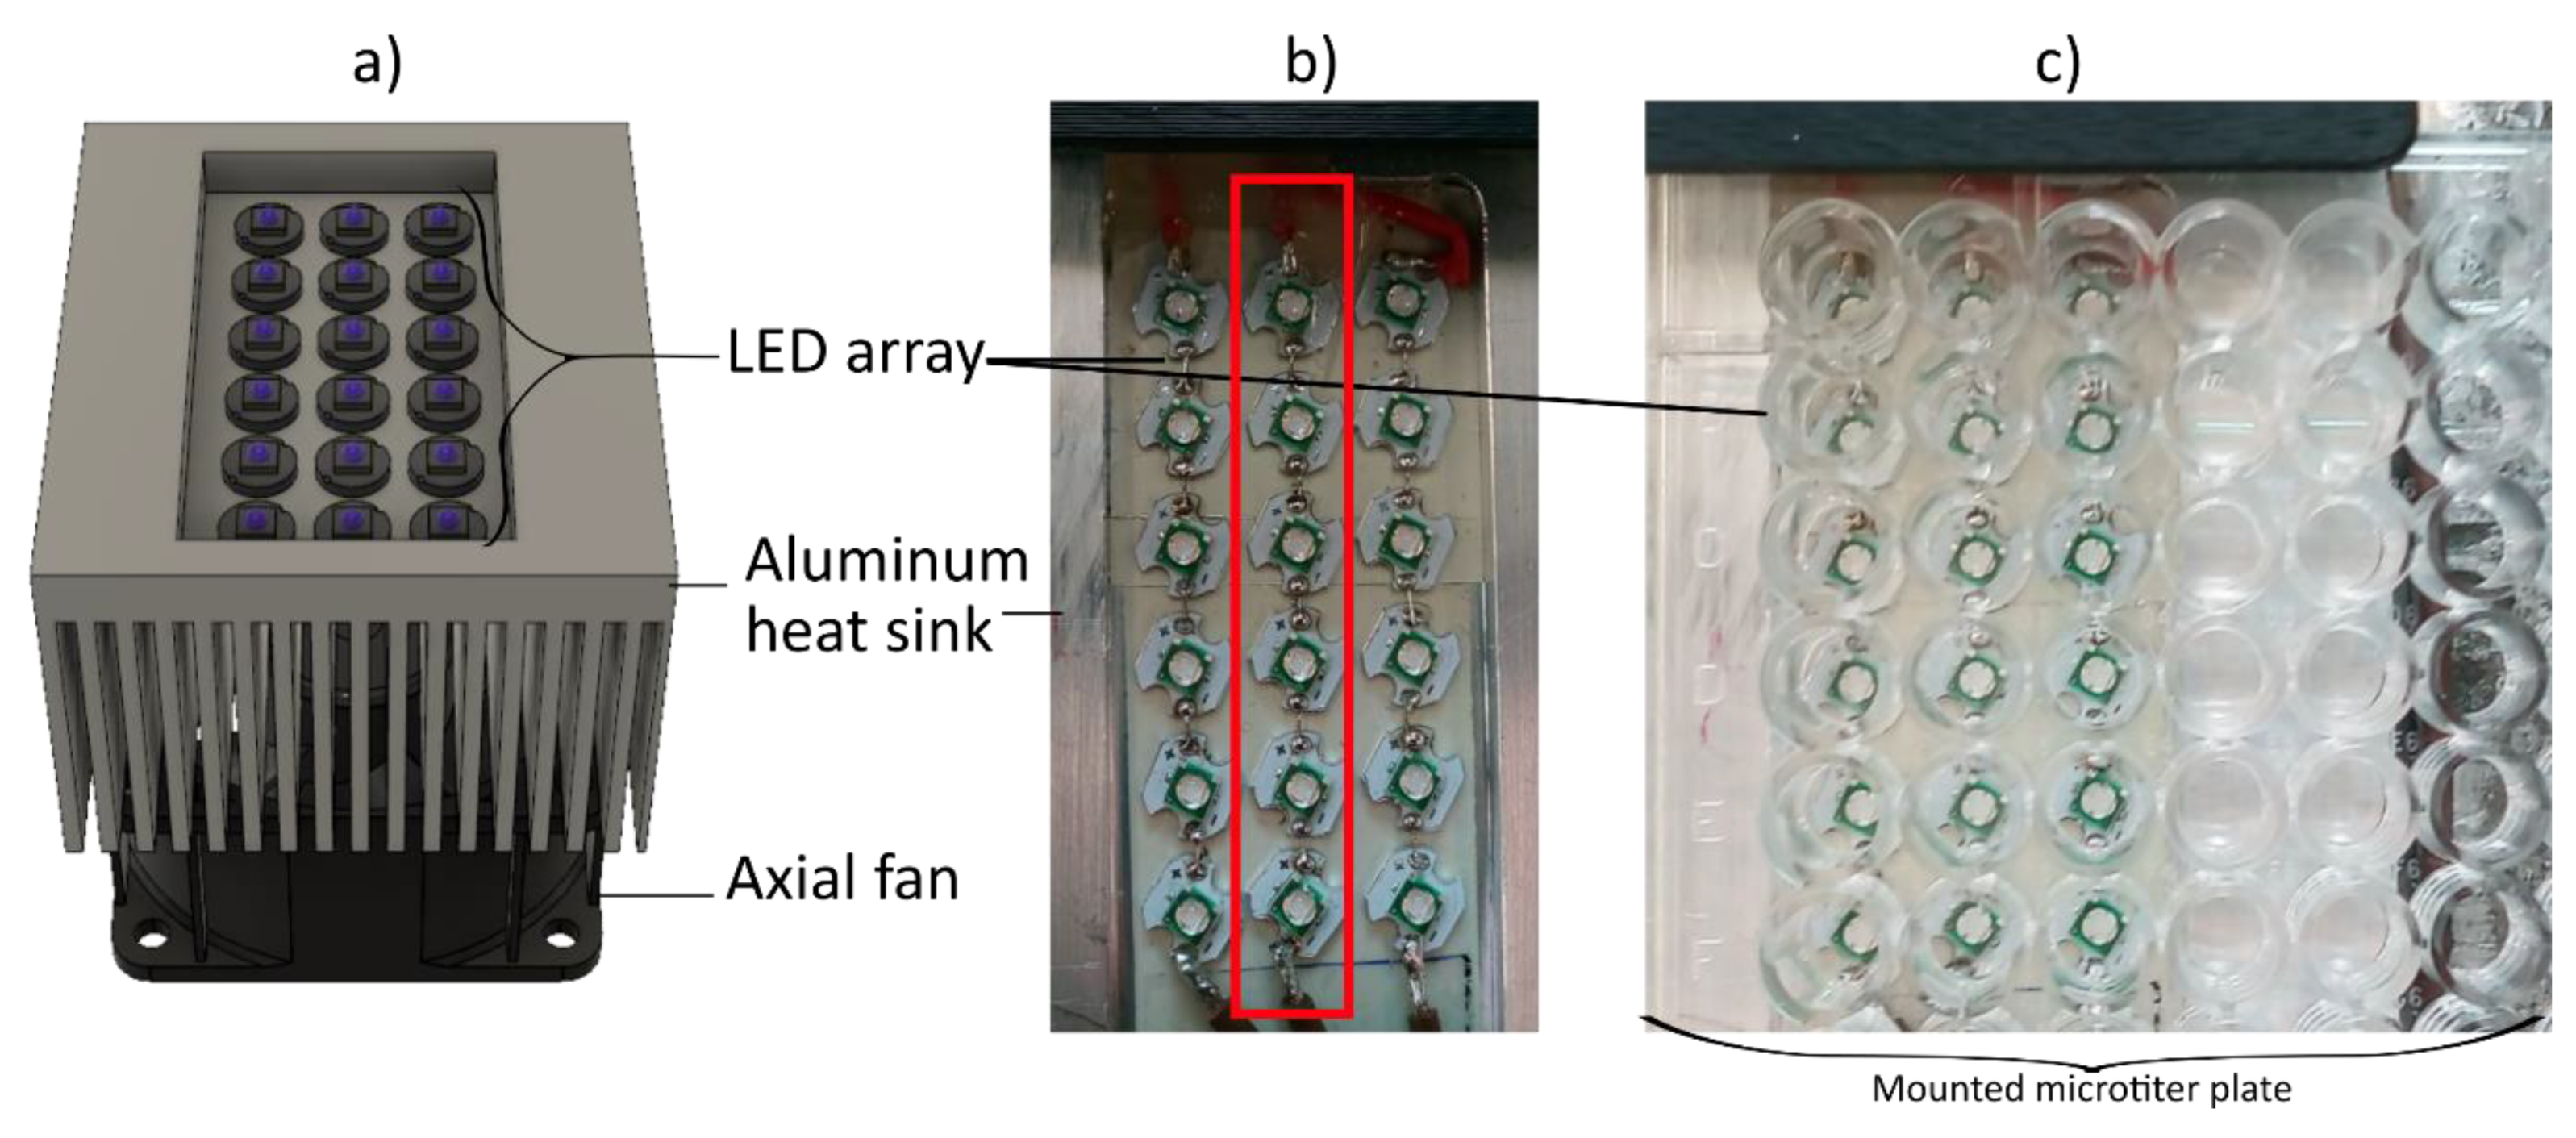
Figure 1. Schematic overview of Setup 1. Left side CAD drawn design (a), (b) photograph from top view, (c) setup 1 with mounted microtiter plate. Red rectangle in a) indicates the row were IR images were recorded. The setup consisted of 3 × 6 LEDs. Each row was powered by a LDD-700 L constant-current source, and could be individually controlled by a microcontroller.
Photonics 06 00017 g001
Figure 2. Schematic overview of setup 2. (a) shows the CAD design, (b) a photograph from setup 2. Red rectangle in a) indicates the row were IR images were recorded.
Photonics 06 00017 g002
Figure 3. Schematic overview of setup 3, (a) shows the CAD design, (b) a photograph from setup 2. Red rectangle in a) indicates the row were IR images were recorded.
Photonics 06 00017 g003
Figure 4. LED emission intensity measurement setup.
Photonics 06 00017 g004
Figure 5. Casing Temperature of the three different setups when using LEDs in CW mode after 5 min with different fixing methods (a) with thermal conductive tape in setup 1 (b) left thermal conductive tape, right thermal conductive adhesive paste in setup 2 (c) thermal conductive adhesive paste with radial fans on in setup 3.
Photonics 06 00017 g005
Figure 6. Light intensities recorded of (a) setup 1, (b) setup 2, (c) setup 3 without radial fans turned on and (d) setup 3 with radial fans turned on.
Photonics 06 00017 g006
Table 1. Overview of components used in Setup 1–3 with approximate overall costs.
DeviceTechnical DataSetup 1Setup 2Setup 3
LED driver700 LDD L
700 mA, 9–36 V
12×12×
Aluminum heat sinkSK92-100-SA
100 × 100 × 40 mm
1 K/W
Aluminum plate20 × 20 × 0.05 cm
365 nm HP LEDsmd3535
Forward voltage (UF)UF = 3.5 V
Forward current (IF)IF = 700 mA
18×96×96×
MicrocontrollerArduino Uno
Axial fan12 V, DC
500 mA
Radial fan12 V, DC
500 mA
--
Peltier elementTEC1-12706, 60 W--
Peltier elementTEC1-12710, 80 W--
Absolute maximum emission intensityIn fluorescence units34,00844,63850,079
Circa setup costIn Euro57250262