Dual-Section DFB-QCLs for Multi-Species Trace Gas Analysis

 , ,
, ,
Abstract
:
1. Introduction
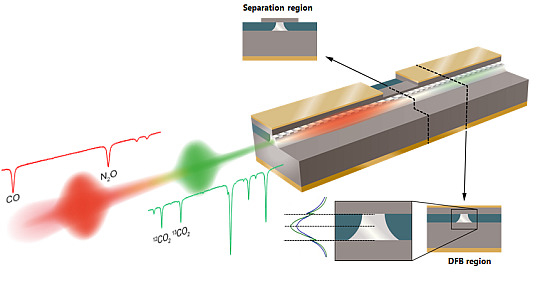
2. Dual-Wavelength QCLs
2.1. Materials and Methods
2.1.1. Laser Fabrication
2.1.2. Laser Characterization
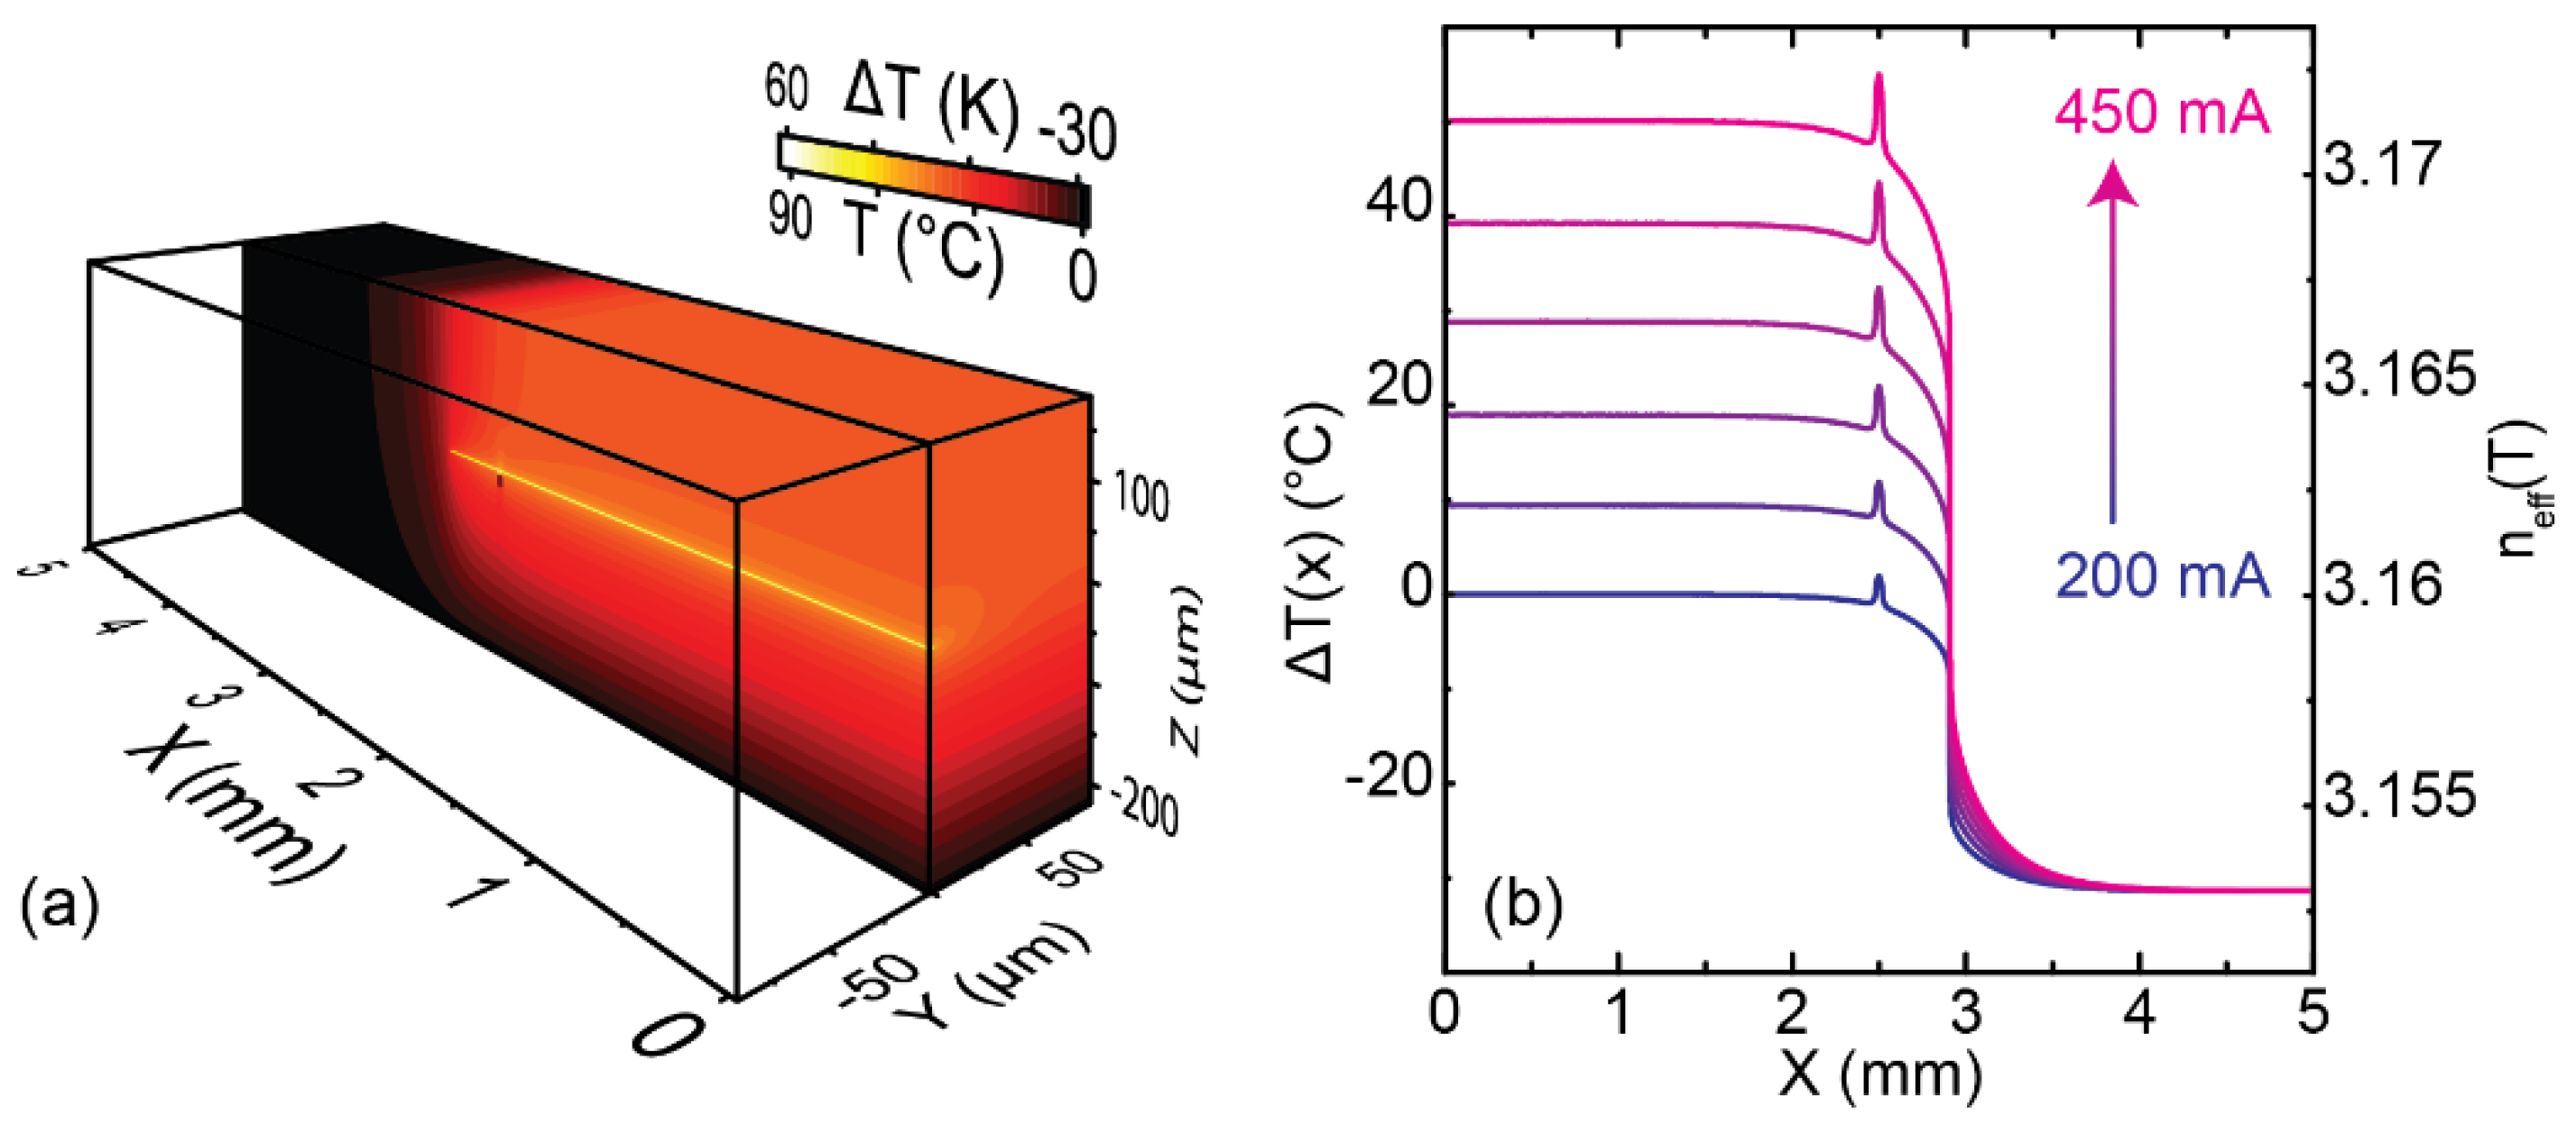
2.1.3. Simulations
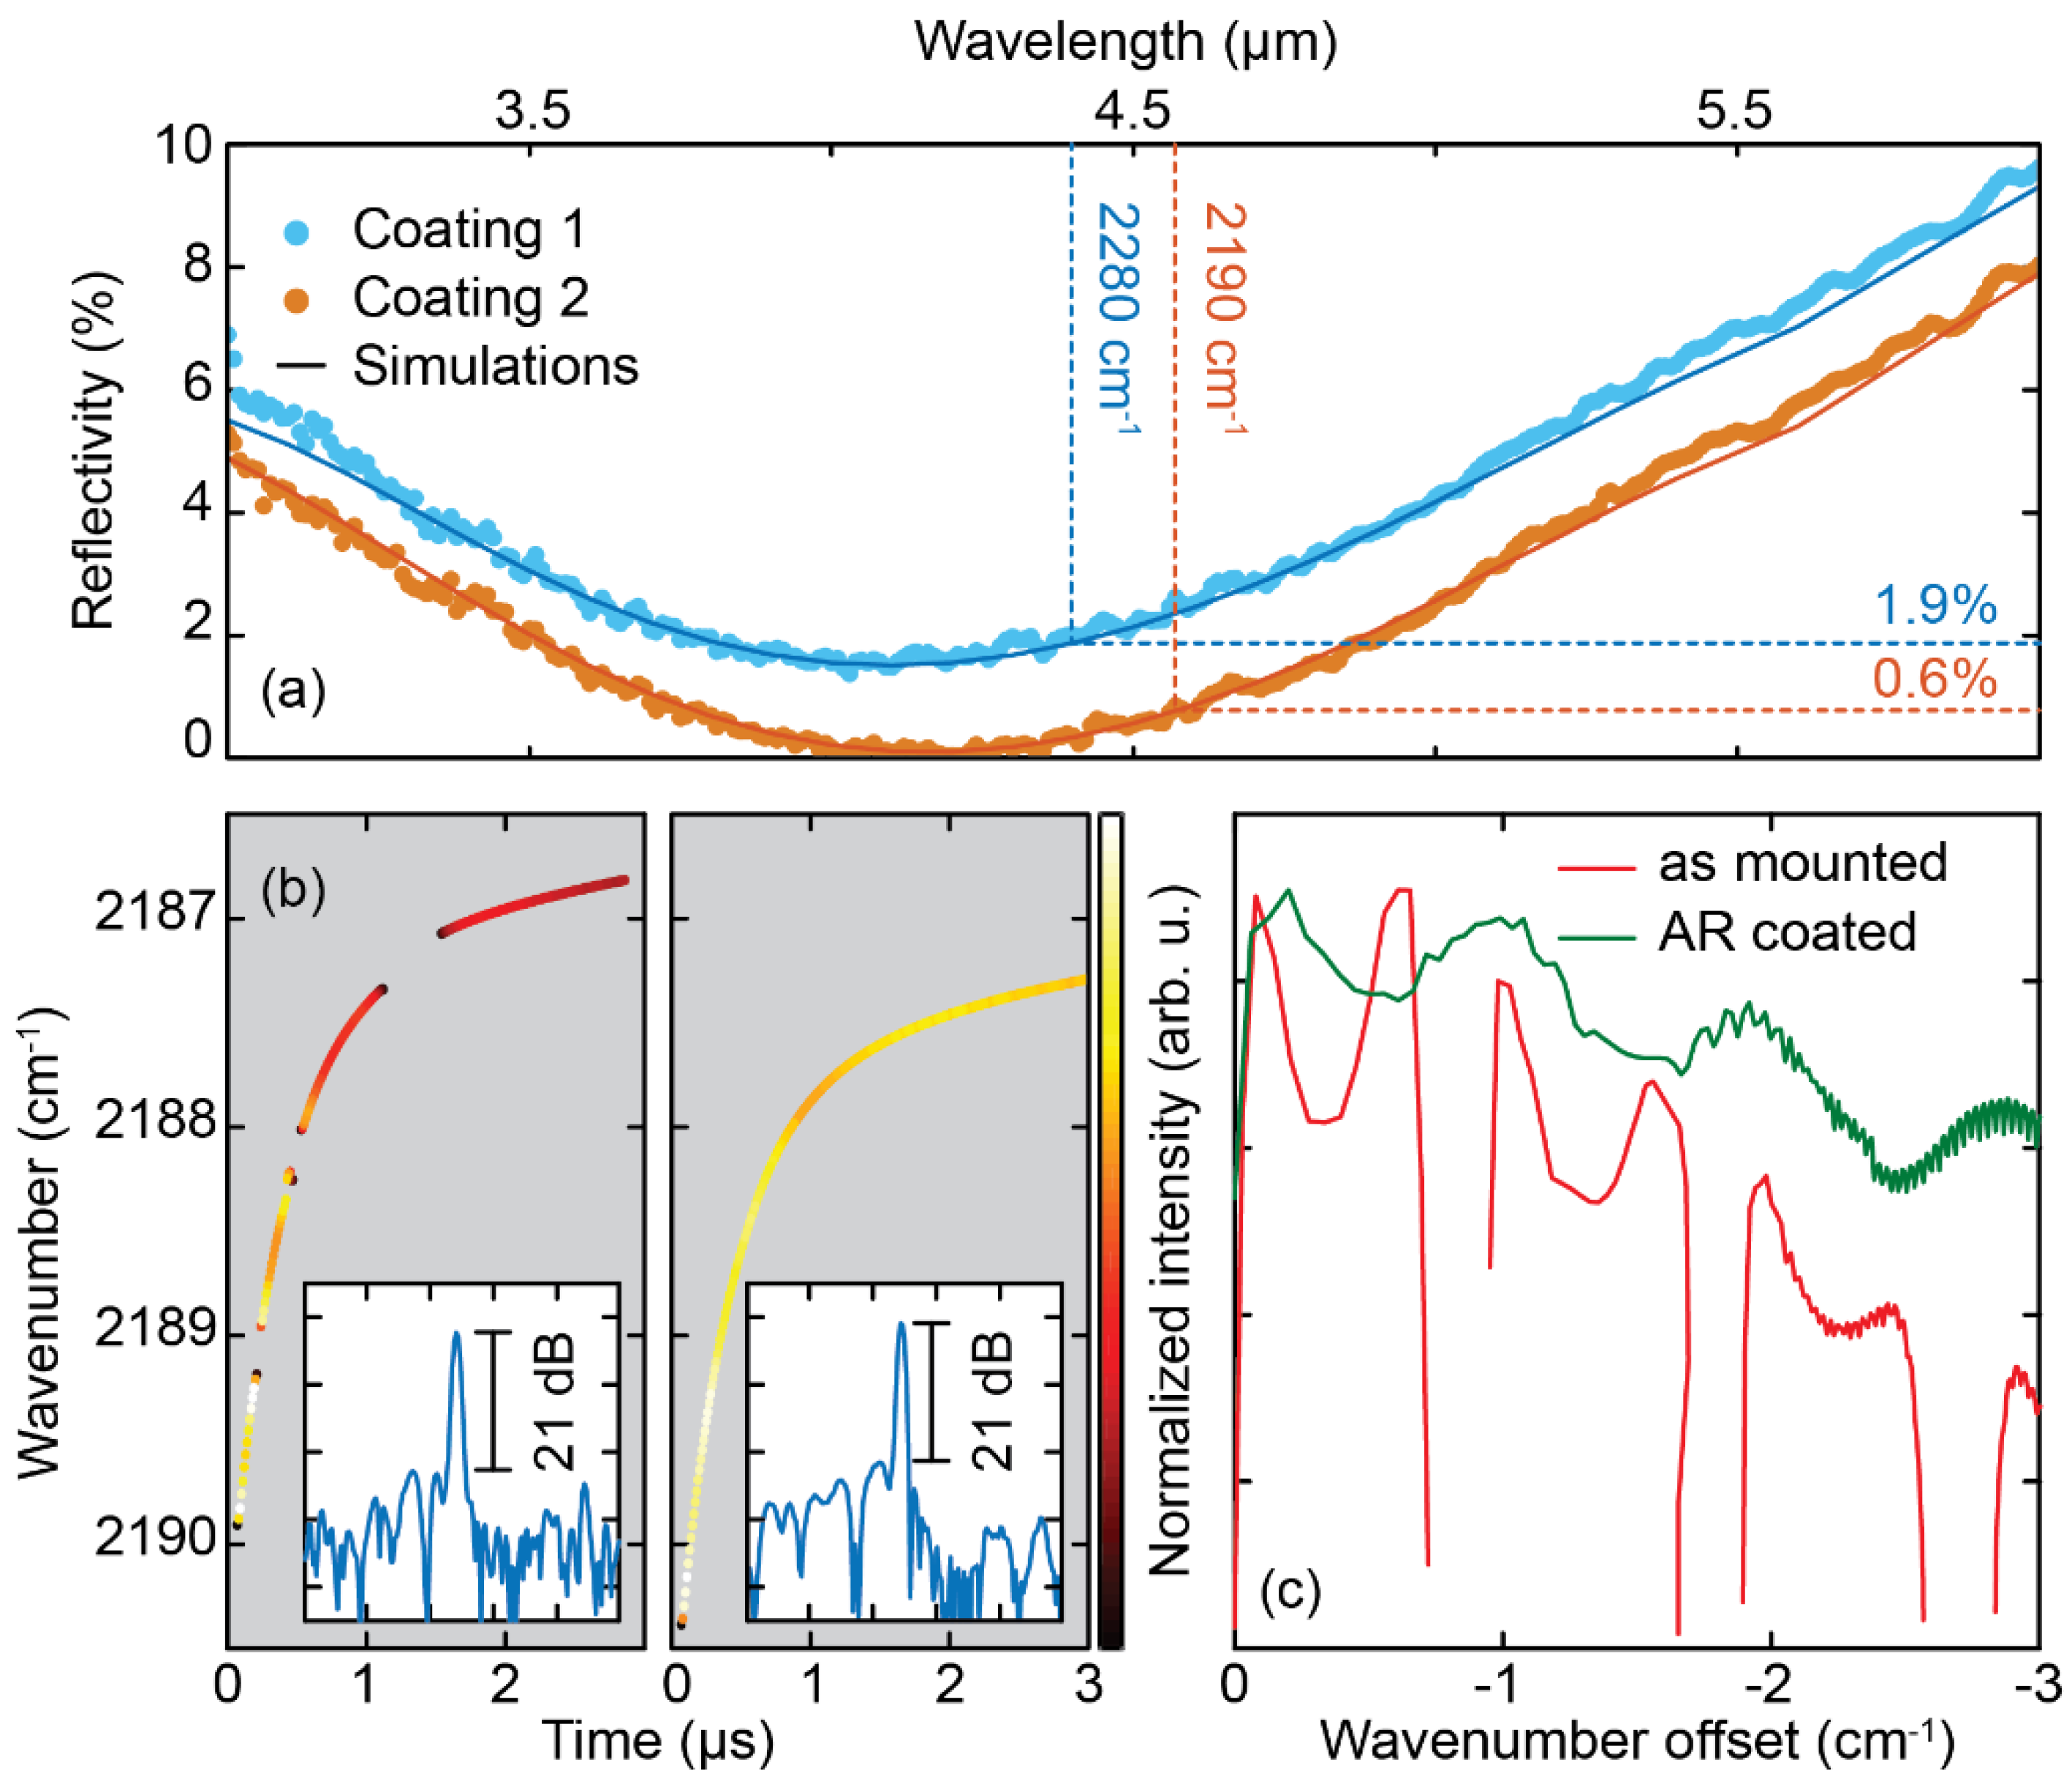
2.1.4. Anti-Reflective Coating
2.2. Results
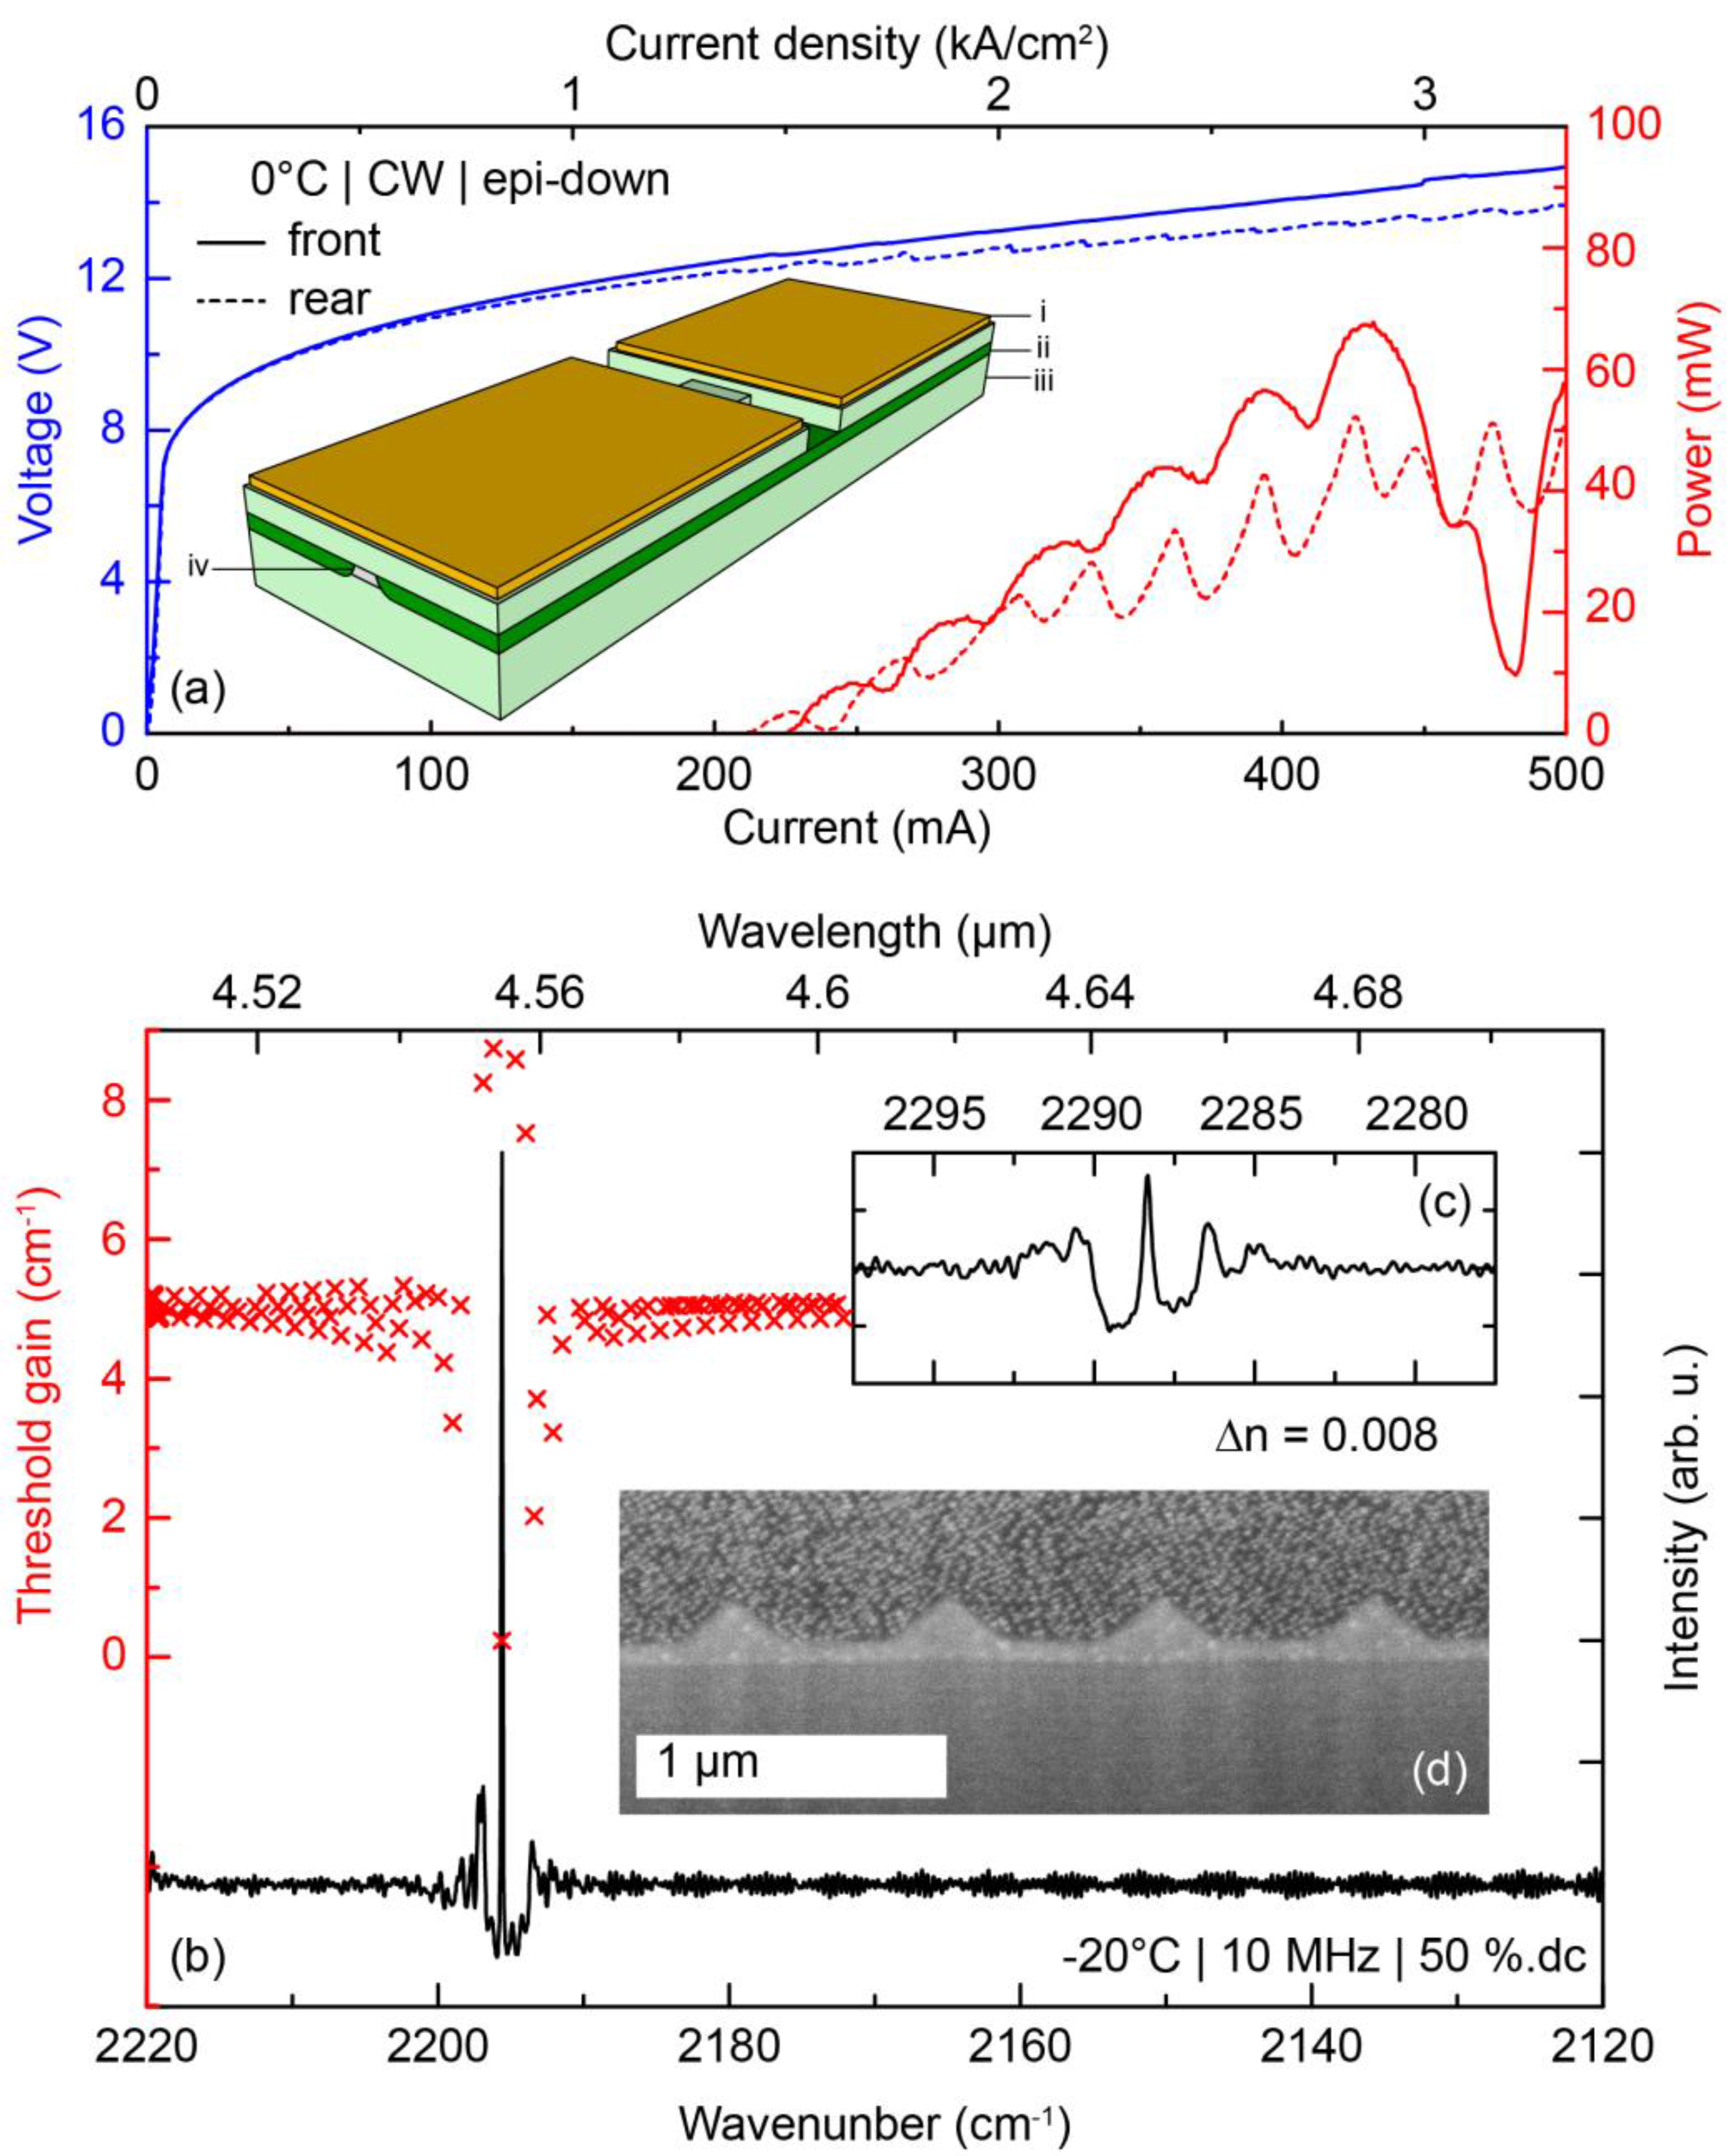
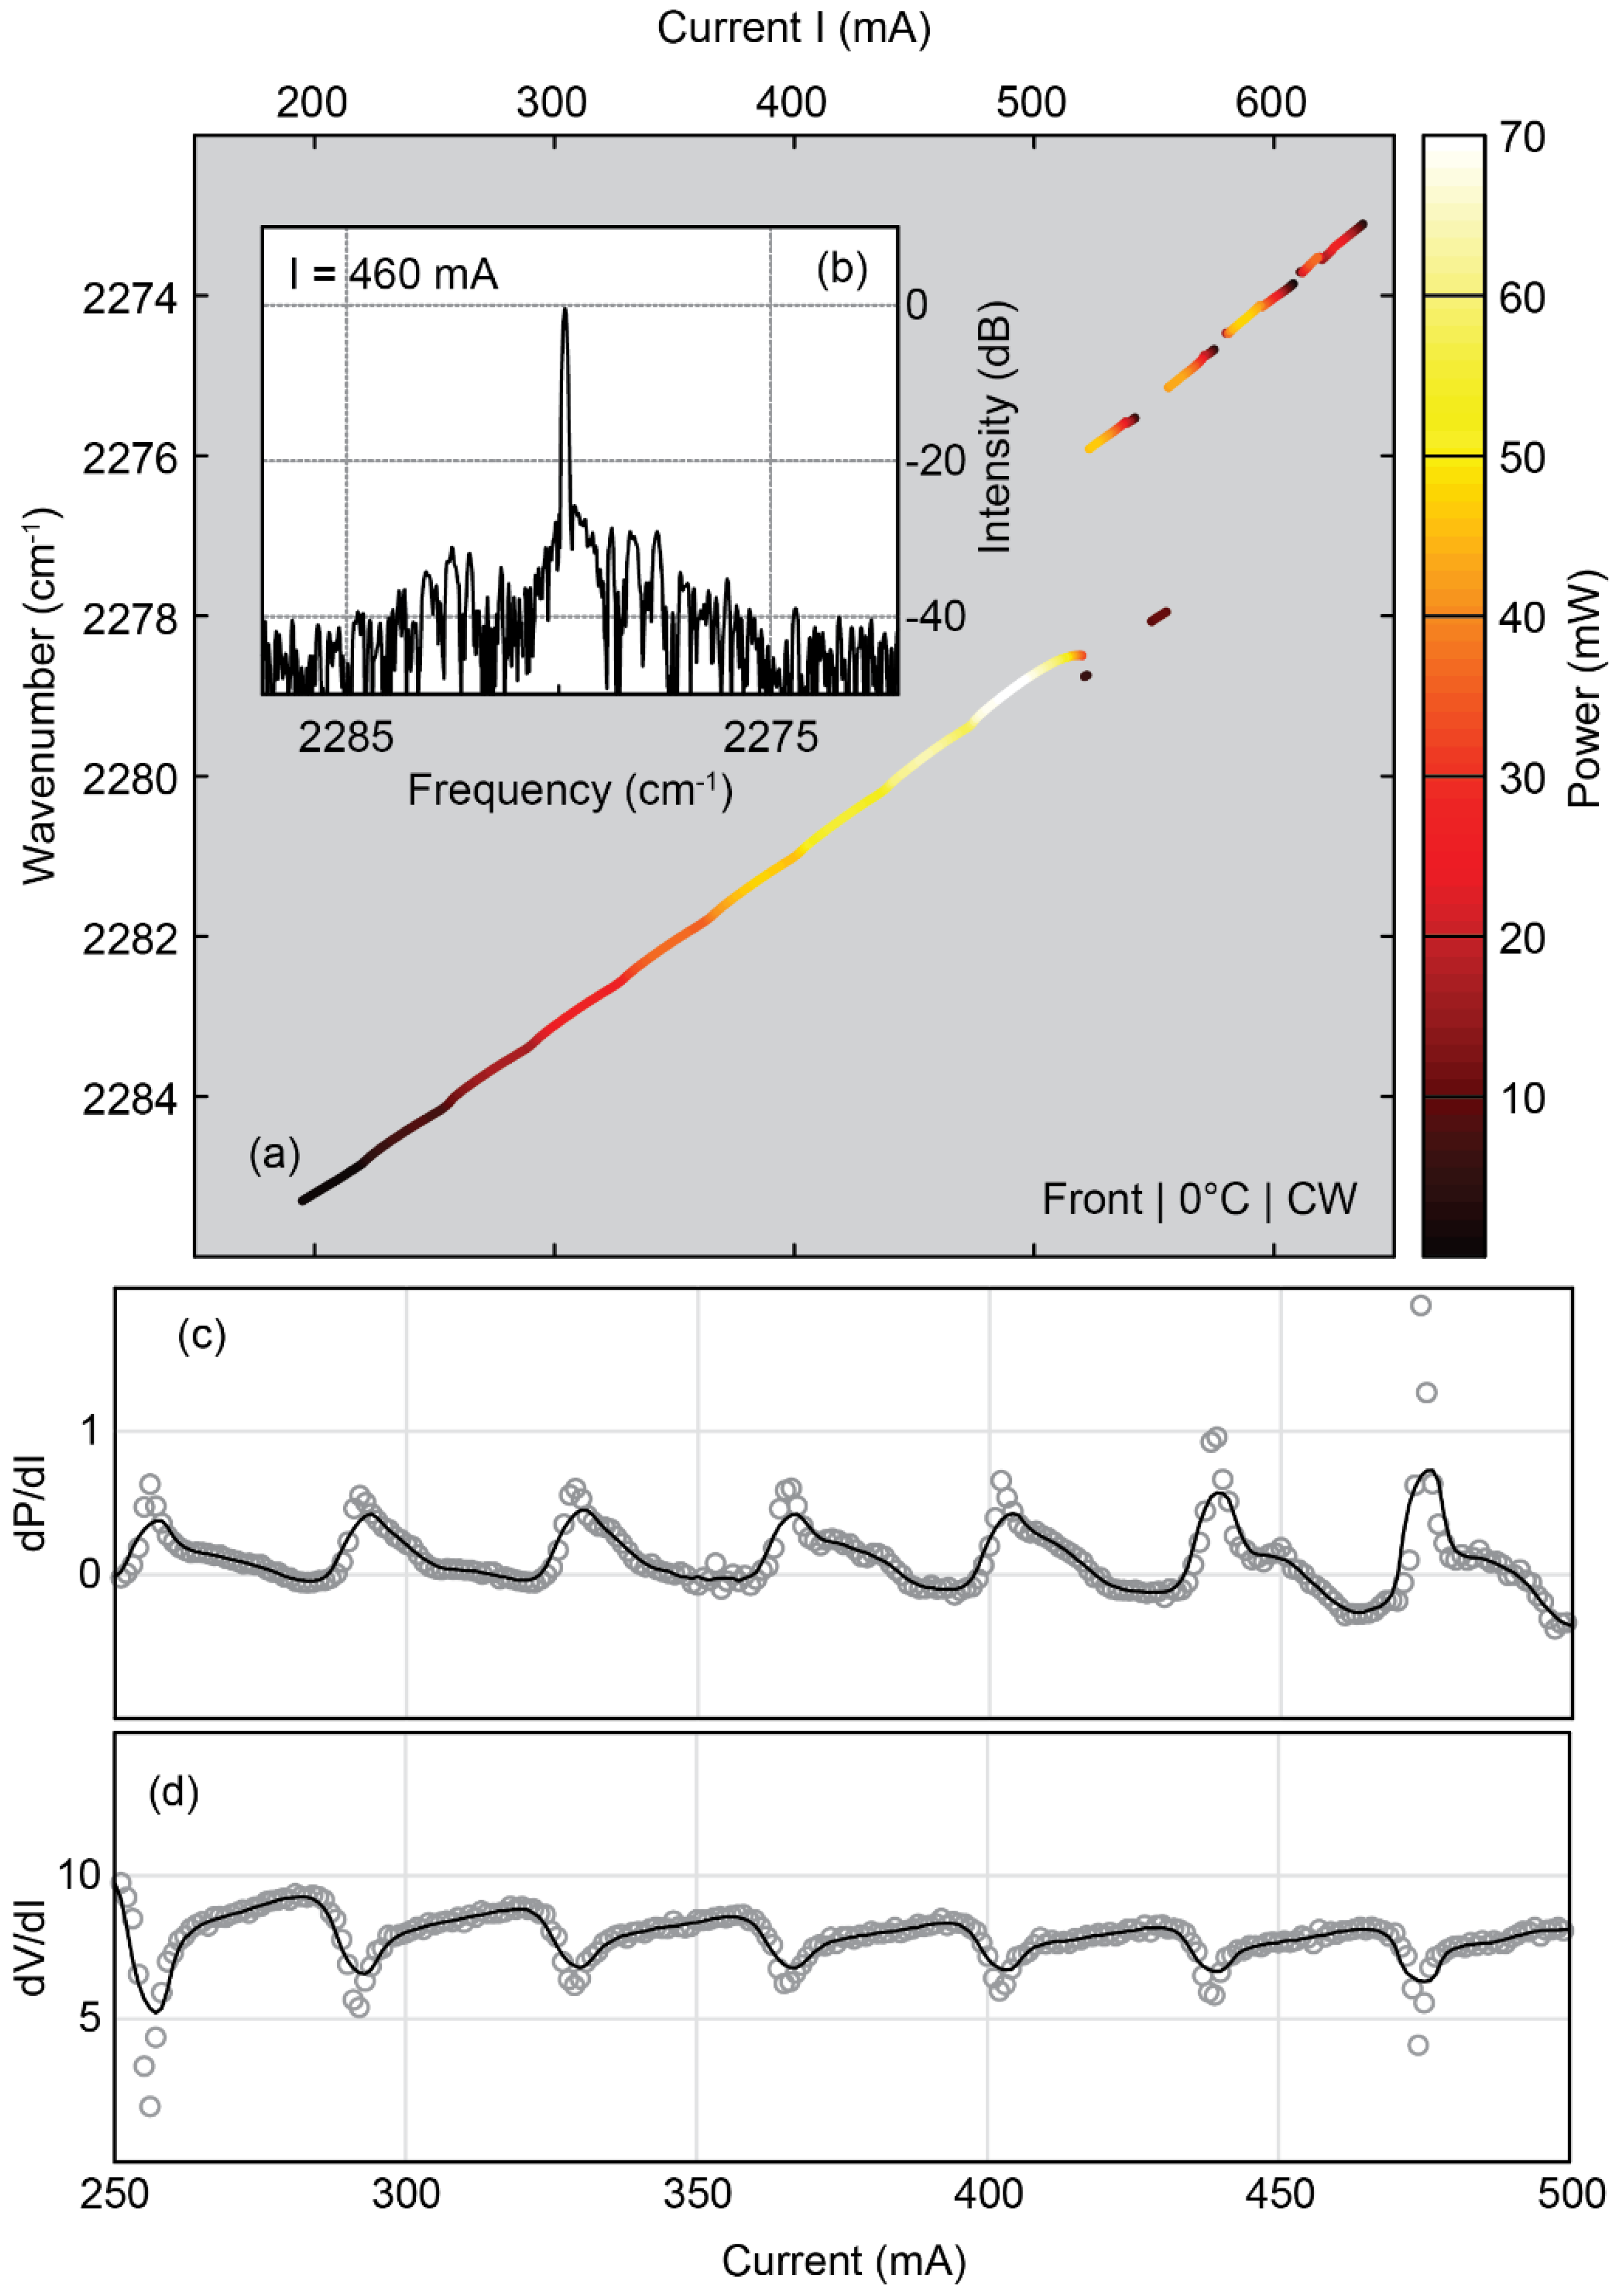
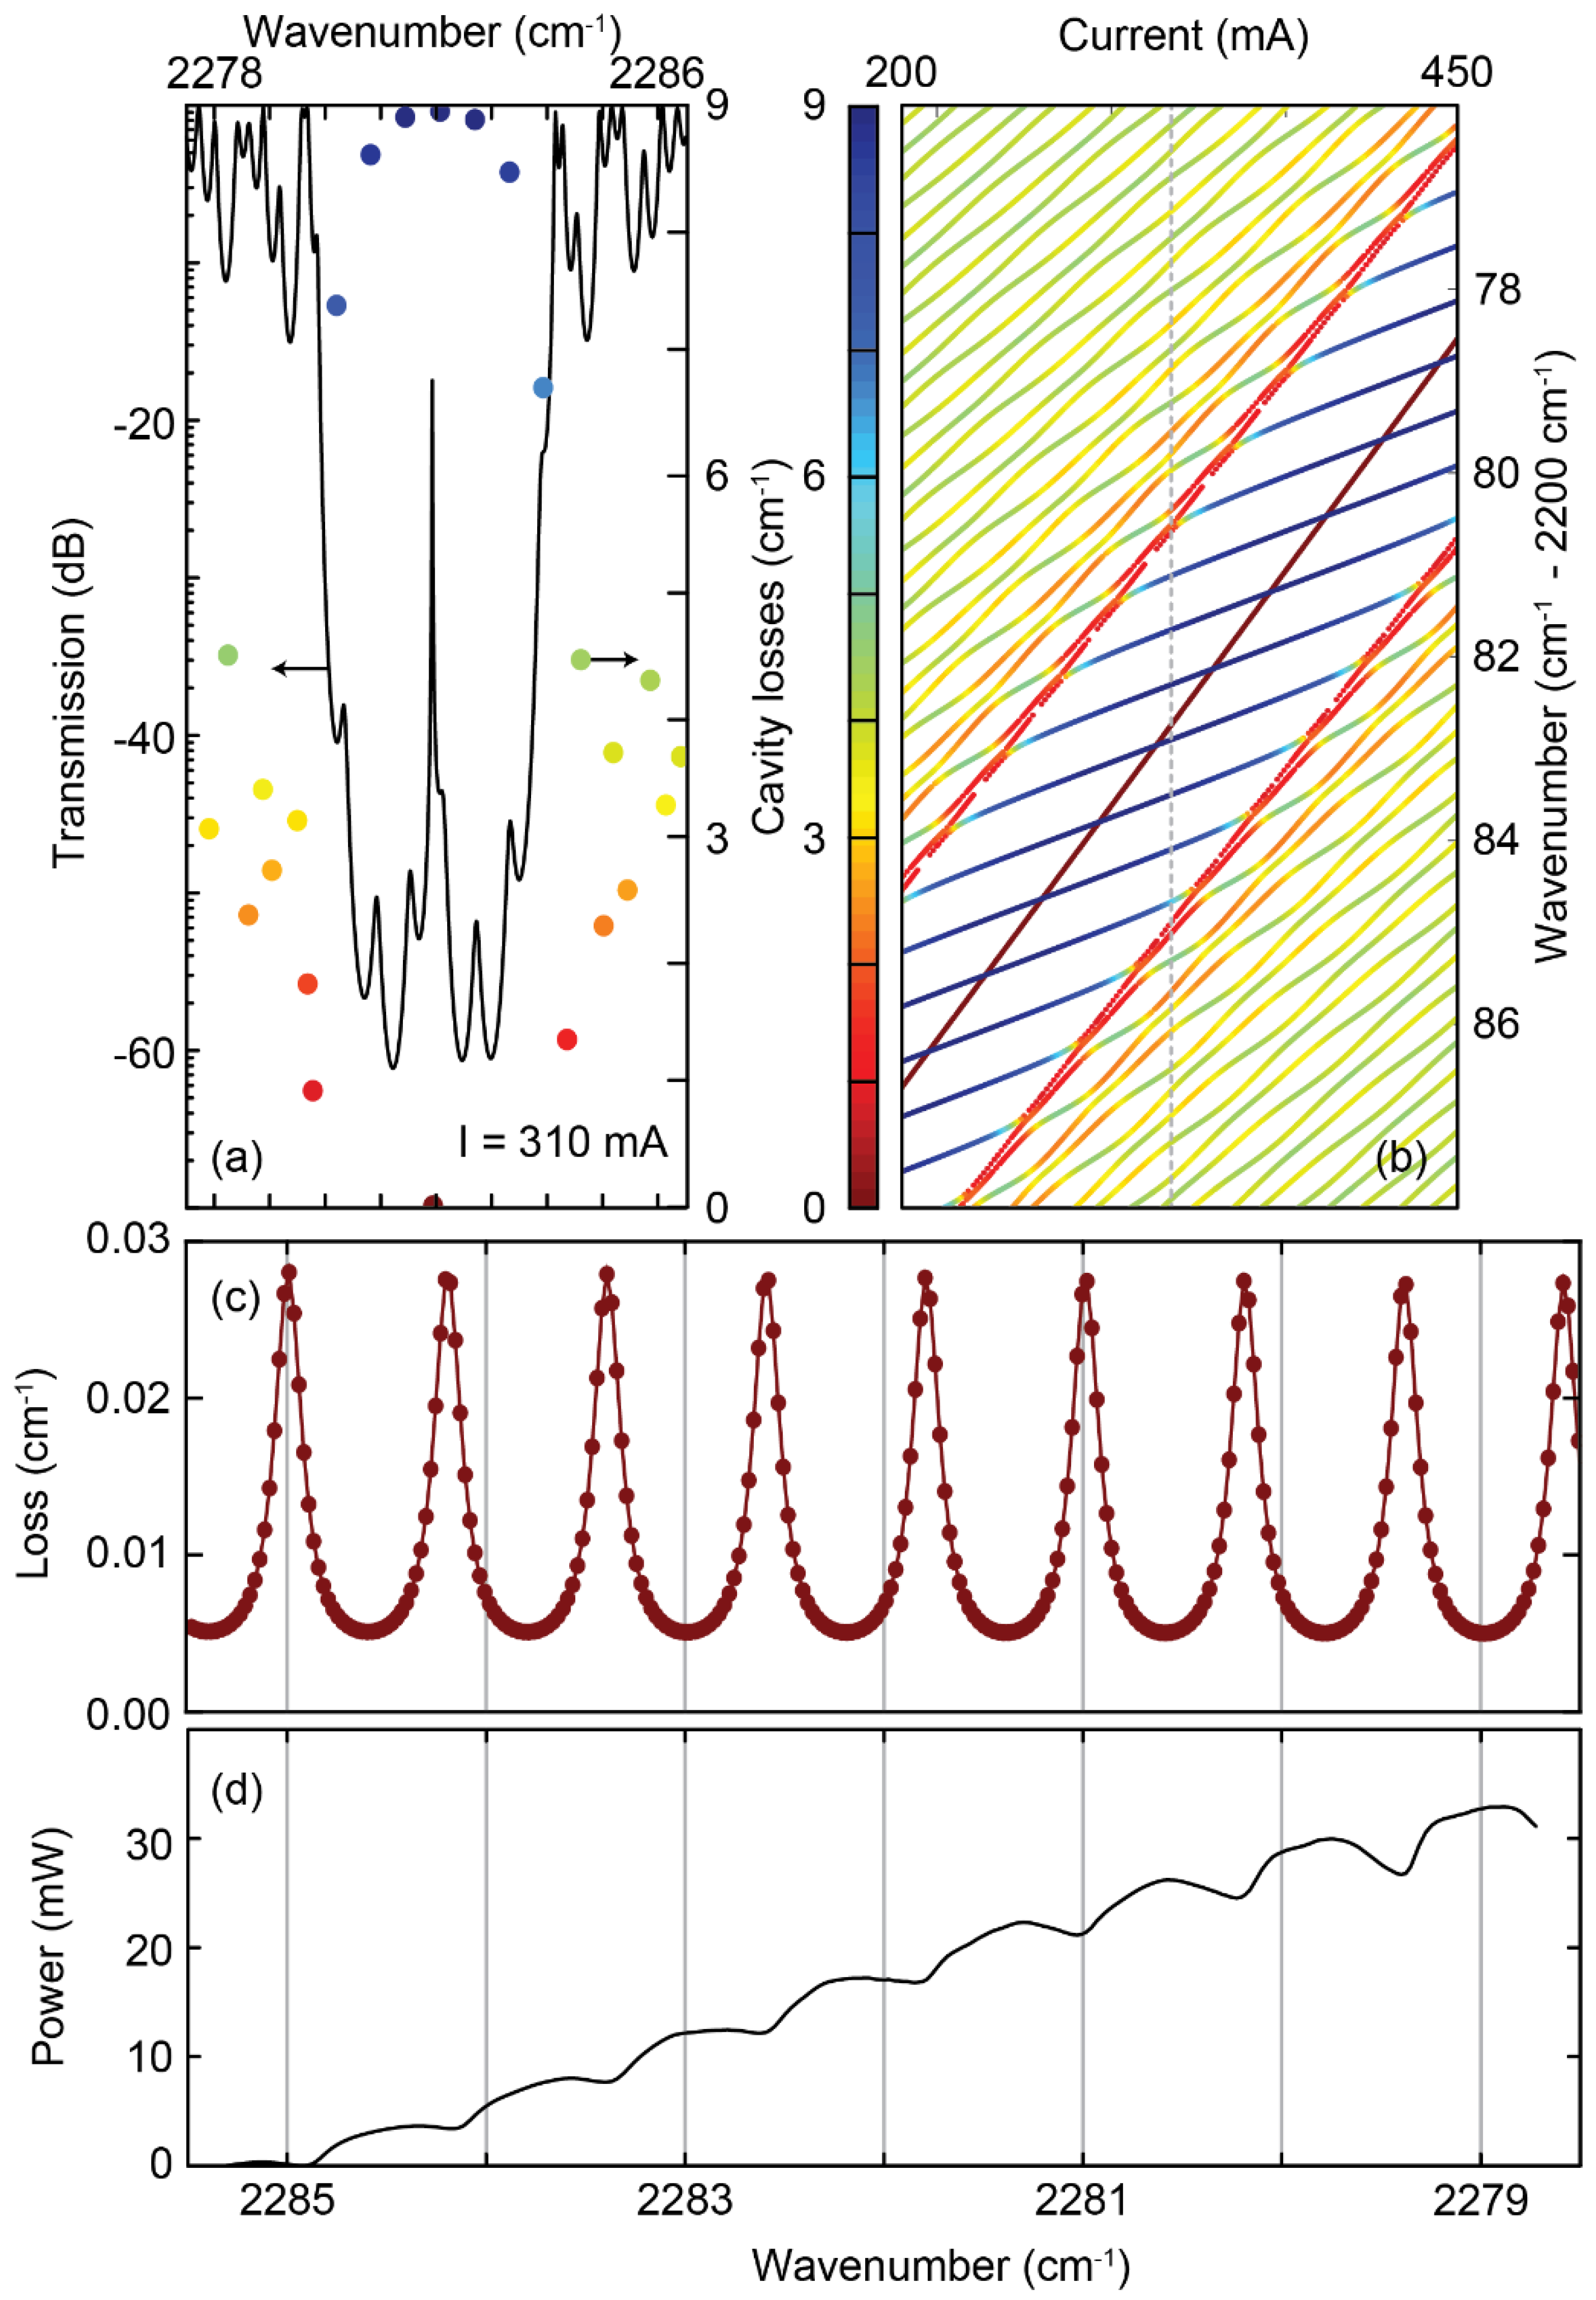
2.2.1. Device Characteristics and Internal Etaloning
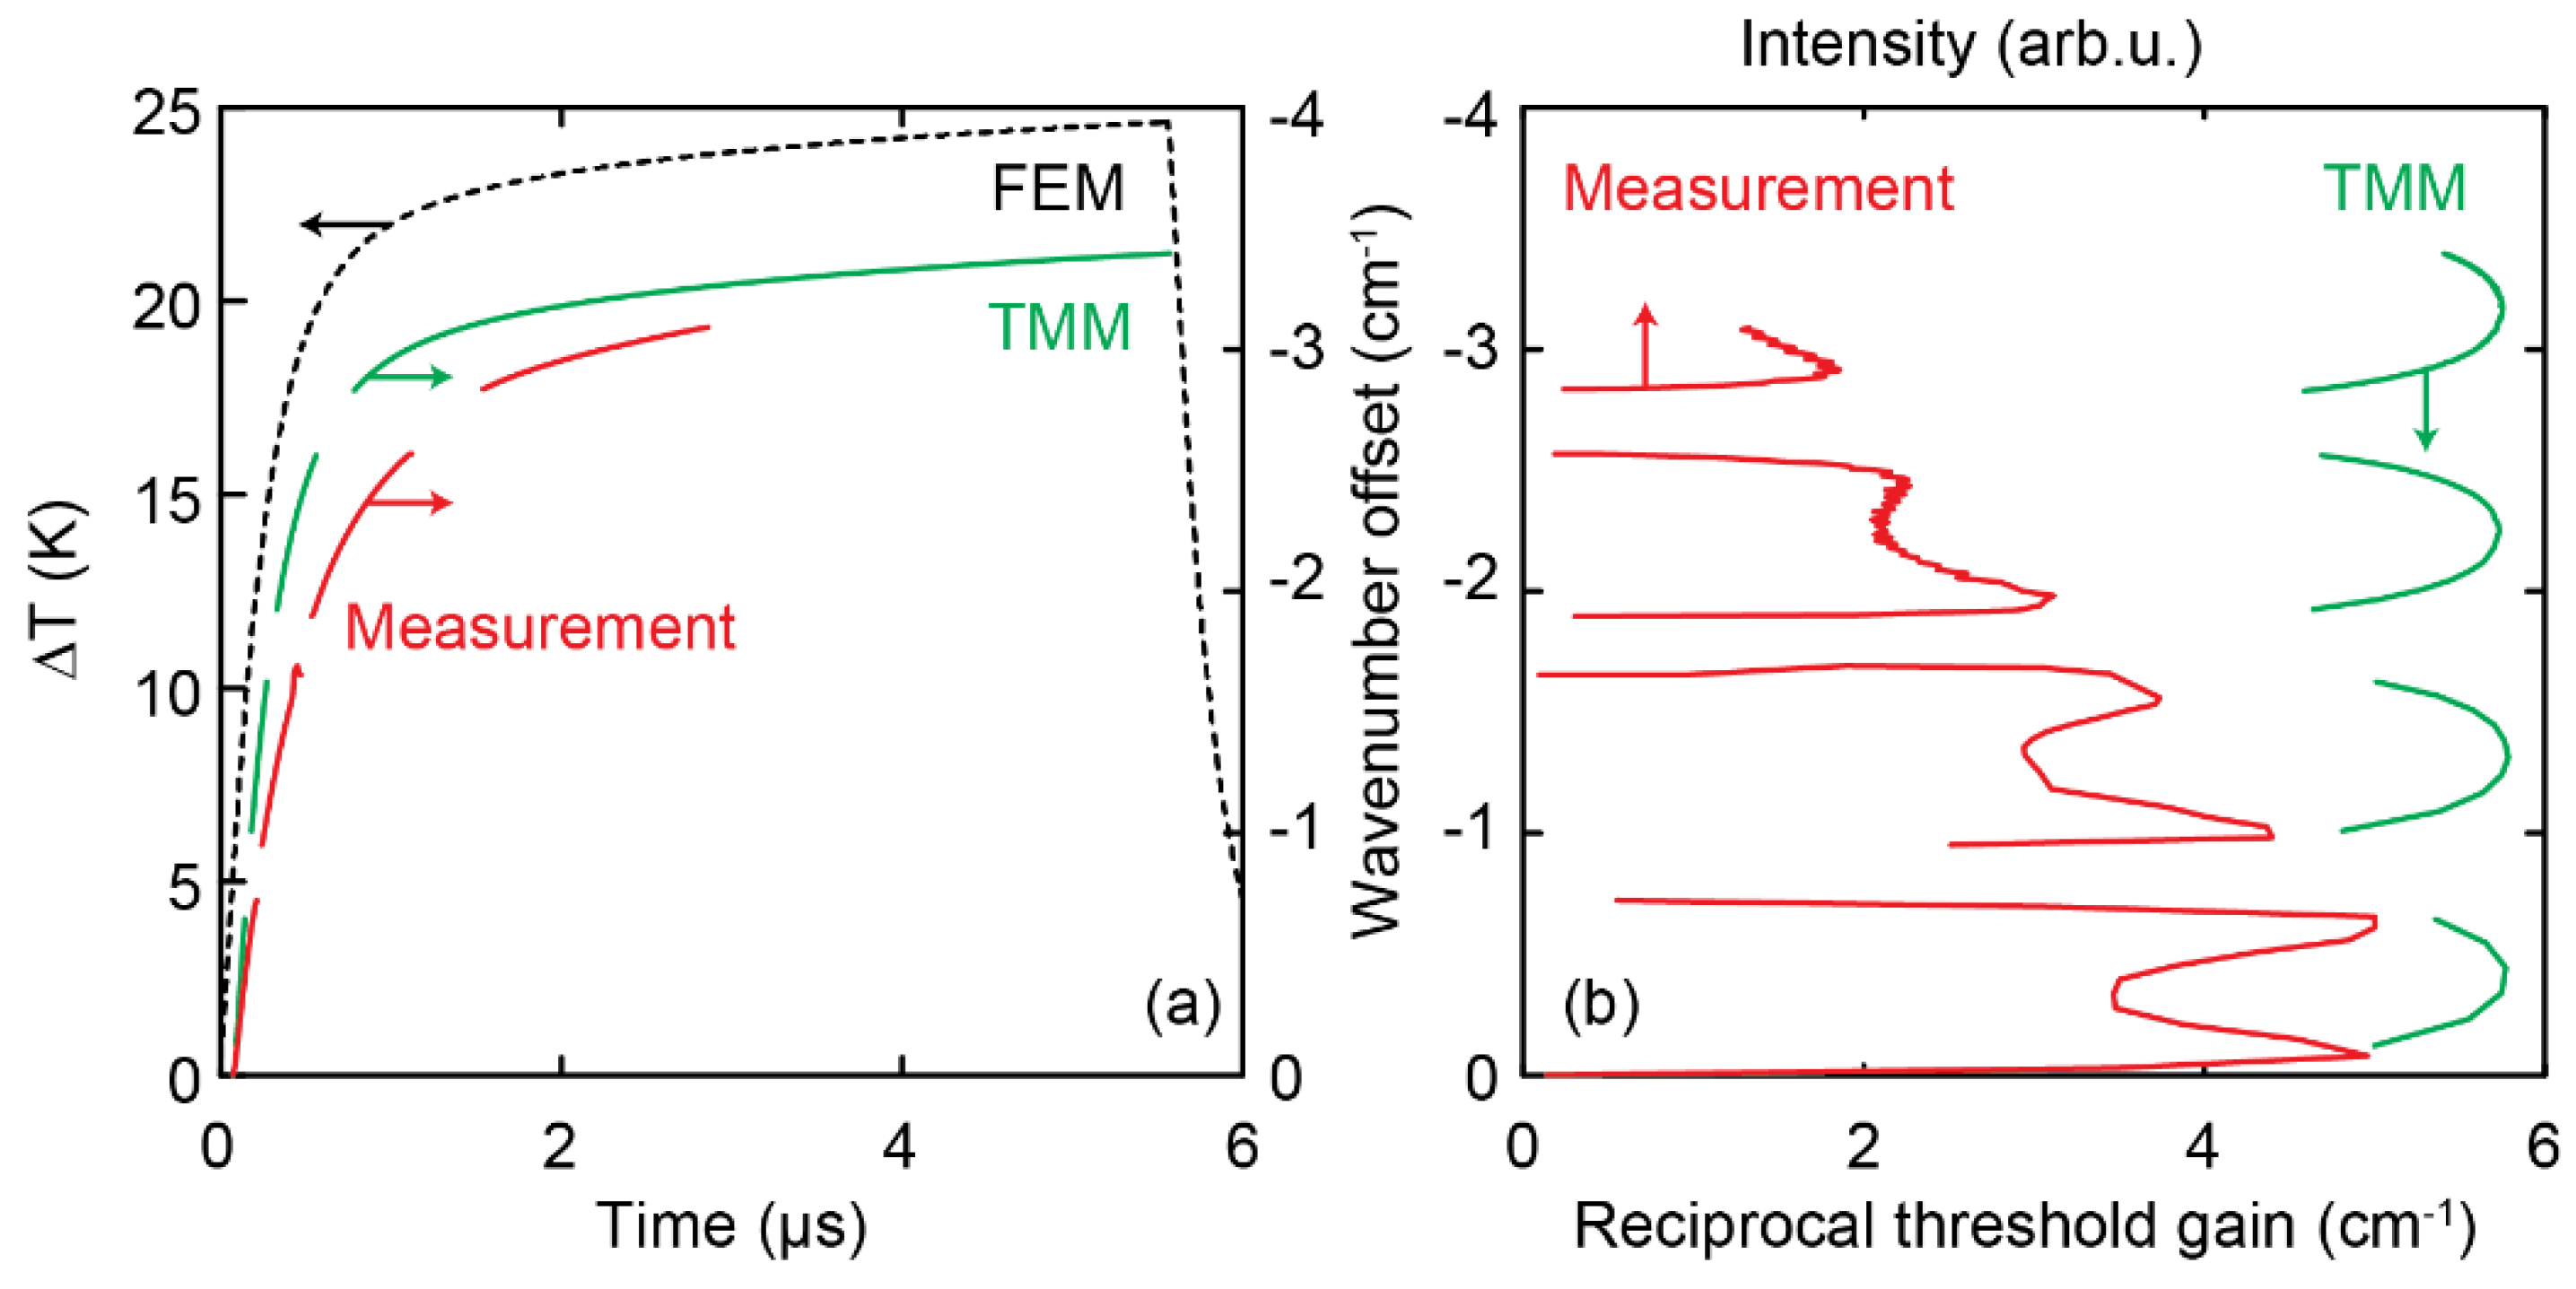
2.2.2. FEM and TMM Simulation of the Internal Etalon
2.2.3. Effects of AR Coatings
3. Spectroscopy
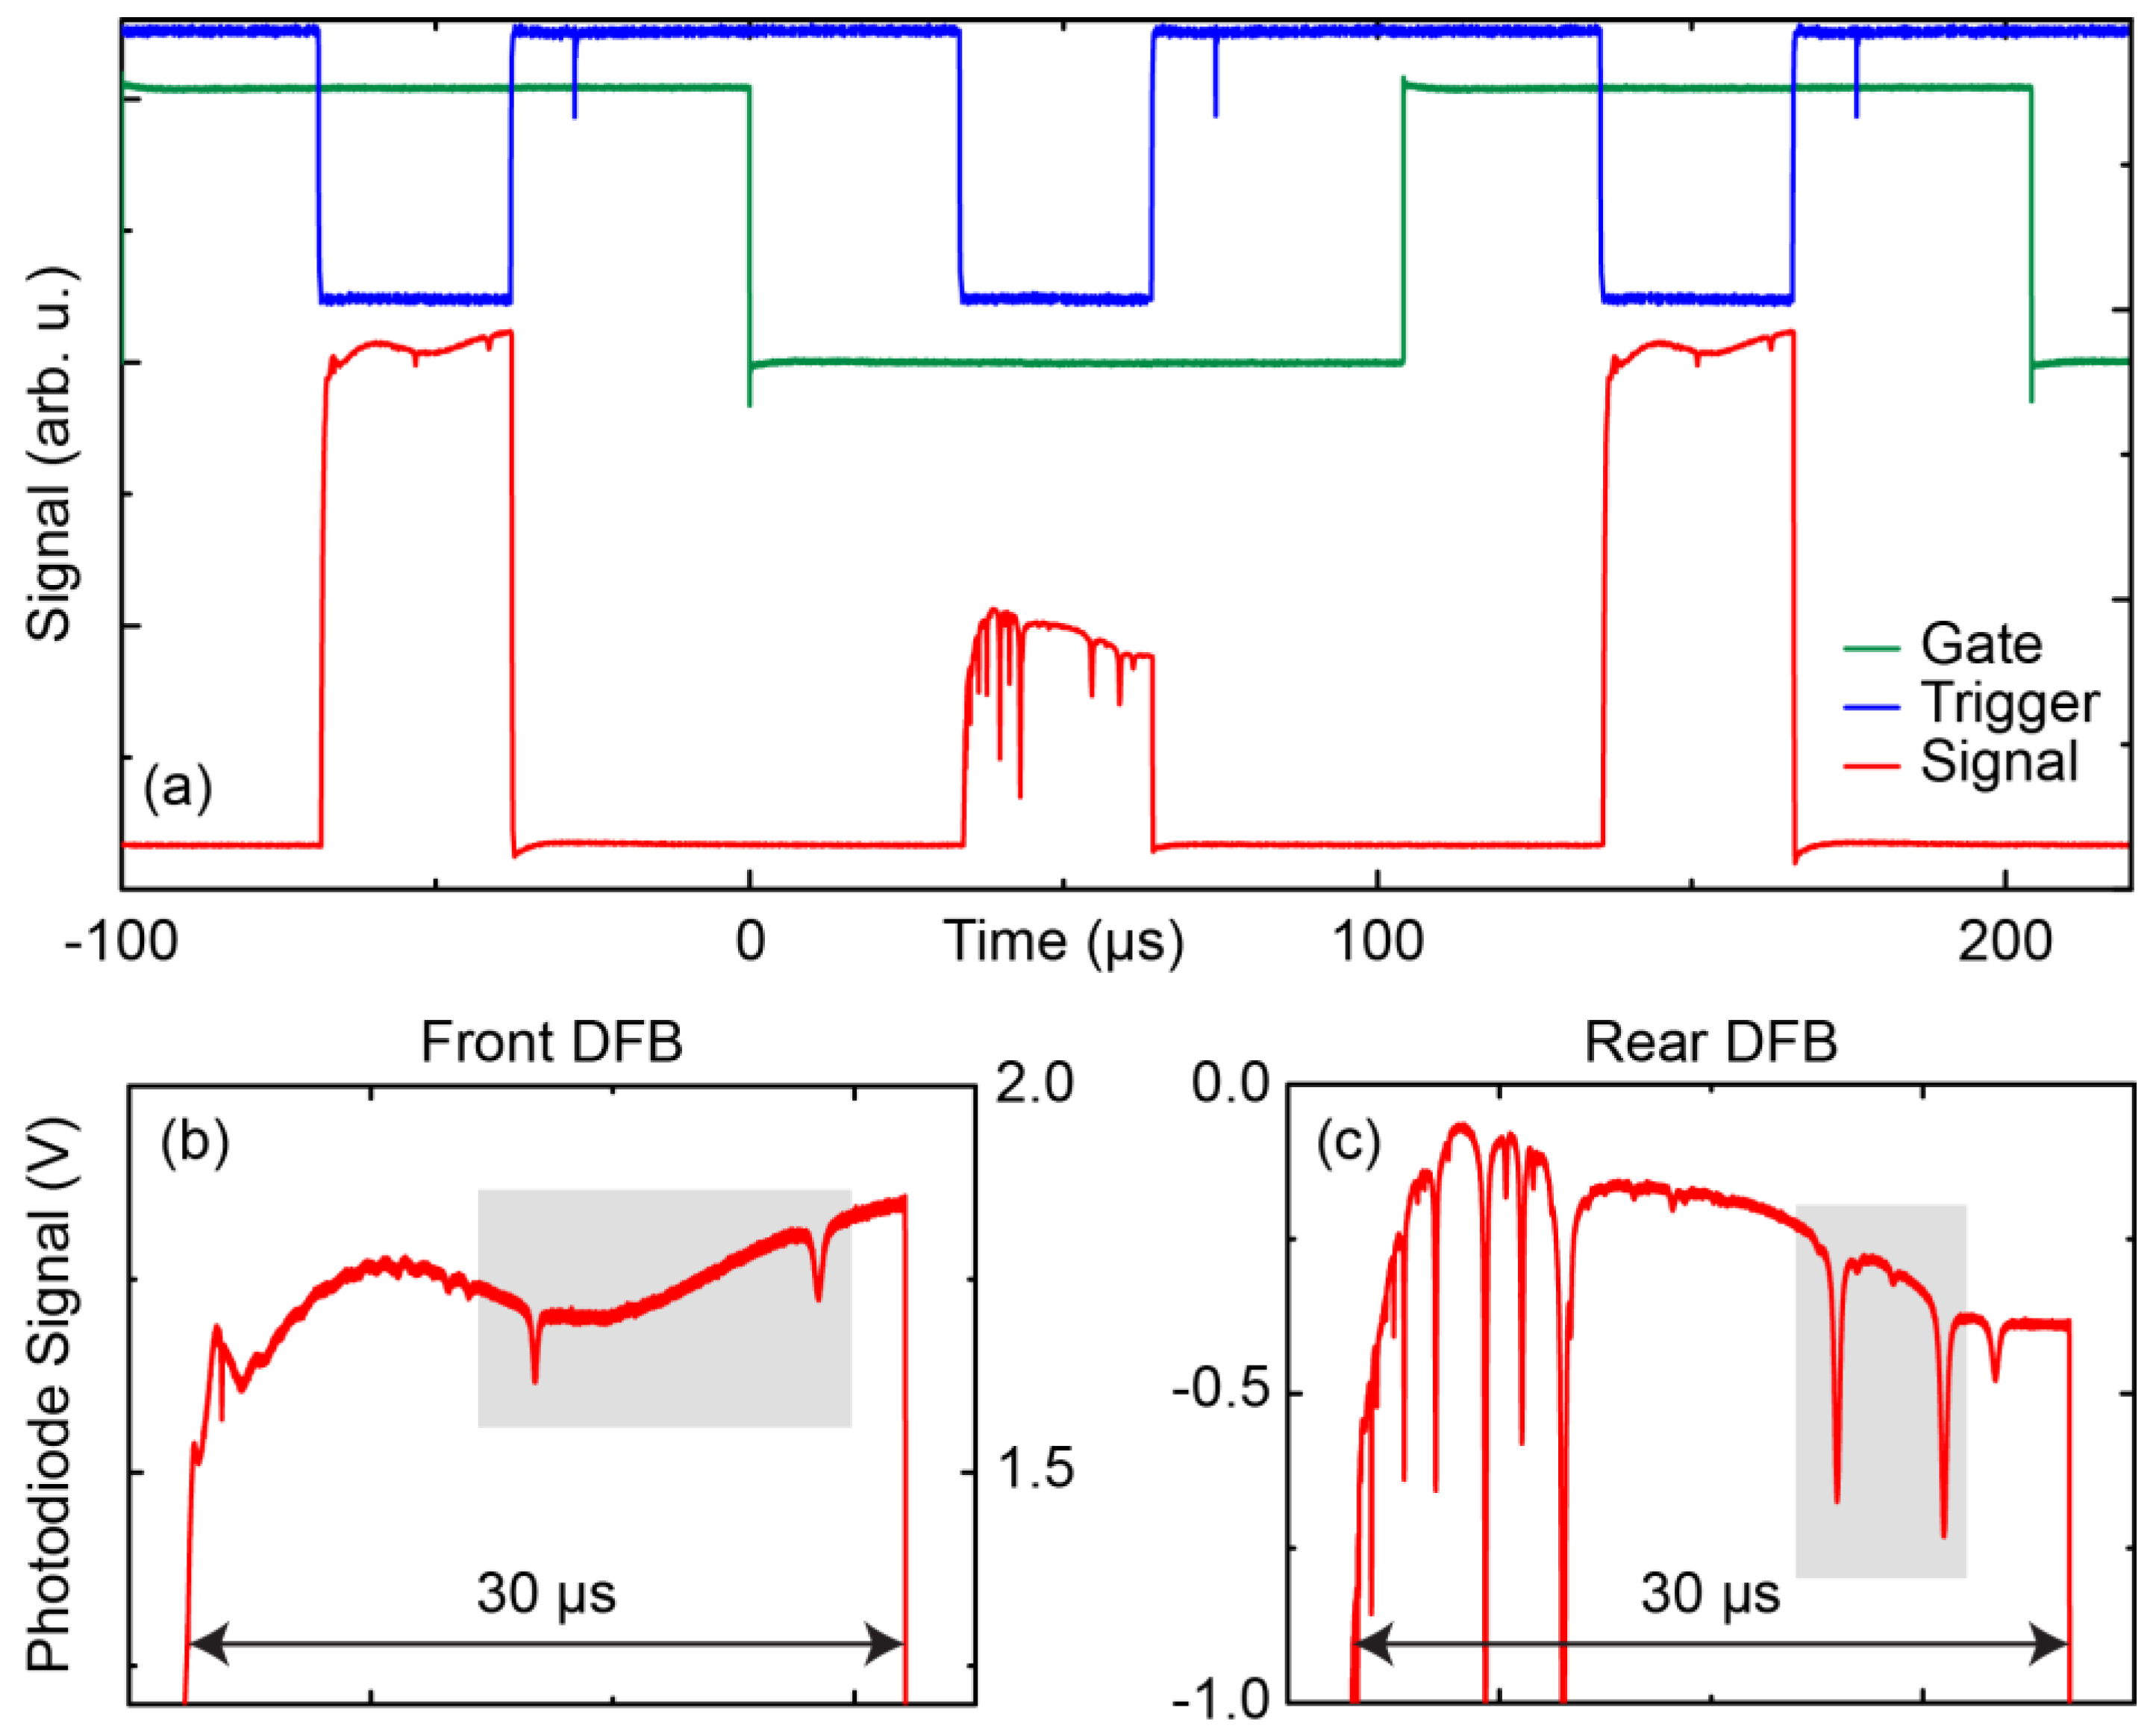
3.1. Laser Driving
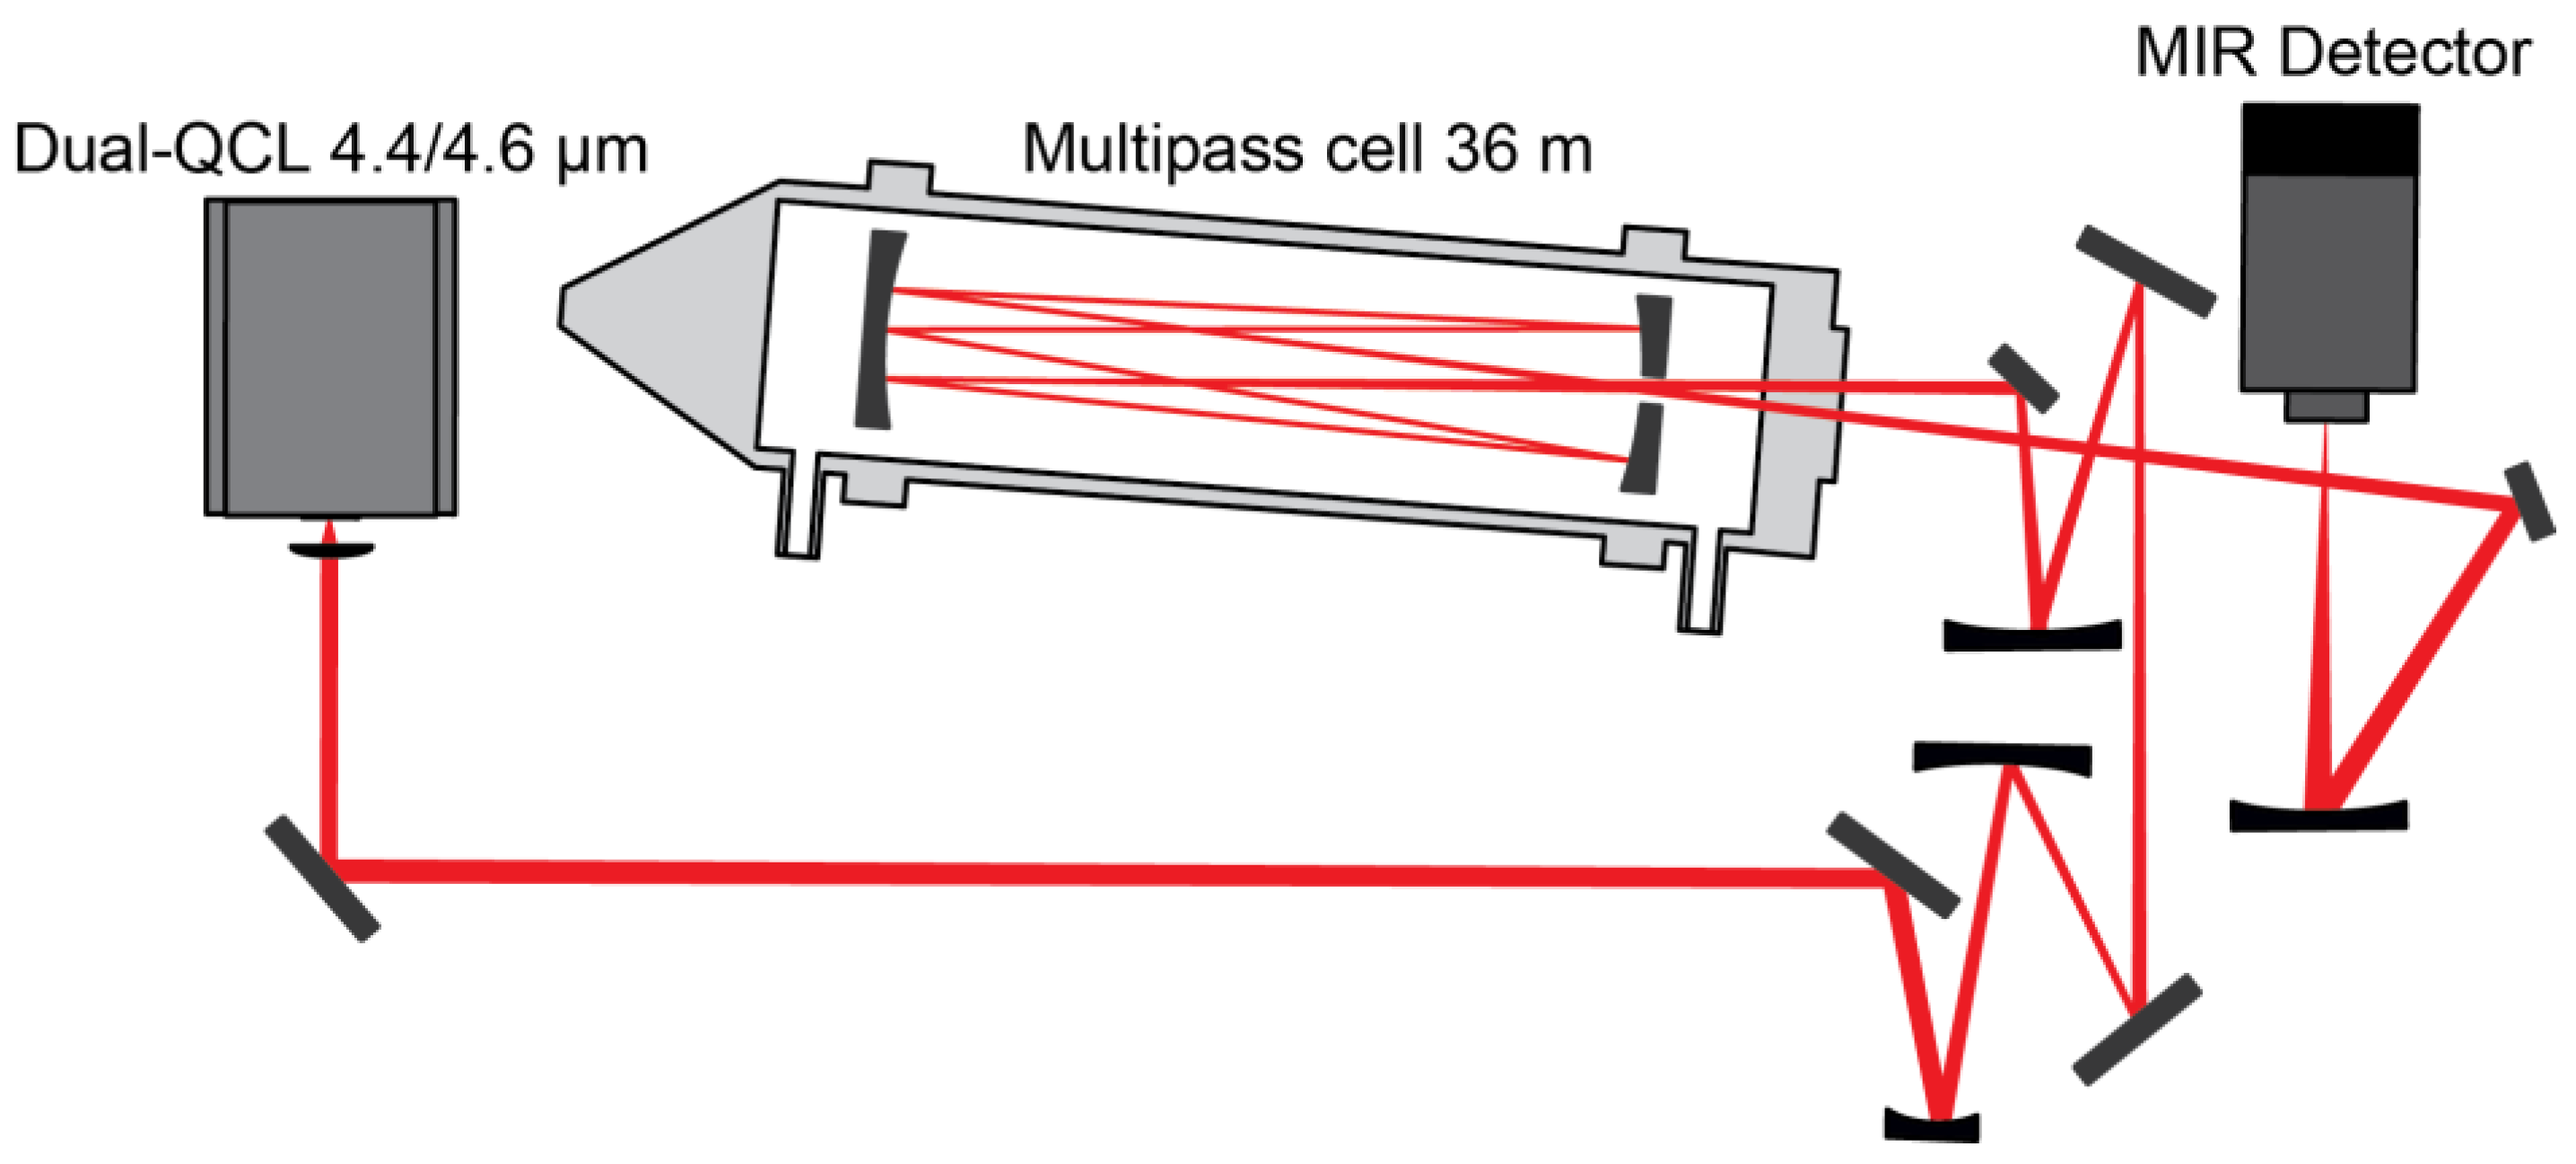
3.2. Optical Layout and Data Acquisition
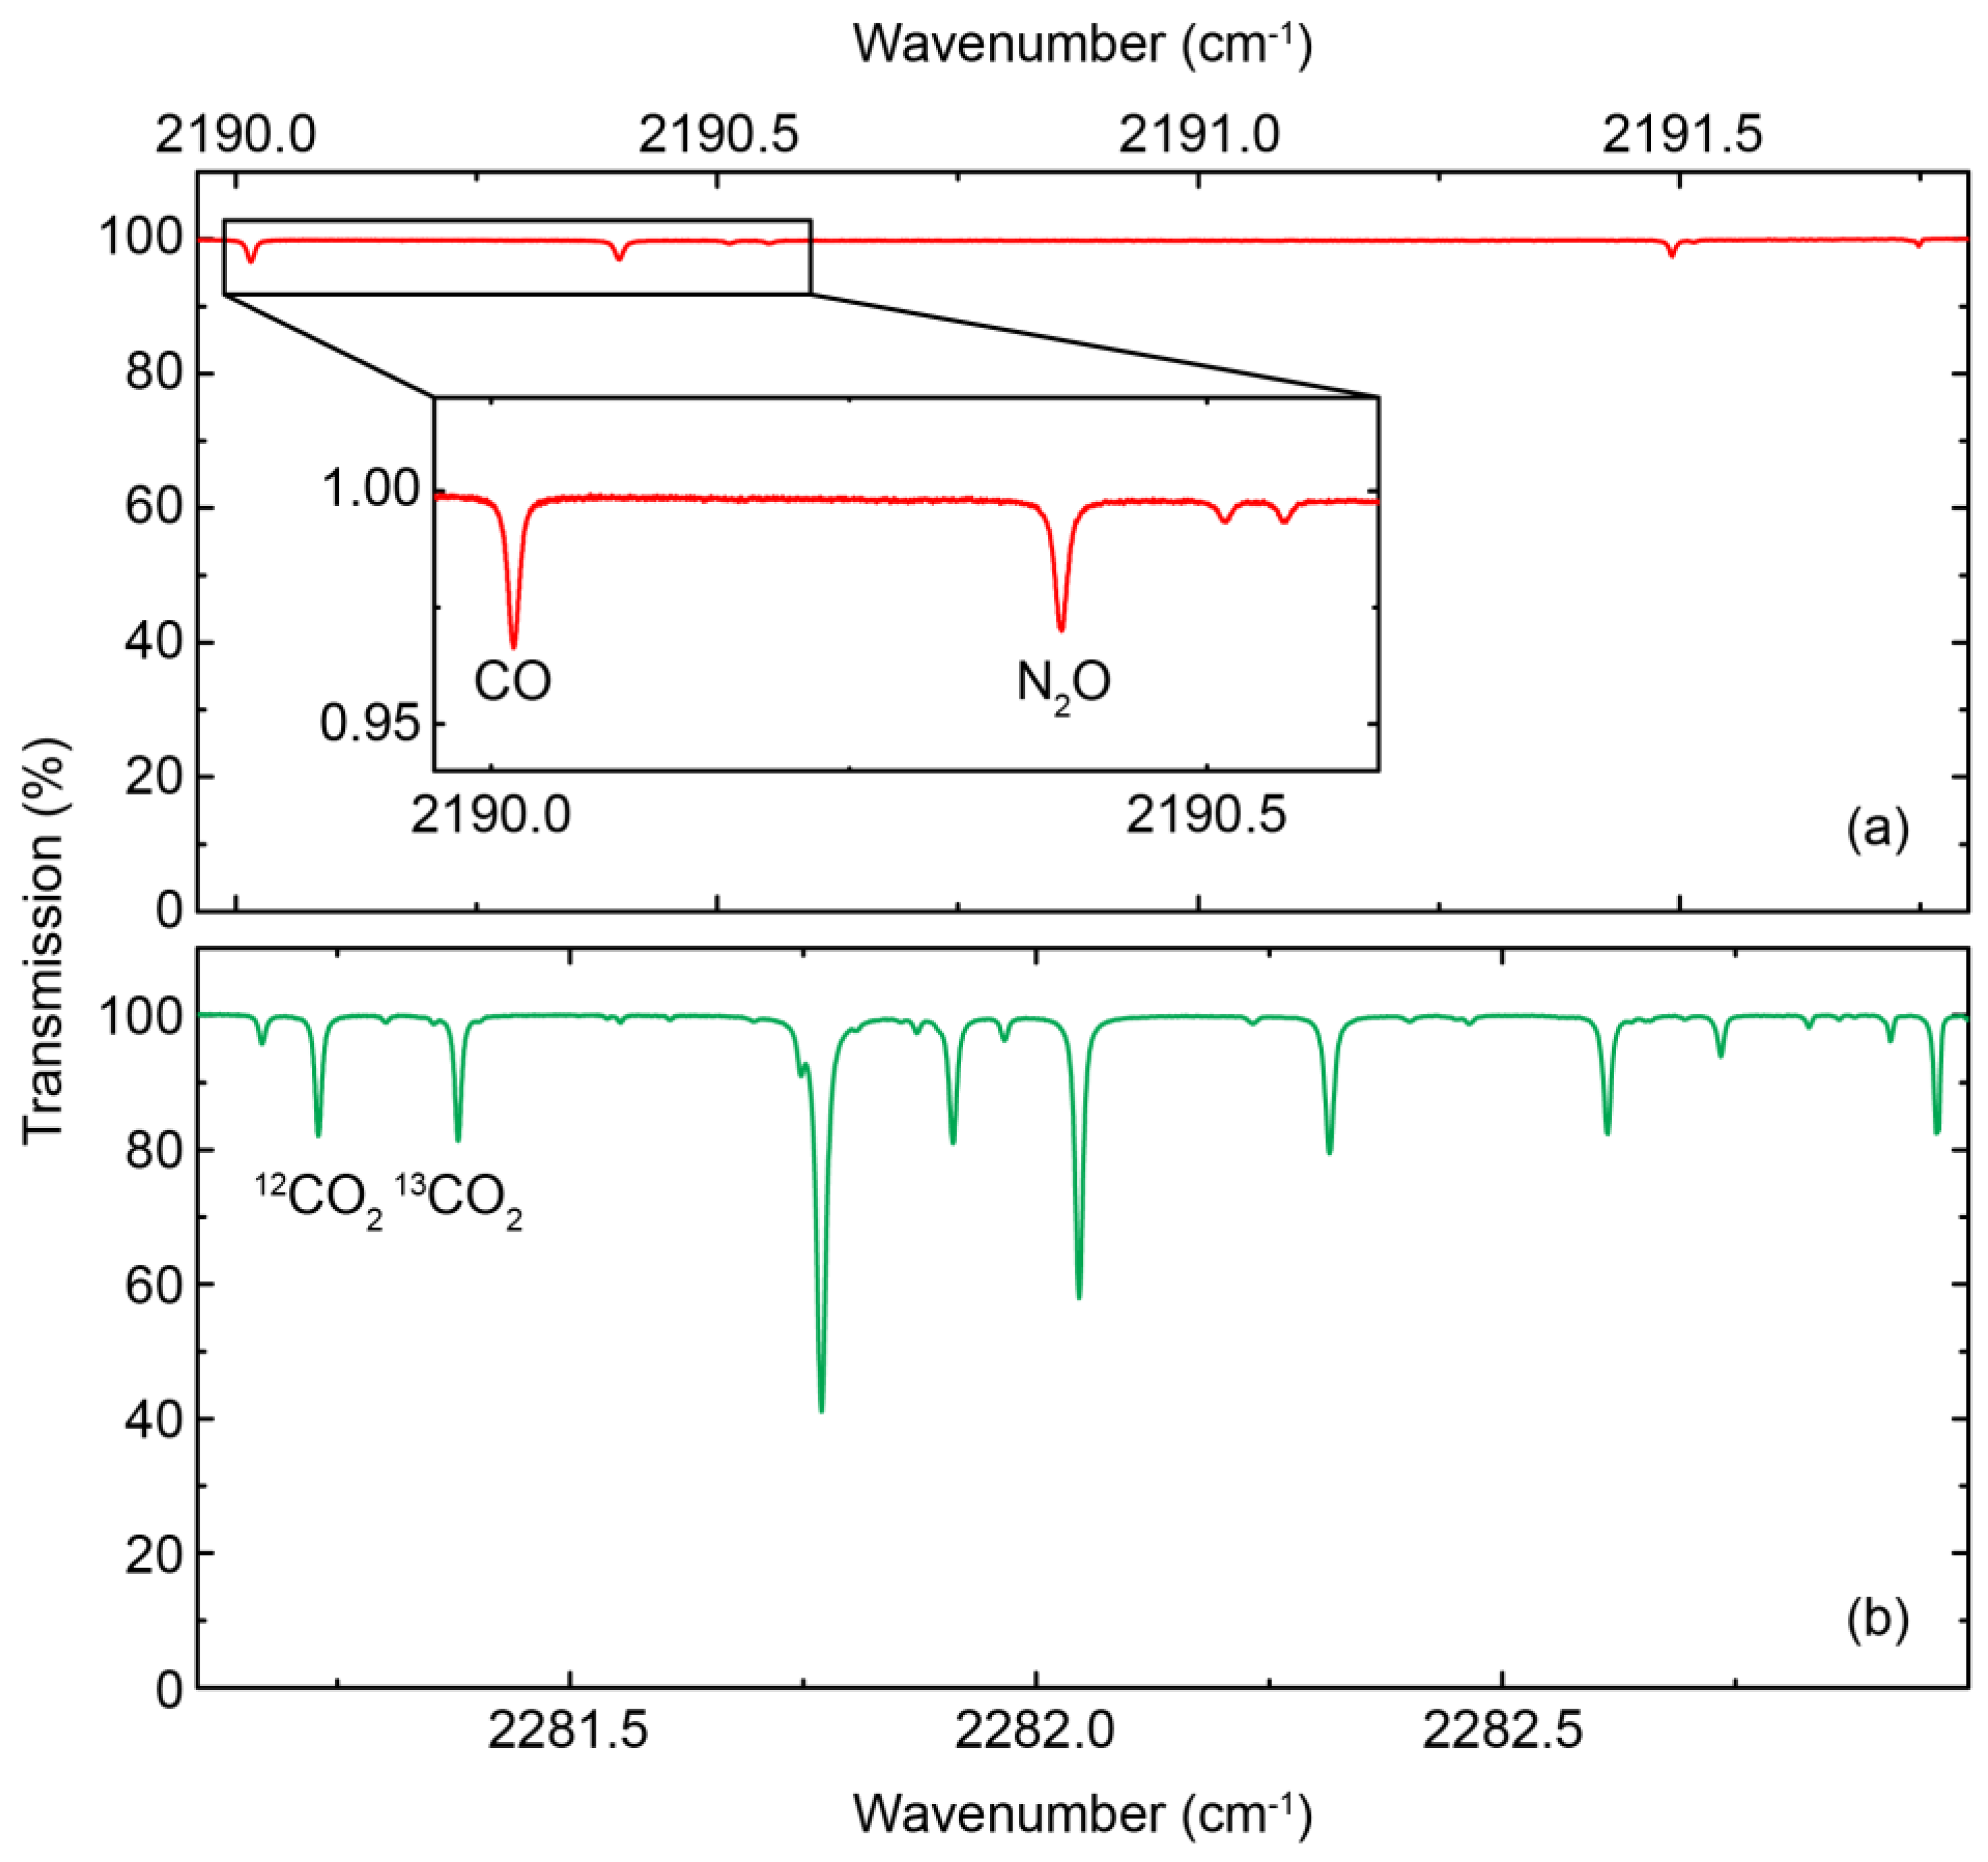
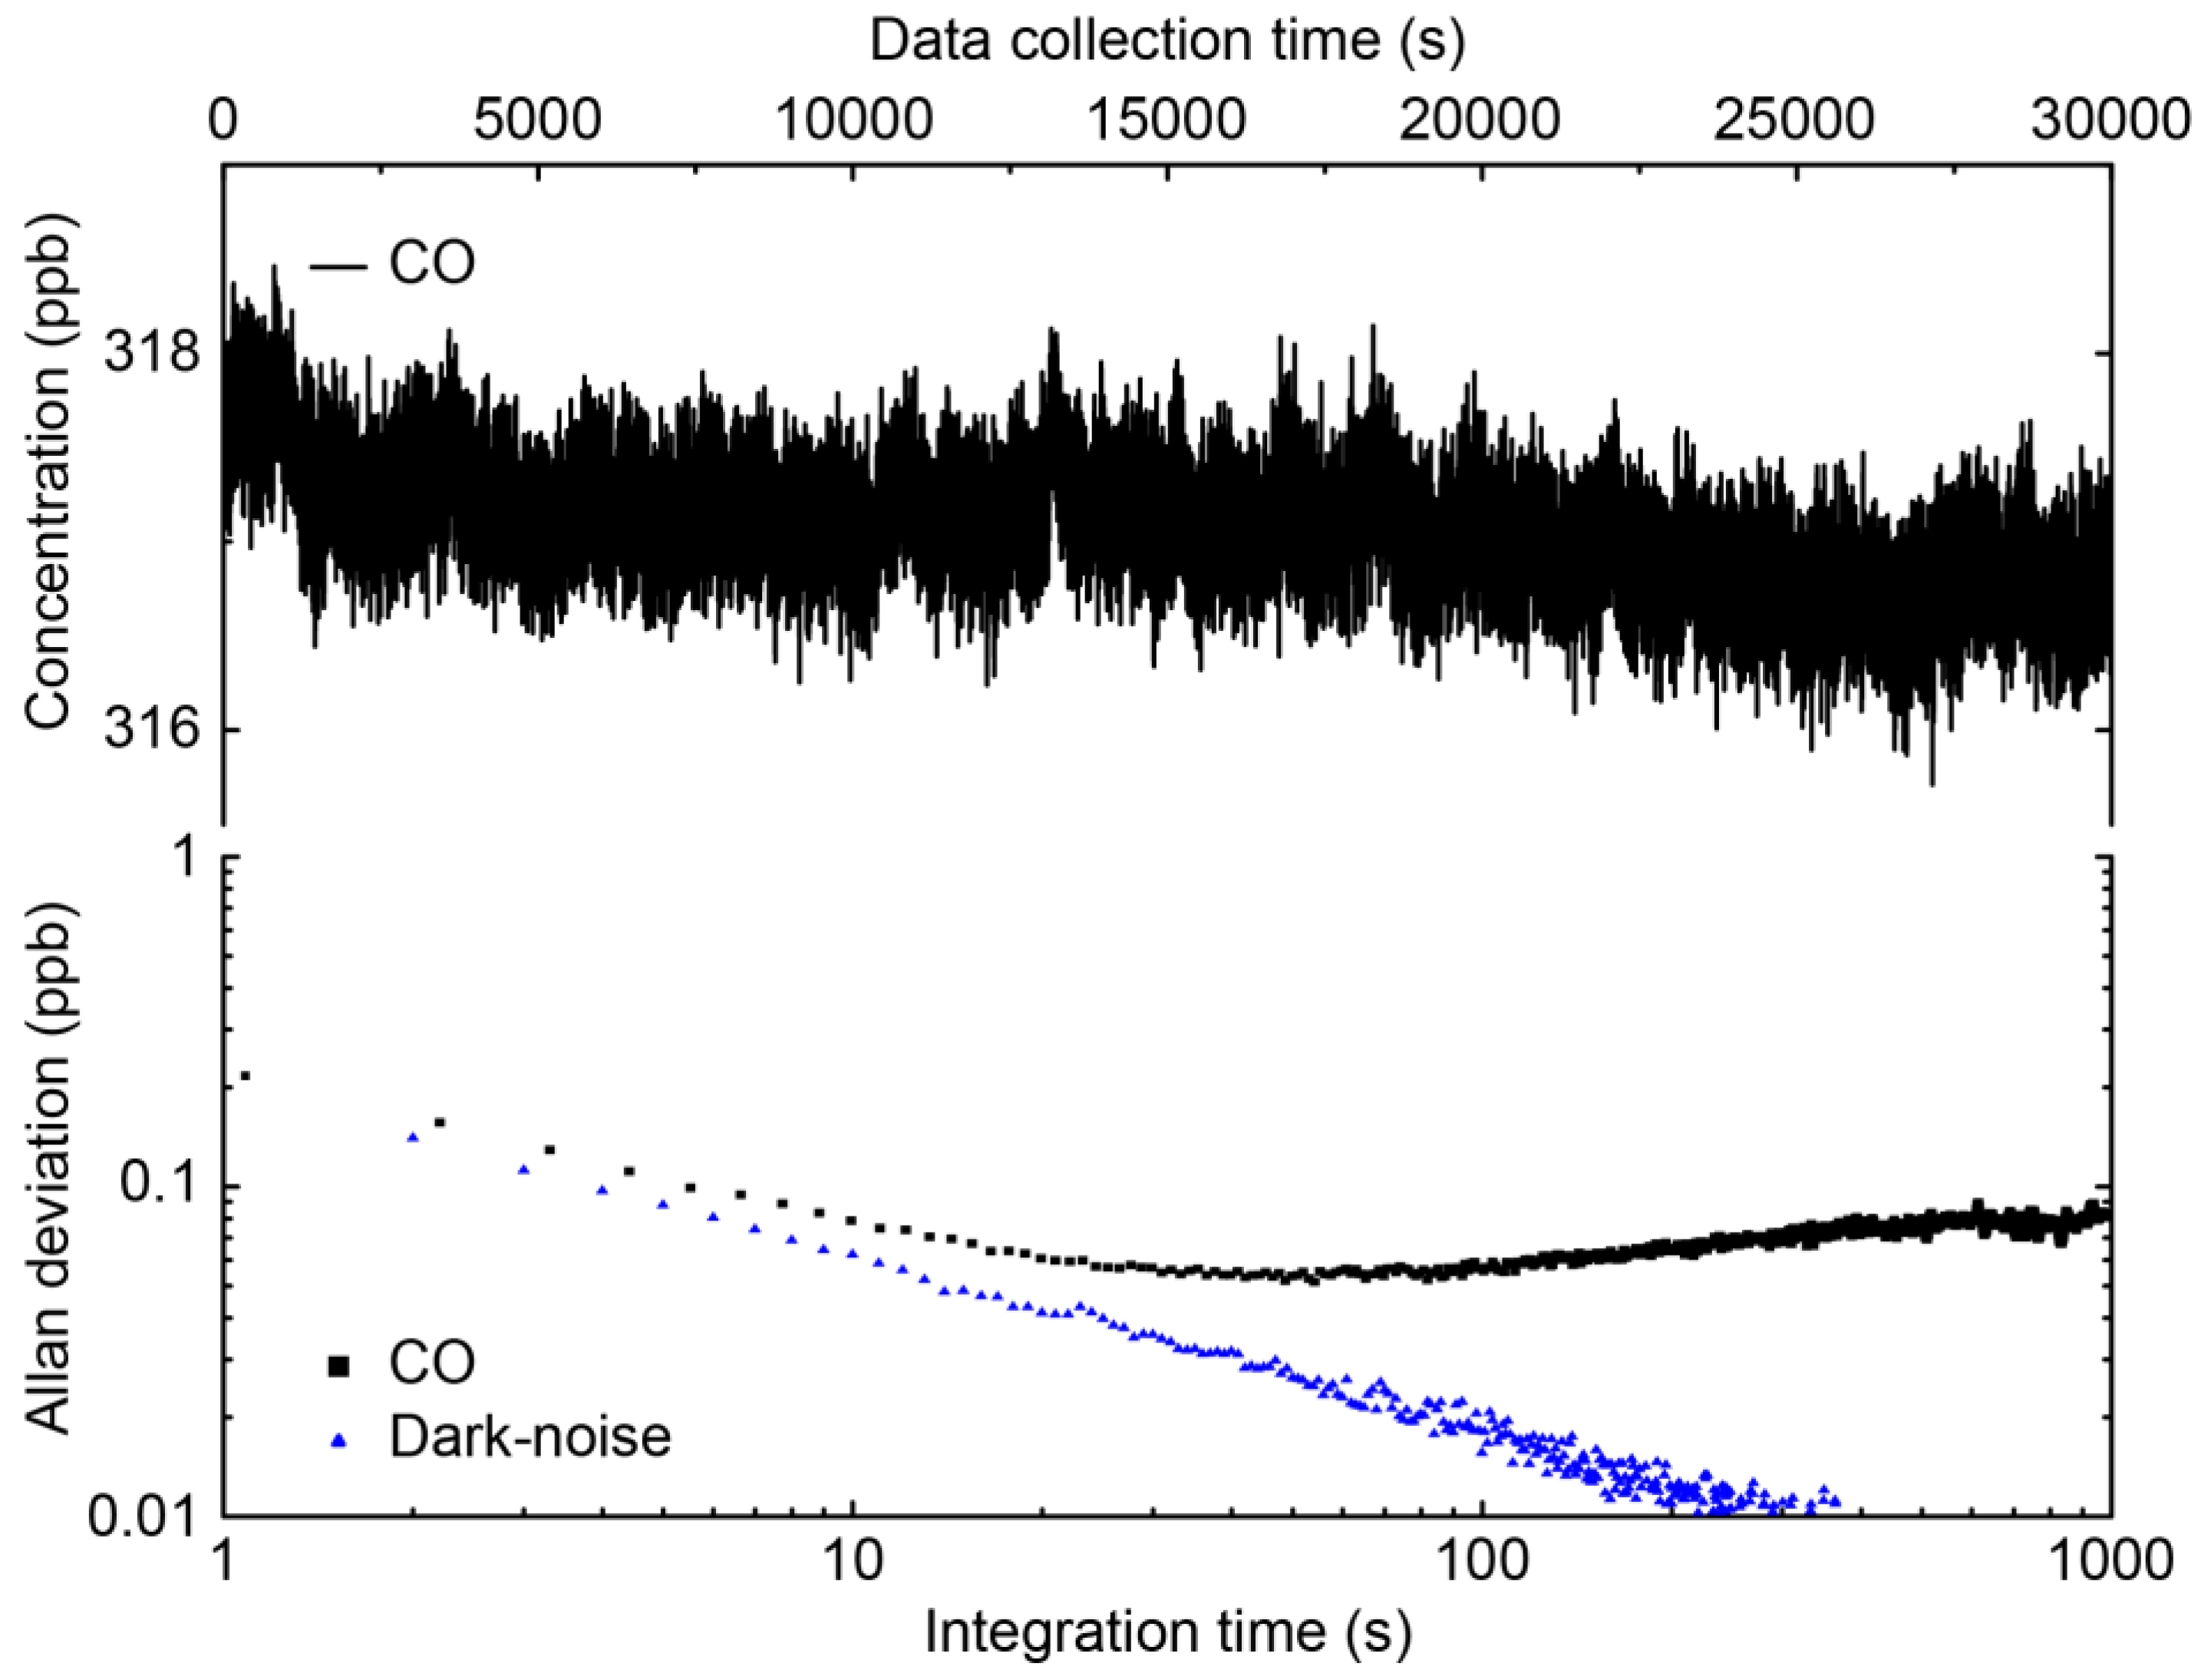
3.3. Spectroscopic Results and Discussion
4. Conclusions and Outlook
Acknowledgments
Author Contributions
Conflicts of Interest
Abbreviations
| CW | continuous wave |
| DFB | Distributed feedback |
| FEM | finite element methods |
| FIB | focused ion beam |
| HITRAN | high-resolution transmission |
| iCW | intermittent continuous wave |
| LIV | light-current-voltage |
| MCT | mercury cadmium telluride |
| MIR | mid-infrared |
| QCL | Quantum cascade laser |
| QWS | quarter wave shift |
| SEM | scanning electron microscope |
| SMSR | side mode suppression ratio |
| DTGS | deuterated triglycine sulphate |
| TMM | transfer matrix method |
| TTL | transistor-transistor-logic |
References
- Faist, J.; Capasso, F.; Sivco, D.L.; Sirtori, C.; Hutchinson, A.L.; Cho, A.Y. Quantum cascade laser. Science 1994, 264, 553–556. [Google Scholar] [CrossRef] [PubMed]
- Yao, Y.; Hoffman, A.J.; Gmachl, C.F. Mid-infrared quantum cascade lasers. Nat. Photon. 2012, 6, 432–439. [Google Scholar] [CrossRef]
- McManus, J.B.; Zahniser, M.S.; Nelson, D.D., Jr.; Shorter, J.H.; Herndon, S.; Wood, E.; Wehr, R. Application of quantum cascade lasers to high-precision atmospheric trace gas measurements. Opt. Eng. 2010, 49, 111124. [Google Scholar] [CrossRef]
- McManus, J.B.; Zahniser, M.S.; Nelson, D.D.; Shorter, J.H.; Herndon, S.C.; Jervis, D.; Agnese, M.; McGovern, R.; Yacovitch, T.I.; Roscioli, J.R. Recent progress in laser-based trace gas instruments: Performance and noise analysis. Appl. Phys. B 2015, 119, 203–218. [Google Scholar] [CrossRef]
- Faist, J. Quantum Cascade Lasers; OUP Oxford: Oxford, UK, 2013. [Google Scholar]
- Jouy, P.; Mangold, M.; Tuzson, B.; Emmenegger, L.; Chang, Y.-C.; Hvozdara, L.; Herzig, H.P.; Wagli, P.; Homsy, A.; de Rooij, N.F.; et al. Mid-infrared spectroscopy for gases and liquids based on quantum cascade technologies. Analyst 2014, 139, 2039–2046. [Google Scholar] [CrossRef] [PubMed]
- Vardag, S.N.; Gerbig, C.; Janssens-Maenhout, G.; Levin, I. Estimation of continuous anthropogenic CO2: Model-based evaluation of CO2, CO, δ13C(CO2) and δ14C(CO2) tracer methods. Atmos. Chem. Phys. 2015, 15, 12705–12729. [Google Scholar] [CrossRef]
- Tuzson, B.; Henne, S.; Brunner, D.; Steinbacher, M.; Mohn, J.; Buchmann, B.; Emmenegger, L. Continuous isotopic composition measurements of tropospheric CO2 at jungfraujoch (3580 m a.S.L.), Switzerland: Real-time observation of regional pollution events. Atmos. Chem. Phys. 2011, 11, 1685–1696. [Google Scholar] [CrossRef]
- Huebner, M.; Welzel, S.; Marinov, D.; Guaitella, O.; Glitsch, S.; Rousseau, A.; Roepcke, J. Triple Q: A three channel quantum cascade laser absorption spectrometer for fast multiple species concentration measurements. Rev. Sci. Instrum. 2011, 82, 093102. [Google Scholar] [CrossRef] [PubMed]
- Baren, R.E.; Parrish, M.E.; Shafer, K.H.; Harward, C.N.; Quan, S.; Nelson, D.D.; McManus, J.B.; Zahniser, M.S. Quad quantum cascade laser spectrometer with dual gas cells for the simultaneous analysis of mainstream and sidestream cigarette smoke. Spectrochim. Acta Part A Mol. Biomol. Spectrosc. 2004, 60, 3437–3447. [Google Scholar] [CrossRef] [PubMed]
- Gmachl, C.; Sivco, D.L.; Colombelli, R.; Capasso, F.; Cho, A.Y. Ultra-broadband semiconductor laser. Nature 2002, 415, 883–887. [Google Scholar] [CrossRef] [PubMed]
- Straub, A.; Gmachl, C.; Sivco, D.L.; Sergent, A.M.; Capasso, F.; Cho, A.Y. Simultaneously at two wavelengths (5.0 and 7.5 um) singlemode and tunable quantum cascade distributed feedback lasers. Electron. Lett. 2002, 38, 565–567. [Google Scholar] [CrossRef]
- Jagerska, J.; Jouy, P.; Hugi, A.; Tuzson, B.; Looser, H.; Mangold, M.; Beck, M.; Emmenegger, L.; Faist, J. Dual-wavelength quantum cascade laser for trace gas spectroscopy. Appl. Phys. Lett. 2014, 105, 161109. [Google Scholar] [CrossRef]
- Jagerska, J.; Jouy, P.; Tuzson, B.; Looser, H.; Mangold, M.; Soltic, P.; Hugi, A.; Broennimann, R.; Faist, J.; Emmenegger, L. Simultaneous measurement of NO and NO2 by dual-wavelength quantum cascade laser spectroscopy. Opt. Express 2015, 23, 1512–1522. [Google Scholar] [CrossRef] [PubMed]
- Fischer, M.; Tuzson, B.; Hugi, A.; Broennimann, R.; Kunz, A.; Blaser, S.; Rochat, M.; Landry, O.; Mueller, A.; Emmenegger, L. Intermittent operation of QC-lasers for mid-IR spectroscopy with low heat dissipation: Tuning characteristics and driving electronics. Opt. Express 2014, 22, 7014–7027. [Google Scholar] [CrossRef]
- Beck, M.; Hofstetter, D.; Aellen, T.; Faist, J.; Oesterle, U.; Ilegems, M.; Gini, E.; Melchior, H. Continuous wave operation of a mid-infrared semiconductor laser at room temperature. Science 2002, 295, 301–305. [Google Scholar]
- Bismuto, A. Mid-Infrared Quantum Cacade Lasers; ETH Zürich: Zürich, Switzerland, 2011. [Google Scholar]
- Levinsthein, M.; Rumyantsev, S.; Suhr, M. Handbook Series on Semiconductor Parameters; World Scientific: London, UK, 1996. [Google Scholar]
- Tipler, P.A. Physics for Scientists and Engineers, 6th ed.; W.H. Freeman and Company: New York, NY, USA, 2008. [Google Scholar]
- Bilek, J.; Atkinson, J.K.; Wakeham, W.A. Thermal conductivity of molten lead-free solders. Int. J. Thermophys. 2006, 27, 92–102. [Google Scholar]
- Dinwiddie, R.B.; Whittaker, A.J.; Onn, D.G. Thermal conductivity, heat capacity, and thermal diffusivity of selected commercial aln substrates. Int. J. Thermophys. 1989, 10, 1075–1084. [Google Scholar]
- Nelder, J.A.; Mead, R. A simplex method for function minimization. Comput. J. 1965, 7, 308–313. [Google Scholar] [CrossRef]
- Wittmann, A.; Bonetti, Y.; Fischer, M.; Faist, J.; Blaser, S.; Gini, E. Distributed-feedback quantum-cascade lasers at 9 um operating in continuous wave up to 423 k. IEEE Photon. Technol. Lett. 2009, 21, 814–816. [Google Scholar] [CrossRef]
- Gmachl, C.; Straub, A.; Colombelli, R.; Capasso, F.; Sivco, D.L.; Sergent, A.M.; Cho, A.Y. Single-mode, tunable distributed-feedback and multiple-wavelength quantum cascade lasers. IEEE J. Quantum Electron. 2002, 38, 569–581. [Google Scholar] [CrossRef]
- Coldren, L.A.; Corzine, S.; Masnovic, M.L. Diode Lasers and Photonic Integrated Circuits, 2nd ed.; Wiley: Hoboken, NJ, USA, 2012. [Google Scholar]
- Bidaux, Y.; Bismuto, A.; Tardy, C.; Terazzi, R.; Gresch, T.; Blaser, S.; Muller, A.; Faist, J. Extended and quasi-continuous tuning of quantum cascade lasers using superstructure gratings and integrated heaters. Appl. Phys. Lett. 2015, 107, 221108. [Google Scholar] [CrossRef]
- Slivken, S.; Bandyopadhyay, N.; Tsao, S.; Nida, S.; Bai, Y.; Lu, Q.Y.; Razeghi, M. Sampled grating, distributed feedback quantum cascade lasers with broad tunability and continuous operation at room temperature. Appl. Phys. Lett. 2012, 100, 261112. [Google Scholar] [CrossRef]
- Bismuto, A.; Bidaux, Y.; Tardy, C.; Terazzi, R.; Gresch, T.; Wolf, J.; Blaser, S.; Muller, A.; Faist, J. Extended tuning of mid-IR quantum cascade lasers using integrated resistive heaters. Opt. Express 2015, 23, 29715–29722. [Google Scholar] [CrossRef] [PubMed]
- Rothman, L.S.; Gordon, I.E.; Babikov, Y.; Barbe, A.; Chris Benner, D.; Bernath, P.F.; Birk, M.; Bizzocchi, L.; Boudon, V.; Brown, L.R.; et al. The HITRAN 2012 molecular spectroscopic database. J. Quant. Spectrosc. Radiat. Transf. 2013, 130, 4–50. [Google Scholar] [CrossRef]
- Werle, P.; Mücke, R.; Slemr, F. The limits of signal averaging in atmospheric trace-gas monitoring by tunable diode-laser absorption spectroscopy (TDLAS). Appl. Phys. B 1993, 57, 131–139. [Google Scholar] [CrossRef]


| Material | ρ [g·cm−3] 1 | κ [W·m−1·K−1] 2 | Cp [J·g−1·K−1] 3 | References |
|---|---|---|---|---|
| AR 4 | 5.5 | 2.5/8 5 | 0.3 | [5,18] |
| InP | 4.81 | 68 | 0.31 | [18] |
| Au | 19.3 | 318 | 0.129 | [19] |
| AuSn | 14.51 | 58 | 0.15 | [20] |
| AlN | 3.3 | 67 | 0.72 | [21] |
| Species | 1 s Noise | 60 s Noise | 1 s Abs. Noise |
|---|---|---|---|
| CO | 0.22 ppb | 0.055 ppb | 1.8 × 10⁻⁵ |
| N2O | 0.26 ppb | 0.042 ppb | 2.3 × 10⁻⁵ |
| CO2 | 0.16 ppm | 0.075 ppm | 7 × 10⁻⁵ |
| 13CO2/12CO2 | 0.6‰ | 0.2‰ | - |
© 2016 by the authors; licensee MDPI, Basel, Switzerland. This article is an open access article distributed under the terms and conditions of the Creative Commons Attribution (CC-BY) license (http://creativecommons.org/licenses/by/4.0/).
Share and Cite
Süess, M.J.; Hundt, P.M.; Tuzson, B.; Riedi, S.; Wolf, J.M.; Peretti, R.; Beck, M.; Looser, H.; Emmenegger, L.; Faist, J. Dual-Section DFB-QCLs for Multi-Species Trace Gas Analysis. Photonics 2016, 3, 24. https://doi.org/10.3390/photonics3020024
Süess MJ, Hundt PM, Tuzson B, Riedi S, Wolf JM, Peretti R, Beck M, Looser H, Emmenegger L, Faist J. Dual-Section DFB-QCLs for Multi-Species Trace Gas Analysis. Photonics. 2016; 3(2):24. https://doi.org/10.3390/photonics3020024
Chicago/Turabian StyleSüess, Martin J., P. Morten Hundt, Béla Tuzson, Sabine Riedi, Johanna M. Wolf, Romain Peretti, Mattias Beck, Herbert Looser, Lukas Emmenegger, and Jérôme Faist. 2016. "Dual-Section DFB-QCLs for Multi-Species Trace Gas Analysis" Photonics 3, no. 2: 24. https://doi.org/10.3390/photonics3020024
APA StyleSüess, M. J., Hundt, P. M., Tuzson, B., Riedi, S., Wolf, J. M., Peretti, R., Beck, M., Looser, H., Emmenegger, L., & Faist, J. (2016). Dual-Section DFB-QCLs for Multi-Species Trace Gas Analysis. Photonics, 3(2), 24. https://doi.org/10.3390/photonics3020024