4.1. Effect of Spectral Simulation Accuracy on Half-Peak Width and Peak Interval of Peak Spectrum of Unit Spectrum Segment
According to the principle of spectral synthesis, the more unit spectrum segments participate in the simulation (the higher the
number) and the higher the adjustment range of the radiation system (the larger the numerical value of
), the higher the simulation accuracy and modulation capability of the spectrum [
22,
23]; however, more
s means that the system has higher requirements for spectral resolution; thus, the complexity of the system will be higher [
10,
11,
24], which is not conducive to system design. Therefore, starting from the spectral half-peak width and peak interval, combined with the principle of spectral superposition, an analysis of how they would affect the spectral simulation accuracy is necessary.
Using the Gaussian distribution model to simulate the element spectrum , the same can be expressed as:
Here is the peak wavelength; is the scale coefficient; and is the spectral half-peak width coefficient. By setting different values for and , different peak intervals and were simulated and analyzed to explore how they would affect the spectral simulation accuracy.
values of 10, 20, and 50 nm, and wavelength peak intervals () of 5, 10, and 20 nm were considered to simulate the three color temperatures of 3000, 6000, and 9000 K. Finally, the target and simulation spectra were normalized and analyzed.
- (1)
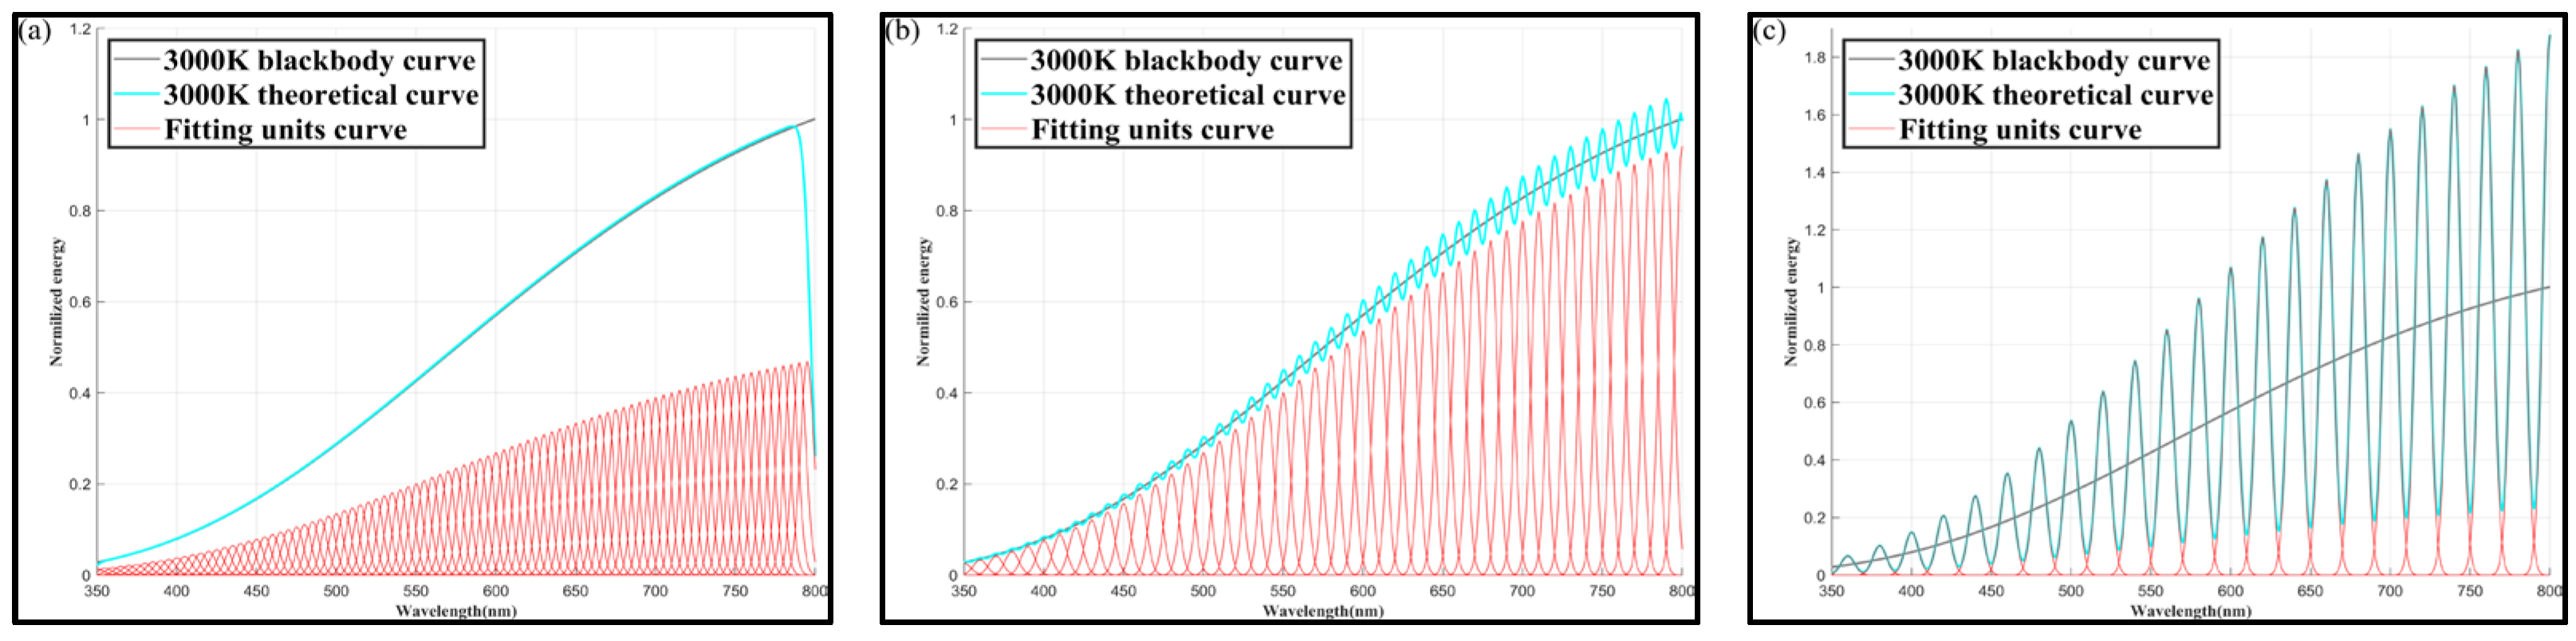
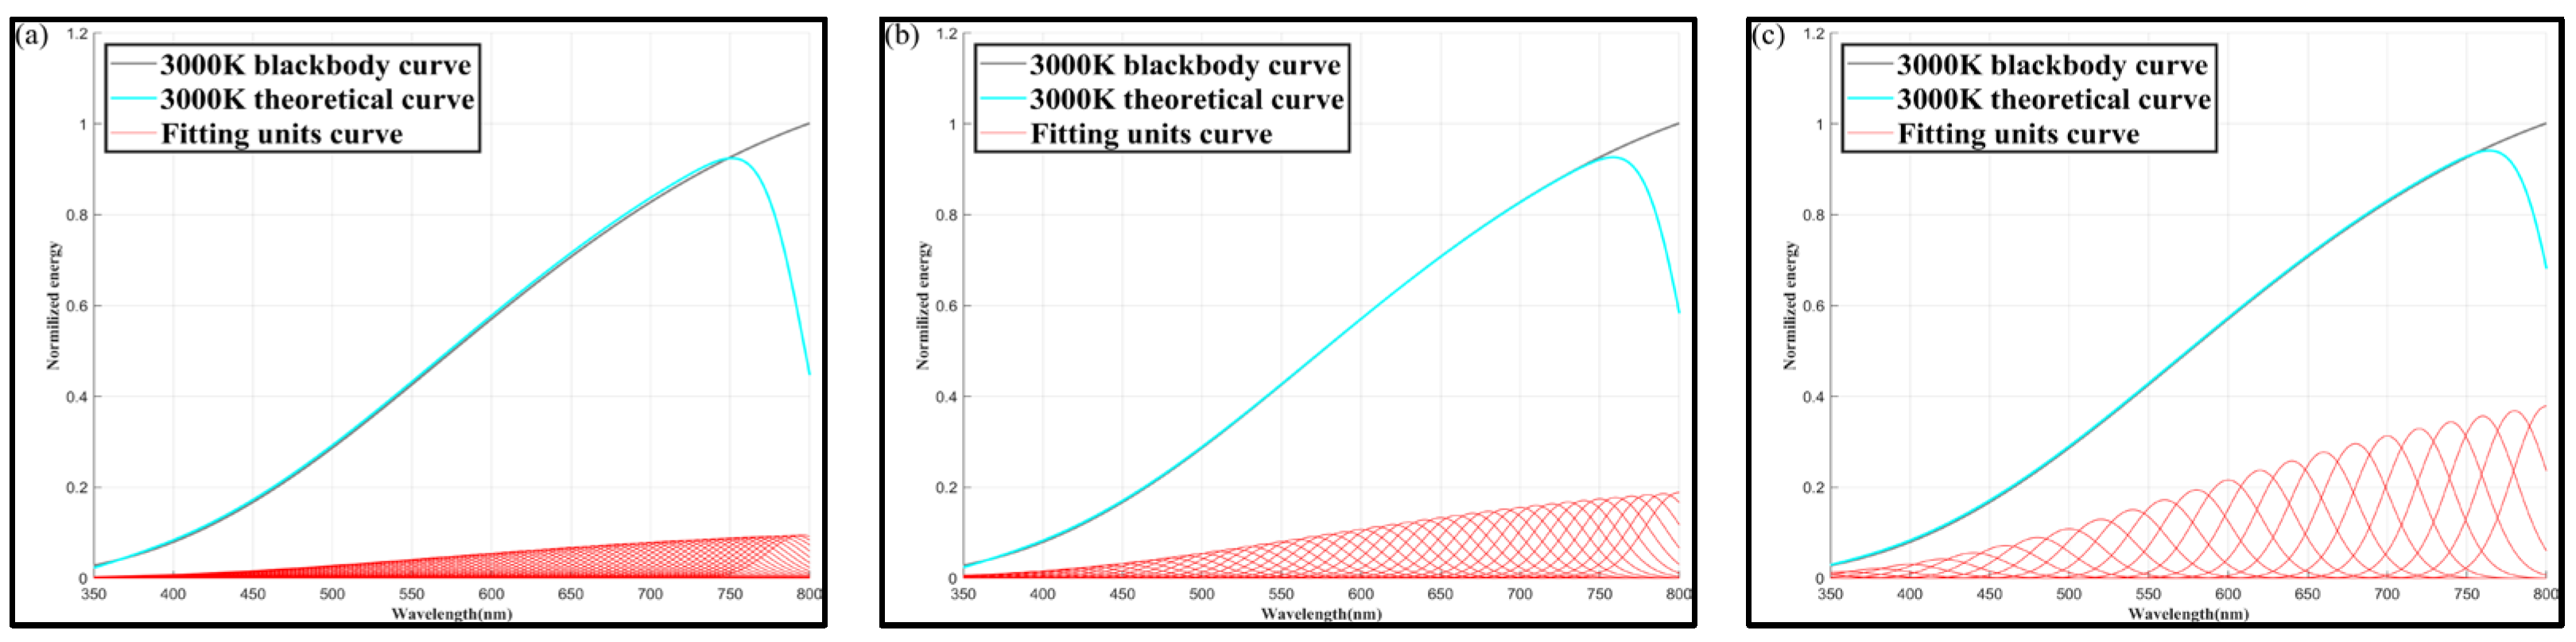
Simulation results for 3000 K color temperature:
➀
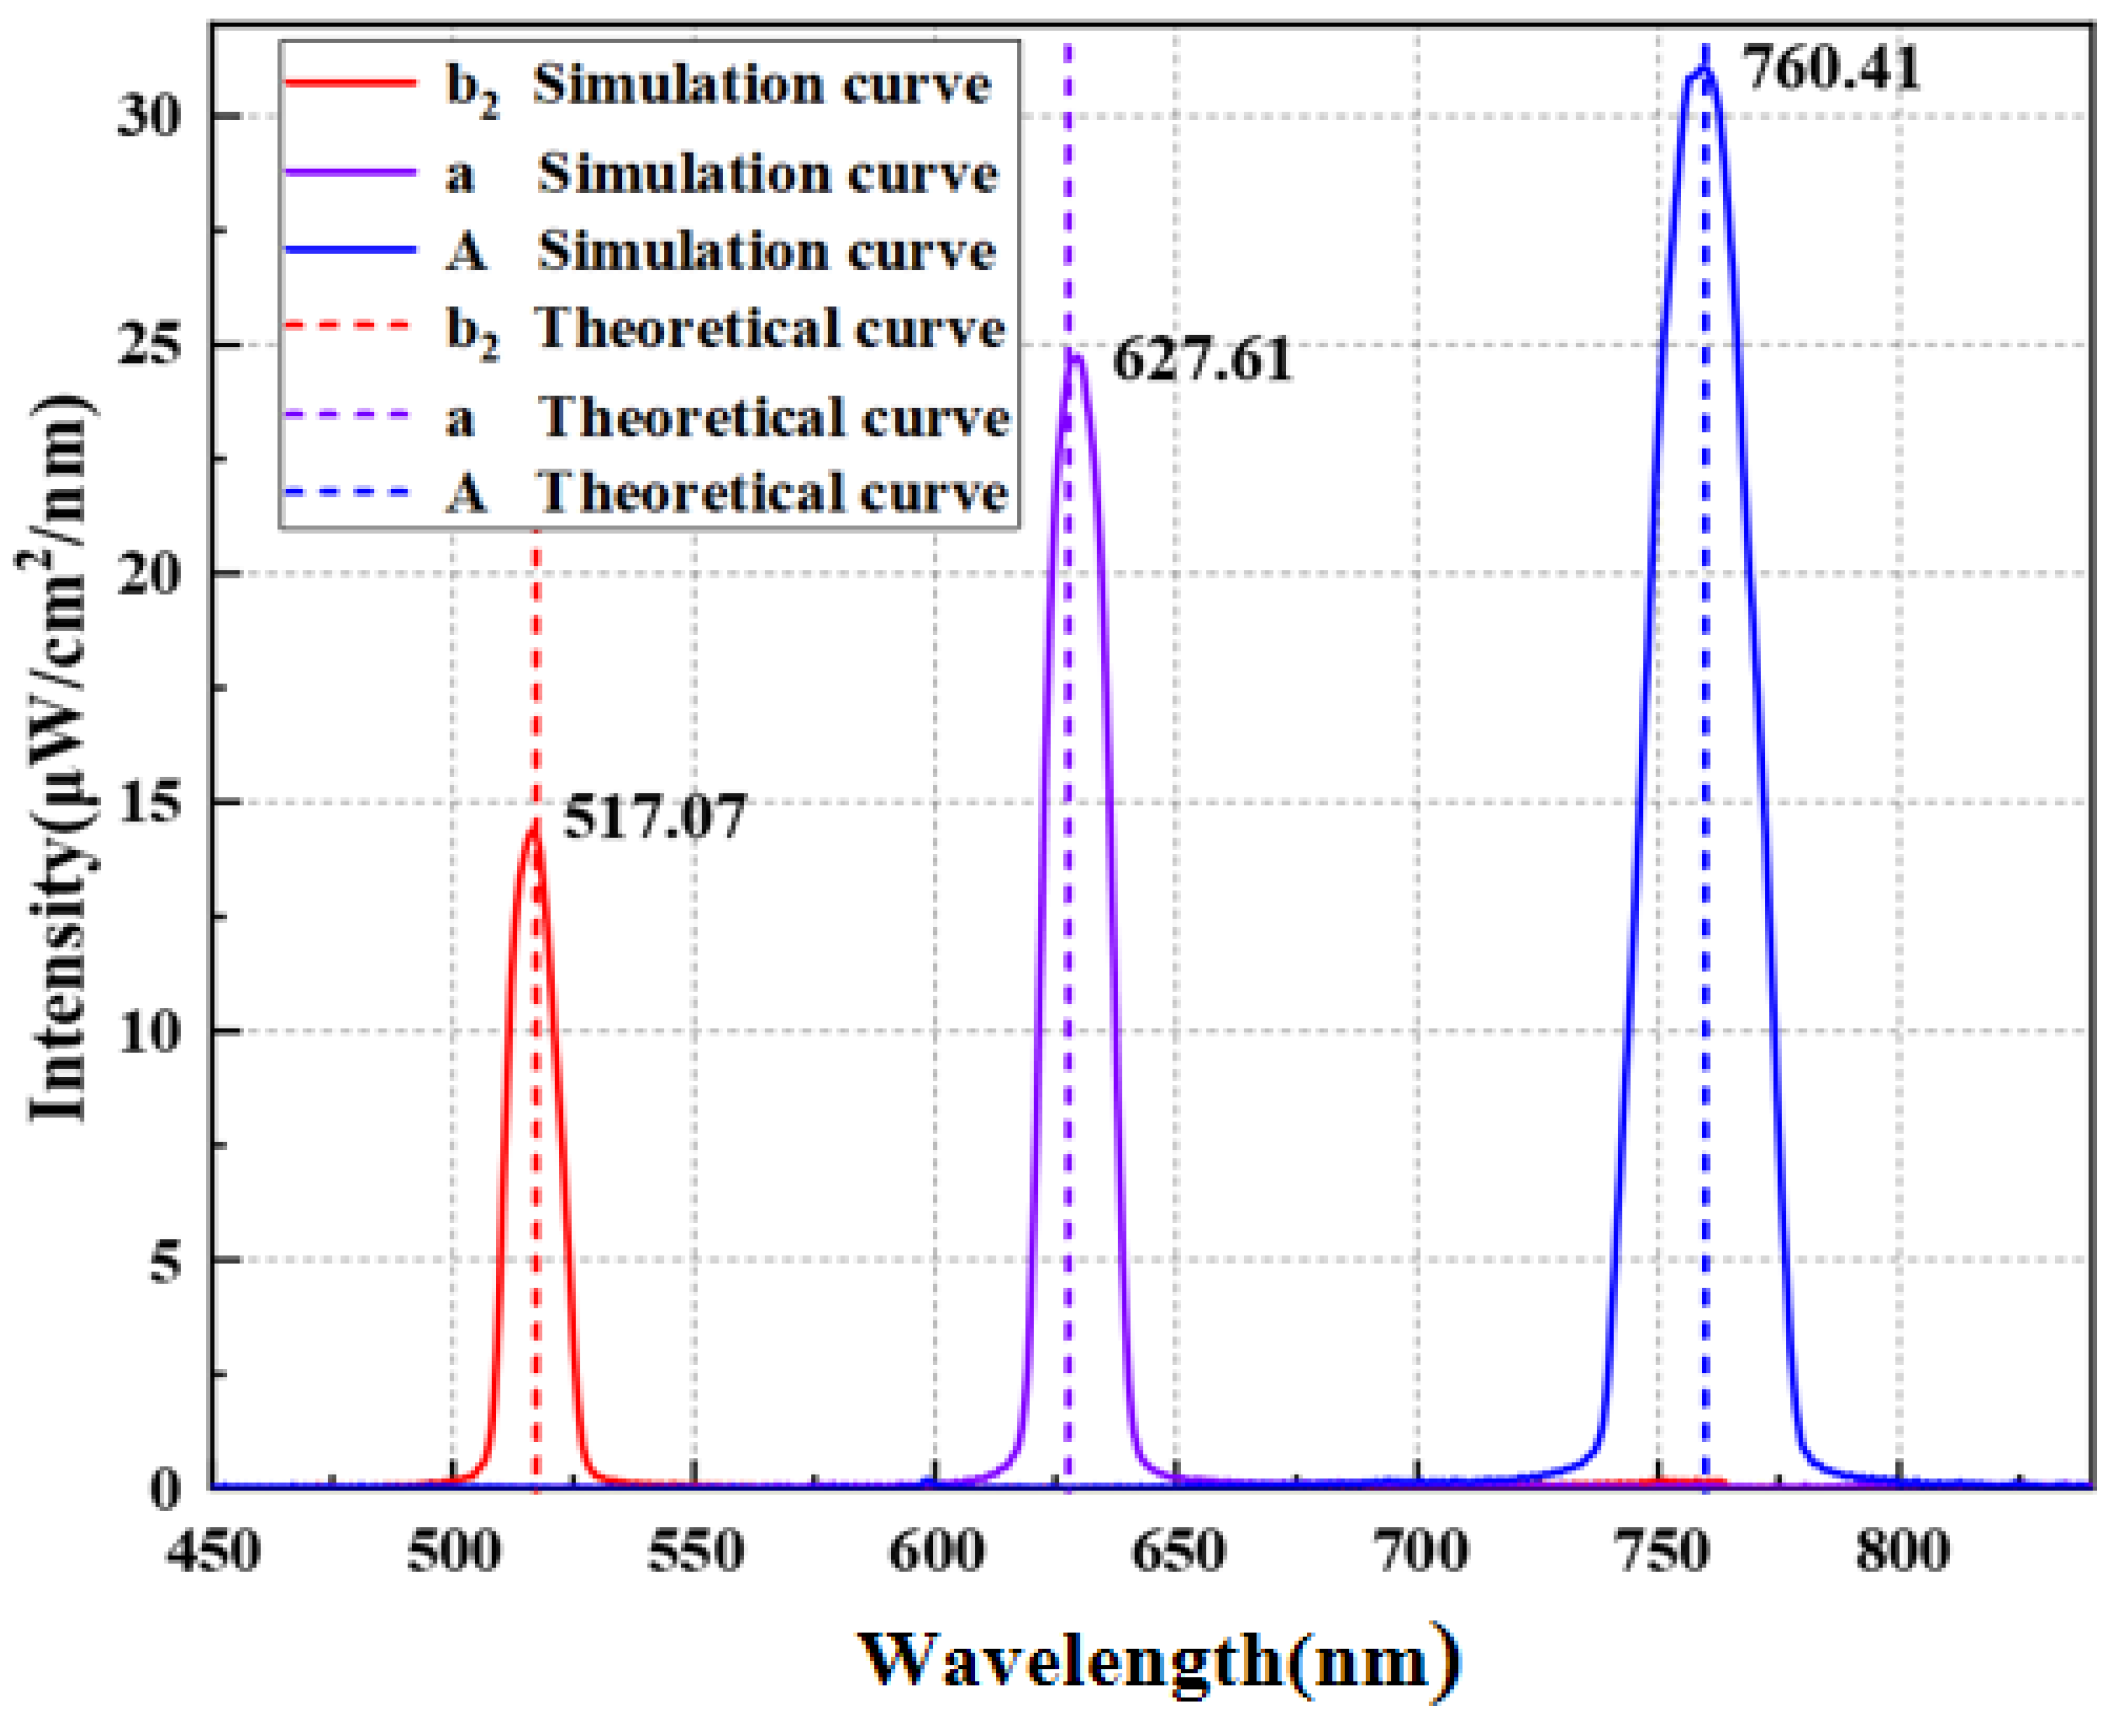
Figure 6 shows the color temperature simulation results at
= 10 nm, for
values of 5, 10, and 20 nm.
➁
Figure 7 shows the color temperature simulation results at
= 20 nm, for
values of 5, 10, and 20 nm.
➂
Figure 8 shows color temperature simulation results at
= 50 nm, for
values of 5, 10, and 20 nm.
- (2)
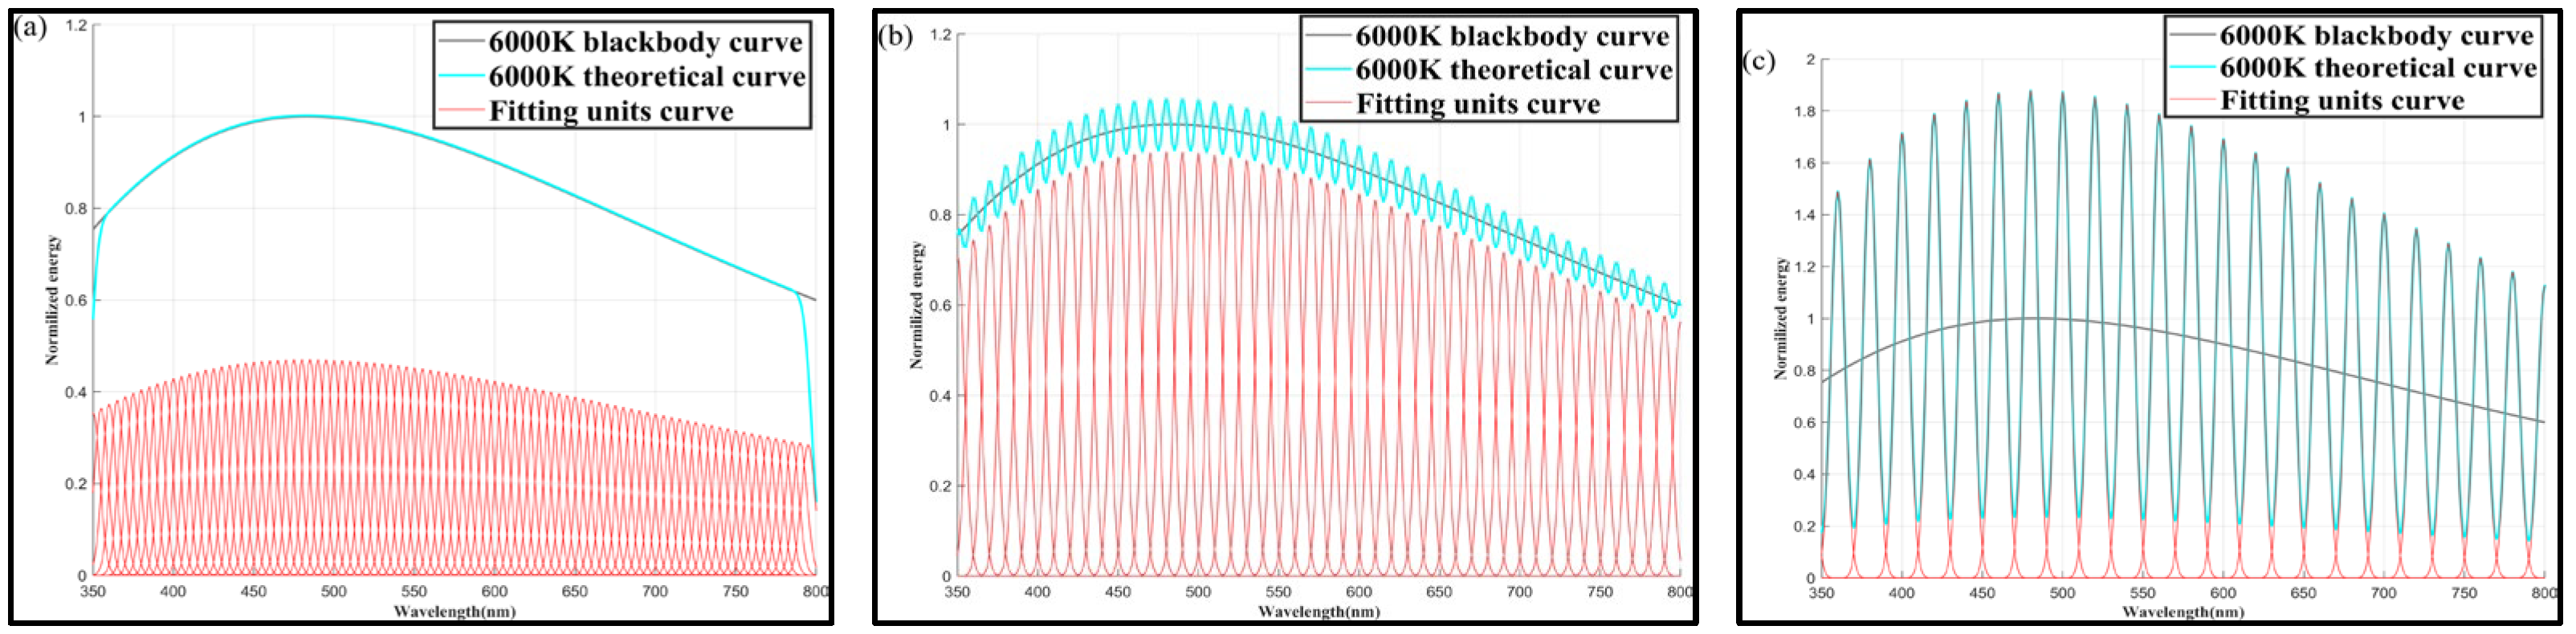
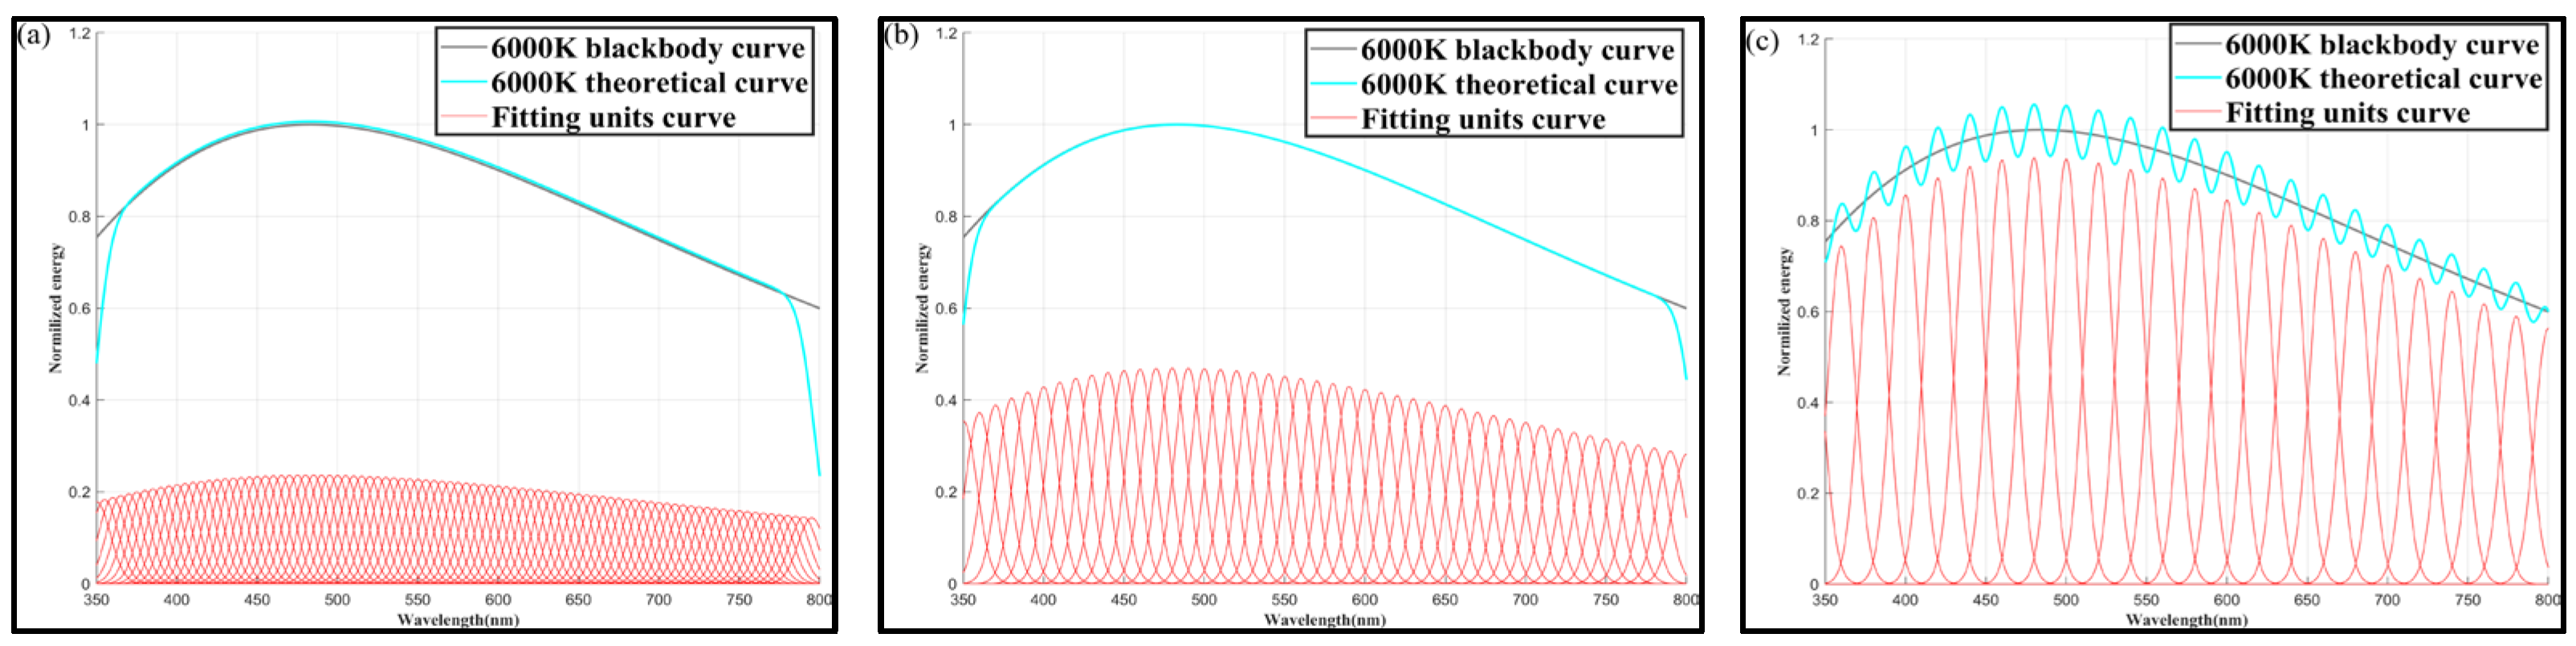
Simulation results for 6000 K color temperature:
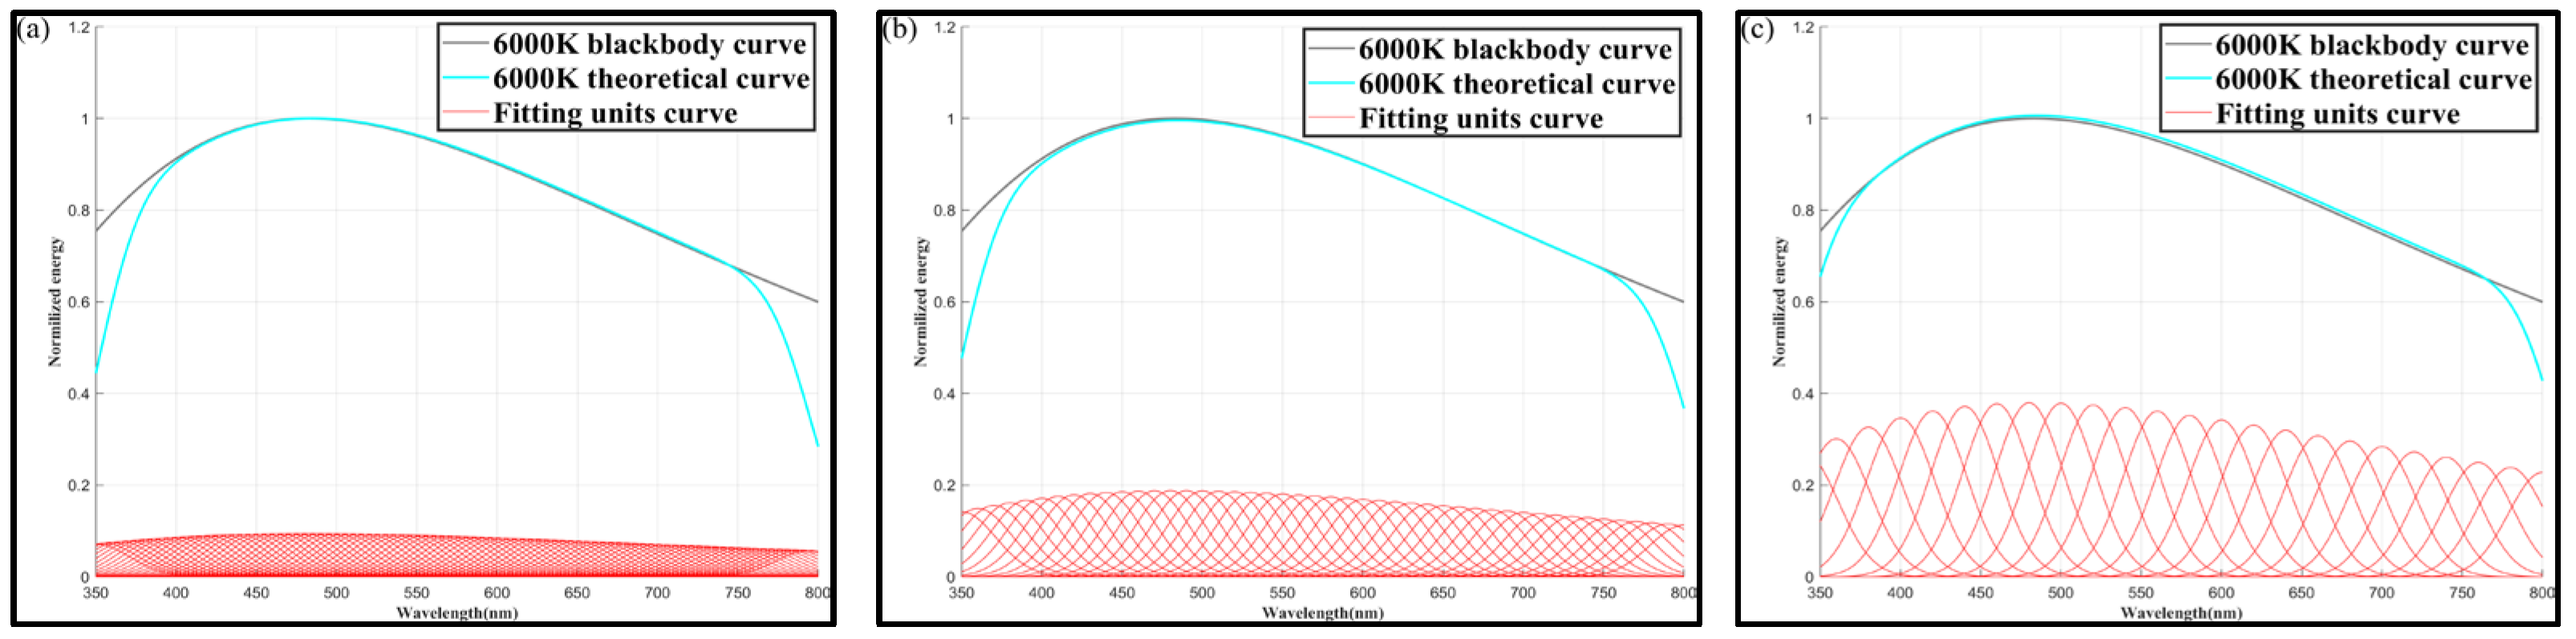
➀
Figure 9 shows the color temperature simulation results at
= 10 nm, for
values of 5, 10, and 20 nm.
➁
Figure 10 shows the color temperature simulation results at
= 20 nm, for
values of 5, 10, and 20 nm.
➂
Figure 11 shows the color temperature simulation results at
= 50 nm, for
values of 5, 10, and 20 nm.
- (3)
Simulation results for 9000 K color temperature:
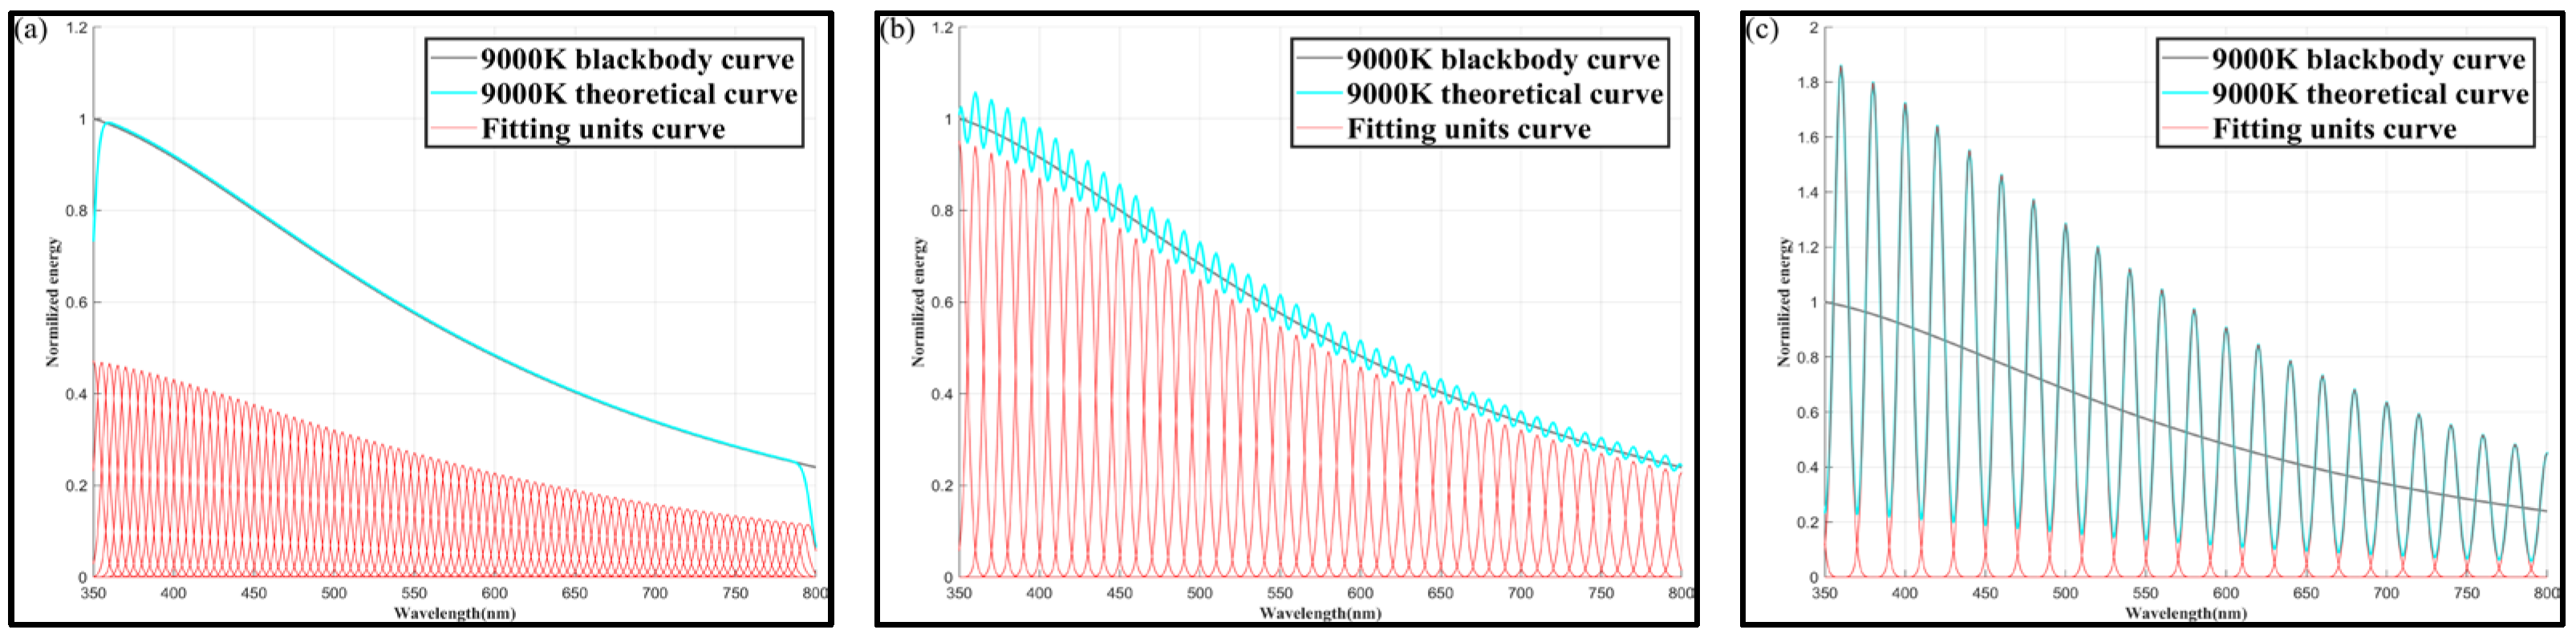
➀
Figure 12 shows the color temperature results at
= 10 nm, for
values of 5, 10, and 20 nm.
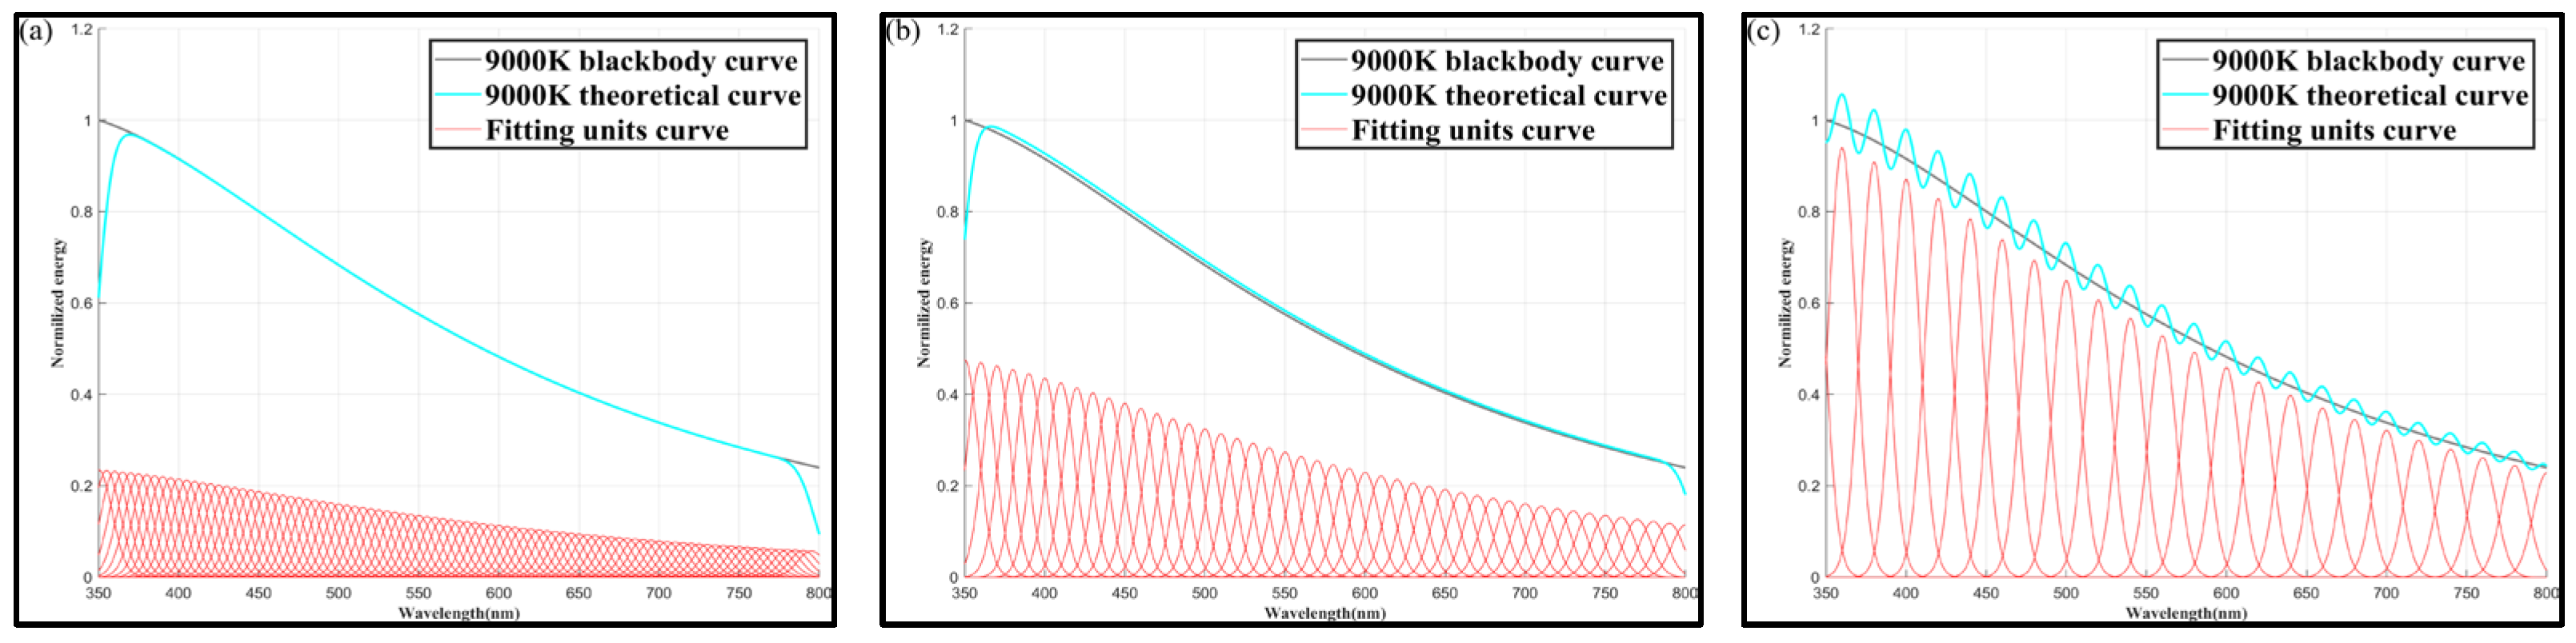
➁
Figure 13 shows the color temperature results at
= 20 nm, for
values of 5, 10, and 20 nm.
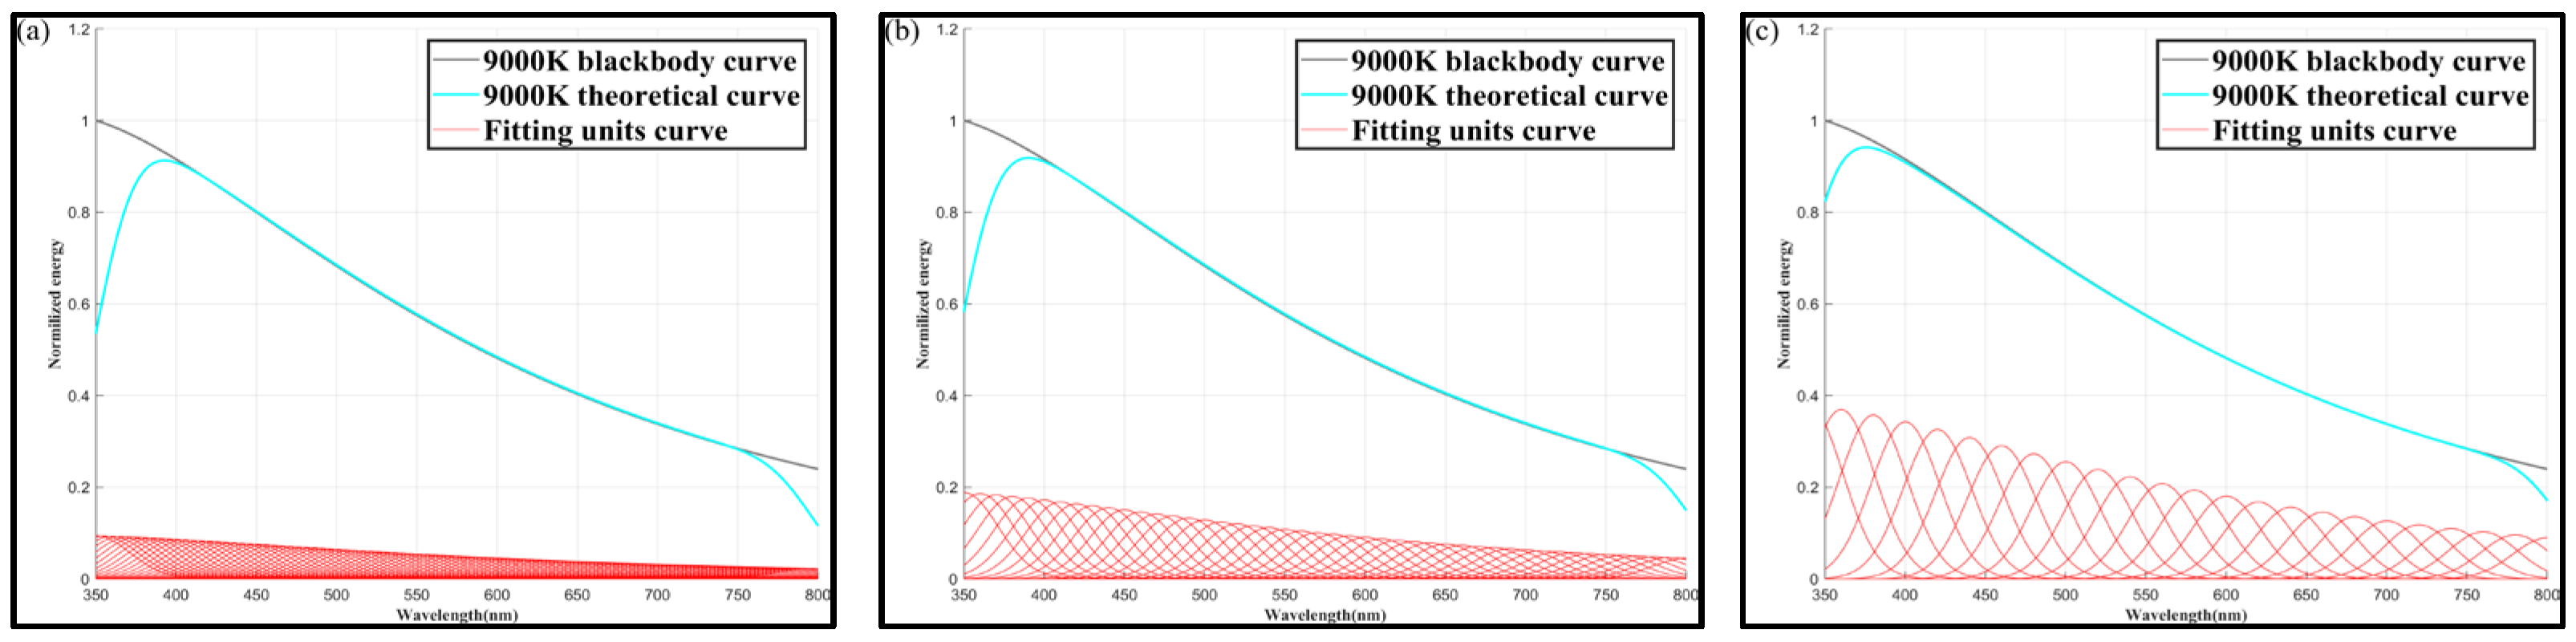
➂
Figure 14 shows the color temperature results at
= 50 nm, for
values of 5, 10, and 20 nm.
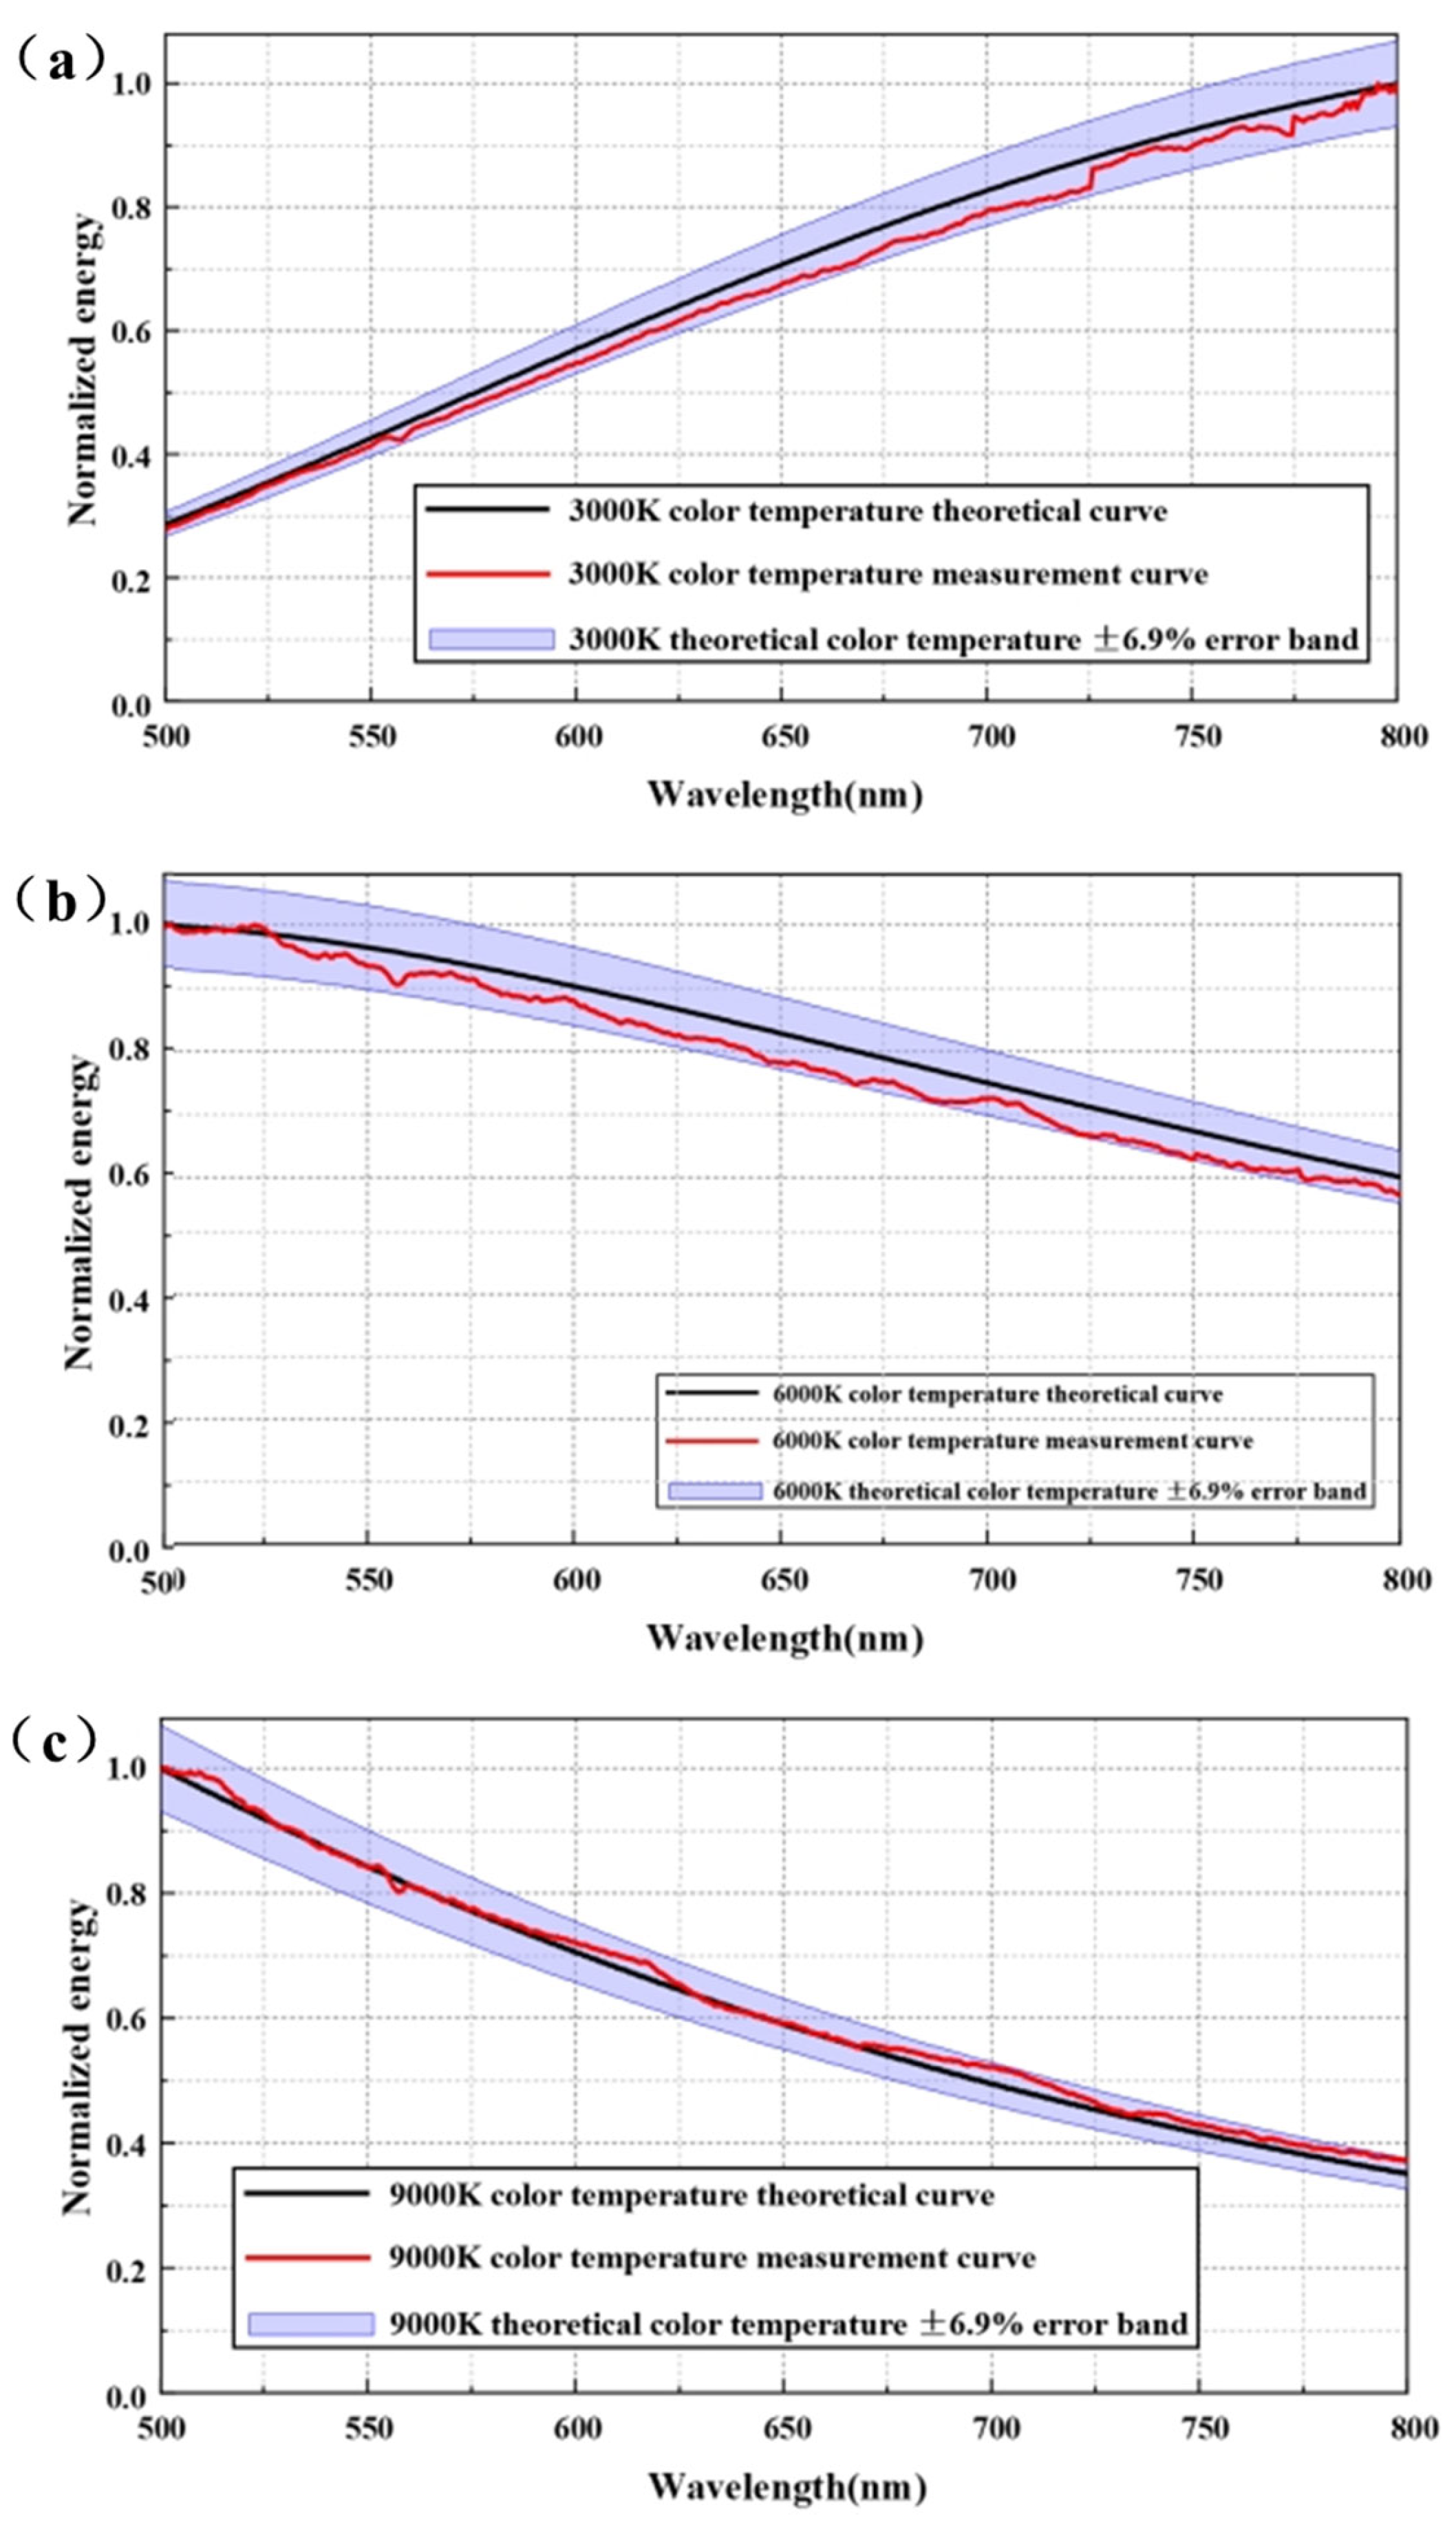
From
Table 5, it can be observed that when
= 50 nm, for all
values, the simulation of a color temperature range of 3000–9000 K could be satisfactorily realized. Although the smaller the
, the higher the spectral modulation capability, according to the results, there is almost no difference in the spectral simulation accuracy at different
values.
However, it is worth noting that the color temperature simulation accuracy is larger in three cases, namely (
= 10 nm and
= 10 nm); (
= 10 nm and
= 20 nm); and (
= 20 nm and
= 20 nm); furthermore, the peak interval is smaller when the
width is certain. This results in higher simulation accuracy, as seen in, for example,
Figure 6b,c,
Figure 9b,c and
Figure 12b,c, this is because
is fixed, the peak interval is large, and the position in the middle of the unit spectrum cannot be covered during the modulation, resulting in an insufficient modulation capacity of the system.
Thus, based on the above analysis, owing to the smooth nature of the stellar color temperature curve [
21], the main factor affecting the spectral simulation accuracy is the relationship between
and
. Therefore, for simulating the stellar color temperature spectrum curve, it is necessary to enhance the beam splitting capability of the system as much as possible, that is, enhance
. For
, the monochromatic requirements of the beam of the unit spectrum segment can be appropriately relaxed. Therefore, in the design of the spectral modulation system, the requirement of spectral half-peak width can be appropriately reduced, and the spectral splitting ability of the system can be improved to the extent possible, to improve the simulation accuracy of the system.
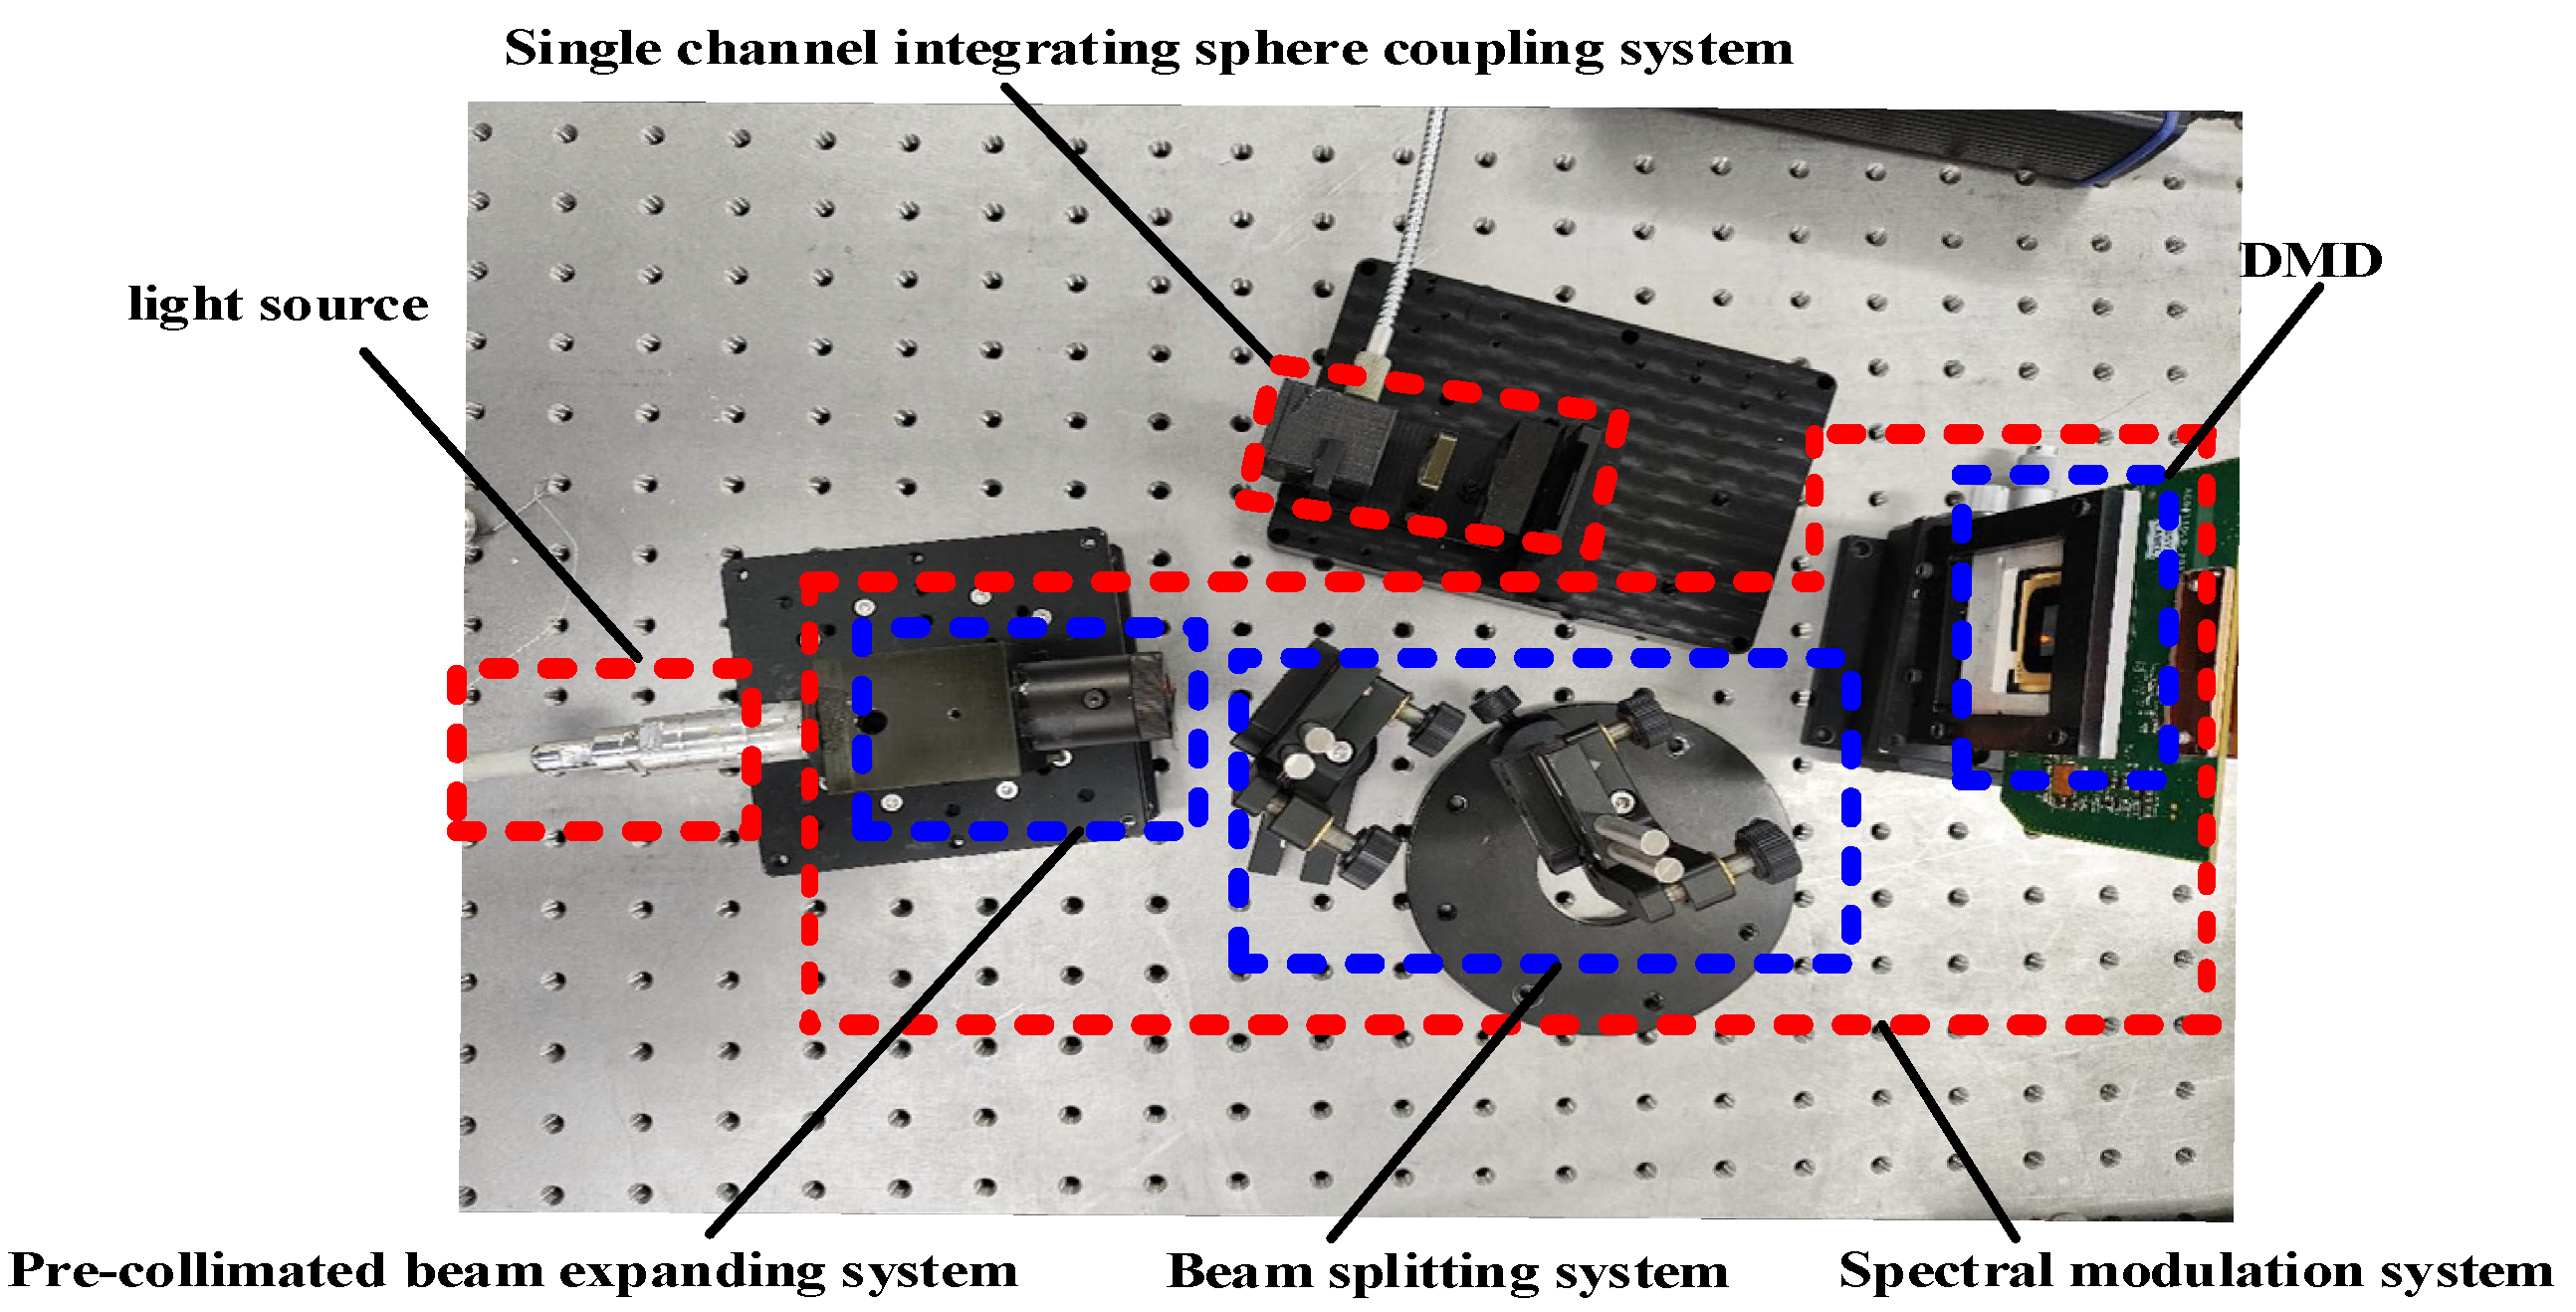
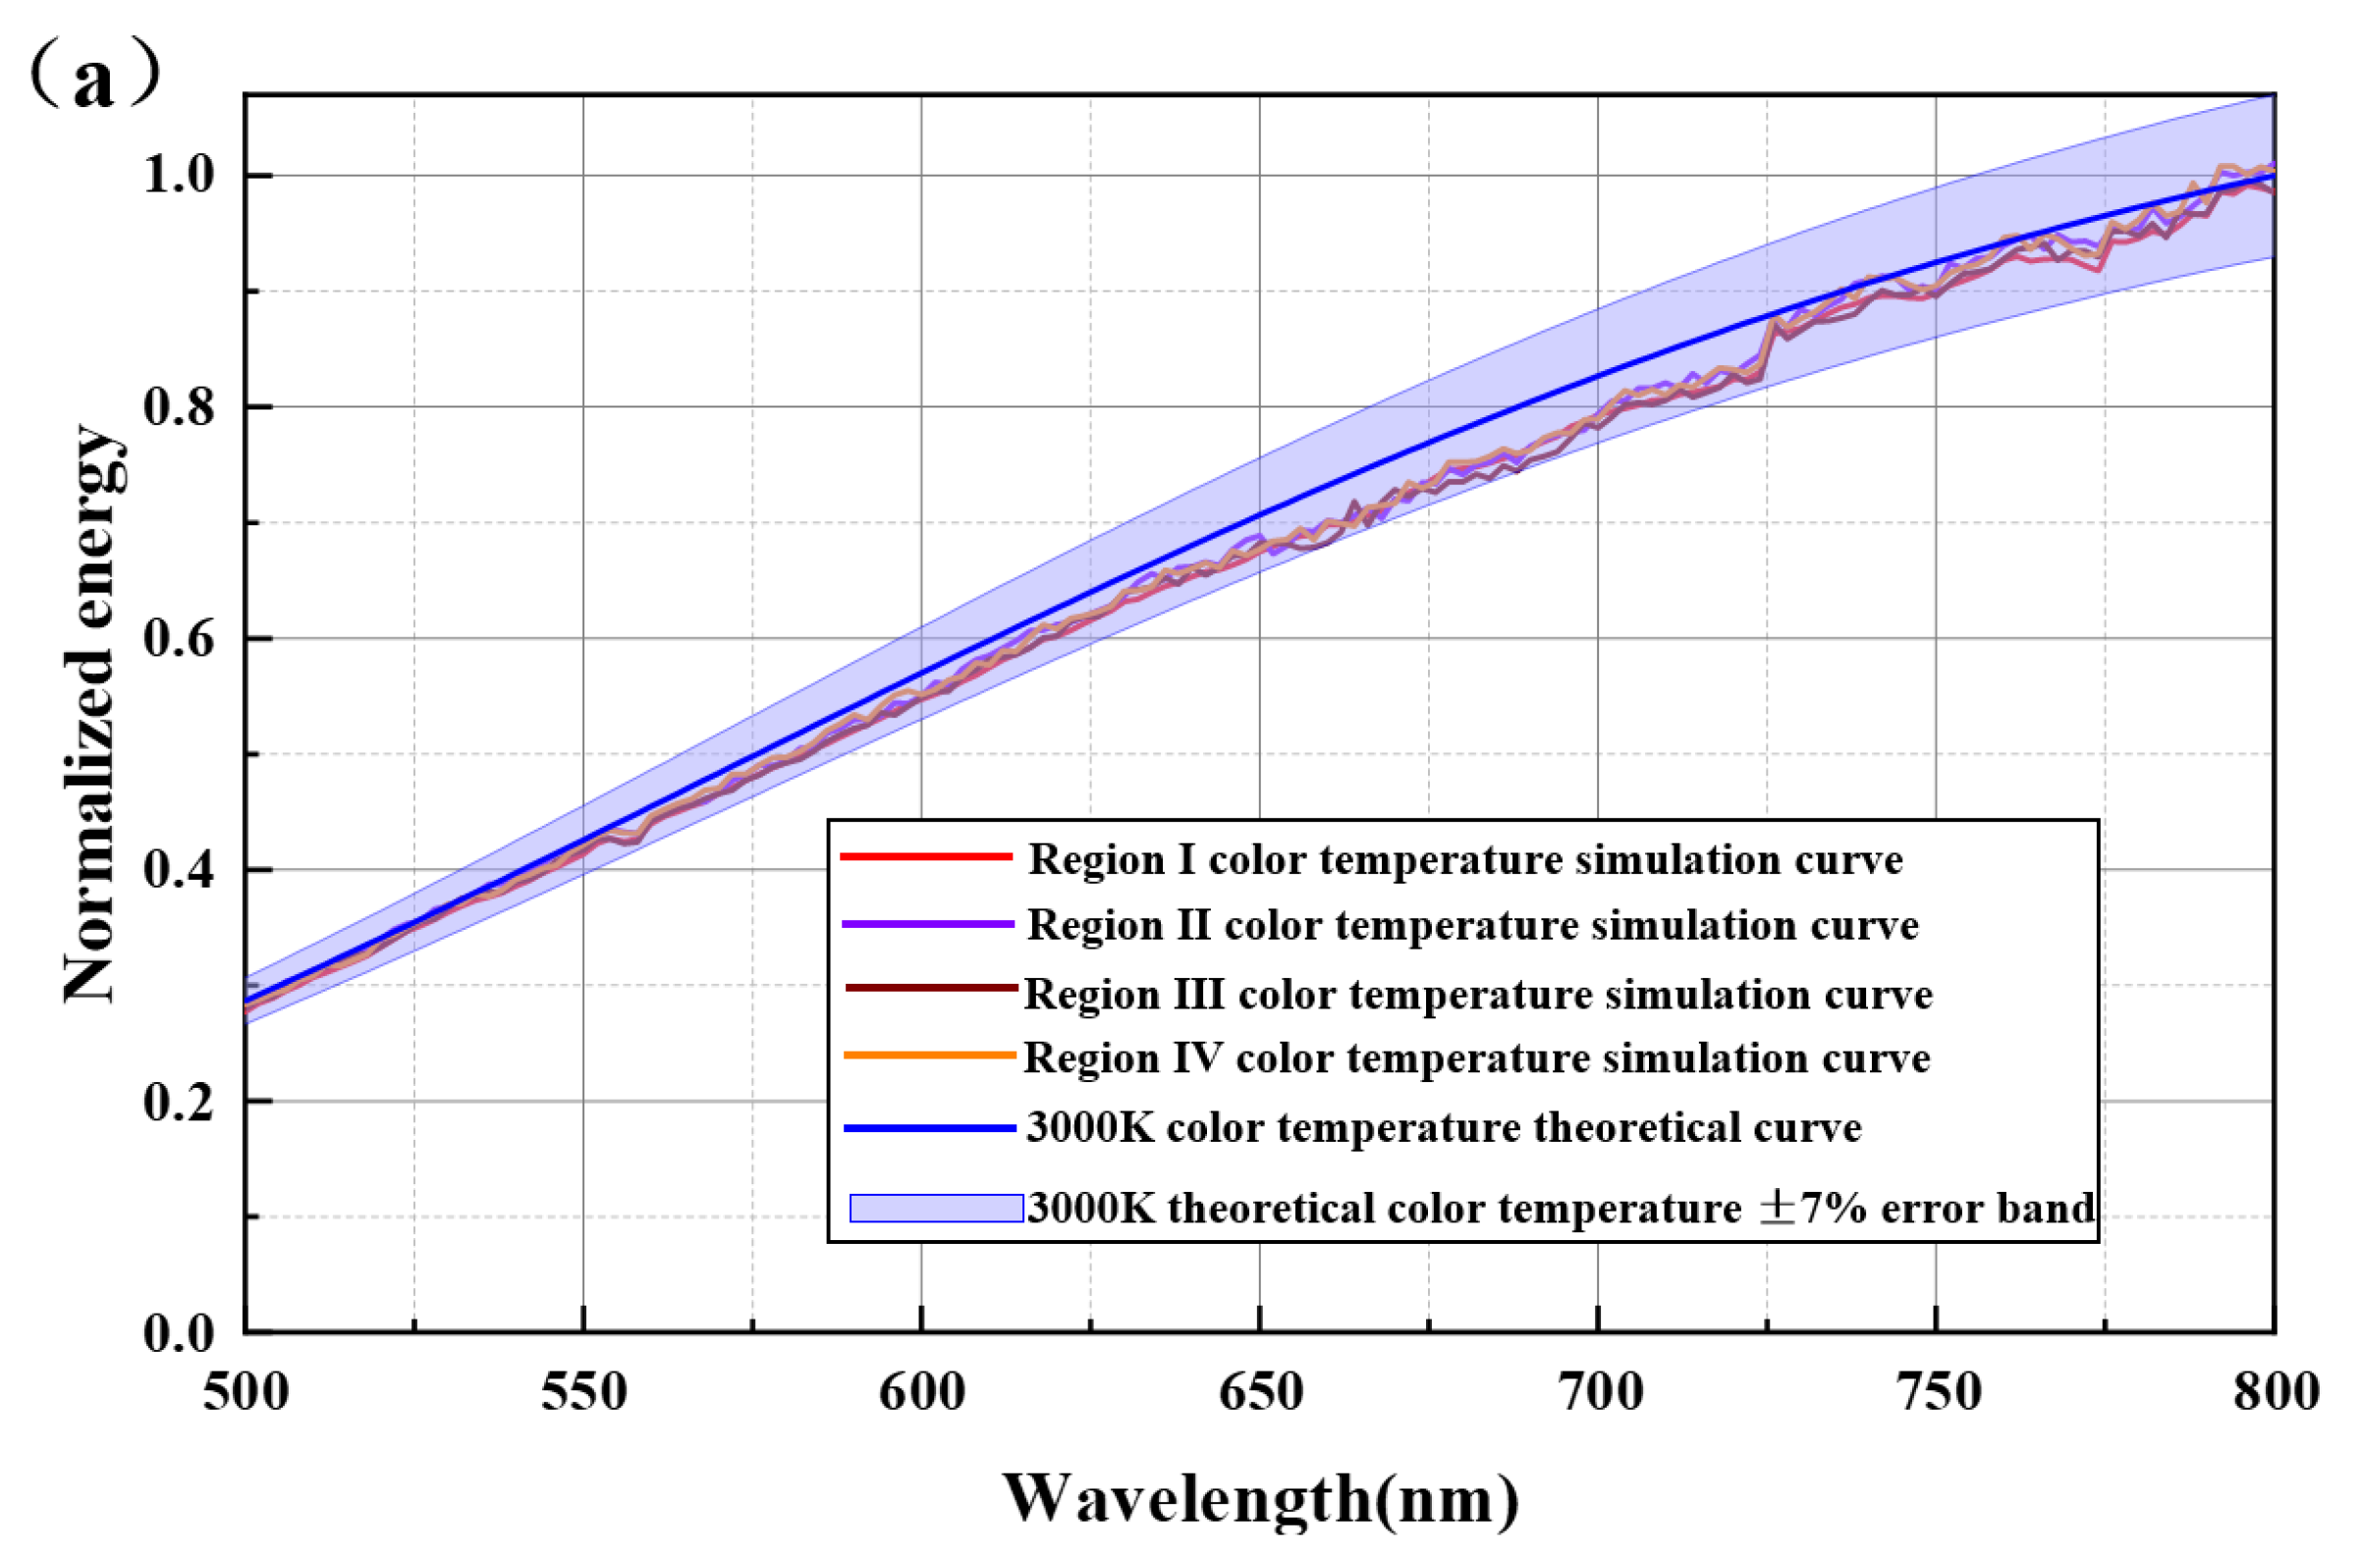
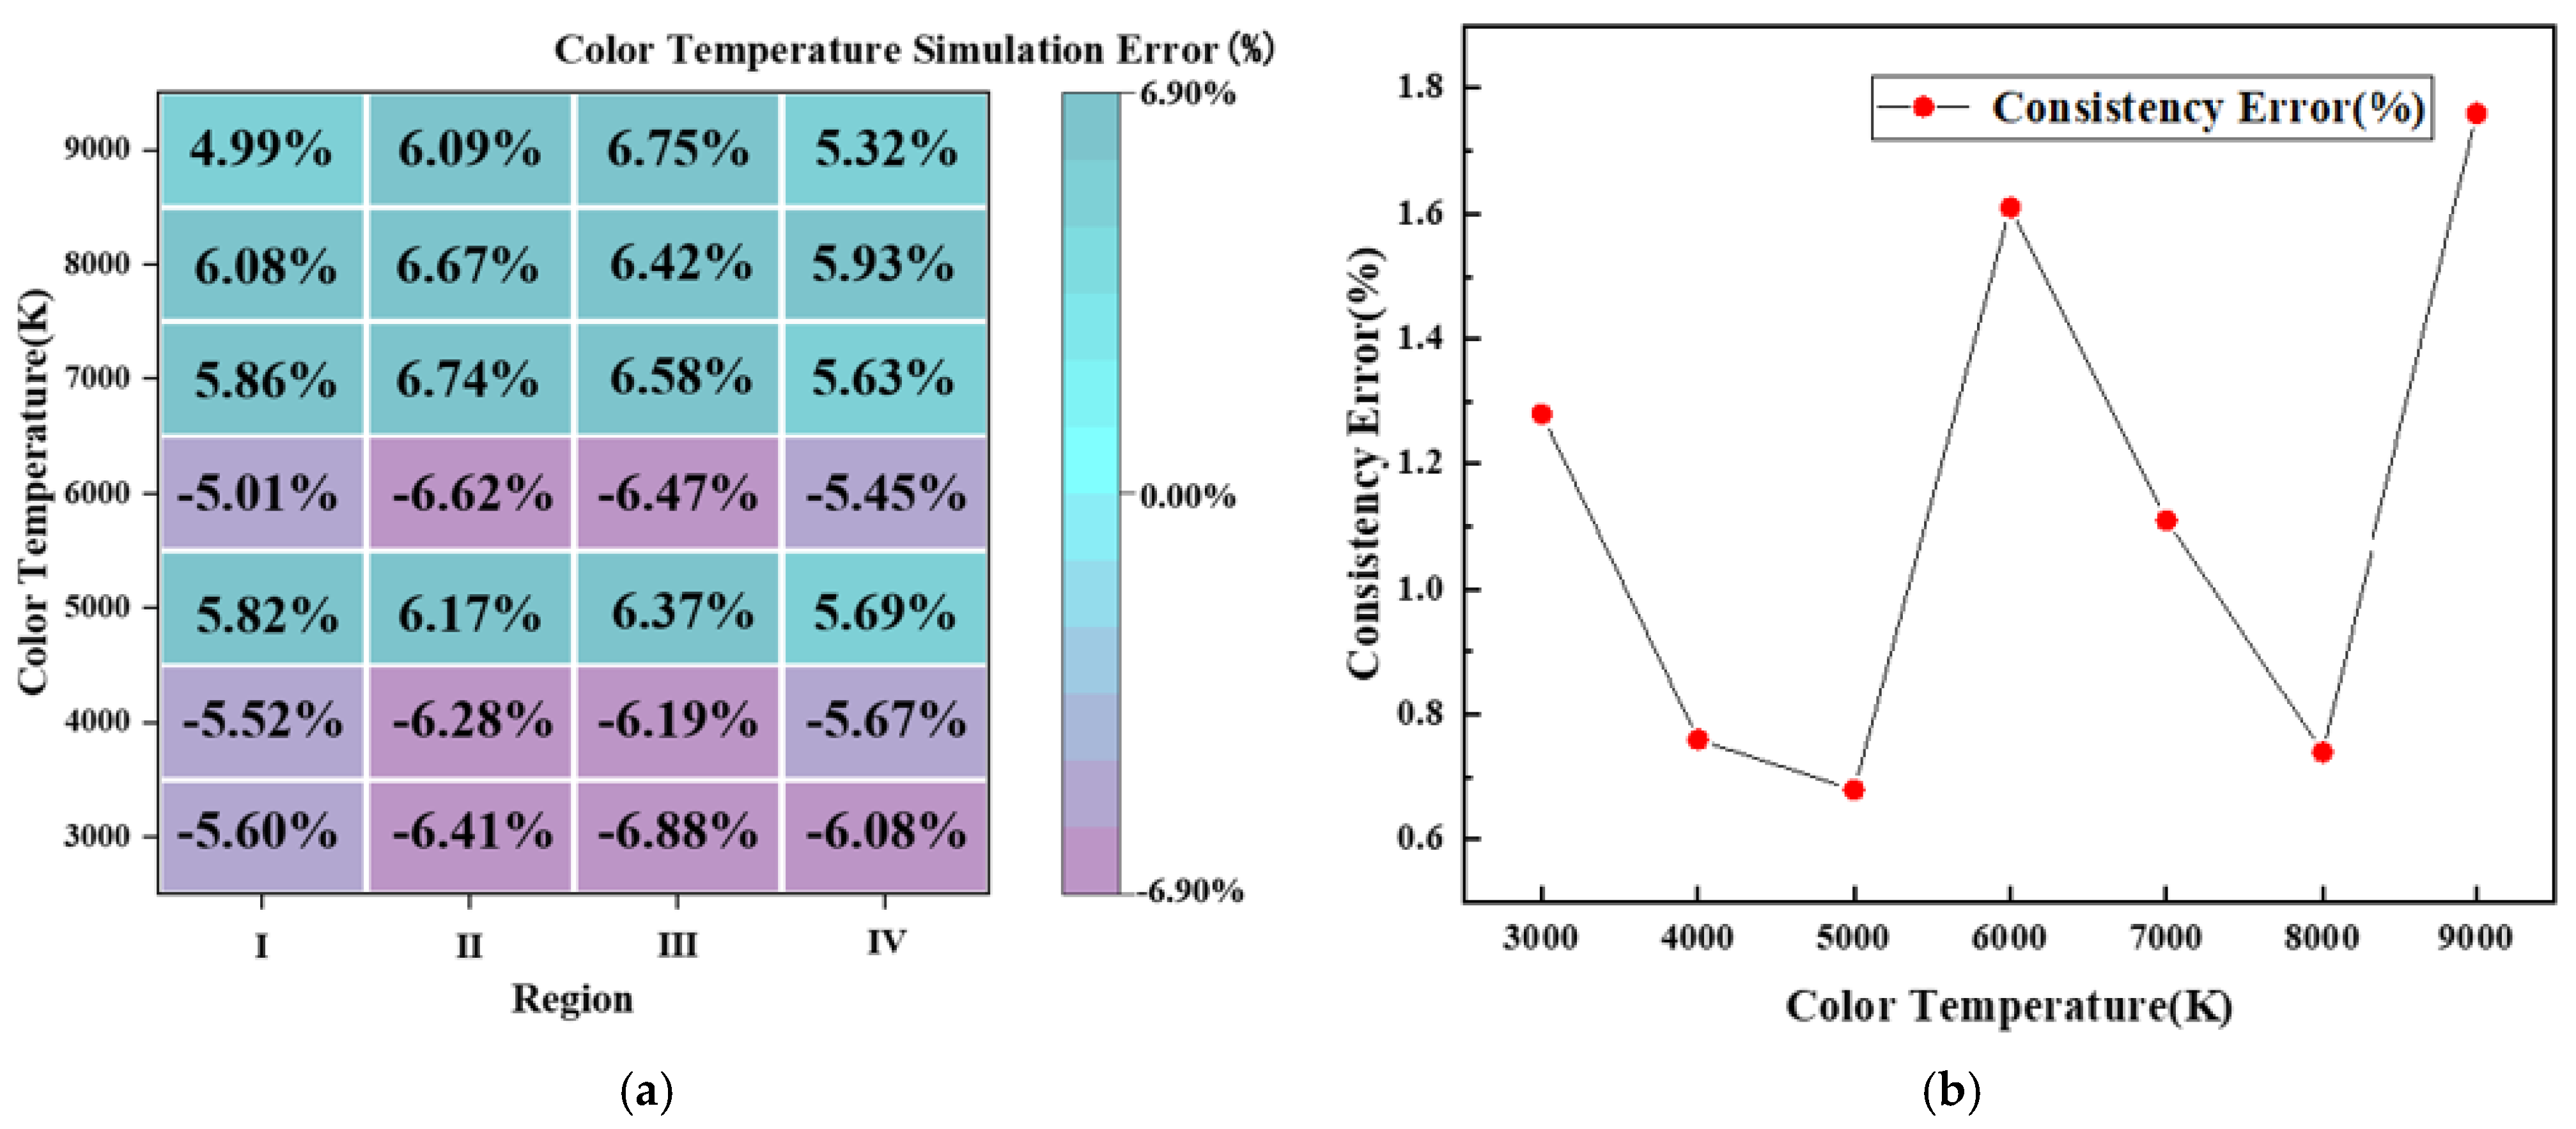
4.3. Multi-Dimensional Slit Design
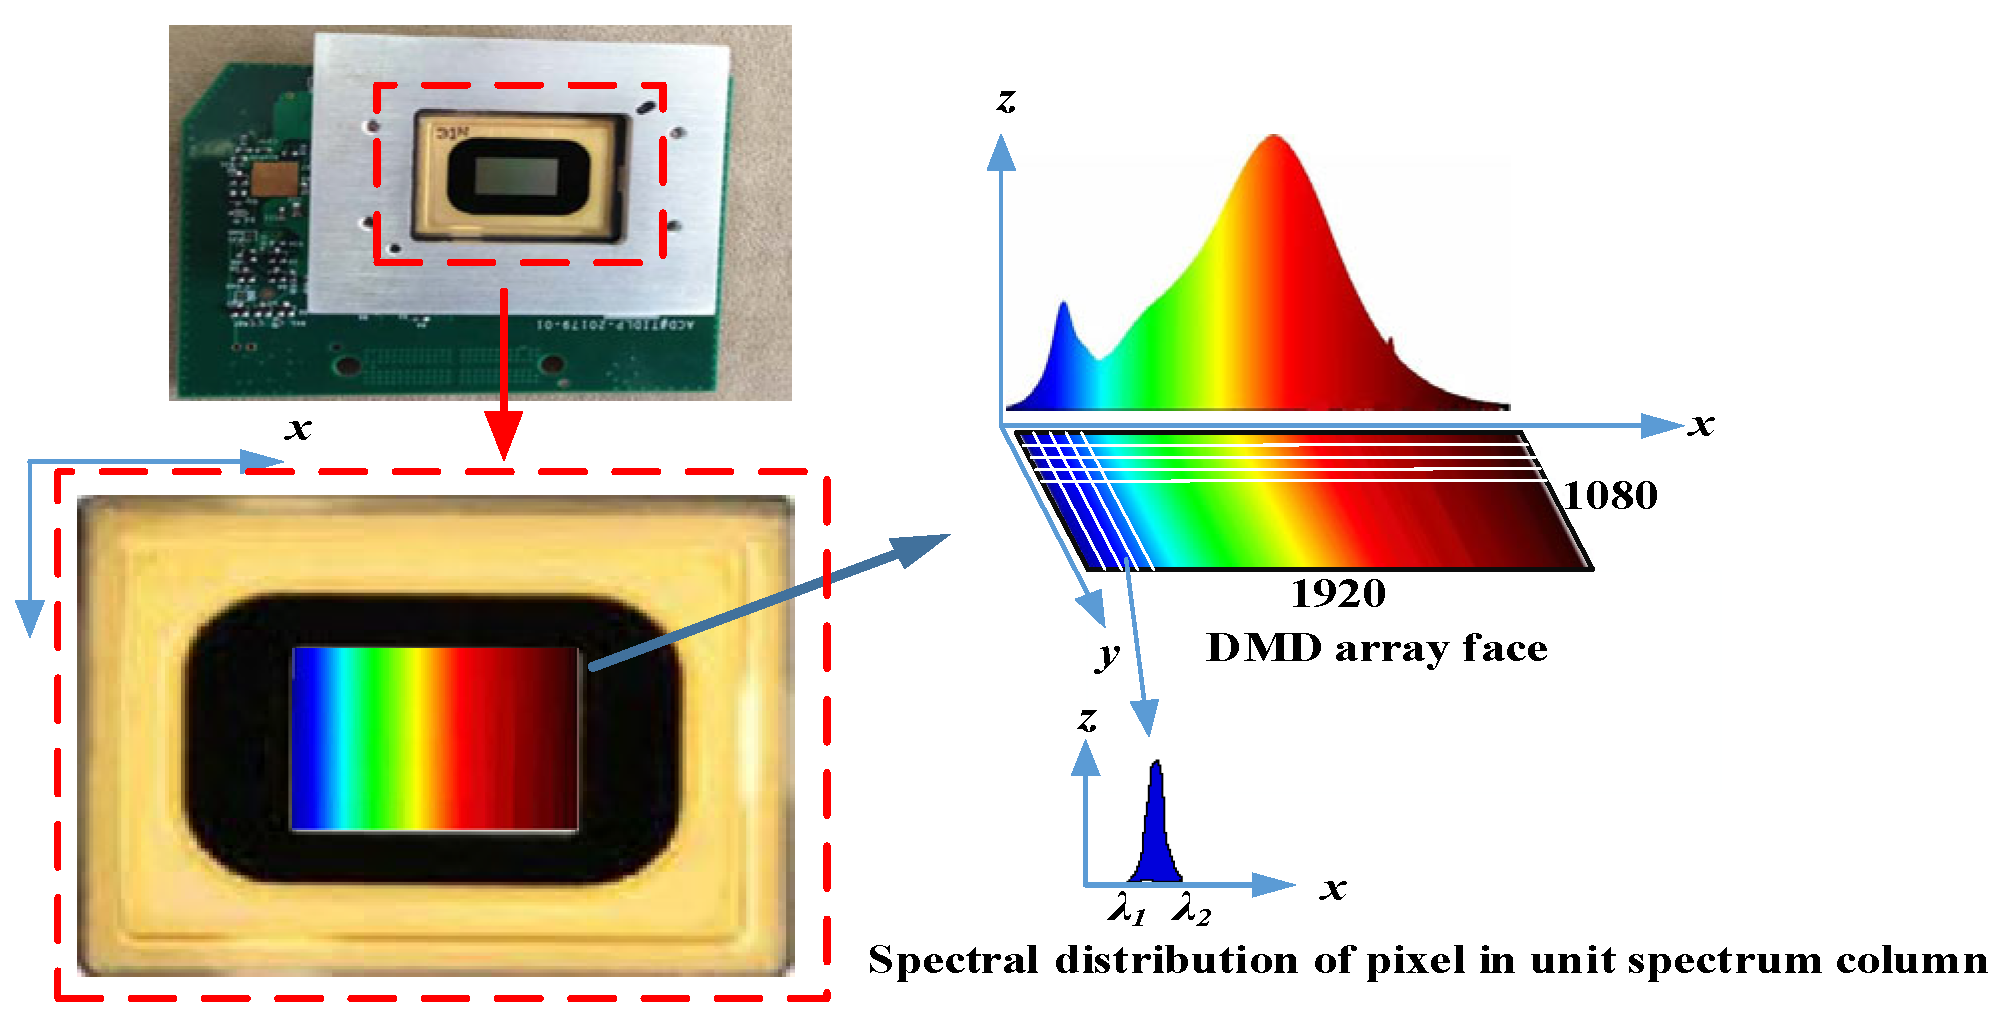
In this study, DLP6500 was selected as the modulator. According to the analysis presented in
Section 2.2, the simulation of a 3000–9000 K color temperature spectral curve in the spectral range of 500–800 nm must theoretically meet the modulation capacity n > 3.57/c. Considering the diffraction effect of the DMD itself, the non-smoothness of the spectral radiation distribution of SC-PRO, and the possible beam overflow in adjacent regions, the modulation magnification of a single region should be improved to the extent possible. If the target spectral simulation accuracy c = 7%, the modulation capability of the system must theoretically meet the requirement of n > 51. Therefore, the digital micro-mirror array was divided into four parts along the non-dispersive direction, as shown in
Figure 4. The resolution of each region is 1920 × 270; that is, the radiation coefficient adjustment ratio of the element spectral segment is 270, and the theoretical spectral simulation accuracy is approximately 3.57/270 ≈ 1.32%, which meets the requirement of 7% target spectral simulation accuracy.
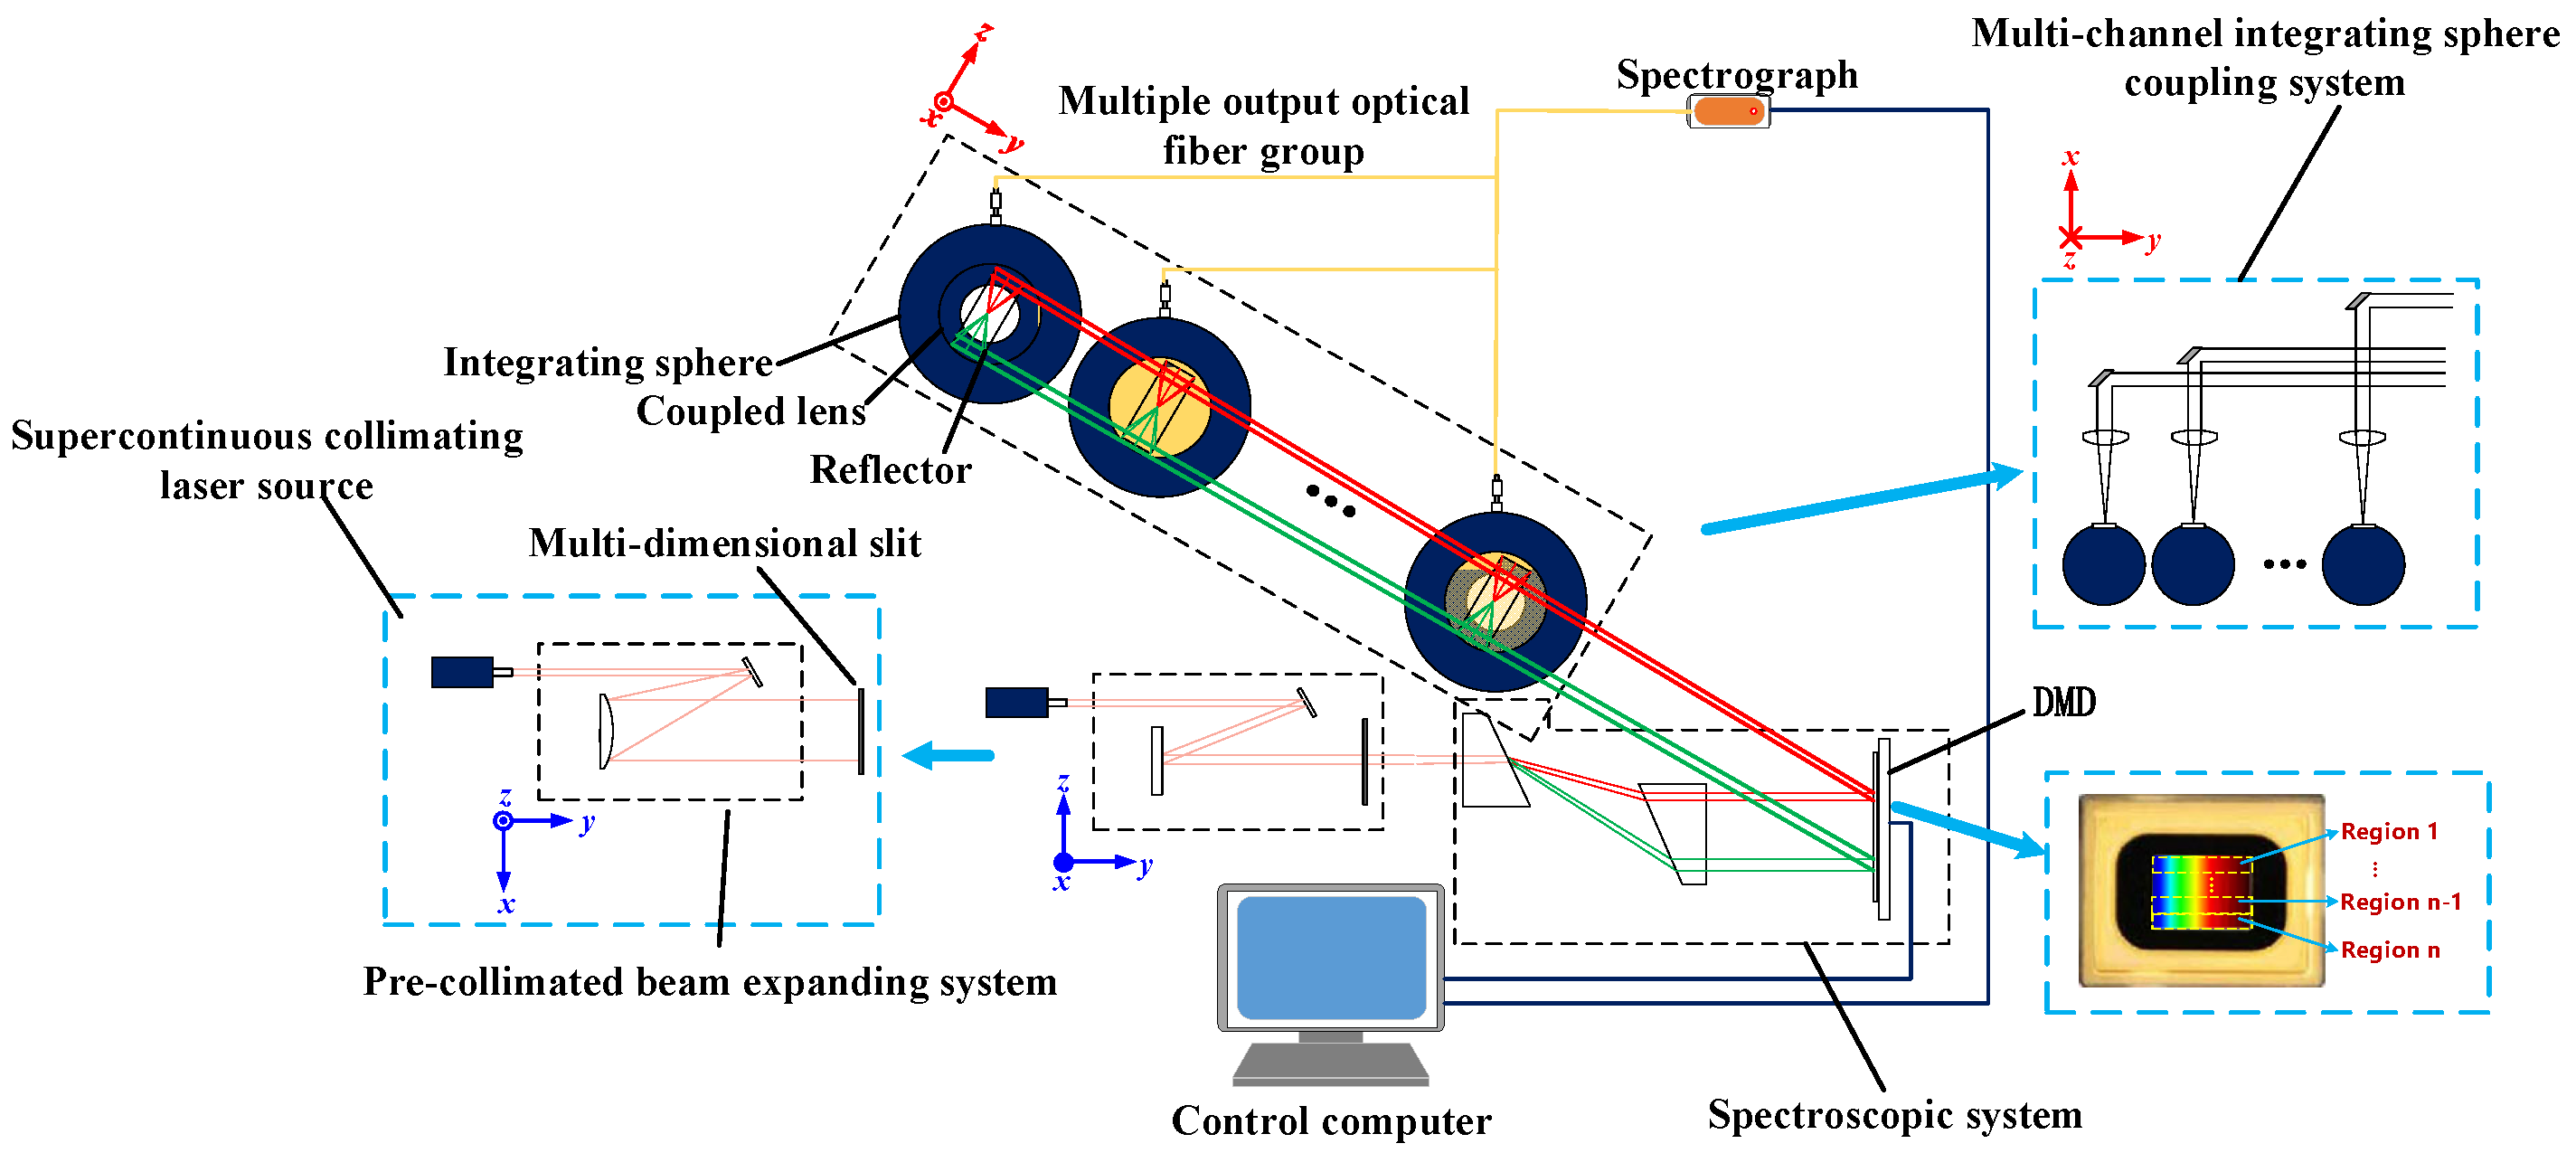
Multi-dimensional slits were designed according to the number of partitions, and the beam was processed twice along the dispersion direction. The slits were set up as shown in
Figure 16. The same area has two groups of slits, namely wide and narrow groups, and different areas have the same slit group, among which, the size of the wide channel slit is 0.2 mm and the size of the narrow channel slit is 0.01 mm. As the spectrum between adjacent pixel groups in the DMD array surface is not completely independent, the spectrum between each adjacent group has a certain superposition, and the role of different sizes of slits is to compensate for the modulation interference between adjacent pixel groups on the DMD array surface.
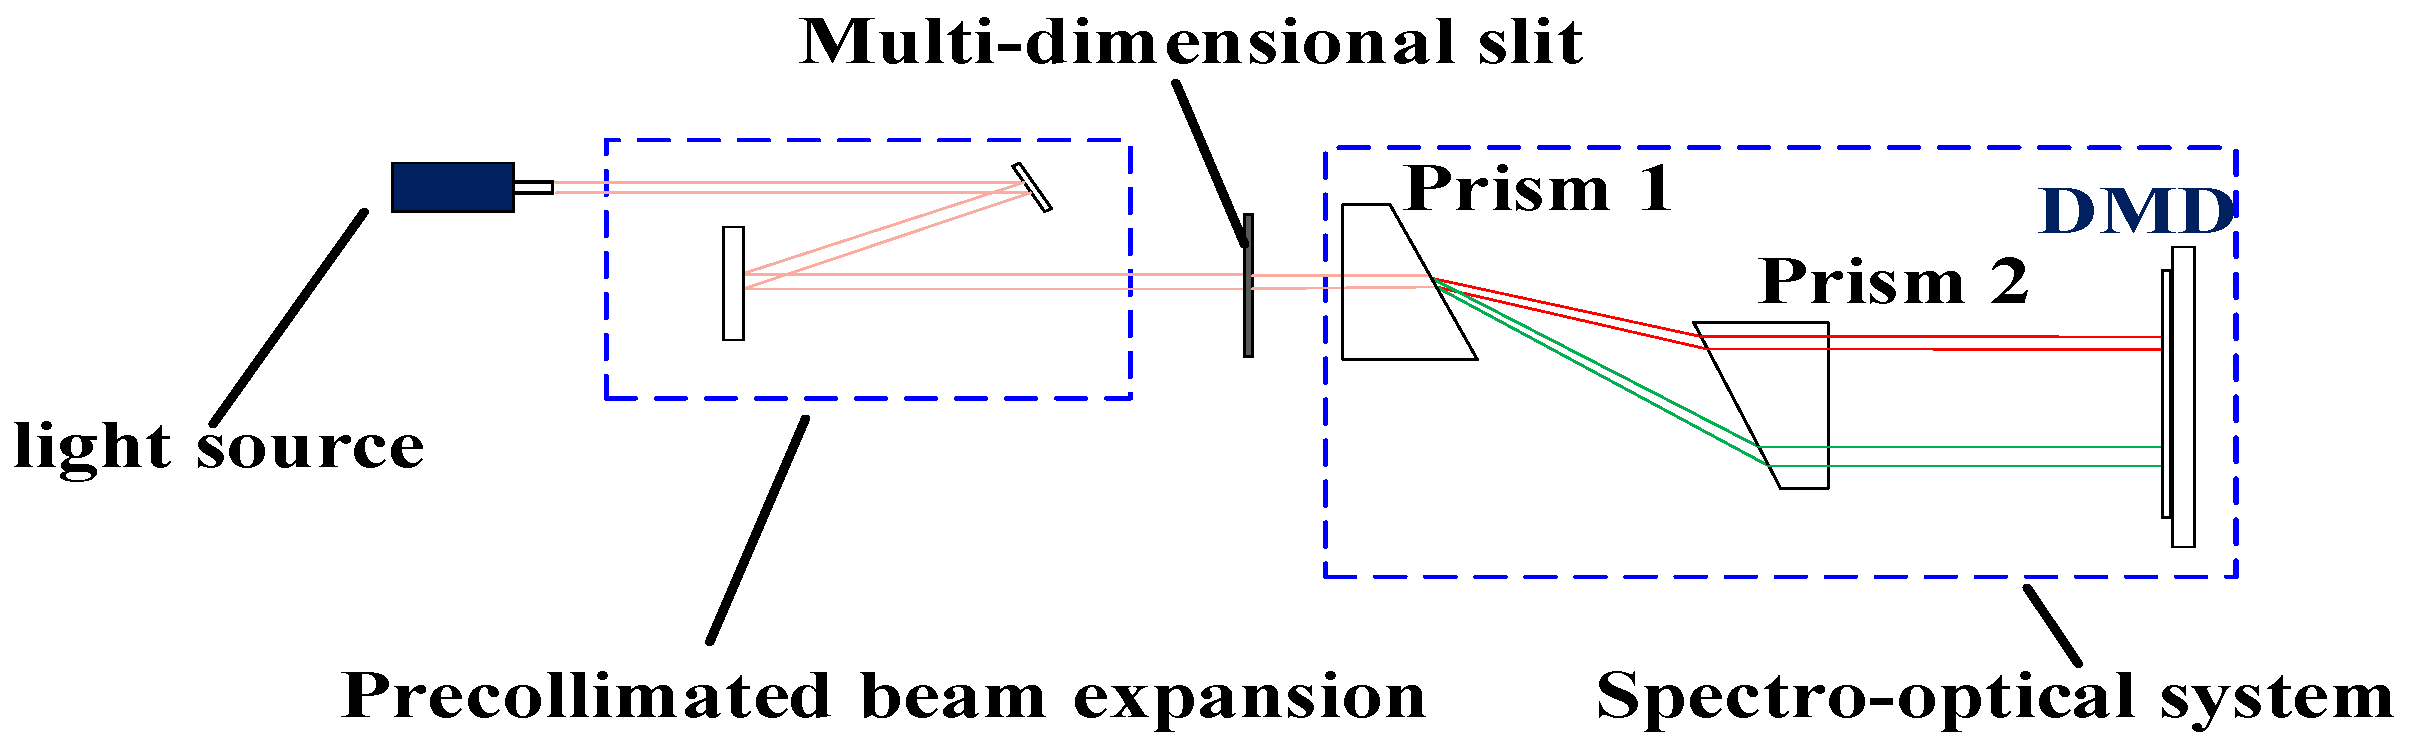
4.4. Design of Spectral Splitting System
According to the analysis presented in
Section 3.1, the system adopts the design method of a beam-splitting system with double prisms symmetrically placed. Prisms I and II are responsible for beam splitting and collimating separate beams, respectively. The spectral resolution of the beam-splitting system with double prisms symmetrically placed is proportional to the length of the system (the distance between the prisms). Materials with high dispersion (such as TIF6, BASF54, F7, and LAF9) are recommended for the prism. In this study, TIF6 was selected as the prism material.
The design process of the splitting system is as follows:
- a.
Select the prism material (n, v);
- b.
Calculate the refractive index nλ of the prism for each spectrum;
- c.
Calculate the exit angle i′λ of each spectrum according to the refraction law (n Sin(i) = n′ Sin(i′));
- d.
Using trigonometric relations, calculate the distance between the two prisms L, so that the difference between the incident height of the limiting wavelength λ1 and λ2 on Prism II is the length of the DMD short side (dispersive direction);
- e.
According to the calculated L, set Prism II so that it is placed symmetrically with Prism I.
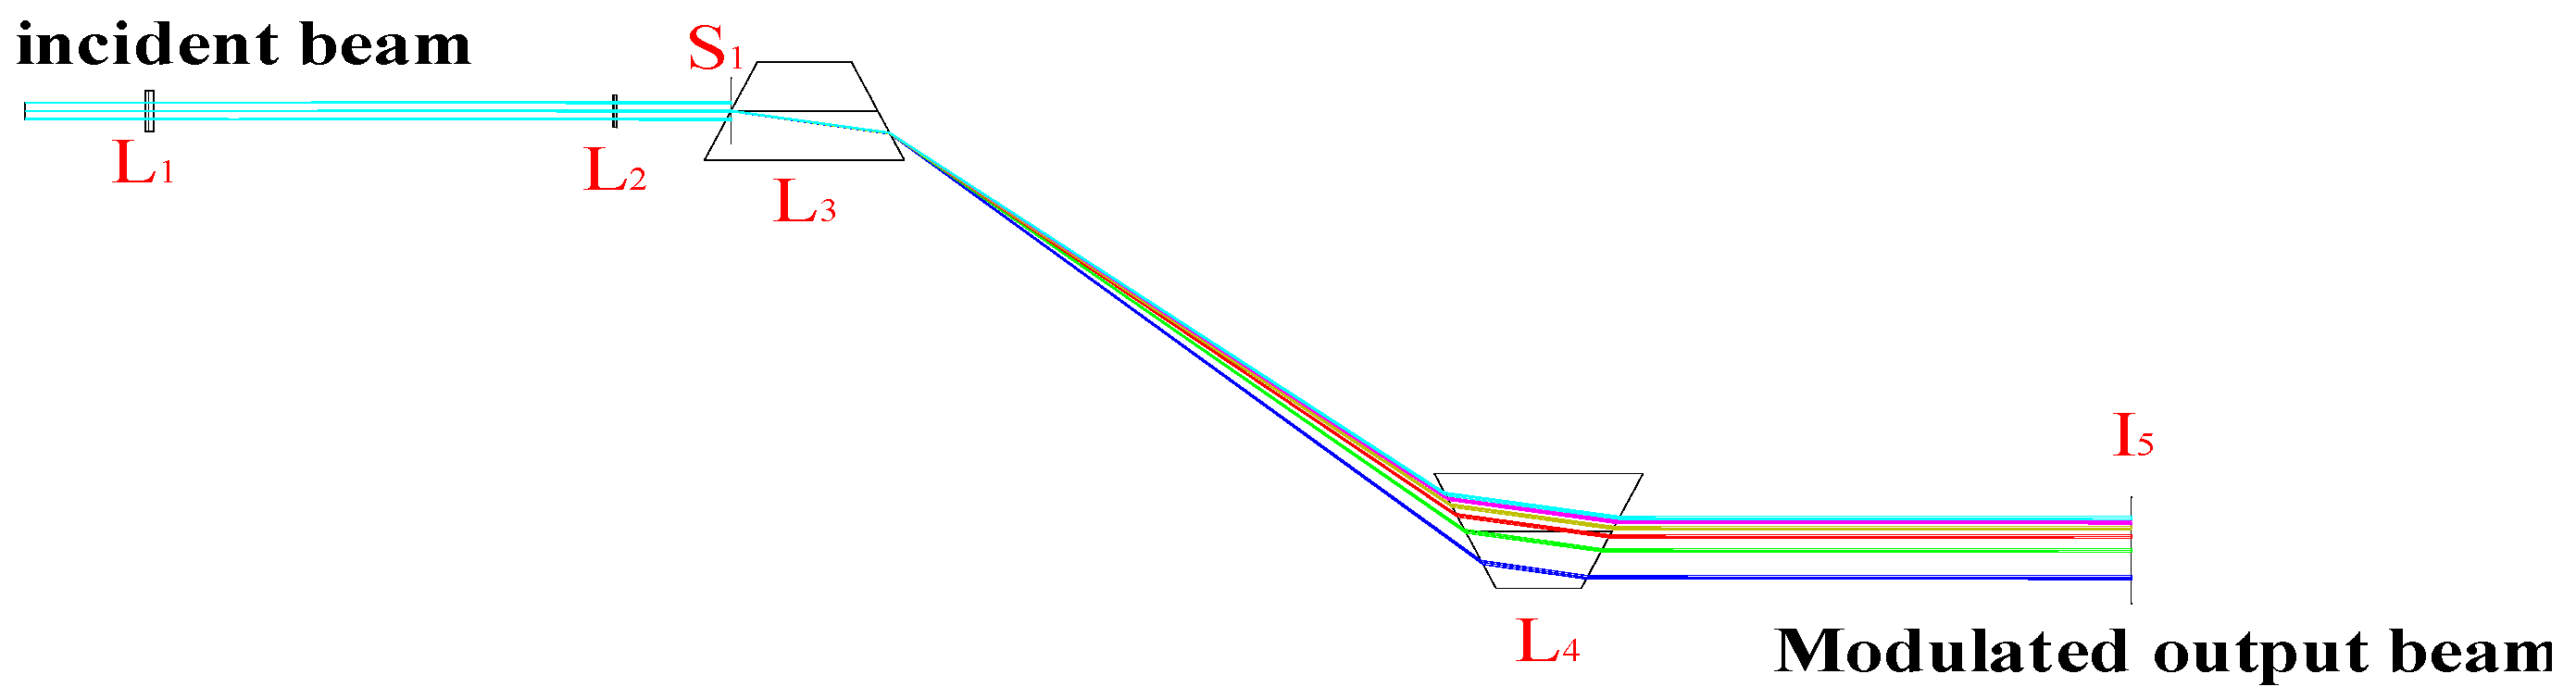
The optical path of the beam splitting system with symmetrical placement of the designed double prisms is shown in
Figure 17. Here, L
1 and L
2 are the mirrors of the pre-collimated beam expansion system; S
1 is the slit; L
3 and L
4 are the dispersion prisms I and II; and I
5 is the DMD.
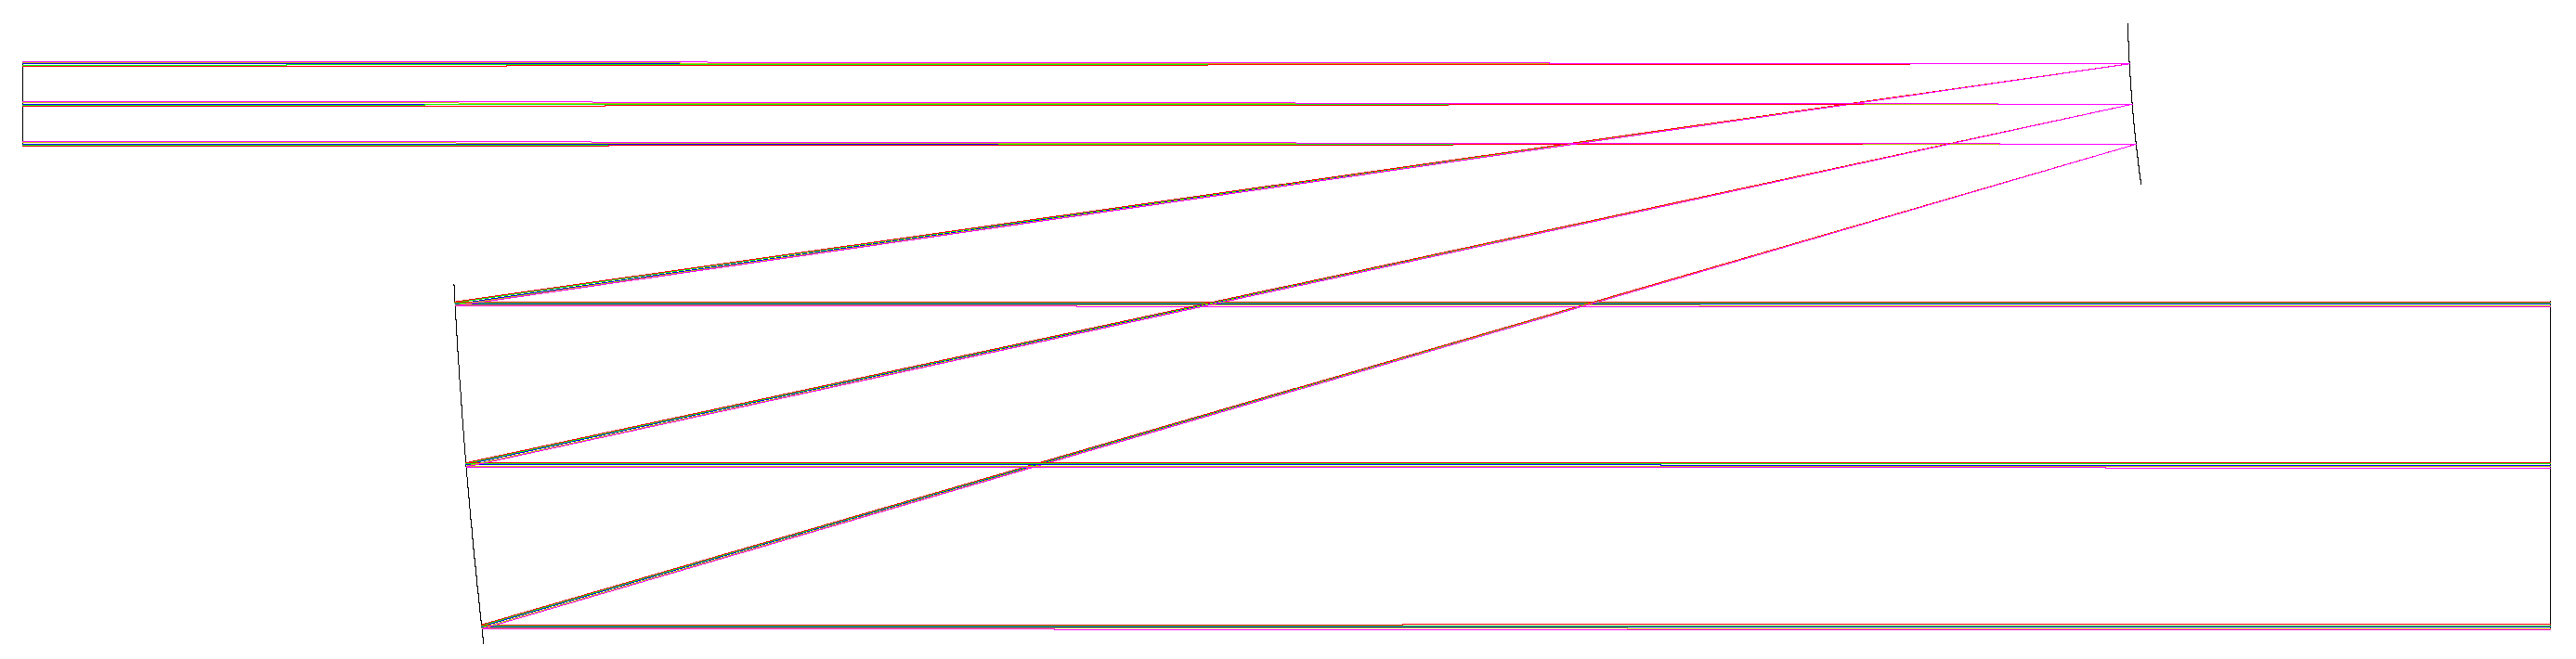
Although the beam splitting system is not an imaging system, the spot size and spectral resolution of the system can still be evaluated by a dot plot. The imaging quality of the system is shown in
Figure 18 and
Figure 19. According to the design results, under wide channels, the spectral resolution of the spectral collimation system is better than 5 and 30 nm at 500 and 800 nm, respectively. For narrow channels, the spectral resolution of the spectral collimation system is better than 3 and 13 nm at 500 and 800 nm, respectively.
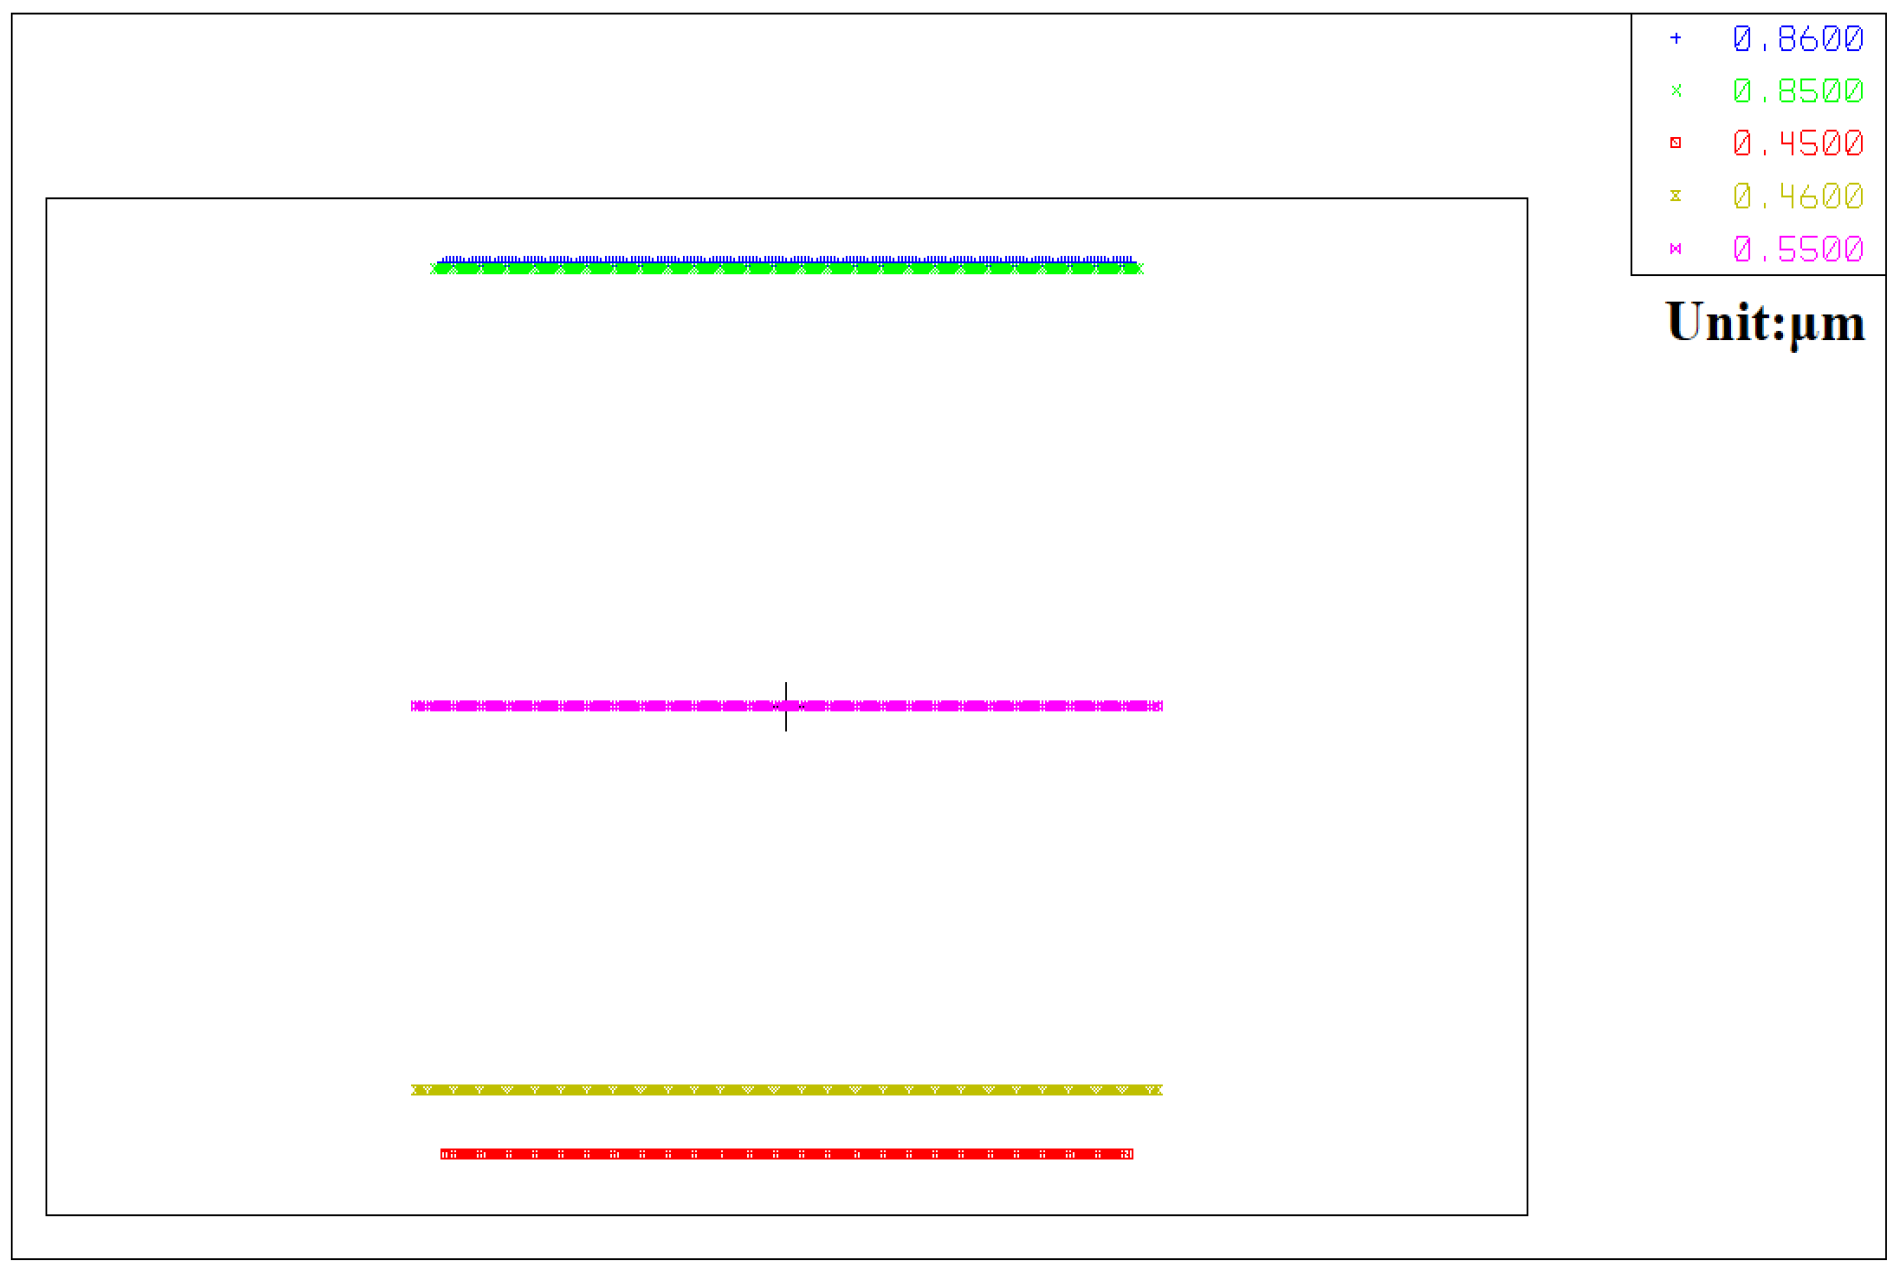
A group of 10 pixels was taken as the unit spectrum segment for modulation. The spectral half-peak widths of the unit spectrum segment under wide and narrow channels are shown in
Figure 20. Under the wide channel, the maximum spectral peak width of the unit is approximately 40 nm, while the same under the narrow channel is approximately 29 nm.
According to
Figure 20, the maximum spectral resolution error of the system appears at 800 nm, which is due to the dispersive nonlinearity of the prism, which has high spectral resolution at short wavelengths and low spectral resolution at long wavelengths.

 ,
, 


