Abstract
The elliptical cylindrical mirror has been utilized in neutron small-angle scattering and reflectometry to enhance the neutron intensity at the sample position. However, the performance of the elliptical cylindrical mirror can be impacted by surface slope errors, reflectivity, and misalignments. In this work, the performance of the elliptical cylindrical mirror under different error conditions has been analyzed comprehensively, and a 250-mm-long elliptical cylindrical mirror was designed and developed. The simulations show that a source size below 1 mm is required to achieve a peak gain above 6, with a theoretical peak gain of 16× with a 0.1 mm source. The rotational misalignment of 0.03° around the Y-axis can decrease gain from 16× to 6×. The designed mirror was fabricated with a surface figure error of 110 nm (RMS), and a roughness below 0.5 nm (RMS), and was coated with an m = 4 supermirror. The mirror was aligned and tested in the dedicated neutron beamline of the Chinese mianyang research reactor, and the results show a peak gain of 12.77 with a 0.1 mm slit source.
1. Introduction
Neutron reflectometry (NR) is a powerful technique for characterizing thin films and layered structures, such as their thickness, density profile, and roughness at interfaces [1,2,3,4]. Because neutron reflectometry experiments are often performed far from the neutron source, neutron guides are used to efficiently transport neutrons from the source to sample position [5]. These guides typically have a length of tens of meters [6] to minimize background neutrons and have cross-sectional apertures of several square centimeters, which are unsuitable for small samples. To achieve a narrower neutron beam profile, beam-shaping apertures such as cadmium slits are commonly employed. However, the slits will reduce the neutron intensity, resulting in an increase in the exposure time during the experiment [7]. To obtain a high gain, an additional optical system is required to precisely focus the neutrons onto the sample area. Here, gain is defined as the ratio of neutron intensity at the image plane with the optical focusing system to that obtained directly from the neutron guide without focusing.
The optical systems for collecting neutrons include the Wolter system [8,9,10,11], Montel system [12,13], KB system [14], ellipsoid system [15], and elliptical cylindrical system [16,17,18]. For point sources created by round aperture, the Wolter system, Montel system, KB system, and ellipsoid focusing system are widely used. For cadmium plates with a long slit, elliptical cylindrical mirrors are especially beneficial because they have fewer manufacturing difficulties and focus the beam efficiently while minimizing losses. Thus, the use of an elliptical cylindrical mirror can increase both the neutron intensity and gain at the sample position.
The gain of neutron intensity is influenced by three key factors: source size, mirror surface quality, and system misalignment. The neutron focusing gain varies with the source size because of the collecting area and critical angle limitations [7]. The mirror surface quality includes figure error and roughness. The figure error of the mirror can lead to the neutron beam broadening [19], and the surface roughness will reduce the reflectivity by scattering [16]. Even with high-precision mirrors, the performance of the mirror critically depends on an accurate alignment, which can cause variations in focusing intensity and location on the image plane. RIKEN has reported detailed fabrication methods of elliptical cylindrical mirrors that achieved a focused neutron beam spot of 0.13 mm, but the analysis was mainly limited to the influence of slope errors [18]. Lin et al. investigated the effect of misalignment on focusing performance [20], but their study primarily focused on mismatch. Although these studies reported the loss in neutron intensity or gain caused by different errors, respectively, the mirror performance is affected by the combined influences of surface figure errors, supermirror reflectivity, and misalignments in practice. However, the studies that combine multiple errors in neutron elliptical cylindrical mirrors remain limited. Therefore, a comprehensive error analysis is required to analyze these influences.
This paper presents the design, fabrication, alignment, and testing of an elliptical cylindrical focusing mirror, providing a comprehensive analysis of those errors. Section 2 presents the mathematical details of the focusing system simulations, using a 250-mm-long elliptical cylindrical focusing mirror as a case study. It evaluates how these errors affect peak gain. In Section 3, the simulations were performed to evaluate the independent effects of multiple errors on the peak gain. In Section 4, using the performance metrics obtained from the simulations in the previous sections, we present the fabrication process and dedicated neutron beamline test result of the mirror, and compare the measured performance with simulations results.
2. Analysis Model
The neutron reflector commonly employs a supermirror which is the multilayer that primarily extends the critical reflection angle. The critical angle can be derived from different supermirror models. The system parameters of the mirror are subsequently designed based on the critical angle. Since the model aims to precisely describe focusing performance, the reflectivity at each point on the mirror is calculated based on the incident angle, considering the slope error. The simulation of the focusing system follows three main steps, as shown in Figure 1. The first step involves defining system parameters: the source parameters include the source size, position, and divergence angle; the detector parameters include pixel size and position; and the mirror parameters include slope error, reflectivity, and misalignment. In the second step, the position coordinates of the incident neutron on the mirror surface are calculated, followed by the computation of the reflected vector and reflectivity. The third step involves the statistical analysis of these neutrons on the image plane to represent the intensity distribution. The peak gain value is the maximum gain, which serves as the metric for evaluating the focusing performance. This model was implemented using a self-developed MATLAB R2020a code, which has been validated in our previous X-ray optics work [21]. In addition, the ideal focusing performance was simulated using the McStas 3.5.12 software package [22], and the results are consistent with our simulations results.
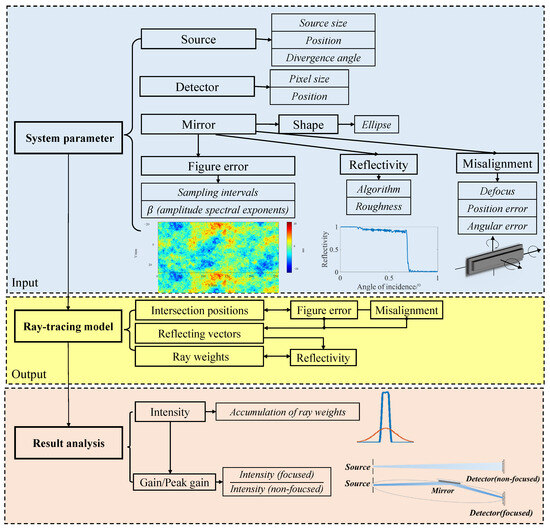
Figure 1.
A flowchart of the ray-tracing method. The flowchart consists of three sections: the input of the system parameters (source, detector, and mirror properties such as shape, figure error, reflectivity, and misalignment), the ray-tracing model (the calculation of intersections, reflections, and weights), and result analysis (the intensity distribution at the detector to quantitatively evaluate the focusing gain and peak gain).
2.1. Ray-Tracing Method
The optical path for elliptical cylindrical focusing is shown in Figure 2. The shape of the mirror is an elliptical cylinder, which can achieve focusing in one direction (one-dimensional focusing), and its shape is determined by one ellipse. The source slit and image plane are generally defined at the focal position of the elliptical mirror. The elliptic equation is as follows:
where a and b represent the lengths of the semi-major and semi-minor axes of the ellipse, respectively. The rays can be expressed by the parametric equation of a straight line in space:
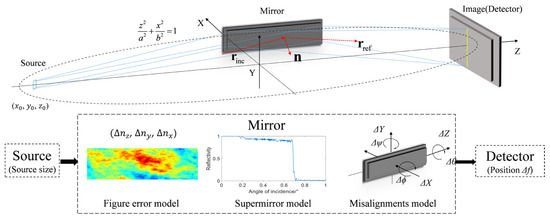
Figure 2.
The optical path for elliptical cylindrical focusing.
Here, x0, y0, and z0 are the coordinates of the source, which can be randomly sampled with a defined spatial region to simulate an extended source. The terms m, n, and p represent the direction components of the ray in the x, y, and z directions, respectively. The points of intersection between the rays and the mirror can be obtained as a function of t:
The intersections of the rays and mirror can be solved by Equation (3). The unit normal vector of the mirror (with slope error) n is expressed as follows:
where the , , and are the components of the unit normal vector with the mirror slope errors in the x, y, and z directions. The unit reflection vector can be expressed as :
where the is the unit incidence vector. For all the rays, the intersection points of rays and image plane can be calculated using the and the image distance. The image plane is divided in the focus direction into grids to count the number of rays.
2.2. The Reflectivity of the Supermirror
The reflectivity is affected by two factors: 1. The theoretical reflectivity of the multilayer, which is calculated by a supermirror algorithm; 2. Roughness leading to a decrease in reflectivity. The reflectivity of supermirror is calculated by a HM algorithm [23], and the thickness of the multilayer is as follows:
where k is the number of bilayers, and with Dc = 402, Ak can be expressed as follows:
where the A0 and A are both user-defined constants.
The reflectivity of the supermirror can be iteratively obtained by the formula of the single-layer film:
where the rm is generally expressed as the reflection coefficient from the layer-to-layer interface, and this reflection coefficient is calculated by Fresnel equations. The effect of roughness for the single-layer reflection coefficient is determined by the Nevot–Croce factor [24]:
where ZD is the rms value of the surface roughness. The q is the momentum transfer vector, where , and , λ is the neutron wavelength.
2.3. Figure Error Simulation
In the figure error model presented in this paper, the two-dimensional (2D) surface figure error can be represented as the summation of cosine functions at different frequencies, resulting in the 2D figure error expression as shown in Equation (10):
where m and n denote the indexes of the X and Y spatial frequency directions, respectively. The M and N are the numbers of frequencies in the X and Y directions, respectively. φ is the phase angle, which is taken as a random number from −π/2 to π/2. The random surface shows fractal characteristics [25,26], thus the spectral amplitude a(m,n) can be represented by Equation (10). The random figure error can be constructed by converting a random 2D power spectral density (PSD) into the corresponding surface figure error. G(m,n) is a random number, and the β is an exponential controlling the descent of the power spectral density (PSD) curve. Figure 3a is a randomly generated 2D PSD map. Figure 3b shows an example of converting a 2D PSD map into the corresponding surface figure error.
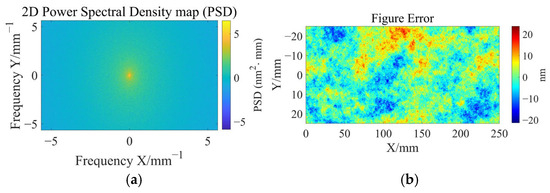
Figure 3.
(a) Randomly generated power spectral density map. (b) Height error map reconstructed from the 2D PSD map.
2.4. Misalignment Errors Simulation
The misalignment errors simulation is based on the positions of the source and detector, with the misalignment errors generated by rotating and moving the mirror around its center. As presented in Table 1, the model includes three positional errors and three rotational errors for the mirror, and the defocus of the image plane. These errors are illustrated in Figure 2. Positional error is defined as the error resulting from the movement of the mirror along a specific axis (ΔZ, ΔY, or ΔX). The angular error refers to the alignment error caused by rotating the mirror around its center. For a given axis of rotation, the rotational matrices Rz(θ), Ry(ψ), and Rx(ϕ) can be written as follows:

Table 1.
Possible misalignment during the assembly process.
Here, Δθ, Δϕ, and Δψ represent the angles of rotation in the Z-axis, X-axis, and Y-axis, respectively. The combined rotation matrix is subsequently applied to adjust the position and orientation vectors of the mirror. Misalignment errors affect both the incident angle and the position of the rays from the source, as well as the angle and position at which the detector receives the reflected rays. The adjusted rays are recalculated based on the new orientation of the mirror, which includes alignment errors. In practice, a negative sign is applied to the angle value during this operation. Using this reverse method, the mirror remains fixed, and misalignment errors are efficiently calculated in the simulations, ensuring accuracy while simplifying the mathematical implementation.
3. Simulation Result
3.1. Ellipse Parameters and Supermirror Reflectivity
The elliptical cylindrical mirror has been designed to focus neutrons on a dedicated beamline at the China Mianyang Research Reactor. The neutron originating from one focal point is reflected by the elliptical cylindrical mirror and converges at the other focal point. To increase neutron gain, we employed an m = 4 supermirror with 553 bilayers, which constrains the incident angle at the far end of the mirror to its critical angle of 0.673° (for a neutron wavelength of 0.17 nm). The object–image distance is 1700 mm due to the spatial constraint. The mirror has a length of 250 mm, a width of 50 mm, and is centered at the 125 mm position along the Z-axis. After establishing the boundary conditions for the mirror parameters, the ellipse parameters are defined as follows: a = 850.0536 mm, and b = 9.5430 mm. The basic mirror parameters are listed in Table 2.
Table 2.
The basic mirror parameters in simulations.
Additionally, the reflectivity of the supermirror is highly sensitive to both the surface roughness and the grazing incidence angle. Consequently, the relationship between the grazing incidence angle and reflectivity for different surface roughness values was simulated, as illustrated in Figure 4a. The influence of the surface roughness on peak gain can be observed in Figure 4b. As the surface roughness increases from 0.3 nm to 0.9 nm, the peak gain decreases by 13.3% for the 0.1 mm source and by 12.5% for the 1 mm source.
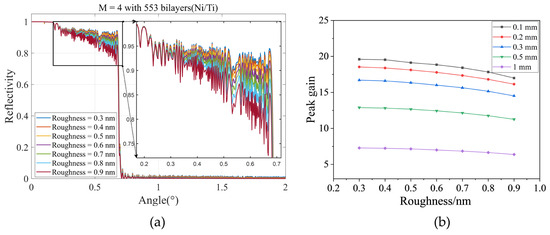
Figure 4.
(a) Reflectivity curves for neutron supermirrors with m = 4 at a wavelength of 0.17 nm and interface roughness of 0.3 nm to 0.9 nm (Ni/Ti multilayers). (b) The influence of the roughness on the peak gain for different slit widths (0.1 mm, 0.2 mm, 0.3 mm, 0.5 mm, and 1 mm). The horizontal axis represents roughness, and the vertical axis represents peak gain.
3.2. Source Size
The neutron source was defined by a series of cadmium slits, with slit widths ranging from 0.1 mm to 1 mm in the simulations. The divergence angle of the source is approximately 27 μrad according to the dedicated beamline test. Thus, the simulated rays with divergence angles in a ray-tracing model can be set as the random distribution at the entrance pupil of the slit. To analyze the intensity distribution influenced by the slit width, the slits with different widths have been traced as shown in Figure 5a. When the slit width is small enough, the focusing intensity is an approximately flat distribution. As the slit width increases, the focusing intensity exhibits an asymmetric trapezoidal distribution, as shown in Figure 5b. This asymmetry comes from the combined effects of coma aberration, which broadens the intensity profile, and the larger effective projection area of the lower half of the slit source, which increases the neutron intensity contribution on the negative side of the image plane. The black curve in Figure 5c presents the gain of an ideal surface with different source sizes, while the red curve shows the gain decrease caused by actual surface (60 μrad slope error, 0.5 nm roughness). According to the simulations result, the source size needs to be smaller than 1 mm for a gain larger than 6. The ideal peak gain value decreases approximately linearly as the source size increases, while the smaller source sizes are more easily influenced by the actual surface.
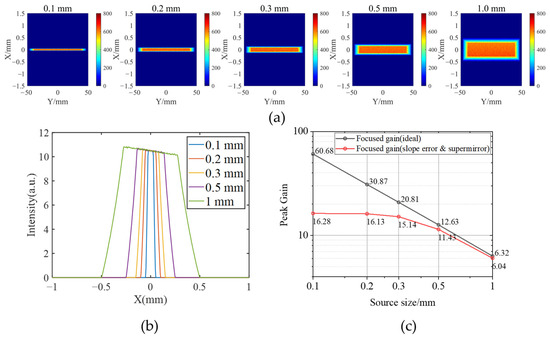
Figure 5.
(a) The intensity distribution of focused neutrons with different source sizes (0.1 to 1 mm), theoretically. (b) A line profile of the central intensity distribution. (c) The focused gain of ideal theory (blue) vs. realistic case with 60 μrad slope errors and a supermirror with 0.5 nm roughness (red).
3.3. Figure Error
To evaluate the gain decreases caused by figure errors, a random polishing surface figure error should be constructed first. Since slope errors directly influence the deviation of the reflection angle, the generated height errors are subsequently converted into slope errors by calculating the gradient at each pixel as shown in Equation (12). The slope errors will be applied in the ray-tracing simulations. According to Equation (10), the β-value is a parameter controlling the power spectral density (PSD) curve. The β-value is fixed to 1.15 based on the actual polishing surface. The pixel size 88.68 μm corresponds to the resolution of the interferometry, which is sufficient to represent the main practical slope error range of 0.2–2 mm reported in previous study [16].
Based on previous fabrication experience of neutron focusing mirrors, the typical slope error ranges [16] from tens to 200 μrad. Thus, the simulated slope error ranges from 0 to 330 μrad in Figure 6, while the gain initially declines slowly and then drops sharply as the slope error increases. For the 0.1 mm source size, the peak gain drops by nearly 90% relative to the ideal case when the slope error increases to 150 μrad. High gain for smaller sources require a better surface profile in practical manufacturing. In contrast, larger sources such as the 1 mm slit shows a significantly lower sensitivity to slope errors. The peak gain remains relatively stable and declines gradually over the full range of slope errors, which means it has a greater error tolerance of larger sources, though at the cost of peak gain.
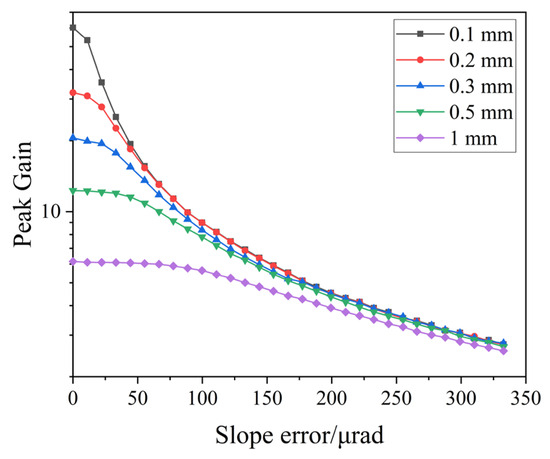
Figure 6.
The relationship between slope error and peak gain for five different slit widths (0.1 mm, 0.2 mm, 0.3 mm, 0.5 mm, and 1 mm). The horizontal axis represents the slope error, while the vertical axis represents the peak gain.
3.4. Misalignments
In this section, there are seven considered misalignment parameters in the simulations: defocus (Δf), three positional errors (ΔX, ΔY, and ΔZ), and three angular errors (Δϕ, Δψ, and Δθ). Figure 7 explains how 2D gain maps are constructed. Figure 7a shows simulated intensity profiles on the detector with different misalignments. These 1D intensity profiles from the detector are normalized by the non-focused intensity profile to calculate the gain profile along the X direction. The black tick in Figure 7b represents the X-axis position of each gain profile. These profiles are stacked to generate the 2D gain map shown in Figure 7b. The peak gain ratio is obtained by normalizing the peak gain under each misalignment condition to the reference peak gain without misalignments at the focal plane as shown in Figure 7c. This comparison allows for an evaluation of how much the gain is influenced by the misalignment. Figure 7d overlays the same gain ratio curve on the 2D map for a clearer visualization of gain trends. The peak gain without misalignments corresponds to the red line. The horizontal axis of subplots represents the error value, and the color bar indicates the gain value (relative to the non-focused rays). Figure 8, Figure 9 and Figure 10 follow the same conventions as described Figure 7.
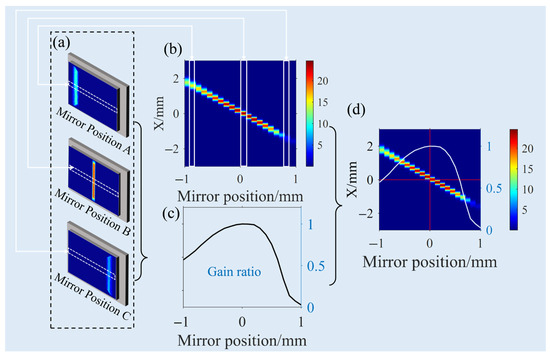
Figure 7.
The 2D image configuration of misalignments, (a) 2D intensity maps on the detector with different misalignments, (b) the 2D gain map, (c) the peak gain ratio, and (d) the final 2D gain map for one slit with different misalignments.
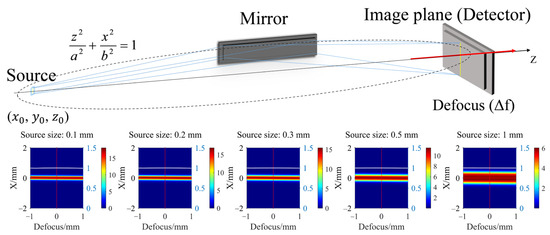
Figure 8.
The 2D gain map of reflected rays at different defocus errors (−1 mm to 1 mm).
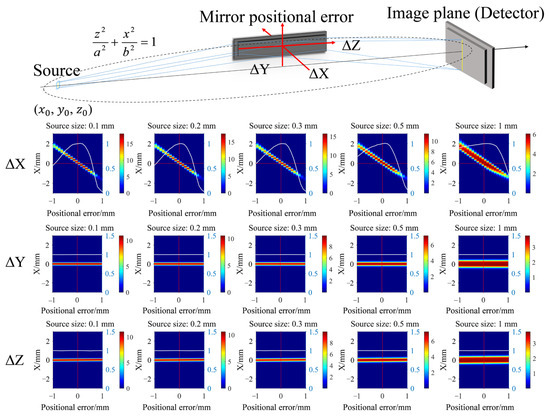
Figure 9.
The intensity distribution of reflected rays for different mirror positional errors. ΔX, ΔY, and ΔZ are the positional errors along X, Y, and Z directions, respectively.
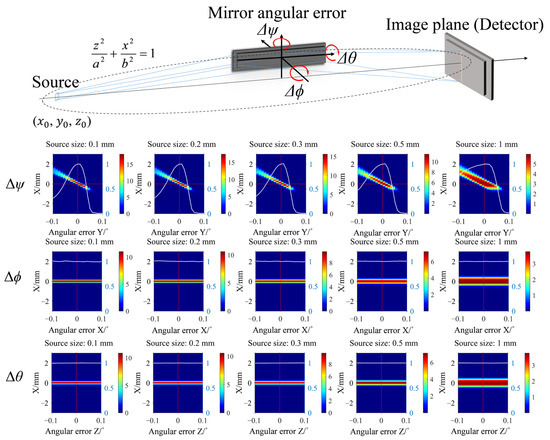
Figure 10.
The intensity distribution of reflected rays at different angular errors around the axis passing through the midpoint of the mirror (cw+, −0.1° to 0.1°). Δψ, Δϕ, and Δθ are the angular errors in Y, X, and Z directions, respectively.
3.4.1. Defocus Error
Theoretically, the image plane is set at the geometric focal plane. Figure 8 illustrates the defocus error of the image plane, defined as the positional offset along the positive or negative Z-axis from the focal plane (indicated by the red arrow). The detector positions are typically measured using a tape measure during rough alignment. Therefore, the positional accuracy was set to 1 mm (ranging from −1 mm to 1 mm). The results indicate that defocus error causes negligible effects on the gain, because the gain ratio represented by the white line remains constant.
3.4.2. Mirror Positional Error
Figure 9 illustrates the mirror positional errors along the X-axis (ΔX), Y-axis (ΔY), and Z-axis (ΔZ). The positional error range remains set at ±1 mm, the same as the defocus error in Section 3.4.1. The peak gain shows the highest sensitivity to positional error in the X-axis. For sources with a width smaller than 0.5 mm, the ΔX of 1 mm can result in up to a 90% loss in intensity due to the critical angle limitations. In contrast, the decrease in peak gain is less substantial compared to the positive X-direction when the mirror shifts in the negative X-direction. The negative positional error ΔX of 1 mm results in no more than a 50% decrease in peak gain, as off-axis rays partially compensate for this decrease. The larger source size shows less sensitivity to peak gain decrease under positional error, as shown in Figure 9. The positional error of the mirror along the Y-axis and Z-axis can also be seen from Figure 9, and the gain is insensitive to these errors, showing negligible variations in both the peak gain and gain profile.
3.4.3. Mirror Angular Error
The 2D gain profile and peak gain changes with angular errors are shown in Figure 10. The rotation center is located at the midpoint of the mirror length. The angular error ranges for the three axes are set from −0.1° to 0.1°, which is the standard alignment precision of laser autocollimators. As shown in Figure 10, the Δψ (angular error around the Y-axis) is a major factor causing the gain decrease. When the mirror rotates clockwise (positive, cw+), the profile of the reflected rays shifts downward, causing the rays to converge below the focal line. Due to a slight increase in the collection area, the intensity of the focused rays below the X-axis increases with small angular errors. However, clockwise angular errors cause some reflected rays to exceed the critical angle, resulting in a rapid loss in intensity when the angular error reaches 0.03°. In contrast, counterclockwise angular errors allow off-axis portions of the large source to focus by a reduction of the incidence angle, partially compensating for the loss in intensity. The influence of angular errors Δϕ and Δθ on the focusing gain is negligible and may be considered insignificant in practical applications.
The analysis indicates that the focusing performance of the elliptical cylindrical mirror is primarily influenced by two factors: the angular error around the Y-axis and the mirror positional error along the X-axis. The influence of defocus and mirror positional errors along the Z-axis can be considered negligible, as both the focal length and mirror position remain stable once measured and fixed during actual testing. Most experimental stages provide a positioning accuracy of 0.01 mm or rotational accuracy of 0.01°, so the angular error around the Y-axis is the most significant alignment factor.
4. Experiment Result
To manufacture a neutron mirror with a peak gain of 6, we conducted an optical design and tolerance analysis as outlined in Section 2 and Section 3. The results of the mirror tolerance analysis are summarized in Table 3. These include maintaining the mirror slope error below 70 μrad, surface roughness below 0.5 nm, positional error along the X-axis within ±1 mm, and angular misalignment (around the Y-axis) within −0.08° to 0.03°. Following the design parameters described in Section 2, an elliptical cylindrical focusing mirror was fabricated, following the manufacturing process illustrated in Figure 11. The aluminum substrates are increasingly preferred due to their superior machinability, radiation resistance, and the electroless nickel–phosphorus (Ni-P) alloy offers the advantage of achieving sub-nanometer surface quality. The substrate is made of aluminum alloy (A6061). Initially, the substrate is rough-formed by single-point diamond turning (SPDT). Subsequently, a 100 μm thick layer of the Ni-P alloy is plated on the cutting surface. The Ni-P alloy layer is suitable to diamond turning and can achieve sub-nanometer roughness after polishing. After nickel plating, slow tool servo machining achieved an initial surface figure error of 1528.49 nm RMS on the elliptical cylindrical substrate, measured by sub-aperture stitching interferometry. Magnetorheological finishing with 0.5 μm diamond powder reduced the error to 71.09 nm RMS and surface roughness to 0.8 nm RMS. Further iterative polishing with a cloth wheel pad and colloidal silica (10 nm particle size) lowered the roughness to 0.4 nm RMS, though the figure error increased to 95.63 nm RMS due to edge effects in polishing. The supermirror (m = 4) was deposited using a magnetron sputtering coating machine, with surface deterioration kept within acceptable limits. The final height error shown in Figure 11 was used for simulations, converted into the slope error to be used in the model for further calculations.
Table 3.
The error tolerances analysis results for the elliptical cylindrical focusing mirror.
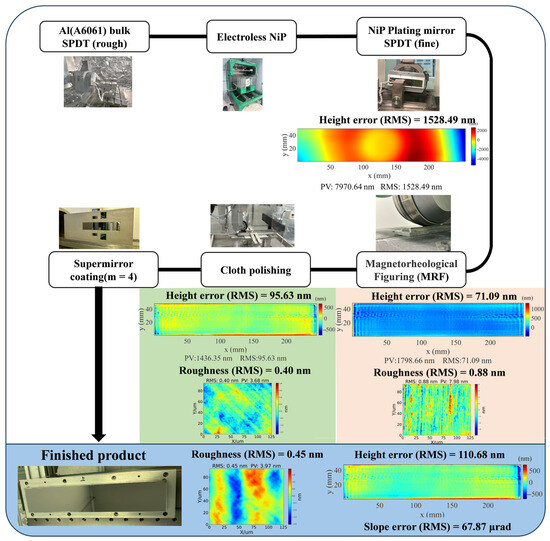
Figure 11.
The manufacturing process steps of the mirror.
The mirror was mounted on a stacked multi-axis stage for testing as shown in Figure 12. In this test, three cadmium slits (0.1 mm, 0.3 mm, and 1 mm) were placed at the guide exit to serve as the slit source, so that the gain of different slit sizes could be compared. The neutron divergence angle at the guide exit is about 1.57°. The mirror was positioned vertically on the stage. This vertical orientation was selected to be the same as the situation when measuring the surface height error by interferometry, ensuring consistency in the surface figure error. Additionally, the horizontal rotation stage of the sample was centered with the mirror to avoid errors caused by the rotation radius of the rotation stage.
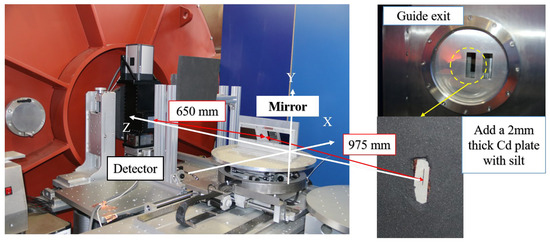
Figure 12.
The focusing mirror in the dedicated beamline-testing side view. The focusing mirror is positioned on the round platform on a rotation stage, with a laser emitted inside the guide (along the red line) to assist in the alignment of the slit, focusing mirror, and detector. The distance from the guide exit to the mirror is 975 mm, and the distance from the mirror to the detector is 650 mm. The 2 mm thick cadmium plate with a cadmium slit was mounted at the guide exit to define the source size for the experiment.
The testing results are presented in Figure 13a and show the direct beam in CCD, and Figure 13b shows the image after mirror focusing under the same exposure time. Because of the non-uniform intensity distribution in the direct beam, the peak gain was calculated by comparing the peak intensity of the focused beam with the average intensity of the corresponding region in the direct beam. Due to site constraints, the actual focal length was limited to 650 mm (image position is 775 mm in coordinate as white line shown in Figure 12).
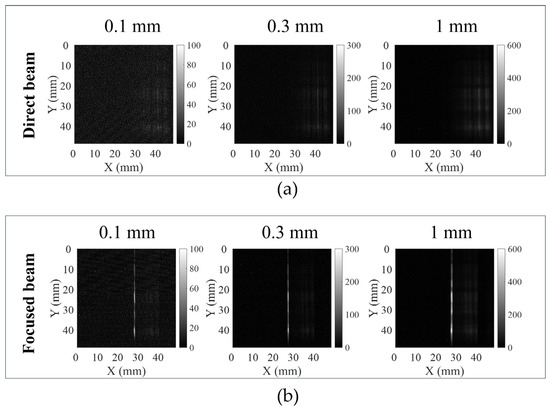
Figure 13.
The 2D image on the CCD: (a) the direct beam; (b) the focused beam for three cadmium slit widths (0.1 mm, 0.3 mm, and 1 mm), respectively.
This parameter was incorporated into the simulations, and the resulting gain plot is presented in Figure 14. For the smallest slit width of 0.1 mm, the peak gain was highest in all conditions with 13.29 in simulations and 12.77 in experimental data. As the slit width increased to 0.3 mm, the peak gain reduced to 12.59 in simulations and 12.29 in experimental data. At the largest slit width of 1 mm, the peak gain further dropped to 7.91 for simulations and 7.66 for the experimental data. The gain values obtained from the calculations demonstrate a consistent trend as illustrated in Figure 14. For slit widths of 0.1 mm, 0.3 mm, and 1 mm, the standard error of the rotation stage accuracy in the simulations was 0.50, 0.43, and 0.06, respectively. The relative errors between the experiment and the simulations were 3.9%, 2.4%, and 3.2% for 0.1 mm, 0.3 mm, and 1 mm slits, respectively.
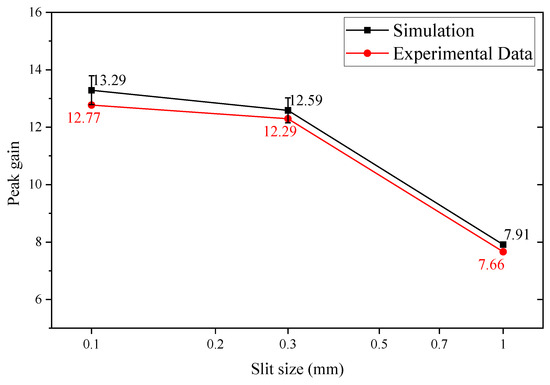
Figure 14.
A comparison of the peak gain values obtained from simulations and experimental data with 0.1 mm, 0.3 mm, and 1 mm slits in the 650 mm focal length. The black squares indicate the gain values from simulations incorporating the real parameters (including object distance, image distance, roughness, surface figure errors, and supermirror reflectivity), and the red circles correspond to the experimental peak gain. The standard error of gain caused by the accuracy of the rotation stage around Y (0.006°) correspond to the error bar with a black square.
The difference between simulated and experimental gain values is more obvious for smaller source sizes. For larger source sizes, the simulated gain more closely approximates the experimental results. As shown in Section 3.4, the large source has a better robustness to misalignments, which makes the simulations and experimental test results at 1 mm have a smaller difference. The decreasing standard error with larger slit widths shows a consistent trend. For a 1 mm source, the gain is larger than 6, possibly because defocusing increases the peak intensity and partially offsets the gain loss. Additionally, surface figure errors introduced during assembly may further reduce the peak gain for small slit sources.
5. Conclusions
This paper presents the comprehensive error analysis of an elliptical cylindrical focusing mirror. The simulations reveal that smaller source sizes tend to produce higher gains. Increasing surface roughness causes a similar reduction in gain across different source sizes. Slope error reduces gain more significantly for smaller sources. Among all types of misalignments, the angular error around the Y-axis affects focusing performance the most. To quantify these influences, the simulations show that increasing surface roughness from 0.3 nm to 0.9 nm reduces reflectivity, resulting in an approximately 12.5% decrease in gain across source sizes. For a 0.1 mm source, slope errors above 100 μrad can reduce gain by nearly 90%, whereas the 1 mm source shows a more gradual loss. For misalignment, the angular error around the Y-axis must be kept below 0.03°.
Based on the tolerances of simulations, a 250 mm elliptical cylindrical mirror was fabricated with a surface figure error of 110 nm RMS and a roughness below 0.5 nm RMS, and coated with an m = 4 supermirror. This mirror was tested on the dedicated beamline of the Chinese Mianyang Research Reactor. The experimental peak gain reached 12.77 for a 0.1 mm source and remained above 7 for a 1 mm source. The dedicated beamline tests using slits of 0.1, 0.3, and 1 mm demonstrated a good match with the simulations. Thus, the gain results validated the reliability of the comprehensive error analysis for the neutron elliptical cylindrical mirror. The comprehensive analysis method will enhance the manufacturing and alignment processes in high-gain neutron focusing applications.
Supplementary Materials
The following supporting information can be downloaded at: https://www.mdpi.com/article/10.3390/photonics12060580/s1, The ideal focusing configuration McSTAS code.
Author Contributions
Conceptualization, W.G.; methodology, W.G., P.S. and Q.W.; project administration, Z.Z. and Z.W.; resources, W.S., Z.C. and Z.S.; software, W.G.; supervision, J.Y., P.S. and Z.W.; validation, F.T., Q.Z. and P.C.; visualization, W.G.; writing—original draft, W.G.; writing—review and editing, J.Y., P.S. and Z.W. All authors have read and agreed to the published version of the manuscript.
Funding
This work is supported by National Key R&D Program of China (2022YFF0709101) and China National Space Administration (D010303).
Institutional Review Board Statement
Not applicable.
Informed Consent Statement
Not applicable.
Data Availability Statement
The raw data supporting the conclusions of this article will be made available by the authors on request. The ideal focusing configuration McSTAS code is in the Supplementary Materials.
Acknowledgments
The authors thank Zongyue Wang from CMRR for his guidance in the use of neutron-related instrumentation. During the preparation of this manuscript, the authors used ChatGPT 4o for the purposes of grammar and structure. The authors have reviewed and edited the output and take full responsibility for the content of this publication.
Conflicts of Interest
The authors declare no conflicts of interest.
References
- Russell, T.P. X-ray and neutron reflectivity for the investigation of polymers. Mater. Sci. Rep. 1990, 5, 171–271. [Google Scholar] [CrossRef]
- Majkrzak, C.F.; Felcher, G.P. Neutron Scattering Studies of Surfaces and Interfaces. MRS Bull. 1990, 15, 65–72. [Google Scholar] [CrossRef]
- Stahn, J.; Panzner, T.; Filges, U.; Marcelot, C.; Böni, P. Study on a focusing, low-background neutron delivery system. Nucl. Instrum. Methods Phys. Res. Sect. A Accel. Spectrometers Detect. Assoc. Equip. 2011, 634, S12–S16. [Google Scholar] [CrossRef]
- Stahn, J.; Filges, U.; Panzner, T. Focusing specular neutron reflectometry for small samples. Eur. Phys. J. Appl. Phys. 2012, 58, 11001. [Google Scholar] [CrossRef]
- Zendler, C.; Nekrassov, D.; Lieutenant, K. An improved elliptic guide concept for a homogeneous neutron beam without direct line of sight. Nucl. Instrum. Methods Phys. Res. Sect. A Accel. Spectrometers Detect. Assoc. Equip. 2014, 746, 39–46. [Google Scholar] [CrossRef]
- Schanzer, C.; Böni, P.; Filges, U.; Hils, T. Advanced geometries for ballistic neutron guides. Nucl. Instrum. Methods Phys. Res. Sect. A Accel. Spectrometers Detect. Assoc. Equip. 2004, 529, 63–68. [Google Scholar] [CrossRef]
- Yamada, N.L.; Hosobata, T.; Nemoto, F.; Hori, K.; Hino, M.; Izumi, J.; Suzuki, K.; Hirayama, M.; Kanno, R.; Yamagata, Y. Application of precise neutron focusing mirrors for neutron reflectometry: Latest results and future prospects. J. Appl. Crystallogr. 2020, 53, 1462–1470. [Google Scholar] [CrossRef]
- Liu, D.; Gubarev, M.V.; Resta, G.; Ramsey, B.D.; Moncton, D.E.; Khaykovich, B. Axisymmetric grazing-incidence focusing optics for small-angle neutron scattering. Nucl. Instrum. Methods Phys. Res. Sect. A Accel. Spectrometers Detect. Assoc. Equip. 2012, 686, 145–150. [Google Scholar] [CrossRef]
- Khaykovich, B.; Gubarev, M.V.; Zavlin, V.E.; Katz, R.; Resta, G.; Liu, D.; Robertson, L.; Crow, L.; Ramsey, B.D.; Moncton, D.E. Novel neutron focusing mirrors for compact neutron sources. Phys. Procedia 2012, 26, 299–308. [Google Scholar] [CrossRef]
- Gubarev, M.V.; Ramsey, B.D.; Engelhaupt, D.E.; Burgess, J.M.; Mildner, D.F.R. An evaluation of grazing-incidence optics for neutron imaging. Nucl. Instrum. Methods Phys. Res. Sect. B-Beam Interact. Mater. At. 2007, 265, 626–630. [Google Scholar] [CrossRef]
- Wu, H.; Khaykovich, B.; Wang, X.; Hussey, D.S. Wolter mirrors for neutron imaging. Phys. Procedia 2017, 88, 184–189. [Google Scholar] [CrossRef]
- Ice, G.E.; Choi, J.Y.; Takacs, P.Z.; Khounsary, A.; Puzyrev, Y.; Molaison, J.J.; Tulk, C.A.; Andersen, K.H.; Bigault, T. Nested neutron microfocusing optics on SNAP. Appl. Phys. A 2010, 99, 635–639. [Google Scholar] [CrossRef]
- Ice, G.E.; Pang, J.W.L.; Tulk, C.; Molaison, J.; Choi, J.Y.; Vaughn, C.; Lytle, L.; Takacs, P.Z.; Andersen, K.H.; Bigault, T. Design challenges and performance of nested neutron mirrors for microfocusing on SNAP. J. Appl. Crystallogr. 2010, 42, 1004–1008. [Google Scholar] [CrossRef]
- Ice, G.E.; Hubbard, C.R.; Larson, B.C.; Pang, J.W.L.; Budai, J.D.; Spooner, S.; Vogel, S.C.; Rogge, R.B.; Fox, J.H.; Donaberger, R.L. High-performance Kirkpatrick-Baez supermirrors for neutron milli- and micro-beams. Mater. Sci. Eng. A 2006, 437, 120–125. [Google Scholar] [CrossRef]
- Yang, Y.; Qi, R.; Zhang, Z.; Yao, Y.; Ni, H.; Wang, Z.; Wu, H.; Wang, X. Ni-Ti supermirror coated onto a curved substrate for nested neutron-focusing optics. Nucl. Instrum. Methods Phys. Res. Sect. A Accel. Spectrometers Detect. Assoc. Equip. 2021, 986, 164752. [Google Scholar] [CrossRef]
- Hosobata, T.; Yamada, N.L.; Hino, M.; Yamagata, Y.; Kawai, T.; Yoshinaga, H.; Hori, K.; Takeda, M.; Takeda, S.; Morita, S.-Y. Development of precision elliptic neutron-focusing supermirror. Opt. Express 2017, 25, 20012–20024. [Google Scholar] [CrossRef]
- Schanzer, C.; Böni, P.; Schneider, M. High Performance Supermirrors on Metallic Substrates. J. Phys. Conf. Ser. 2010, 251, 012082. [Google Scholar] [CrossRef]
- Hosobata, T.; Yamada, N.L.; Hino, M.; Yoshinaga, H.; Takeda, S. Elliptic neutron-focusing supermirror for illuminating small samples in neutron reflectometry. Opt. Express 2019, 27, 26807. [Google Scholar] [CrossRef]
- Yao, Y.; Xie, C.; Huang, Q.; Zhang, Z. Simulation of the collimation property of parabolically curved graded multilayer mirror. Opt. Commun. 2018, 410, 361–368. [Google Scholar] [CrossRef]
- Lin, J.Y.Y.; Huegle, T.; Coates, L.; Stoica, A.D. A realistic guide misalignment model for the Second Target Station instruments at the Spallation Neutron Source. Nucl. Instrum. Methods Phys. Res. Sect. A-Accel. Spectrometers Detect. Assoc. Equip. 2023, 1047, 167881. [Google Scholar] [CrossRef]
- Yao, Y.; Zhang, Z.; Yi, S.; Zhang, Z.; Xie, C. Computer-aided assembly of X-ray parabolic cylinder laterally graded multilayer reflector to collimate divergent beam in XRD. Nucl. Instrum. Methods Phys. Res. Sect. A Accel. Spectrometers Detect. Assoc. Equip. 2018, 906, 22–29. [Google Scholar] [CrossRef]
- Lefmann, K.; Nielsen, K. McStas, a general software package for neutron ray-tracing simulations. Neutron News 1999, 10, 20–23. [Google Scholar] [CrossRef]
- Hayter, J.B.; Mook, H.A. Discrete Thin-Film Multilayer Design for X-Ray and Neutron Supermirrors. J. Appl. Crystallogr. 1989, 22, 35–41. [Google Scholar] [CrossRef]
- Croce, P.; Névot, L. Étude des couches minces et des surfaces par réflexion rasante, spéculaire ou diffuse, de rayons X. Rev. De Phys. Appl. 1976, 11, 113–125. [Google Scholar] [CrossRef]
- Church, E.L.; Takacs, P.Z. Specification of surface figure and finish in terms of system performance. Appl. Opt. 1993, 32, 3344–3353. [Google Scholar] [CrossRef]
- Bjorn, S. How to Generate Random Surfaces in COMSOL Multiphysics. Available online: https://www.comsol.com/blogs/how-to-generate-random-surfaces-in-comsol-multiphysics#ref1 (accessed on 3 June 2025).
Disclaimer/Publisher’s Note: The statements, opinions and data contained in all publications are solely those of the individual author(s) and contributor(s) and not of MDPI and/or the editor(s). MDPI and/or the editor(s) disclaim responsibility for any injury to people or property resulting from any ideas, methods, instructions or products referred to in the content. |
© 2025 by the authors. Licensee MDPI, Basel, Switzerland. This article is an open access article distributed under the terms and conditions of the Creative Commons Attribution (CC BY) license (https://creativecommons.org/licenses/by/4.0/).