Abstract
This paper presents a new high-speed RGB image transmission system over Free-Space Optics (FSO) channel employing Optical Code Division Multiple Access (OCDMA) with Permutation Vector (PV) codes. Four RGB images are transmitted simultaneously at 10 Gbps per image, achieving a total capacity of 40 Gbps. The system’s performance is evaluated under various atmospheric conditions, including three fog levels and real-world visibility data from Alexandria city, Egypt. Image Quality Assessment (IQA) metrics, including Signal-to-Noise Ratio (SNR), Root Mean Square Error (RMSE), Peak Signal-to-Noise Ratio (PSNR), correlation coefficients, and Structural Similarity Index Measure (SSIM), are evaluated for both unfiltered and median-filtered images. The results show significant degradation in image quality due to transmission distance and atmospheric attenuation. In Alexandria’s clear atmospheric conditions, the system achieves a maximum transmission range of 15 km with acceptable visual quality, while the range is reduced to 2.6 km, 1.6 km, and 1 km for Low Fog (LF), Medium Fog (MF), and Heavy Fog (HF), respectively. At these distances, the RGB images achieve minimum SNR, RMSE, and SSIM values of 7.27 dB, 47.66, and 0.20, respectively, with further improvements when applying median filtering.
1. Introduction
Telecommunications development has been substantially accelerated by the stringent requirements of 6G networks, including the need for high data throughput, extremely low latency, and support for a massive number of simultaneous connections [1,2,3]. Free-Space Optical (FSO) communication, a form of optical wireless communication, offers a potential solution to some limitations of Radio Frequency (RF) technology, such as the “last-mile” bottleneck in 4G/5G networks. FSO license-free spectrum and theoretically unlimited bandwidth potential translate to cost-effective solutions. Commercial FSO systems currently offer data rates up to 10 Gbps, coupled with benefits such as ease of installation, enhanced security, and freedom from RF interference [4]. FSO offers a viable alternative or backup to Optical Fiber Communication (OFC) in challenging terrains such as mountainous, hilly, or maritime environments where fiber cable installation is impractical or prohibitively expensive [5]. Information transmission in FSO relies on atmospheric propagation, necessitating a direct Line of Sight (LoS) connection between the transmitter and receiver [6]. The rollout of 6G networks is expected to leverage FSO’s capabilities for high-speed backhaul connections, enabling seamless communication between small cell units, unmanned aerial vehicles, and satellite-based systems [7]. Atmospheric absorption and other environmental factors significantly influence the choice of operating wavelength in FSO communication systems. To reduce signal attenuation, commercial FSO systems are designed to operate within atmospheric transmission windows characterized by low absorption. The 1550 nm wavelength band is a popular choice, offering a combination of low attenuation and high photodetector sensitivity at the receiver [8].
The performance of FSO communication systems is heavily influenced by atmospheric attenuation. This attenuation is primarily caused by two mechanisms, absorption and scattering, which result from the interaction of light with atmospheric constituents, such as water vapor, aerosols, and precipitation. Absorption, which occurs due to molecular resonances, varies with wavelength, with some spectral regions exhibiting reduced attenuation. Scattering, influenced by the size and concentration of particles in the atmosphere, generates both forward and backward scattering effects. Together, absorption and scattering lead to a considerable decrease in the received optical power and an increase in bit error rate, especially over long distances or during challenging weather conditions such as fog, rain, or snow [9].
Optical Code Division Multiple Access (OCDMA) presents an efficient multiple-access technique for optical communication networks, allowing for multiple users to concurrently access a shared optical channel with minimal mutual interference. This is accomplished through the assignment of distinct optical codes to each user, which enhances both network capacity and data security. The orthogonal nature of these codes facilitates effective signal separation at the receiver, even when multiple users transmit on the same wavelength, thereby reducing cross-talk effects [10]. OCDMA’s inherent support for low-latency multi-user access positions it as a pivotal technology in addressing the increasing bandwidth demands of future optical communication systems. Additionally, in [11], analog orthogonal frequency division multiplexing (OFDM) was utilized in conjunction with electrical code division multiple access (ECDMA) in passive optical networks (PONs). Recent advances in frequency-referenced multiplexing for scalable low-latency user–cloud communication, as demonstrated in [12], highlight the growing demand for high-capacity optical systems, which also motivates continued explorations of alternative access technologies, such as OCDMA, in specialized applications.
The reliable and efficient transmission of digital images is essential in a wide range of applications, including medical imaging, remote sensing, video conferencing, and entertainment. Among the available transmission technologies, optical communication systems offer distinct advantages, primarily due to their high bandwidth and low latency characteristics. These attributes enable the rapid and accurate transfer of large image datasets, which is particularly vital for real-time applications. Regardless of whether OFC or FSO communication is employed, these systems facilitate long-distance transmission with minimal signal loss, making them highly applicable in fields such as healthcare, surveillance, and high-speed data networks [13,14,15].
1.1. Related Work
Recent works have explored the effects of atmospheric conditions on image quality during transmission. Djir et al. [16] investigated the impact of rain attenuation on RGB image transmission using on–off keying (OOK) modulation. Transmission performance was assessed across varying transmit powers and rain intensities. The results indicate that increasing transmit power from 10 mW to 15 mW extended the transmission range to 0.49 km under moderate rain and 0.34 km under heavy rain. The study also explored the application of median and Wiener filtering for spatial domain image restoration at a transmit power of 10 mW. The results show that, under moderate rain conditions, the RGB image could be transmitted up to 2.640 km and 1.925 km when the median filter was applied. In comparison, the application of the Wiener filter resulted in achievable transmission ranges of 2.35 km under moderate rain and 1.75 km under heavy rain conditions.
Abd El-Mottaleb et al. [17] introduced an innovative gray-scale image encryption technique that leverages the Choquet Fuzzy Integral (CFI) in conjunction with the integer wavelet transform to bolster security and robustness under adverse weather conditions, particularly rainfall. The study validated the practical applicability of this method using meteorological data from Alexandria, Egypt, and Jeddah, Saudi Arabia, highlighting a strong correlation between rainfall intensity and the effective propagation range of the encrypted images. Performance evaluation metrics, including Signal-to-Noise Ratio (SNR), Peak Signal-to-Noise Ratio (PSNR), and the Structural Similarity Index Measurement (SSIM), demonstrated that decreasing rainfall intensity leads to a marked improvement in the FSO channel’s propagation range. Specifically, under light rain conditions, the system achieved a maximum FSO range of 2.29 km, while heavy rain reduced the range to 1.055 km. The corresponding SNR, PSNR, and SSIM values were recorded at 17.3 dB, 17.7 dB, and 0.4, respectively.
Djir et al. [13] conducted a comparative analysis of Quadrature Phase Shift Keying (QPSK) and OOK for the transmission of RGB images over FSO links under varying weather conditions. Their findings indicated that QPSK exhibited superior performance to OOK, enabling longer transmission distances for RGB image transmission. Moreover, increasing the transmit power and reducing the beam divergence significantly enhanced system performance, particularly in foggy conditions. Specifically, the communication range was extended by up to 0.23 km in Medium Fog (MF) and 0.1 km in Heavy Fog (HF).
Huang et al. [15] developed a numerical simulation model to assess the influence of atmospheric turbulence and detector noise on image transmission over a 1 km FSO link. The model evaluated the received image’s PSNR, identifying critical values of turbulence strength and noise level. Djir et al. [18] investigated the impact of varying fog densities on color image transmission using both the Kim and Kruse fog attenuation models. The results revealed a notable decline in image quality as the transmission distance increased. Furthermore, the Kruse model predicted slightly longer maximum transmission distances for maintaining acceptable image quality compared to the Kim model.
While prior research on FSO image transmission has largely concentrated on single-image transmission, this work explores the simultaneous transmission of four distinct images, each encoded with a unique permutation vector (PV) code sequence. This approach aims to demonstrate the capacity-enhancing and security potential of OCDMA in FSO systems.
1.2. Contribution
This paper presents a novel FSO system for RGB image transmission employing OCDMA. The key contributions are as follows:
- Simultaneous transmission of four distinct RGB images (lighthouse, peppers, kopi, and llama) at 10 Gbps, each encoded with a unique PV code sequence.
- Evaluation of system performance under various fog conditions.
- Validation of the system’s real-world applicability using real-world visibility data from Alexandria, Egypt.
- Application of median filtering for spatial domain image restoration.
- Comprehensive performance evaluation using PSNR, SNR, correlation coefficients, Root Mean Square Error (RMSE), and SSIM as image quality assessment (IQA) metrics.
1.3. Paper Organization
The paper is structured in six sections, as follows. Section 2 offers a concise overview of the atmospheric attenuation in FSO channels caused by fog and includes visibility data from Alexandria, Egypt. Section 3 delves into the construction process of PV codes. Section 4 presents the proposed FSO/OCDMA system for RGB image transmission, including its architecture, performance metrics, and image quality assessment techniques. Section 5 provides an analysis of the system’s performance under varying atmospheric conditions, along with the impact of median filtering as an image enhancement technique. Finally, concluding remarks and directions for future research are presented in Section 6.
2. Attenuation in FSO Channel Due to Foggy Channels
Fog is a significant environmental factor affecting the performance of FSO communication systems, primarily due to its impact on signal attenuation. In foggy conditions, the presence of water droplets causes Mie scattering, which leads to substantial optical power loss [19]. In dense marine fog and moderately dense continental fog, optical signal attenuation can be as high as 130 dB/km [20]. Attenuation is strongly influenced by factors such as fog density, wavelength, and propagation distance. Several predictive models, including the Kim and Kruse models, have been developed to estimate fog-induced attenuation; however, their accuracy varies depending on the specific characteristics of the fog conditions [19]. In this study, Kim model is considered, and the attenuation is calculated as follows [21]:
where is the attenuation in dB/km, denotes the operating wavelength in nm, and is the visibility range in km. The symbol indicates the distribution size of the scattering particles and is expressed as follows [21]:
This study includes three levels of fog density, defined by their corresponding V and : Low Fog (LF), with V = 1.059 km and an attenuation of 9 dB/km; Medium Fog (MF), with V = 0.788 km and an attenuation of 16 dB/km; and High Fog (HF), with V = 0.657 km and an attenuation of 22 dB/km [10].
Moreover, meteorological visibility data for Alexandria, Egypt (January 2023–December 2023), are obtained from https://www.worldweatheronline.com/ (accessed on 1 October 2024) and are shown in Figure 1.
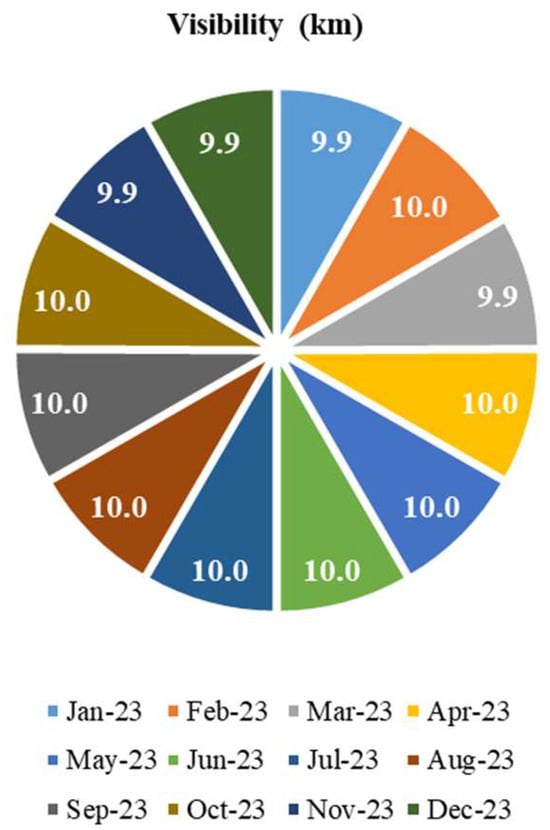
Figure 1.
Visibility data for Alexandria, Egypt (January 2023–December 2023).
The average visibility in Alexandria, Egypt, over the year is 9.97 km, and after substituting this into Equations (1) and (2), an attenuation of 0.44 dB/km is calculated.
3. PV/OCDMA Code Construction
In this study, PV code, which is one type of OCDMA code, is considered. This code is characterized by code length, , number of channels, , code weight, , and unity cross-correlation [22]. Algorithm 1 shows the construction of the PV code matrix with dimensions of .
| Algorithm 1 Construction of the PV code | |
| Input, , Dimension of vector space g | |
| Output: PV code matrix PV of size | |
| 1: | Initialize: |
| 2: | using: |
| 3: | Define the vector space M of dimension g as: |
| = , where | |
| 4: | Represent linear combination of basis vectors: |
| as a linear combination: | |
| = , where are standard basis vectors | |
| 5: | Define linear transformation: |
| , define the linear transformation as: | |
| 6: | Matrix form of transformation: |
| Represent the linear transformation in matrix form: | |
| 7: | Construct permutation matrix PM: |
| or : | |
| 8: | Construct matrix PV: |
| “P times to generate the matrix PV. The resulting PV code matrix has a dimension of and its construction depends on and can be represented as: | |
| PV = , where denotes the set of repeated identity vectors. | |
| 9: | Calculate all possibilities of matrix PV: |
| 10: | Return PV |
In this study, the values of and are set to 4 and 2, respectively, resulting in . The number of possible PV code combinations is 28. By following Algorithm 1, the PV matrices can be evaluated as
Here, the possible of PV matrix is considered in the proposed RGB image transmission system.
4. Proposed RGB Image Transmission System in FSO/OCDMA Utilized PV Code
The design of the FSO/OCDMA system for RGB image transmission, utilizing PV codes, is depicted in Figure 2.
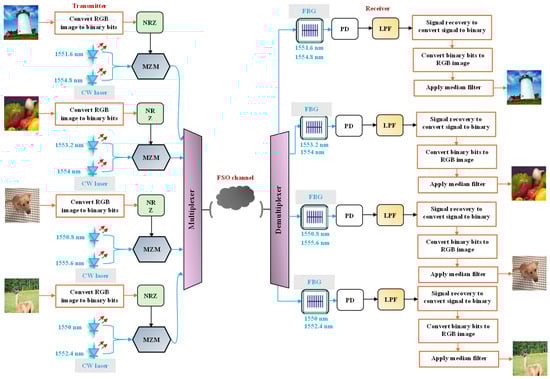
Figure 2.
Schematic diagram of proposed RGB image transmission system in FSO/OCDMA Utilized PV Code.
It consists of the following:
4.1. Transmitter
The transmission process begins with the acquisition and binarization of four distinct 128 × 128 × 3 pixel RGB images. Unipolar OOK-NRZ modulation at a 10 Gbps data rate is then applied to each resulting binary data stream. The mathematical expression for the resulting NRZ signal, , is given as follows [16]:
where and T(t) are the amplitude symbol and the rectangular pulse shape, respectively. is the bit duration and is equal to (1/), where denotes the bit rate. Each RGB image is transmitted using a unique PV code sequence. Continuous-wave (CW) lasers generate the optical signals corresponding to each PV code sequence; a specific wavelength represents a ‘1’ bit, while the absence of a wavelength represents a ‘0’ bit. For instance, the RGB lighthouse image, encoded with the PV code sequence ‘00100010’, utilizes two CW lasers. Table 1 lists the RGB images, their associated PV code sequences, and their corresponding wavelengths.

Table 1.
Four RGB images with associated PV code sequences and corresponding wavelengths.
A Mach–Zehnder modulator (MZM) maps the OOK-NRZ encoded electrical signal onto the optical carrier corresponding to the PV code sequences. The resultant signal from MZM is expressed as follows:
where , , and , are the amplitude of optical carrier, the optical carrier frequency equal to (3 × ), and time, respectively. is the half-wave voltage of the MZM.
The four optical signals, each carrying a different RGB image, are multiplexed before transmission over the FSO channel.
4.2. FSO Channel
The signal propagates through the FSO channel, experiencing variable atmospheric attenuation due to the fog and visibility conditions prevalent in Alexandria, Egypt (as detailed in Section 2).
After propagating in FSO channel, the signal received with received optical power expressed as follows [22,23]:
where (dBm) is the power emitted by the transmitter and (cm) is the aperture diameter at the transmitter. (dBm) is the received optical power and (cm) is the diameter of the receiver’s aperture. The beam divergence angle is denoted as (mrad), while the FSO link distance is given by in km.
The signal after traversing through the FSO channel undergoes attenuation, and its representation is given as follows:
4.3. Receiver
The received signal is separated into four individual signals, each associated with one of the four channels, using distinct PV code sequences. The receiver block for each channel consists of two Fiber Bragg Gratings (FBGs), which are tuned to the wavelengths corresponding to the CW lasers at the transmitter. A Photodiode (PD) is used to convert the optical signal into an electrical signal, followed by a Low-Pass Filter (LPF) to eliminate unwanted frequencies. A signal recovery component converts the electrical signal into a binary sequence, which is then passed to an image reconstruction module that reassembles the image. Finally, the reconstructed image is subjected to a median filter for improving the image quality primarily by reducing noise that may arise during image transmission over distorted FSO channels, particularly under challenging weather conditions and enhancing the spatial domain image. Unlike linear filters, median filtering is a nonlinear technique that preserves image edges while effectively removing isolated high or low-intensity pixels that deviate significantly from their surrounding neighborhood. This leads to cleaner, more visually coherent images without significant loss of structural details. In our simulations, applying median filtering at the receiver end helped restore the spatial consistency of RGB images degraded by attenuation caused by foggy weather, thereby enhancing IQA metrics (PSNR, SNR, SSIM) and perceptual quality.
4.4. Performance Evaluation Metrics
The IQA is a critical aspect of image processing, involving several metrics to evaluate how closely a received image resembles the transmitted image (original) [17,23]. In this study, image quality is assessed using PSNR, SNR, RMSE, the correlation coefficient, and histograms.
The SNR measures the ratio of signal power (original RGB image transmitted) to noise power (received RGB image), providing a straightforward assessment of image fidelity. It can be expressed as follows [13,14]:
where A and B represent the dimensions of the images in pixels, both are set to a value of 128 in this study. The pixel value at the coordinates in the original RGB image is denoted as , whereas indicates the pixel value at the same coordinates in the received RGB image.
A quantitative measure of image processing error is given by the Mean Square Error (MSE), which averages the squared differences between the original transmitted and processed received RGB images pixel values. It can be expressed as follows [13,14]:
The RMSE is derived from the MSE by taking the square root of its value. While both the MSE and RMSE quantify discrepancies between the original and processed images, the RMSE provides a more intuitive measure due to its consistent units with pixel values.
The PSNR metric measures the disparity between the pixel values of the original RGB image and those of the received RGB image, utilizing the MSE as a basis. A greater PSNR value signifies improved image quality and reduced distortion. The PSNR is typically represented in dB as follows [13,14]:
where denotes the highest achievable pixel value in the image, this value is 127 for images utilizing an 7-bit format.
The SSIM offers a perceptually weighted assessment of image quality, focusing on luminance, contrast, and structural similarity rather than absolute pixel-wise discrepancies. The SSIM can be calculated as follows [13,14]:
where and denote the mean of the transmitted RGB image and received RGB image, respectively. and are variance of the transmitted and received RGB images, respectively, and the covariance between them is . and are arbitrary constants and have values of and , respectively.
Histograms offer a graphical display of the distribution of pixel intensities, aiding in the evaluation of contrast and brightness characteristics within an image. For histogram calculation, the pixel intensities in an image are grouped into bins, and the number of pixels that fall into each bin is counted. For an image , the histogram at intensity level k can be calculated as follows:
where is the Dirac delta function, which equals 1 if and 0 otherwise, and ranges over all possible intensity levels.
The correlation coefficient, on the other hand, quantifies the extent of the linear relationship between two images, acting as another metric for gauging their similarity, and can be expressed as follows [14]:
5. Results and Discussion
Table 2 lists the parameters utilized in the OptiSystem version 21 and MATLAB 2023b simulations [9,10,13,14].
Table 2.
Parameter values.
In this section, the results are presented in two distinct parts. The initial part investigates the effect of foggy conditions on the performance of the proposed FSO/OCDMA system for transmitting RGB images. The subsequent part analyzes the influence of actual meteorological visibility data from Alexandria, Egypt, on the performance of the RGB image transmission system.
5.1. Impact of Foggy Weather on the Performance of the Proposed FSO/OCDMA for the RGB Image Transmission System
In this subsection, we will discuss the impact of foggy weather on the four different RGB images.
5.1.1. Visual Quality of RGB Images and Histograms
Figure 3 displays four received RGB images, each modulated with a distinct PV code sequence, transmitted over FSO distances ranging from 1.7 km to 2.6 km under LF weather. It compares images received without post-processing (Figure 3a) to those processed using a median filter (Figure 3b). At shorter distances (from 1.7 km to 2.1 km), both sets of images maintain high fidelity with minimal noise interference. However, as the transmission distance extends beyond 2.1 km, the quality of unprocessed images (Figure 3a) deteriorates, with a significant increase in noise levels at the longest FSO propagation range of 2.6 km. The application of a median filter (Figure 3b) effectively reduces noise, resulting in a noticeable improvement in visual quality. While the filter does not completely remove all noise, particularly at longer distances, it significantly enhances the overall clarity and fidelity of the images received.
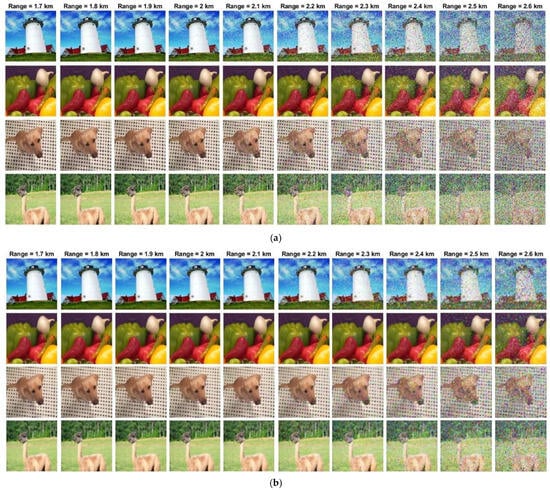
Figure 3.
Received four RGB images at various FSO images under LF. (a) Without median filter and (b) with median filter.
Histogram analysis allows for both visual and quantitative comparisons of the pixel intensity distributions between the transmitted (original) and received (distorted or enhanced) images. A histogram that closely resembles that of the original image indicates that the received image has preserved the structural and intensity characteristics, suggesting better visual fidelity.
Figure 4 illustrates the transmitted and received RGB images, along with their corresponding histograms, at various FSO transmission distances under LF conditions. At the top, the original transmitted RGB images (lighthouse, peppers, kopi, llama) are shown alongside their intensity histograms. These histograms demonstrate the pixel intensity distributions for the images prior to transmission. As can be seen, the original RGB images possess well-distributed intensities, confirming their high visual fidelity. The second and third rows display the received images at an FSO span of 2.1 km before and after applying a median filter, respectively. In the unfiltered images (second row), some noise artifacts are visible, albeit minimal, and are reflected in the histograms, which maintain a relatively similar profile to the transmitted images. After applying a median filter (third row), the noise is noticeably reduced and the image clarity improves. The histograms for the filtered RGB images are slightly similar to the original RGB images. The fourth and fifth rows present images received after transmitting into free space over 2.7 km. The unfiltered images (fourth row) show substantial noise interference, significantly degrading the image quality. The corresponding histograms show wider peaks and more spread in intensity values, indicating the higher noise level. However, after applying the median filter (fifth row), the images regain much of their original clarity. The histograms also show an improvement in intensity distribution, closely resembling those of the transmitted images, although some deviations due to noise remain noticeable at this longer distance.
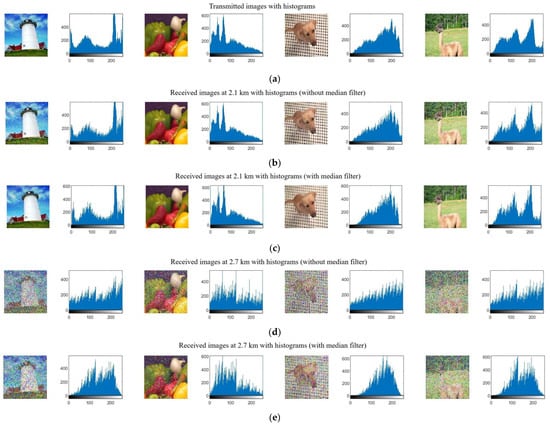
Figure 4.
Transmitted and received RGB images, along with their corresponding histograms, at various FSO transmission distances under LF conditions. (a) RGB images at transmitter, (b) received RGB images at 2.1 km without median filter, (c) received RGB images at 2.1 km with median filter, (d) received RGB images at 2.7 km without median filter, and (e) received RGB images at 2.7 km with median filter.
Figure 5 presents a comparative analysis of the received RGB images, both with and without median filtering, at three different FSO transmission ranges (1.55 km, 1.6 km, and 1.65 km) under MF conditions. Figure 5a–c illustrates the results for each transmission range, respectively. In each subfigure, the top row displays the unfiltered received RGB image and its corresponding histogram. These unfiltered RGB images exhibit significant levels of noise, which is clearly reflected in the wider intensity distributions observed in their histograms. Conversely, the bottom row of each subfigure presents the same received RGB image after the application of a median filter, along with its corresponding histogram. The application of the median filter results in a substantial reduction in noise, leading to a marked improvement in image quality. This improvement is evident in the more concentrated intensity distributions observed in the histograms of the filtered images. However, it is important to note that some noise-related deviations persist even after the application of the median filter.
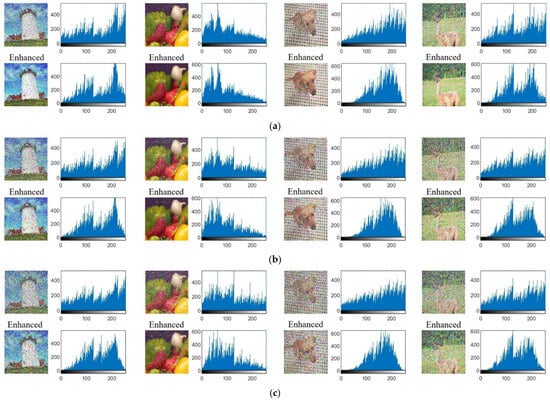
Figure 5.
Received RGB images (with/without median filter) with corresponding histograms under MF at FSO ranges of (a) 1.55 km, (b) 1.6 km, and (c) 1.65 km. “Top rows in (a–c) are without median filters while bottom rows are with median filters”.
Figure 6 and Figure 7 illustrate the effect of HF and median filtering on the received RGB images at FSO ranges of 0.98 km, 1 km, and 1.2 km. Figure 6 displays the four different RGB images received without any post-processing, while Figure 7 shows the same images after the application of a median filter. As the FSO link increases, the impact of attenuation caused by HF on RGB image quality becomes increasingly evident. At the longest FSO span of 1.2 km, significant noise is observed in the received RGB images, even after the application of the median filter. However, a comparison of the histograms presented in Figure 6 and Figure 7 reveals that the application of the median filter does result in a slight improvement in the distribution of pixel intensities. This suggests that while the median filter is not entirely effective in mitigating the effects of attenuation caused by HF at longer FSO propagation ranges, it does offer a modest improvement in image quality.
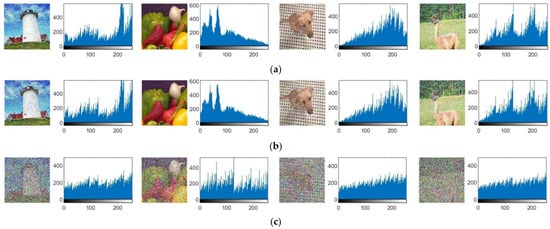
Figure 6.
Received RGB images with corresponding histograms under HF at FSO ranges of (a) 0.98 km, (b) 1 km, and (c) 1.2 km.
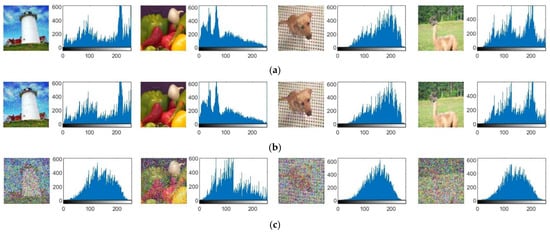
Figure 7.
Received enhanced RGB images with corresponding histograms under HF at FSO ranges of (a) 0.98 km, (b) 1 km, and (c) 1.2 km.
5.1.2. Assessment of RGB Image Quality Under Foggy Weather Conditions Using the SNR Metric
Figure 8 provides a comparative analysis of the SNR performance for four transmitted RGB images (Lighthouse, Peppers, Kopi, Llama) over FSO propagation ranges under three different fog conditions, HF, MF, and LF, with and without the application of median filtering. As expected, the HF condition, exhibiting the highest ∝, resulted in the shortest FSO span for all images compared to the MF and LF conditions. Under HF conditions, the four RGB images can successfully propagate in free space up to a maximum range of 1.2 km. With MF, this range extends to 1.65 km, while the LF condition allows for the transmission range to be further increased to 2.6 km.
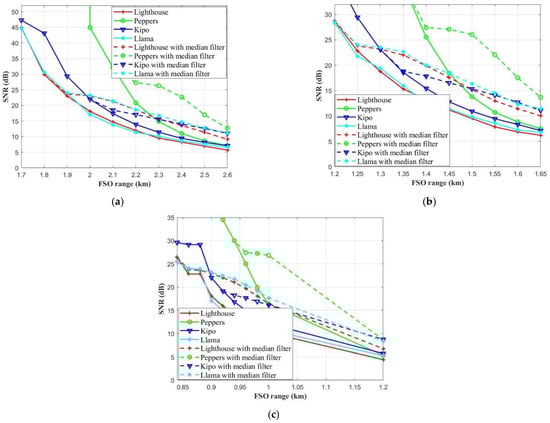
Figure 8.
SNR for four RGB images with and without median filters versus FSO ranges of the proposed FSO/OCDMA for RGB image transmission system under (a) LF, (b) MF, and (c) HF.
The application of median filtering noticeably improves the SNR, particularly at longer FSO links, across all fog levels. For example, under LF conditions, the llama RGB image achieves an SNR of 44.71 dB at a distance between transmitter and receiver of 1.7 km. However, as this distance increases to 2.6 km without median filtering, the SNR degrades to 6.58 dB due to accumulated noise and signal degradation. Conversely, with the application of median filtering, the SNR at 2.6 km improves significantly to 11.04 dB, illustrating the filter’s effectiveness in mitigating noise and restoring image quality during FSO transmission.
Table 3 tabulates the SNR for the four RGB images of the proposed system at 2.6 km (LF), 1.65 km (MF), and 1.2 km (HF) with and without the application of median filters.
Table 3.
SNR for four RGB images of the proposed system at 2.6 km (LF), 1.65 km (MF), and 1.2 km (HF).
5.1.3. Assessment of RGB Image Quality Under Foggy Weather Conditions Using the RMSE Metric
Figure 9 displays RMSE measurements for received RGB lighthouse, peppers, kopi, and llama images for the proposed system versus various FSO traveling distances under foggy weather. It also compares the RMSE for RGB images processed with and without median filtering. As shown, the RMSE increases with distance for all images, indicating that transmission over longer FSO ranges leads to greater distortion and loss of image quality. Additionally, the images processed with the median filter demonstrate a significant reduction in RMSE across all distances, particularly at longer propagation ranges. Moreover, the lowest RMSE with longer FSO spans observed when RGB images propagated through FSO channel exposed to LF condition. At a shorter FSO link distance of 2.1 km under LF conditions, the difference in RMSE between the median-filtered and unfiltered RGB Kopi images is relatively small (19.83 vs. 22.66, as shown in Figure 9a), indicating minimal noise impact. However, as the transmission distance increases to 2.6 km, the advantage of median filtering becomes more pronounced, with the filtered RGB kopi image achieving a significantly lower RMSE (45.16) compared to the unfiltered RGB kopi image (73.60). This underscores the significance of median filtering in minimizing noise and ensuring image quality, particularly over longer FSO transmission distances.
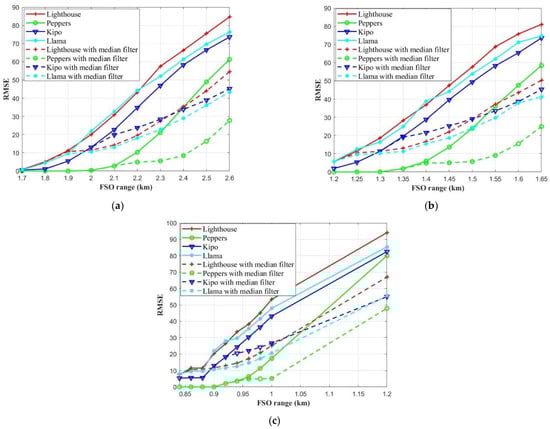
Figure 9.
RMSE for four RGB images with and without median filters versus FSO ranges of the proposed FSO/OCDMA for RGB image transmission system under (a) LF, (b) MF, and (c) HF.
Table 4 tabulates the RMSE for the lighthouse, peppers, kopi, and llama RGB images of the proposed system at 2.6 km (LF), 1.65 km (MF), and 1.2 km (HF) with and without the application of median filters.
Table 4.
RMSE for four RGB images of the proposed system at 2.6 km (LF), 1.65 km (MF), and 1.2 km (HF).
5.1.4. Assessment of RGB Image Quality Under Foggy Weather Conditions Using the PSNR Metric
Figure 10 depicts the PSNR performance of received RGB images under foggy weather conditions versus various FSO transmission distances. The figure also compares the PSNR values for images processed with and without median filtering. As the FSO range increases, a decrease in PSNR is observed. However, applying image enhancement techniques, such as median filtering, improves PSNR significantly. For instance, at an FSO range of 1.2 km under HF, the RGB lighthouse, peppers, kopi, and llama images exhibit PSNR values of 8.64 dB, 10 dB, 9.79 dB, and 9.49 dB, respectively, as shown in Figure 10c. After median filtering, these values increase to 11.55 dB, 14.32 dB, 13.29 dB, and 13.23 dB, respectively. This corresponds to enhancements of 33.68%, 43.20%, 35.75%, and 39.41% in PSNR for the lighthouse, peppers, kopi, and llama, respectively, under HF conditions at 1.2 km during FSO transmission.
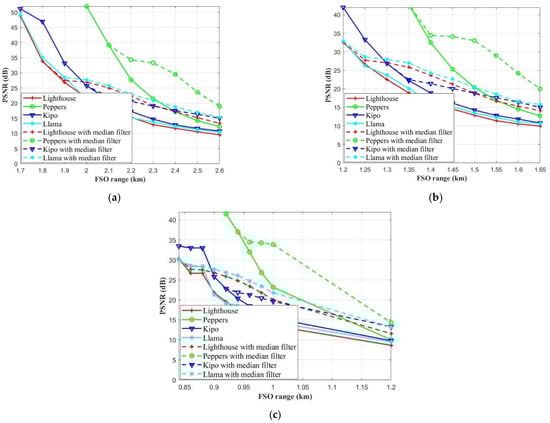
Figure 10.
PSNR for four RGB images with and without median filters versus FSO ranges of the proposed FSO/OCDMA for the RGB image transmission system under (a) LF, (b) MF, and (c) HF.
Table 5 shows the PSNR for four RGB images (lighthouse, peppers, kopi, llama) transmitted at 2.6 km (LF), 1.65 km (MF), and 1.2 km (HF) with and without median filtering.
Table 5.
PSNR for four RGB images of the proposed system at 2.6 km (LF), 1.65 km (MF), and 1.2 km (HF).
5.1.5. Assessment of RGB Image Quality Under Foggy Weather Conditions Using the Correlation Coefficient Metric
The correlation coefficient performance of received RGB images (lighthouse, peppers, kopi, and llama) versus the FSO transmission distance, with and without the application of median filtering, under foggy weather conditions is demonstrated in Figure 11. As seen in the plot, the correlation coefficient decreases as the FSO range increases, indicating a decline in the similarity between the transmitted and received RGB images due to increasing signal distortion over longer distances. The unfiltered RGB images exhibit a sharper decline in correlation coefficient as the FSO range increases, particularly beyond 2.2 km under LF (Figure 11a), 1.4 km under MF (Figure 11b), and 1 km under HF (Figure 11c). Among the unfiltered RGB images, the lighthouse and llama images show the steepest decrease in correlation, reaching values close to 0.41 and 0.32, respectively, at an FSO range of 1.65 km in the case of MF, as shown in Figure 11b. In contrast, under the same fog condition, the peppers image maintains a higher correlation, with values remaining above 0.9 until the FSO distance exceeds 1.45 km. When median filtering is applied, a clear improvement in correlation coefficient is observed across all RGB images, especially at longer distances. For example, under MF, the lighthouse and llama images with median filtering maintain correlation values above 0.65, even at the maximum FSO range of 1.65 km, demonstrating the filter’s effectiveness in preserving image quality. The pepper image and the image with median filtering showed the most stable performance, with a correlation coefficient remaining near 1 for the majority of the FSO ranges, highlighting the robustness of these images under foggy conditions when enhanced with filtering.
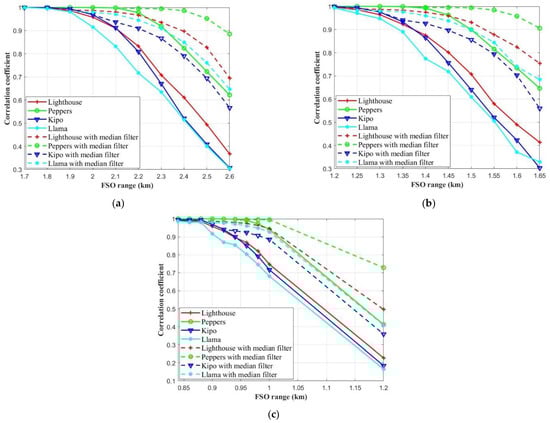
Figure 11.
Correlation coefficient for four RGB images with and without median filters versus FSO ranges of the proposed FSO/OCDMA for RGB image transmission system under (a) LF, (b) MF, and (c) HF.
Table 6 tabulates the correlation coefficients between the four transmitted and received four RGB images (lighthouse, peppers, kopi, llama) with and without median filtering at FSO links of 2.6 km, 1.65 km, and 1.2 km, under LF, MF, and HF, respectively.
Table 6.
Correlation coefficient for four RGB images of the proposed system at 2.6 km (LF), 1.65 km (MF), and 1.2 km (HF).
5.1.6. Assessment of RGB Image Quality Under Foggy Weather Conditions Using the SSIM Metric
SSIM is a crucial metric for evaluating the quality and consistency of RGB images. Figure 12 illustrates the SSIM values for four different RGB images received under foggy weather against different FSO links with and without median filtering. Generally, SSIM decreased by increasing the distance between the transmitter and the receiver. Median filtering improved SSIM. The application of median filtering improved SSIM, particularly at shorter transmission ranges. For example, the RGB llama image exhibited an SSIM value of 0.96 when transmitted over a distance of 0.84 km under HF conditions. However, this value dropped to 0.46 as the transmission distance extended to 1 km. When post-processed with median filtering, the SSIM for the RGB llama image increased to 0.83 at the same distance.
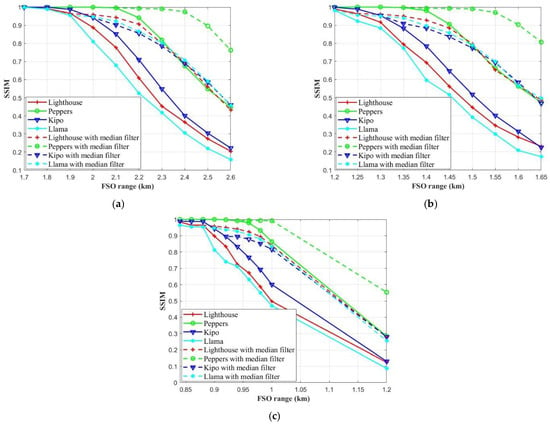
Figure 12.
SSIM for four RGB images with and without median filters versus the FSO ranges of the proposed FSO/OCDMA for the RGB image transmission system under (a) LF, (b) MF, and (c) HF.
Table 7 tabulates the SSIM between the transmitted and received four RGB images (lighthouse, peppers, kopi, llama) with and without median filtering at FSO links of 2.6 km, 1.65 km, and 1.2 km, under LF, MF, and HF, respectively.
Table 7.
SSIM for four RGB images of the proposed system at 2.6 km (LF), 1.65 km (MF), and 1.2 km (HF).
5.2. Impact of the Weather of Alexandria City, Egypt, on the Performance of the Proposed FSO/OCDMA for the RGB Image Transmission System
This subsection evaluates the transmission of four RGB images over extended FSO ranges (14 km, 15 km, and 16 km) using real-world visibility data from Alexandria, Egypt. Figure 13 shows the received images (with and without median filtering) and their corresponding histograms. As expected, image quality degraded noticeably with increasing transmission distance. Comparing the top and bottom rows of Figure 13a,b, the degradation in image quality at the longest range (16 km) is evident compared to the shorter ranges (14 km and 15 km). Furthermore, the application of median filtering (Figure 13b) improved the visual quality of the received RGB images and their pixel distribution compared to the unfiltered images (Figure 13a). The improved image quality is visually apparent in the images and is quantified by the smoother histograms in Figure 13b.
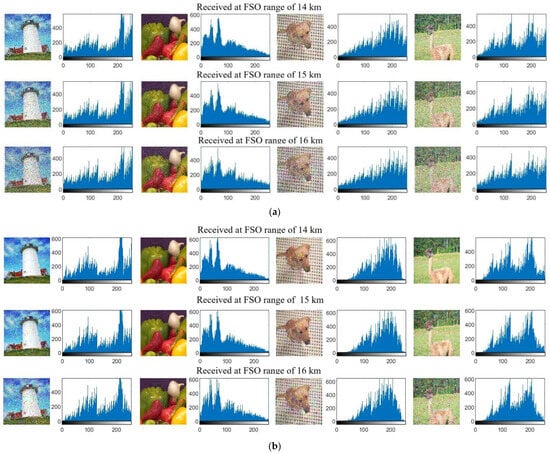
Figure 13.
Received RGB images with corresponding histograms at 14, 15, and 16 km FSO ranges for Alexandria (a) without median filter and (b) with median filter.
Figure 14, Figure 15 and Figure 16 present the SNR, RMSE, and PSNR for four received RGB images (with and without median filtering) across various FSO ranges in Alexandria, Egypt. At shorter ranges, higher SNR, lower RMSE, and higher PSNR values are observed. All of the RGB images exhibited SNR and PSNR values exceeding 90 dB and RMSE values of zero at a 7 km FSO range. However, at a 16 km range, the unfiltered images (lighthouse, peppers, kopi, llama) showed significant degradation: SNR and PSNR decreased, while RMSE increased. For example, the unfiltered llama image at 16 km had an SNR of 7.88 dB (Figure 14), an RMSE of 66.96 (Figure 15), and a PSNR of 11.6 dB (Figure 16). While median filtering also resulting in performance degradation at 16 km, the filtered images consistently outperformed their unfiltered counterparts. Specifically, the filtered llama image at 16 km achieved an SNR of 13.35 dB (Figure 14), an RMSE of 33.94 (Figure 15), and a PSNR of 17.45 dB (Figure 16).
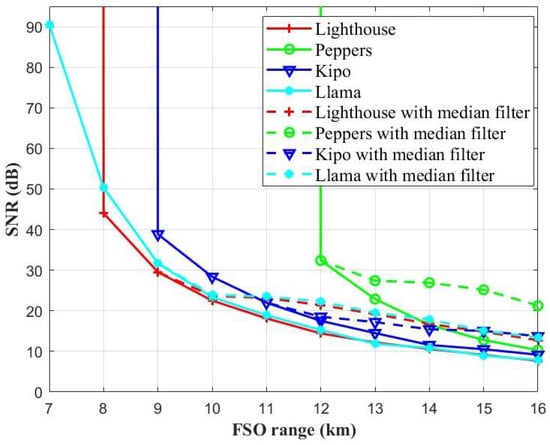
Figure 14.
SNR for four RGB images with and without median filters versus FSO ranges of the proposed FSO/OCDMA for the RGB image transmission system in Alexandria city, Egypt.
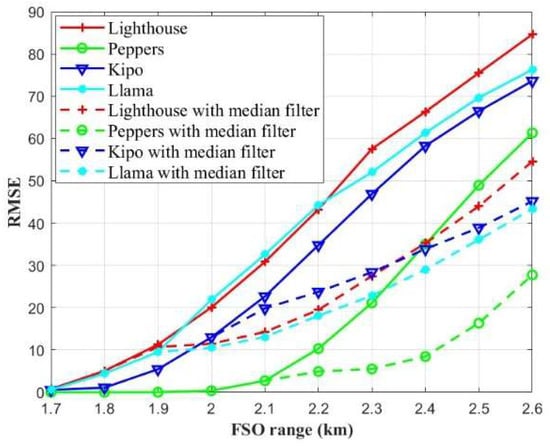
Figure 15.
RMSE for four RGB images with and without median filters versus FSO ranges of the proposed FSO/OCDMA for the RGB image transmission system in Alexandria city, Egypt.
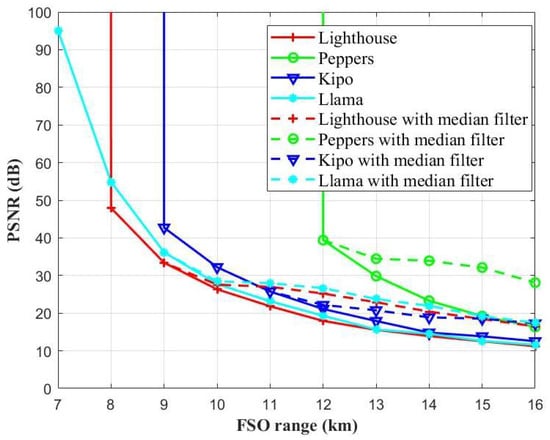
Figure 16.
PSNR for four RGB images with and without median filters versus FSO ranges of the proposed FSO/OCDMA for the RGB image transmission system in Alexandria city, Egypt.
Table 8 summarizes the SSNR, RMSE, and SIM for the four RGB images with and without median filters at 16 km of the proposed FSO/OCDMA for the RGB image transmission system in Alexandria city, Egypt.
Table 8.
SNR, RMSE, and PSNR for four RGB images of the proposed system at 16 km for Alexandria city, Egypt.
Figure 17 presents an image quality assessment for the received four RGB images (lighthouse, peppers, kopi, llama) versus various FSO ranges in Alexandria, Egypt. It displays two key image quality metrics: (a) correlation coefficient and (b) SSIM. Each metric is plotted against the FSO transmission range for both filtered and unfiltered images. The results demonstrate a consistent decrease in both the correlation coefficient and SSIM with increasing FSO range, indicating a degradation in image quality as the transmission distance increases. The application of a median filter is shown to improve both metrics, particularly at longer ranges, suggesting its effectiveness in mitigating the effects of atmospheric attenuation accumulation during FSO transmission.
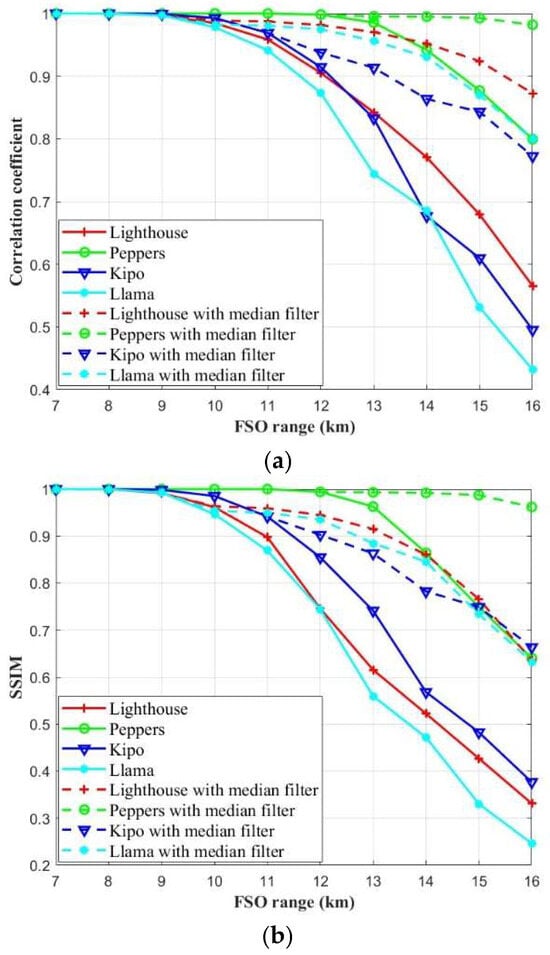
Figure 17.
Image quality assessment of four RGB images with and without median filters versus FSO ranges of the proposed FSO/OCDMA for the RGB image transmission system in Alexandria city, Egypt, using (a) correlation coefficient and (b) SSIM.
Table 9 summarizes the correlation coefficient and SSIM values for the four RGB images with and without median filters at 16 km of the proposed FSO/OCDMA for the RGB image transmission system for Alexandria city, Egypt.
Table 9.
Correlation coefficient and SSIM for the four RGB images of the proposed system at 16 km for Alexandria city, Egypt.
Table 10 presents a comparison between the proposed RGB image transmission system and an FSO channel and previous works. Our system provides enhanced security, since each RGB image is transmitted on a channel assigned with a distinct PV code sequence, allowing for only receivers with knowledge of the code to detect the image, unlike previous image transmission systems that lack such security. Additionally, the proposed system demonstrates superior overall transmission capacity, achieving 40 Gbps compared to 10 Gbps or lower in prior systems. Furthermore, this study considers real meteorological weather conditions from Alexandria, Egypt, whereas previous studies did not incorporate such realistic environmental factors.
Table 10.
Comparison between the proposed RGB image transmission system in FSO/OCDMA Utilized PV Code and previous works.
6. Conclusions
This paper proposes a high-speed RGB image transmission system over FSO channels using OCDMA with PV code sequences. Four RGB images (lighthouse, peppers, kopi, llama) were each assigned a unique PV code sequence and transmitted at 10 Gbps. The impact of atmospheric attenuation due to three fog levels (Light, Medium, Heavy) and real-world visibility data from Alexandria, Egypt, was investigated. Image quality was assessed using histograms, SNR, RMSE, PSNR, correlation coefficient, and SSIM for both unfiltered and median-filtered images. The results indicate that transmission distance and atmospheric attenuation negatively impact image quality. While Alexandria’s relatively low attenuation allowed for transmission up to 15 km with acceptable visual quality, this range decreased to 2.6 km, 1.6 km, and 1 km under LF, MF, and HF, respectively. Under these conditions, at these ranges, the unfiltered RGB images achieve SNR values ≥ 7.88 dB, 7.49 dB, 7.27 dB, and 7.27 dB, RMSE values ≤ 59.42, 69.65, 71.13, and 47.66, and SSIM values ≥ 0.33, 0.22, 0.20, and 0.46, respectively. Median filtering improved these metrics. The proposed system, achieving a total transmission capacity of 40 Gbps with distinct PV sequences for each image, is suitable for secure real-time remote monitoring applications, such as medical imaging and military operations. Future work will explore extending this system to underwater optical wireless communication (UOWC) and intersatellite optical wireless communication (IsOWC), while investigating IQA metrics for RGB image transmission in these environments and alternative image enhancement techniques.
Author Contributions
Conceptualization, S.A.A.E.-M., M.S., H.Y.A. and M.Z.; methodology, S.A.A.E.-M., M.S., H.Y.A. and M.Z.; software, S.A.A.E.-M.; validation, S.A.A.E.-M., M.S., H.Y.A. and M.Z.; formal analysis, S.A.A.E.-M.; investigation, S.A.A.E.-M.; resources, S.A.A.E.-M., M.S., H.Y.A. and M.Z.; data curation, S.A.A.E.-M., M.S., H.Y.A. and M.Z.; writing—original draft preparation, S.A.A.E.-M.; writing—review and editing, S.A.A.E.-M. and M.S.; visualization, S.A.A.E.-M. and M.S.; supervision, H.Y.A. and M.Z.; project administration, H.Y.A. and M.M.G.M.; funding acquisition, H.Y.A. and M.M.G.M. All authors have read and agreed to the published version of the manuscript.
Funding
This research was funded by Prince Sattam bin Abdulaziz University, grant number PSAU/2024/01/32027.
Data Availability Statement
Data available upon request from the corresponding author.
Acknowledgments
The authors extend their appreciation to Prince Sattam bin Abdulaziz University for funding this research work through the project number (PSAU/2024/01/32027).
Conflicts of Interest
The authors declare no conflicts of interest.
Abbreviations
The following abbreviations are used in this manuscript:
| FSO | Free-Space Optics |
| OCDMA | Optical Code Division Multiple Access |
| PV | Permutation vector |
| IQA | Image quality assessment |
| SNR | Signal-To-Noise Ratio |
| RMSE | Root Mean Square Error |
| PSNR | Peak Signal-To-Noise Ratio |
| SSIM | Structural Similarity Index measurement |
| LF | Low Fog |
| MF | Medium Fog |
| HF | Heavy Fog |
| RF | Radio Frequency |
| OFC | Optical Fiber Communication |
| LoS | Line of Sight |
| OOK | On–off keying |
References
- Lu, H.-H.; Li, C.-Y.; Huang, X.-H.; Lin, C.-J.; Lin, R.-D.; Lin, Y.-S.; Tang, Y.S.; Fan, W.-C. A Combined fibre/free-space-optical communication system for long-haul wireline/wireless transmission at millimetre-wave/sub-THz frequencies. Commun. Eng. 2023, 2, 18. [Google Scholar] [CrossRef]
- Vagionas, C.; Maximidis, R.; Stratakos, I.; Margaris, A.; Mesodiakaki, A.; Gatzianas, M. End-to-End Real-Time Service Provisioning Over a SDN-Controllable Analog mmWave Fiber-Wireless 5G X-Haul Network. J. Lightw. Technol. 2023, 41, 1104–1113. [Google Scholar] [CrossRef]
- Bohata, J.; Nguyen, D.-N.; Spáčil, J.; Suslov, D.; Dousek, D.; Zvánovec, S. Performance evaluation of seamless 5G outdoor RoFSO transmission at 39 GHz. IEEE Photon. Technol. Lett. 2022, 34, 7–10. [Google Scholar] [CrossRef]
- Khalighi, M.A.; Uysal, M. Survey on Free Space Optical Communication: A Communication Theory Perspective. IEEE Commun. Surv. Tutor. 2014, 16, 2231–2258. [Google Scholar] [CrossRef]
- Bekkali, A.; Fujita, H.; Hattori, M. Free-Space Optical Communication Systems for B5G/6G Networks. In Proceedings of the 26th Optoelectronics and Communications Conference, Hong Kong, China, 3–7 July 2021; p. W1A.1. [Google Scholar] [CrossRef]
- Willebrand, H.; Ghuman, B.S. Free-Space Optics: Enabling Optical Connectivity in Today’s Networks; SAMS Publishing: Carmel, IN, USA, 2001; ISBN 978-0-672-32248-8. [Google Scholar]
- Mohd Nor, N.A.; Ghassemlooy, Z.; Zvanovec, S.; Khalighi, M.-A.; Bhatnagar, M.R.; Bohata, J.; Kamanec, M. Experimental analysis of a triple-hop relay-assisted FSO system with turbulence. Opt. Switch Netw. 2019, 33, 194–198. [Google Scholar] [CrossRef]
- Alkholidi, A.G.; Altowij, K.S. Free Space Optical Communications—Theory and Practices. In Contemporary Issues in Wireless Communications; Mutamed, K., Ed.; IntechOpen: London, UK, 2014; pp. 159–212. [Google Scholar] [CrossRef]
- Kim, I.I.; McArthur, B.; Korevaar, E.J. Comparison of laser beam propagation at 785 nm and 1550 nm in fog and haze for optical wireless communications. Opt. Wirel. Commun. III 2001, 4214, 26–37. [Google Scholar] [CrossRef]
- Singh, M.; Atieh, A.; Aly, M.H.; Abd El-Mottaleb, S.A. 120 Gbps SAC-OCDMA-OAM-Based FSO Transmission System: Performance Evaluation Under Different Weather Conditions. Alex. Eng. J. 2022, 61, 10407–10418. [Google Scholar] [CrossRef]
- Guo, X.; Wang, Q.; Li, X.; Zhou, L.; Fang, L.; Wonfor, A.; Wei, J.L.; von Lindeiner, J.; Penty, R.V.; White, H.I. First demonstration of OFDM ECDMA for low cost optical access networks. Opt. Lett. 2015, 40, 2353–2356. [Google Scholar] [CrossRef] [PubMed]
- Zhou, Z.; Wei, J.; Luo, Y.; Clark, K.A.; Sillekens, E.; Deakin, C.; Sohanpal, R.; Slavík, R.; Liu, Z. Communications with Guaranteed Bandwidth and Low Latency Using Frequency-Referenced Multiplexing. Nat. Electron. 2023, 6, 694–702. [Google Scholar] [CrossRef]
- Djir, A.; Meskine, F.; Tayebi, M.L. Image Transmission Performance Analysis Through Free Space Optical Communication Link Using Coherent QPSK Modulation Under Various Environmental Conditions. Trans. Emerg. Telecommun. Technol. 2023, 34, e4821. [Google Scholar] [CrossRef]
- Abd El-Mottaleb, S.A.A.; Mohamed, A.G.; Chehri, A.; Singh, M.; Atieh, A.; Ahmed, H.Y.; Zeghid, M. Performance of Cipher Image Transmission in Free Space Optics Under Foggy Weather. IEEE Access 2023, 11, 139478–139497. [Google Scholar] [CrossRef]
- Huang, X.; Bai, Y.; Fu, X. Image Transmission with Binary Coding for Free Space Optical Communications in the Presence of Atmospheric Turbulence. Appl. Opt. 2020, 59, 10283–10288. [Google Scholar] [CrossRef] [PubMed]
- Djir, A.; Meskine, F.; Tayebi, M.L. Rain Effects Analysis on Image Transmission Through Free Space Optical Communication System. J. Opt. Commun. 2023, 45, s2029–s2040. [Google Scholar] [CrossRef]
- Abd El-Mottaleb, S.A.A.; Mohamed, A.G.; Ahmed, H.Y.; Zeghid, M. Performance Enhancement of FSO Communication System Under Rainy Weather Environment Using a Novel Encryption Technique. IEEE Access 2024, 12, 13729–13746. [Google Scholar] [CrossRef]
- Djir, A.; Meskine, F.; Tayebi, M.L. Understanding the Influence of Fog Scattering Attenuation Models on IM/DD FSO Link: Image Transmission Assessment. In Proceedings of the 2024 8th International Conference on Image and Signal Processing and Their Applications (ISPA), Biskra, Algeria, 21–22 April 2024; pp. 1–8. [Google Scholar] [CrossRef]
- Bai, C.; Wang, J.; Zhou, S.; Rao, R.; Wang, T. Performance of Free Space Optical Communication Link Under Foggy Weather Regarding Different Wavelengths. In Proceedings of the 3rd International Symposium on Automation, Information and Computing, Beijing, China, 9–11 December 2022; pp. 385–390. [Google Scholar] [CrossRef]
- Flecker, B.; Gebhart, M.; Leitgeb, E.; Sheikh Muhammad, S.; Chlestil, C. Results of Attenuation Measurements for Optical Wireless Channels Under Dense Fog Conditions Regarding Different Wavelengths. Atmos. Opt. Model. Meas. Simul. II 2006, 6303, 63030P. [Google Scholar] [CrossRef]
- Grabner, M.; Kvicera, V. Fog Attenuation Dependence on Atmospheric Visibility at Two Wavelengths for FSO Link Planning. In Proceedings of the 2010 Loughborough Antennas & Propagation Conference, Loughborough, UK, December 2010; Volume 26, pp. 193–196. [Google Scholar] [CrossRef]
- Abd El-Mottaleb, S.A.; Singh, M.; Aly, M.H. 160 Gbps MMF/FSO System Based on OAM Beams and PV Code Under Rainy Weather. Opt. Quantum Electron. 2024, 56, 926. [Google Scholar] [CrossRef]
- Vu, B.T.; Dang, N.T.; Thang, T.C.; Pham, A.T. Bit Error Rate Analysis of Rectangular QAM/FSO Systems Using an APD Receiver Over Atmospheric Turbulence Channels. J. Opt. Commun. Netw. 2013, 5, 437–446. [Google Scholar] [CrossRef]
Disclaimer/Publisher’s Note: The statements, opinions and data contained in all publications are solely those of the individual author(s) and contributor(s) and not of MDPI and/or the editor(s). MDPI and/or the editor(s) disclaim responsibility for any injury to people or property resulting from any ideas, methods, instructions or products referred to in the content. |
© 2025 by the authors. Licensee MDPI, Basel, Switzerland. This article is an open access article distributed under the terms and conditions of the Creative Commons Attribution (CC BY) license (https://creativecommons.org/licenses/by/4.0/).