Article

Research on Gas Detection Algorithm Based on Reconstruction of Background Infrared Radiation

Hangzhou Institute for Advanced Study, University of Chinese Academy of Sciences, Hangzhou 310024, China
*
Author to whom correspondence should be addressed.
Photonics 2025, 12(6), 570; https://doi.org/10.3390/photonics12060570
Submission received: 9 April 2025 / Revised: 24 May 2025 / Accepted: 4 June 2025 / Published: 5 June 2025
(This article belongs to the Special Issue Adaptive Optics Imaging: Science and Applications)

Abstract

:
In response to the pressing need for long-range, non-contact detection in hazardous gas leakage monitoring within chemical industrial parks, this study proposes a gas detection algorithm based on an infrared radiation physical model that utilizes dual-band infrared radiation background reconstruction. The proposed method addresses the issues of the existing detection methods’ lack of physical model support. First, appropriate filter wavelength ranges are selected based on the absorption spectral characteristics of the target gas. Subsequently, a physical model incorporating atmospheric attenuation, background radiation, and gas absorption properties is established based on gas radiative transfer theory. The non-absorption band data are then employed to reconstruct the theoretical background radiation of the absorption band. Furthermore, leveraging the synergistic observation advantages of a dual-band infrared imaging system, gas morphology identification is achieved by inverting the difference between the theoretical background and the actual measured values in the absorption band. Experimental results demonstrate that this method enables gas morphology detection through background reconstruction without requiring pre-collected gas-free background images. By implementing dual-band infrared radiation background reconstruction, this study achieves effective gas detection, providing a reliable technical approach for real-time monitoring and early warning of industrial gas leaks. The proposed algorithm enhances detection capabilities, offering significant potential for applications in industrial safety and environmental monitoring.

1. Introduction

Industrial production processes often involve the handling, storage, and transportation of hazardous chemical gases. However, monitoring gas leaks to prevent accidents remains a significant challenge. Traditional contact-based gas detection methods suffer from slow response times and limited monitoring range, making them inadequate for real-time, large-scale monitoring in modern chemical industrial parks. In response to these limitations, emerging technologies such as nanomaterial-based gas sensors have gained increasing attention. Among various methods, infrared (IR) imaging technology has emerged as a research hotspot in gas leak detection due to its non-contact operation, long-range capability, and ability to provide intuitive visualization of gas plumes [1,2]. These advantages make IR imaging particularly suitable for dynamic, wide-area gas detection in complex industrial environments. By detecting the specific infrared absorption characteristics of gas molecules, this technology enables both qualitative and quantitative gas detection. Nevertheless, existing IR-based gas detection methods still face several critical challenges in practical applications: performance is significantly affected by background temperature variations and atmospheric conditions, as well as poor image quality, and computationally intensive algorithms struggle to meet engineering-level real-time requirements.
Current gas leak detection methods can be broadly categorized into two technical approaches: image processing-based and deep learning-based techniques. Image processing-based methods treat leaking gas as a dynamic target and primarily employ computer vision techniques for detection. Common approaches include the following: background subtraction [3], which detects gas regions by modeling and subtracting the background; optical flow methods [4], which analyze spatiotemporal motion features to estimate gas flow; and image enhancement algorithms [5], which improve gas signatures through denoising and other signal processing techniques. While these methods have relatively low computational complexity, they are susceptible to environmental interference (e.g., lighting changes, background disturbances), exhibit low sensitivity to low-concentration gases, and struggle to distinguish real gas leaks from other moving objects (e.g., personnel, vehicles). With the advancement of artificial intelligence, deep learning-based gas detection methods have demonstrated superior performance. Researchers have adopted modified network architectures such as U-Net [6], DeeplabV3+ [7], and YOLO [8] for end-to-end detection, leveraging attention mechanisms to enhance gas feature extraction [9] and spatiotemporal fusion to improve detection stability [10]. Despite their improved accuracy, deep learning methods still encounter the following challenges: dependence on large, annotated datasets for training; high computational resource demands due to extensive model parameters; limited engineering applicability, even with lightweight model optimizations.
To address these limitations, this study proposes a physics-based gas detection algorithm using dual-band infrared image reconstruction. Unlike conventional methods, this approach eliminates the need for feature extraction, large datasets, or specialized hardware platforms. Instead, it directly exploits gas imaging principles by reconstructing the infrared radiation background of the absorption band using non-absorption band images. The algorithmic workflow consists of the following steps:
(1)
Gas selection and spectral analysis: Identify the target gas, analyze its absorption spectrum, and select appropriate infrared filter bands (absorption and non-absorption bands).
(2)
Dual-band synchronous imaging: Perform radiometric and temperature calibration, incorporating a scene-based temperature drift correction algorithm to account for uncooled IR detector drift.
(3)
Atmospheric correction: Compensate for radiative transfer effects, considering water vapor as the primary atmospheric interferent.
(4)
Background temperature inversion: Assume uniform temperature for the same background point across bands. Derive the background temperature from the non-absorption band’s grayscale values; then, compute the theoretical radiance of the absorption band using atmospheric-corrected data.
(5)
Gas detection via differential imaging: Subtract the measured radiance from the theoretical background radiance to generate a gas-enhanced difference image. Apply threshold segmentation to obtain the final gas detection result.
This method enables gas morphology detection without requiring pre-captured gas-free background images, offering a robust solution for real-time industrial gas leak monitoring and early warning systems.
While the dual-band approach for gas detection is not entirely novel—examples can be found in earlier works such as [11], which used two partially overlapping filters to detect CH4, and commercial systems like [12], which employ filter wheels with multiple spectral bands—our proposed method introduces a distinct physical modeling strategy. Unlike traditional dual-band techniques that often rely on empirical relationships between the radiances of two bands, we base our approach on the assumption that the background temperature remains consistent across both bands. By leveraging this constraint, we reconstruct the theoretical radiance of the absorption band through atmospheric correction and radiative transfer modeling, using only the non-absorption band image as input.

2. Theory and Method
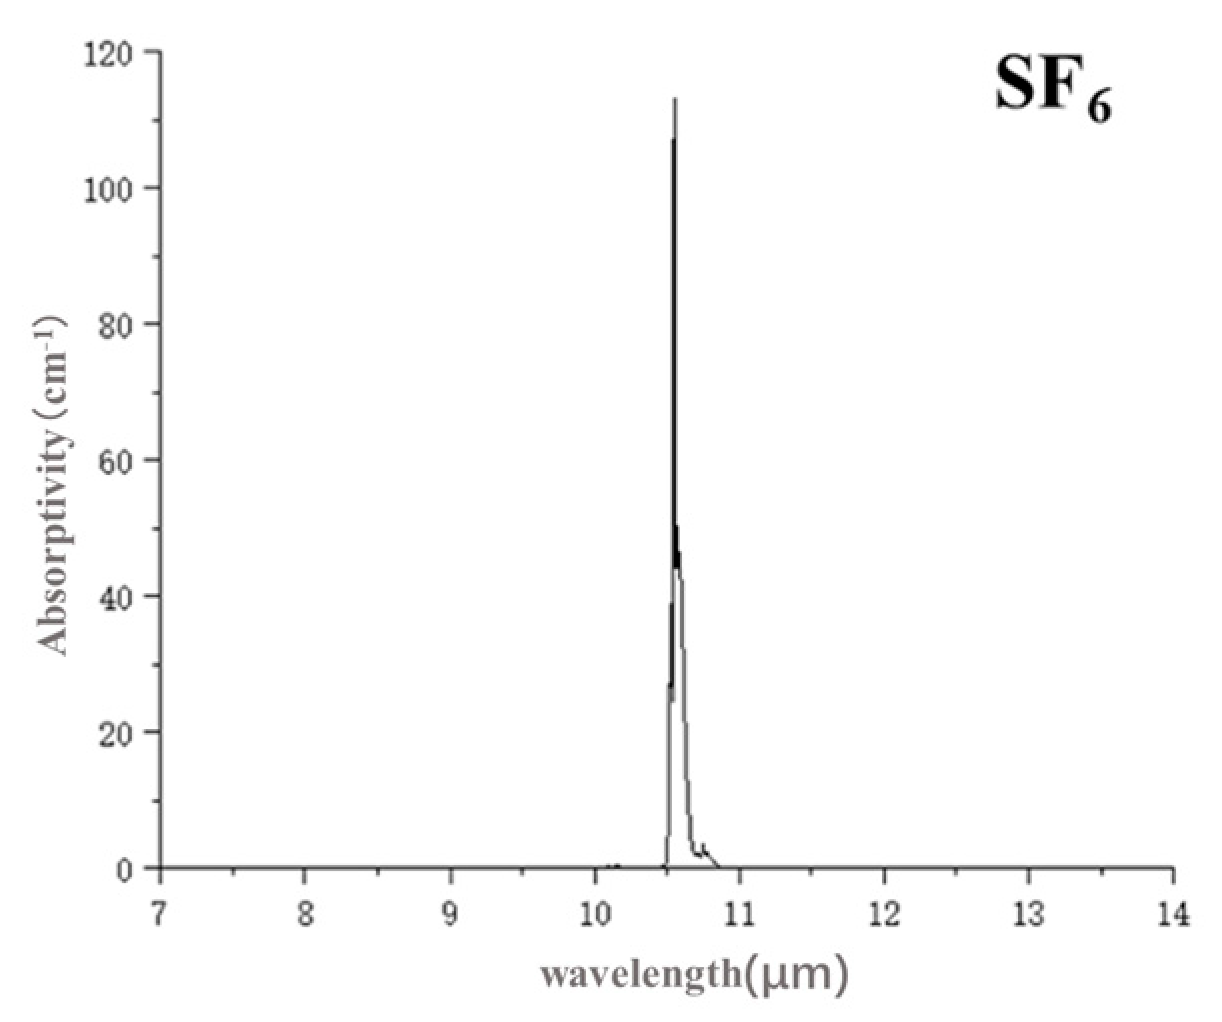
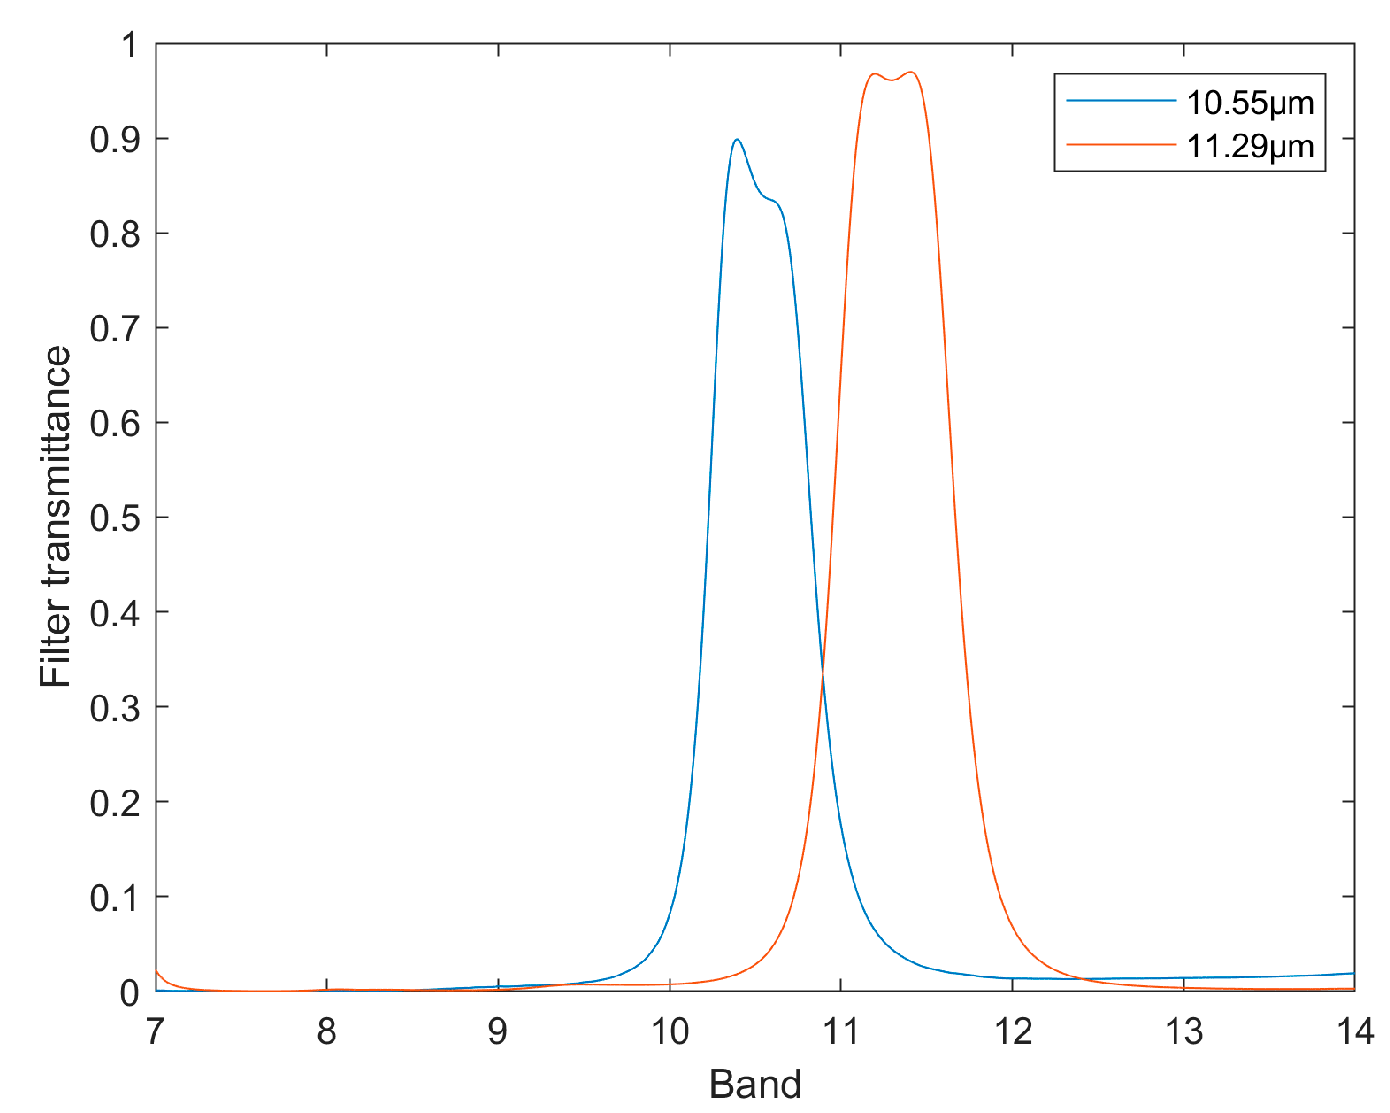
2.1. Band Selection

The dual-band infrared imaging system achieves gas detection by reconstructing the theoretical background of the absorption band using data from the non-absorption band. Therefore, the selection of appropriate absorption and non-absorption bands for the target gas is critical. To minimize atmospheric attenuation interference in gas leak detection, the mid-wave infrared (MWIR, 3–5 μm) and long-wave infrared (LWIR, 8–14 μm) spectral regions—known as atmospheric windows—are preferred due to their relatively low atmospheric absorption [13]. Taking SF6 as an example, this gas exhibits distinct infrared absorption characteristics. Figure 1 illustrates the absorption spectrum of SF6, revealing a strong absorption peak at 10.55 μm. Accordingly, the absorption band was selected with a center wavelength of 10.55 μm to ensure high sensitivity to SF6 concentration. Meanwhile, the non-absorption band was chosen in a spectral region adjacent to the absorption band but free from SF6 absorption, with a center wavelength of 11.29 μm. To maintain consistency in background radiation characteristics, both bands were configured with a bandwidth of 0.7 μm. Figure 2 presents the transmittance curves of the selected dual-band filters, demonstrating their spectral separation and suitability for SF6 detection. This band selection strategy effectively isolates gas-specific absorption while minimizing atmospheric and background interference, thereby enhancing detection accuracy and reliability.
Key considerations in band selection:
1.
Strong absorption feature: Ensures high sensitivity to target gas (SF6 at 10.55 μm).
2.
Adjacent non-absorption band: Facilitates accurate background reconstruction (11.29 μm).
3.
Consistent bandwidth: Maintains uniform radiometric properties for comparative analysis.
4.
Atmospheric window optimization: Reduces interference from water vapor and CO2 absorption.
This approach enables robust gas detection without requiring prior background images, making it highly suitable for real-time industrial monitoring applications.

2.2. Infrared Gas Radiation Transfer Model

Passive infrared imaging technology leverages the spectral absorption characteristics of target gases to directly measure the spectral radiance emitted by both the gas and its background. Among the numerical models describing infrared imaging radiation characteristics, the layer-based radiative transfer model (LRTM) is one of the earliest and most fundamental approaches [14].
The LRTM divides the infrared radiation transmission path into a series of parallel layers:
  • Input radiation for each layer is the output radiation from the previous layer.
  • Output radiation from the current layer serves as the input radiation for the next layer.
While the theoretical LRTM assumes an infinite number of infinitesimal layers for precise simulation, this approach is computationally intensive and impractical for real-world applications. To enhance computational efficiency while maintaining accuracy, the model can be simplified under the following assumptions: uniform gas distribution in each atmospheric layer and uniform gas leakage concentration in the target gas layer.
Under these conditions, the infrared radiative transfer process can be approximated using a three-layer model, comprising the following:
  • Background layer: Emits thermal radiation based on its temperature and emissivity.
  • Target gas layer: Absorbs and re-emits radiation at specific spectral bands.
  • Infrared detector: Captures the transmitted and emitted radiation.
Figure 3 illustrates this three-layer atmospheric radiative transfer model, where the radiation path can be categorized into two types: the gas transmission path and the non-gas transmission path.
When the target gas is absent in the observed scene, the radiance at the detector’s entrance pupil consists of two primary components:
  • Attenuated background radiance: Originates from the thermal emission of the background and the reflected radiation from surrounding objects and undergoes atmospheric attenuation before reaching the detector. Note: Although background radiation includes reflected components, most materials exhibit low reflectivity in the infrared spectrum. Thus, the detected radiation can be approximated as emissive-dominated background radiation.
  • Atmospheric path radiance: Generated by the thermal emission of atmospheric constituents (e.g., H2O, CO2) along the line of sight.
Mathematically, the total radiance at the detector is expressed as follows:
L o f f = L b g τ a t m + L p a t h ,
where
L o f f : Total radiance at the detector entrance pupil (gas-free scenario).
L b g : Background radiance (emissive + negligible reflected components).
τ a t m : Atmospheric transmittance.
L p a t h : Atmospheric path radiance.
The background radiance ( L b g ) can be modeled as an ideal blackbody with emissivity ( ε b g ) and temperature ( T b g ). Its spectral radiance is derived from Planck’s law:
L b g = ε b g C 1 λ 5 1 exp C 2 λ T b g 1 ,
where
C 1 = 3.74 × 10 16 W m 2 (first radiation constant).
C 2 = 1.44 × 10 2 m K (second radiation constant).
λ : Wavelength (m).
When the target gas is present in the observed scene, the radiance at the detector’s entrance pupil comprises three key components:
  • Attenuated background radiance. Background thermal radiation and reflected ambient radiation (negligible) are attenuated by the target gas and atmosphere.
  • Gas self-emission radiance. The gas layer emits thermal radiation at its characteristic temperature, attenuated by the atmosphere.
  • Atmospheric path radiance. Unchanged contribution from atmospheric emissions along the line of sight.
Mathematically, the total radiance is as follows:
L o n = L b g τ g a s τ a t m + L g a s τ a t m + L p a t h ,
Under thermodynamic equilibrium, Kirchhoff’s law states that gas absorptivity equals emissivity:
ε g a s = 1 τ g a s ,
Thus, the gas self-emission radiance can be expressed as follows:
L g a s = ε g a s B λ , T g a s = 1 τ g a s B λ , T g a s ,
where B λ , T g a s is the blackbody radiance of the gas at temperature T g a s , calculated via Planck’s law.
By subtracting the gas-free radiance from the gas-present radiance, the gas-induced differential signal is derived:
Δ L = L o n L o f f = B λ , T g a s B λ , T b g ε b g λ 1 τ g a s λ τ a t m λ ,
As can be seen from the above equation, the infrared radiance of the target gas is directly correlated with atmospheric transmittance, target gas transmittance, gas cloud temperature, and background object radiance.

2.3. Reconstructed Gas Detection Method Based on Infrared Radiation Background

In dual-band gas detection, the following assumptions are established:
Consistency of background radiation characteristics: In the absence of gas interference, the radiation properties (emissivity) of the same background are consistent in the absorption band λ 1 and the non-absorption band λ 2 . When the target gas is absent, the radiance at the detector’s entrance pupil is solely composed of background radiation and atmospheric path radiance. Variations in radiance between the two bands are primarily caused by the wavelength-dependent characteristics of the bands.
L o f f λ 1 = L b g λ 1 , T b g τ a t m λ 1 + L p a t h λ 1 ,
L o f f λ 2 = L b g λ 2 , T b g τ a t m λ 2 + L p a t h λ 2 ,
For the same background observed by the detector, the temperature should be identical. Therefore, the background temperature can be retrieved using the non-absorption band, and this temperature can then be used to model the theoretical background radiation in the absorption band.
Simplified atmospheric absorption model: Under uniform atmospheric conditions, the primary atmospheric components contributing to infrared radiation absorption are nitrogen (78.084%), oxygen (20.946%), water vapor, and carbon dioxide (390 ppm). In the 8–14 μm wavelength range, the effects of nitrogen and oxygen are negligible. Water vapor dominates atmospheric absorption, particularly at the edges of the band, while carbon dioxide exhibits only weak absorption near 14 μm. Consequently, under the assumption of uniform atmospheric conditions, only the influence of water vapor on atmospheric transmittance is considered. Furthermore, the path radiance equation is simplified to the water vapor emissions at atmospheric temperature.

3. Discussion and Details

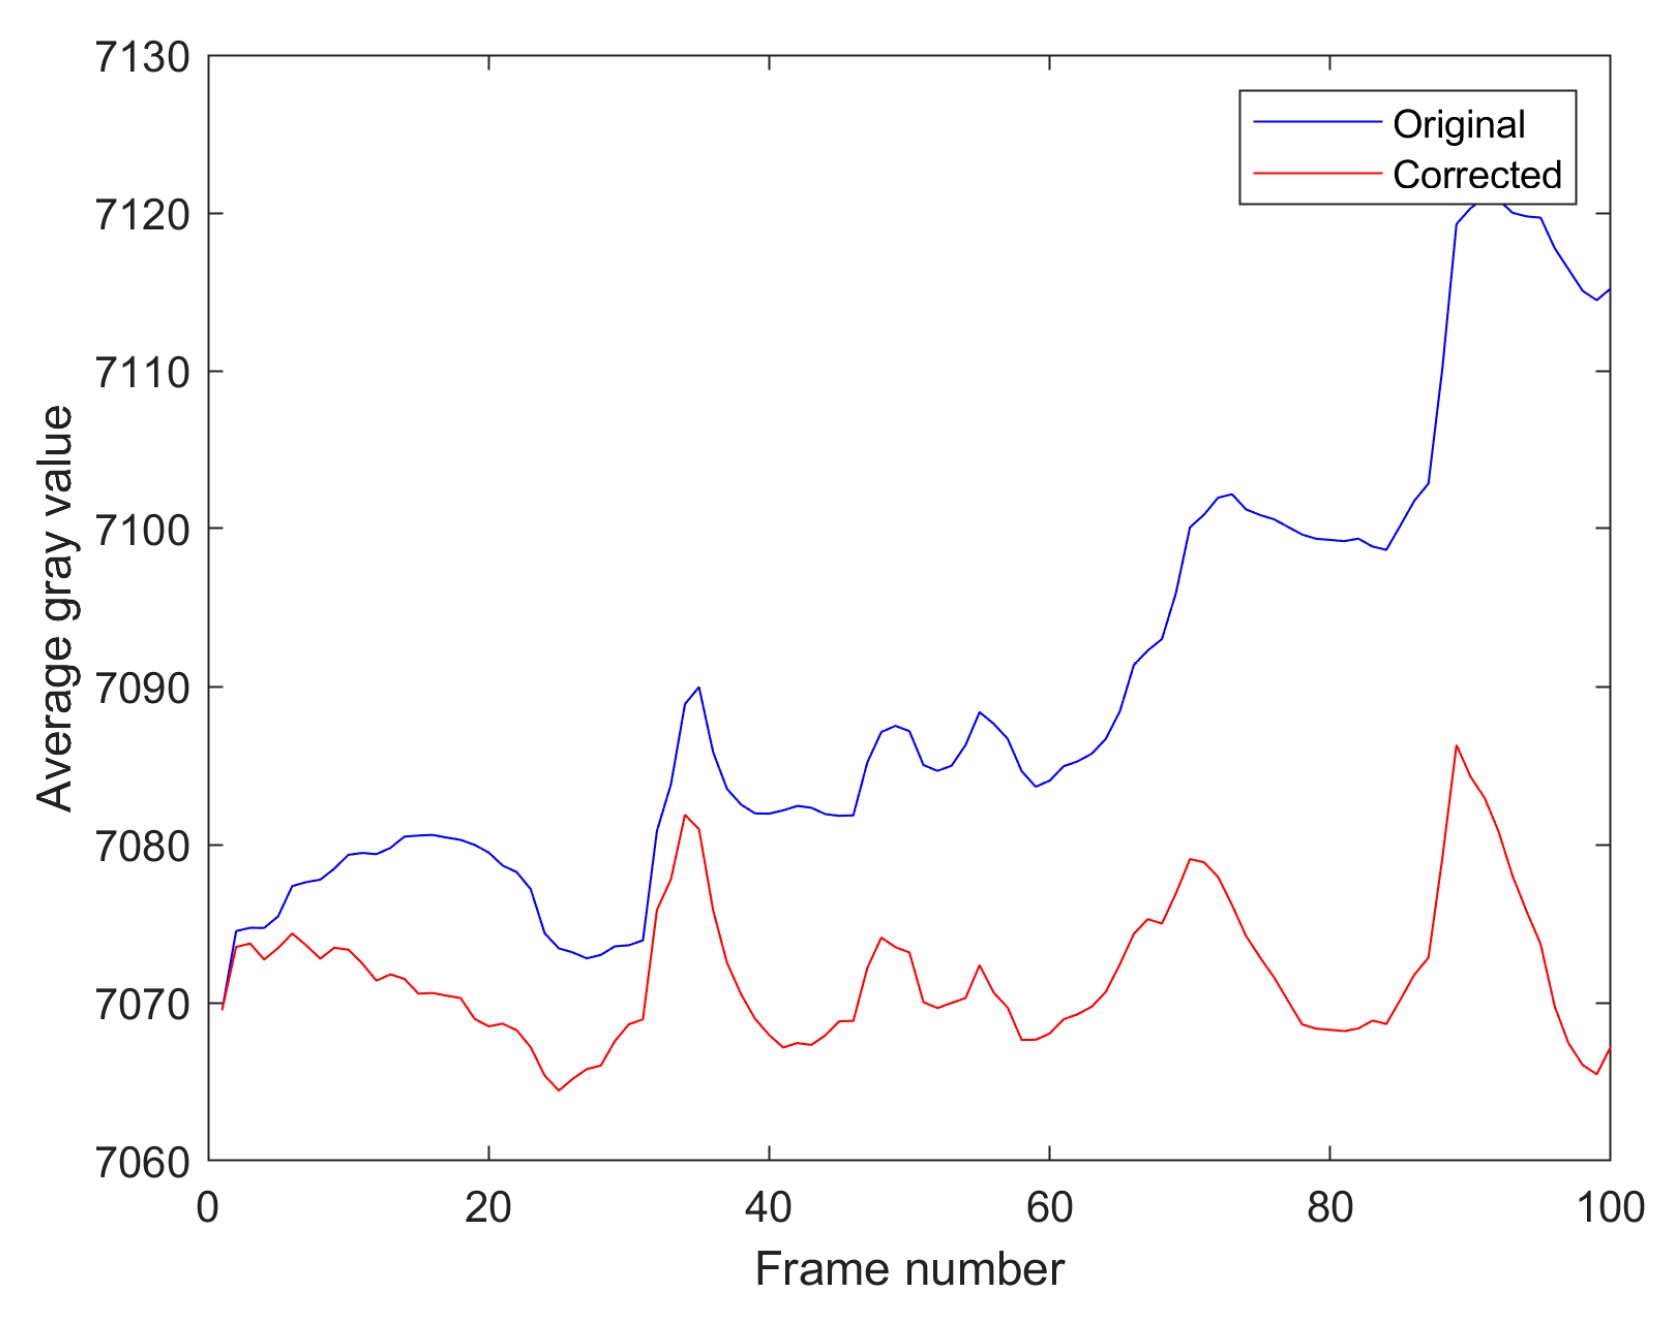
3.1. Temperature Drift Correction in Infrared Imaging

In infrared images, self-heating of the sensor or environmental temperature fluctuations can induce global brightness variations across the image. Additionally, pixel response disparities may manifest as fixed-pattern noise or slow-varying drift over time. To address this, we propose a statistically based dynamic drift compensation algorithm for temperature drift correction. The algorithm operates under the following assumptions: temperature drift is a low-frequency signal, and scene changes (e.g., moving objects) are high-frequency signals. By analyzing local statistical features of real-time frame sequences, the algorithm estimates and compensates for drift components. It is important to note that this method is only applicable under static camera conditions. Drift estimation for the current frame (Dt) is calculated as the mean deviation:
D t = μ c u r r e n t t μ b a s e l i n e ,
where μ b a s e l i n e is the mean luminance of the initial frame.
Figure 4 illustrates the effectiveness of the temperature drift correction. The horizontal axis represents the frame number, while the vertical axis denotes the mean pixel value of each frame. For a static background, the average pixel value is expected to exhibit only minor fluctuations. However, due to factors such as internal heating of the infrared camera during extended operation, a temperature drift effect occurs, causing the original (blue) curve to show a gradual upward trend over time. By applying a temperature drift correction algorithm, this cumulative trend is effectively removed. The corrected (red) curve fluctuates minimally around the baseline mean, with only residual random noise remaining, thereby improving the system’s stability and reliability for applications such as gas detection.
The inter-frame standard deviation before correction is 13.7938, and after correction, it is 4.4091. This demonstrates a 68% reduction in drift-induced variability, confirming the algorithm’s efficacy in mitigating temperature drift.

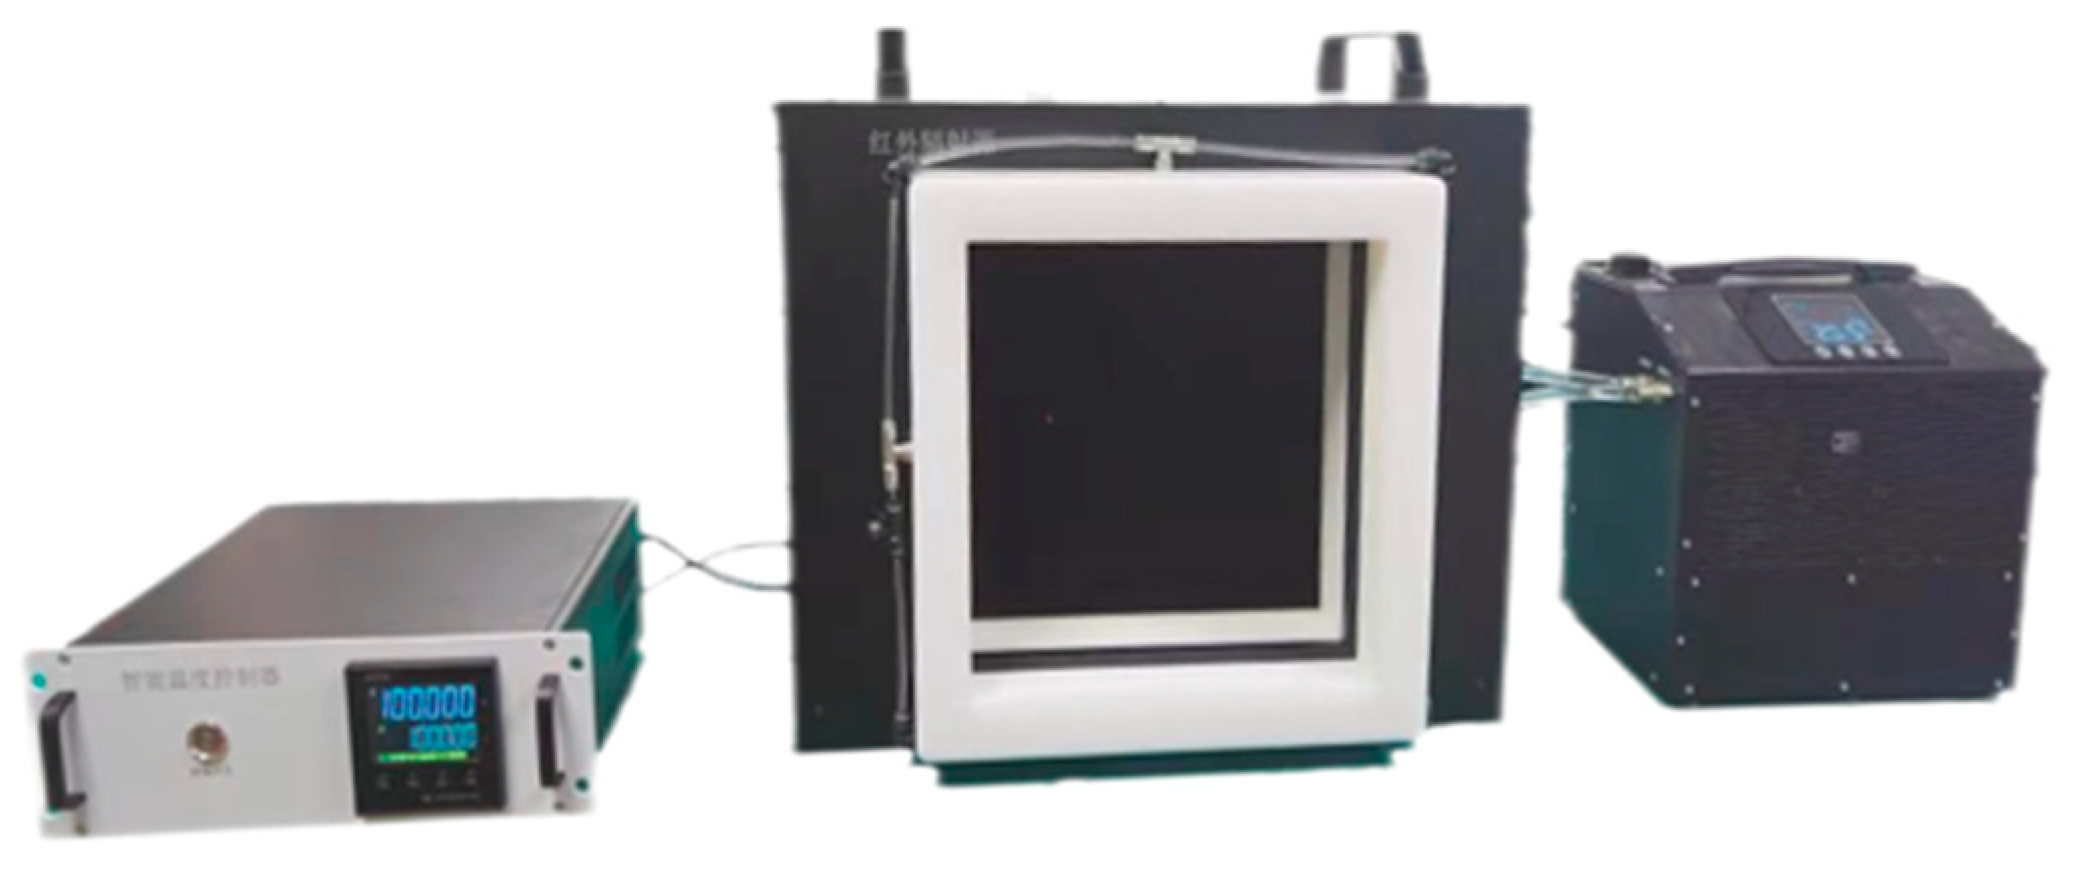
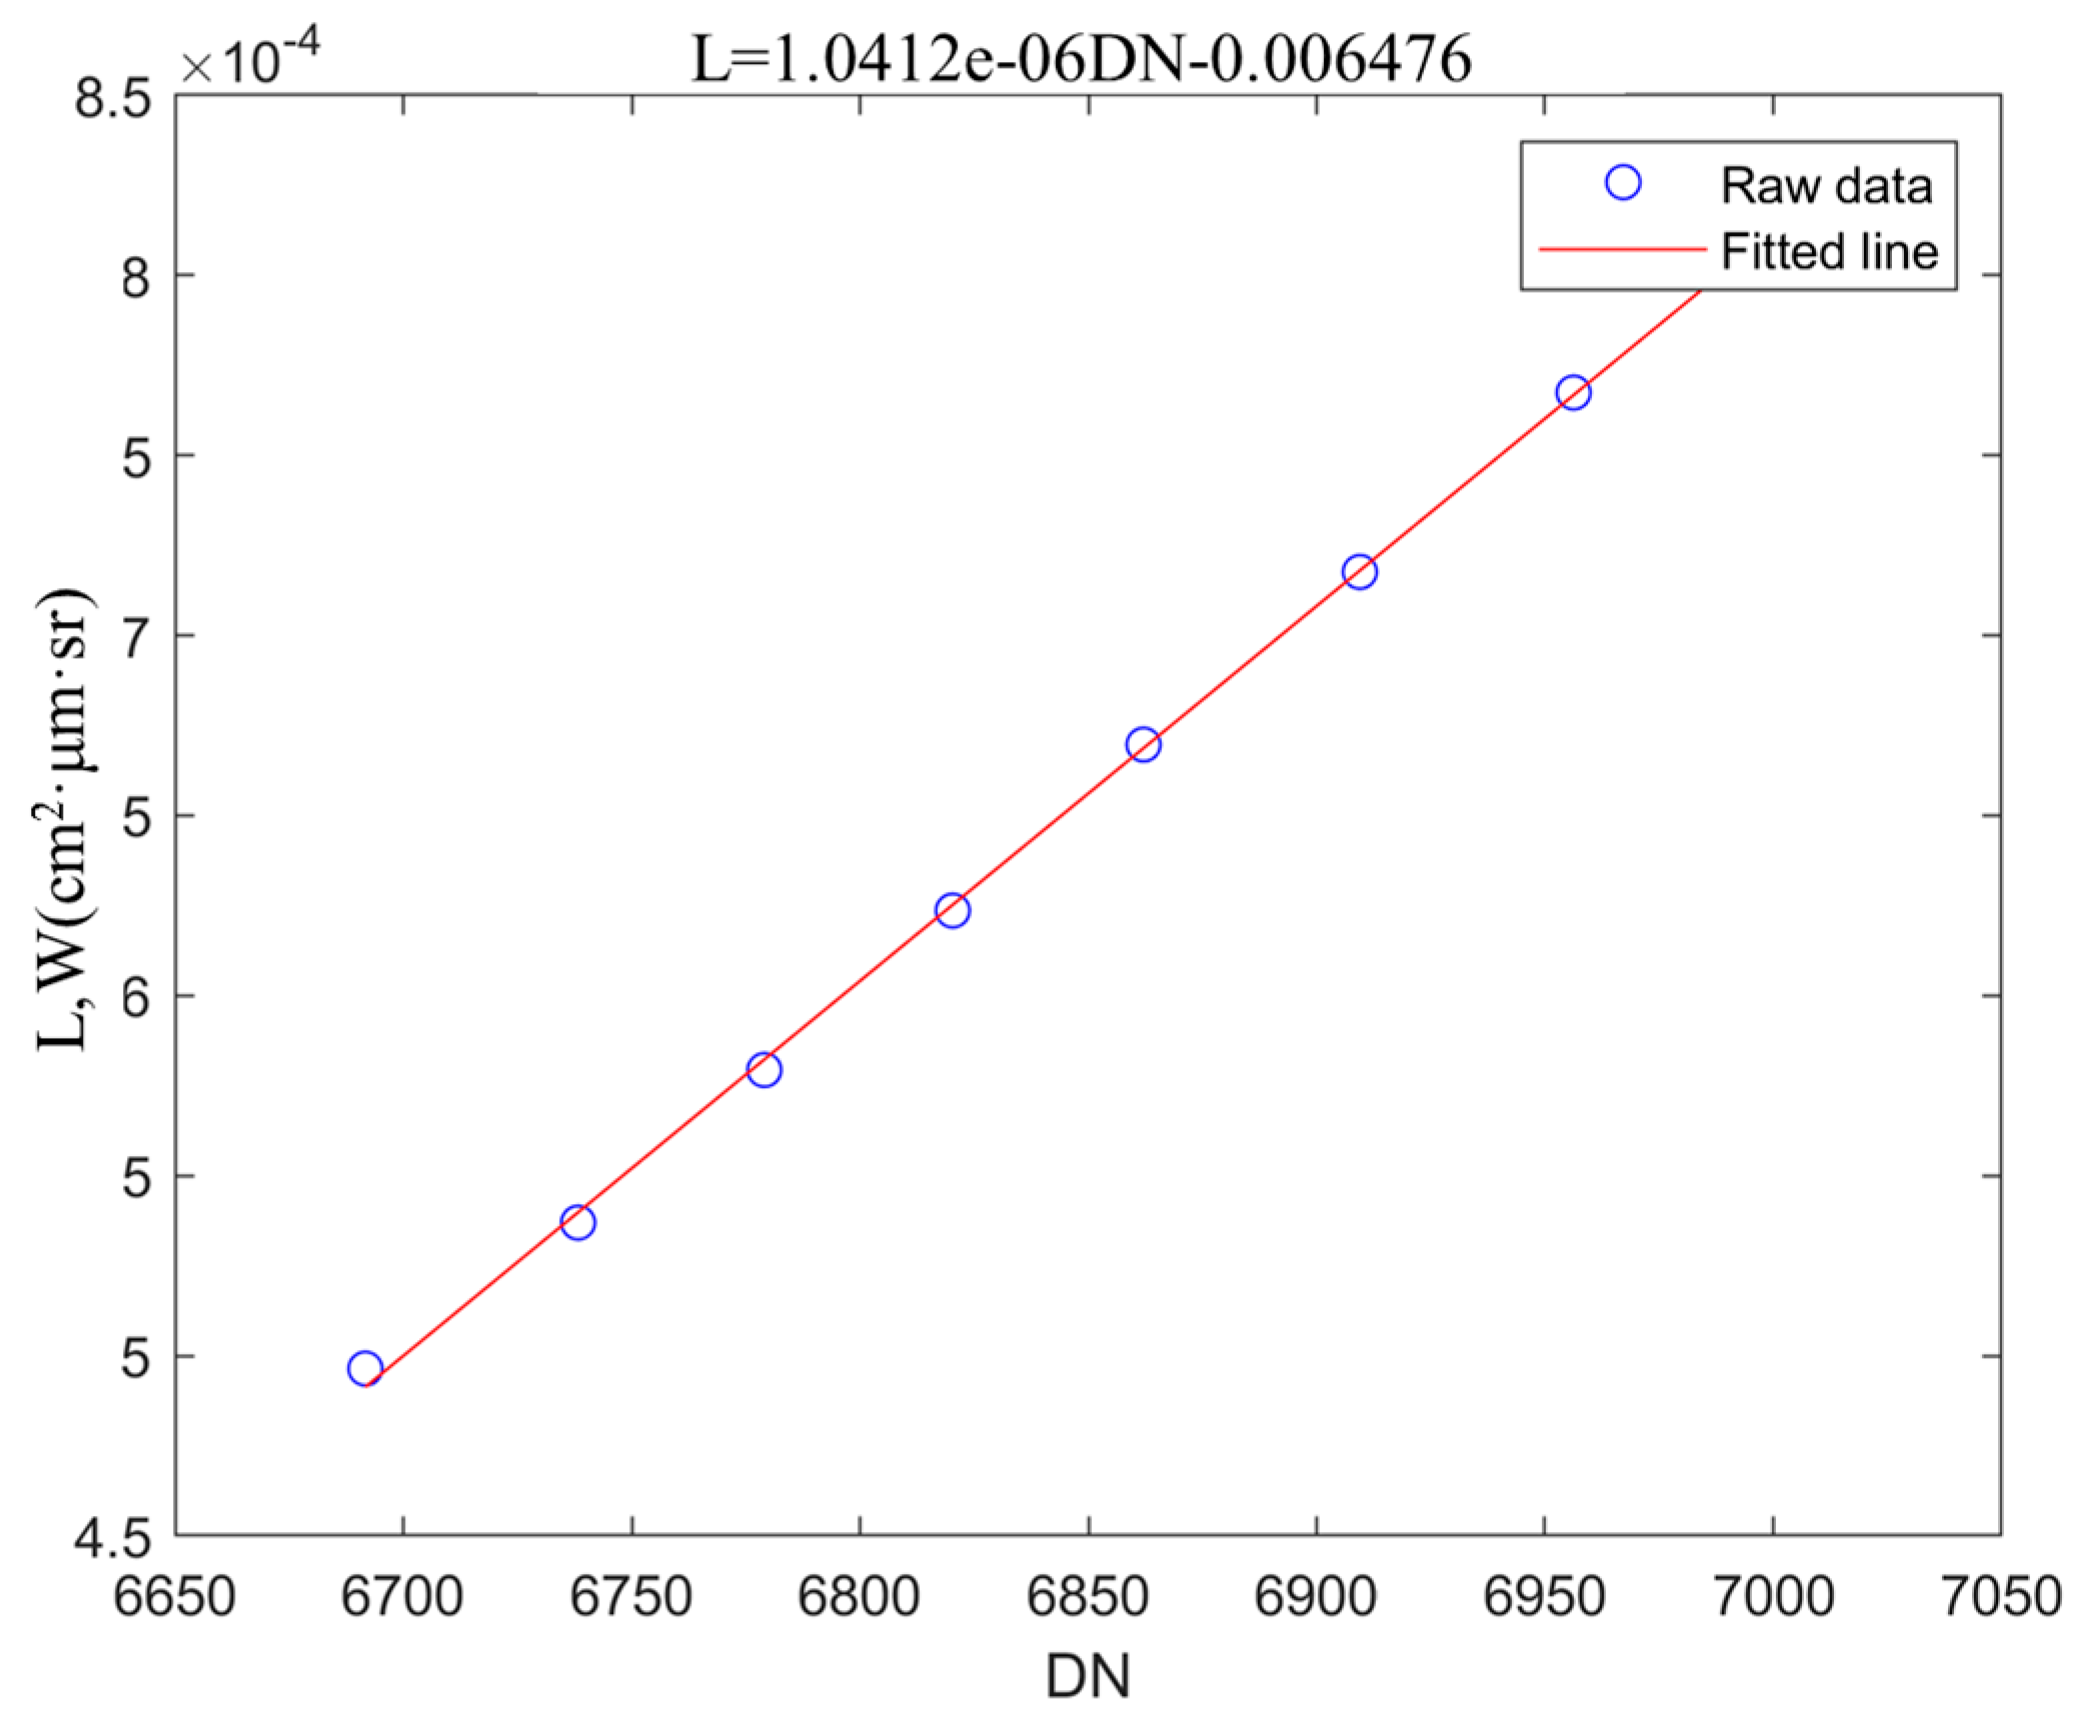
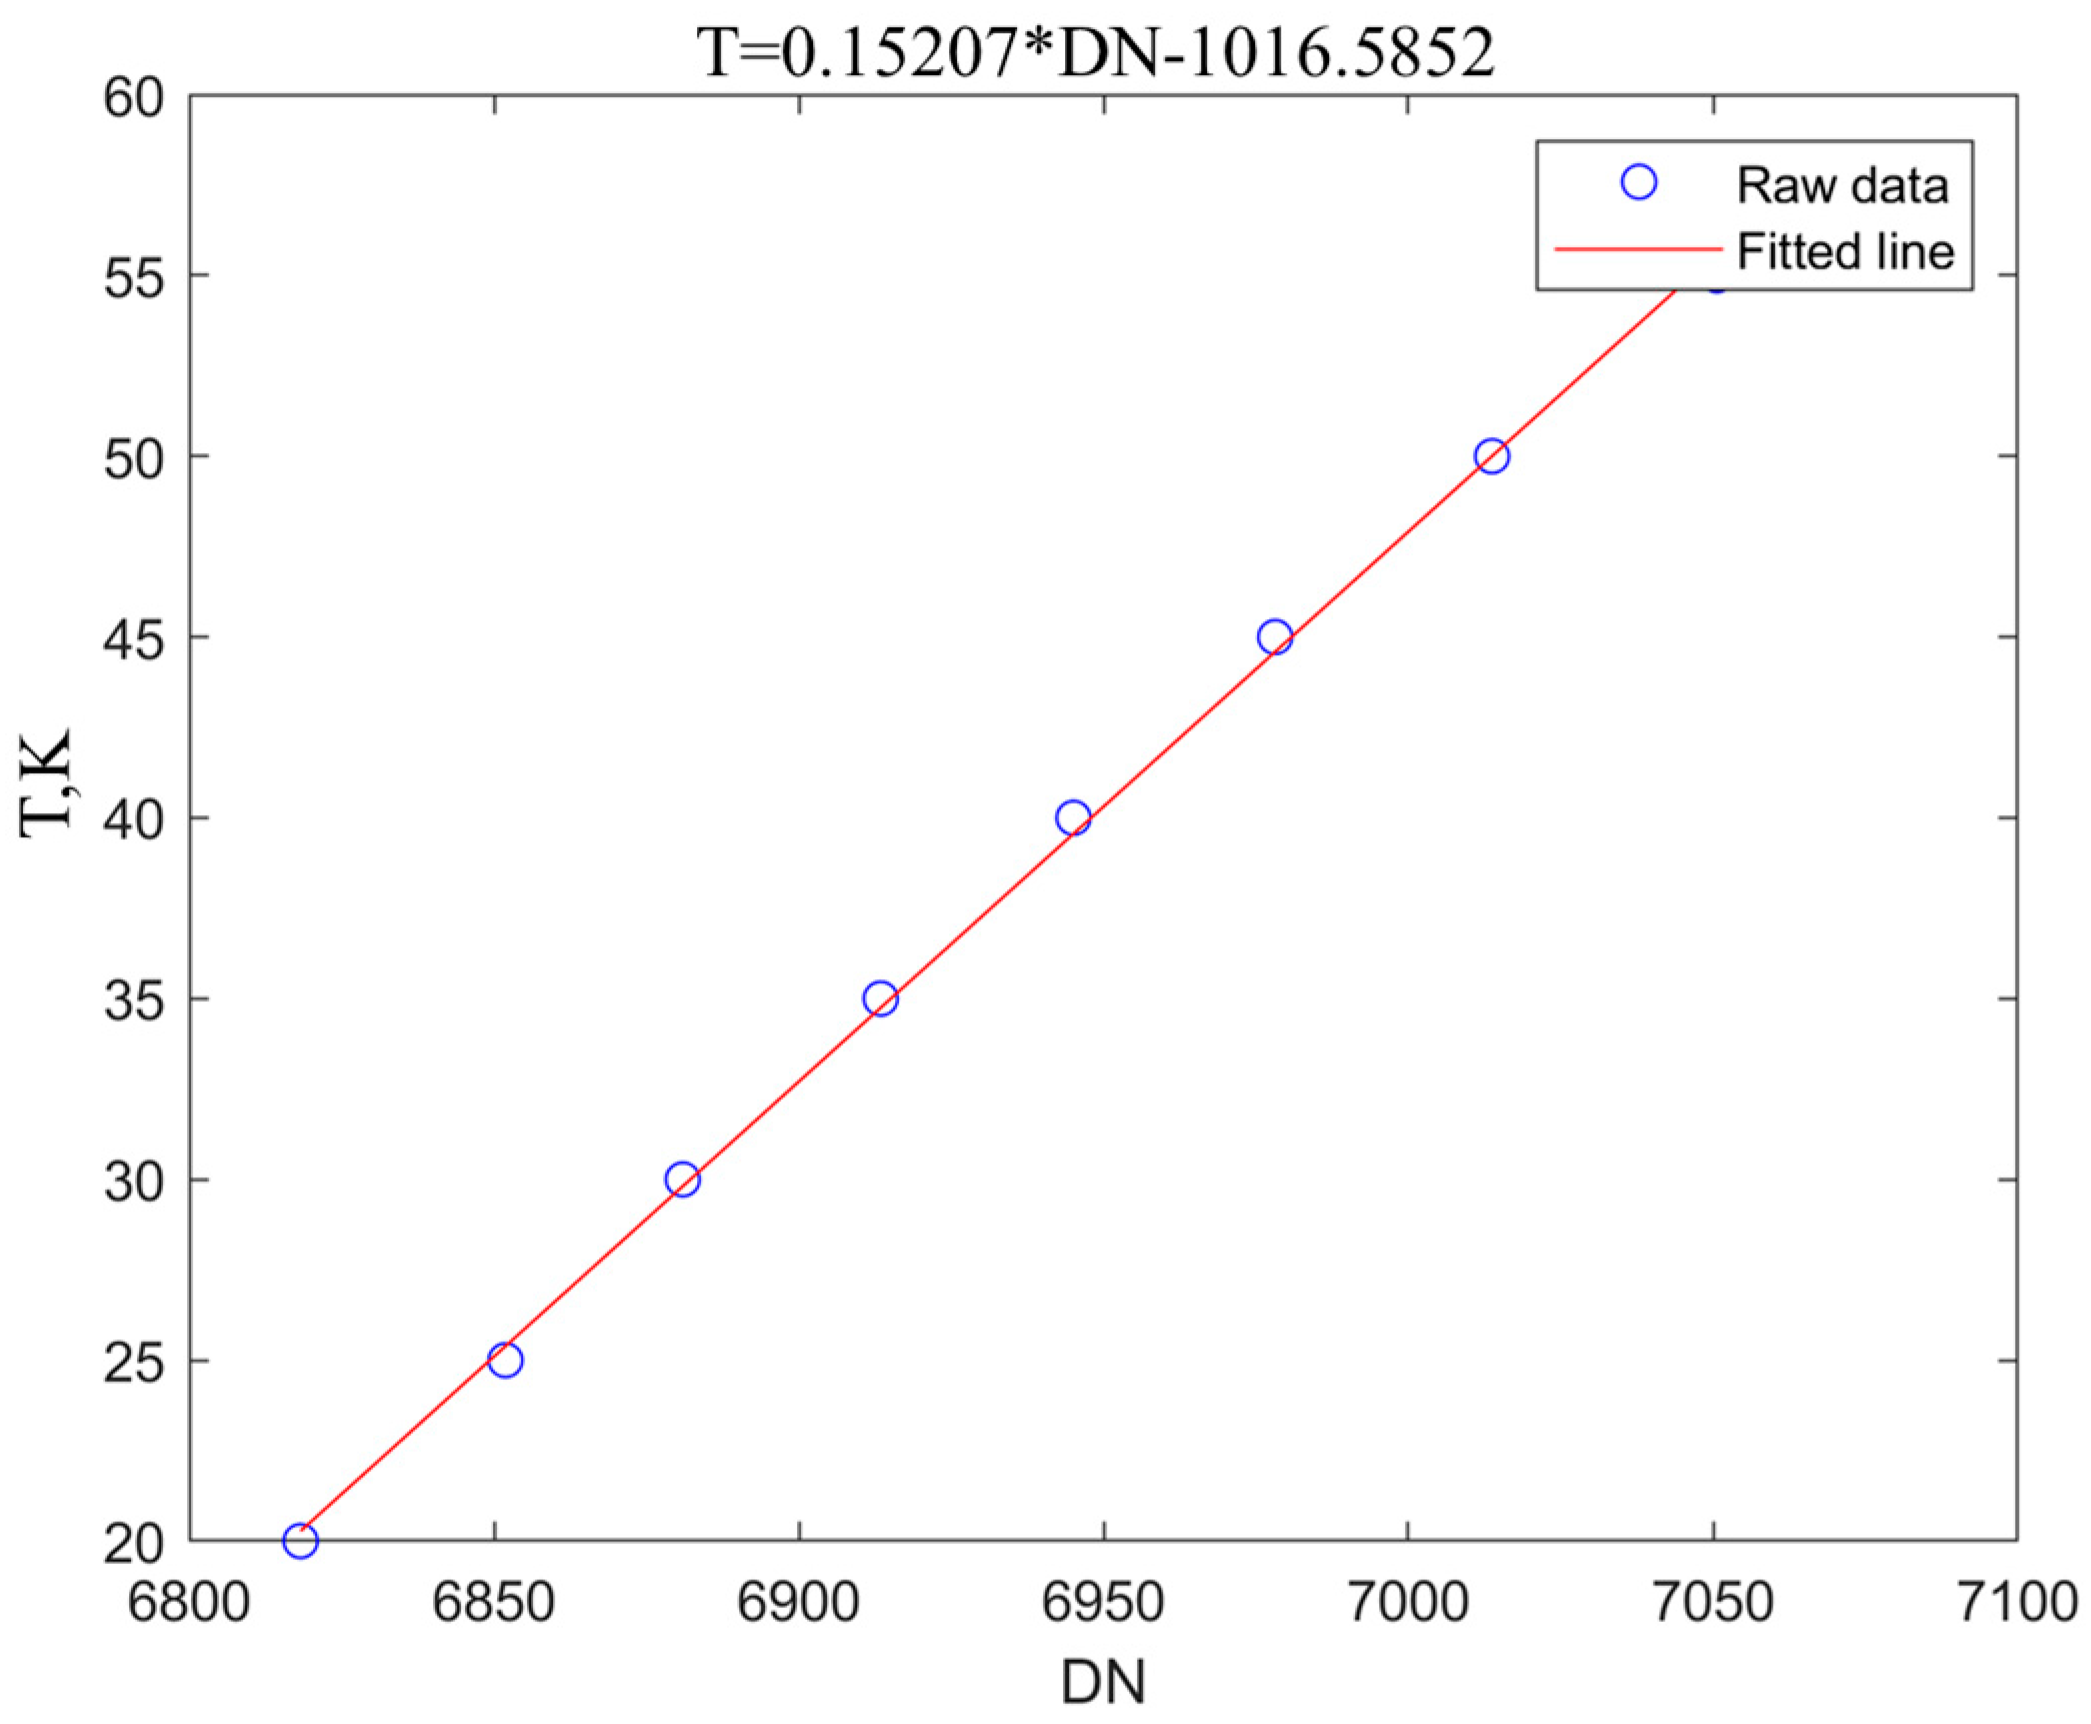
3.2. Radiometric Calibration and Temperature Calibration

Under conditions where the target surface is relatively uniform, the thermal properties of the target material are stable, and the wavelength range captured by the system is narrow, the grayscale values in infrared images can be approximated as having a linear relationship with the radiance of the target surface. To obtain reliable radiance information, the system is calibrated using a blackbody at known temperatures. This radiometric calibration establishes the conversion relationship between grayscale values and radiance in the infrared system. The calibration process ensures that the infrared images accurately reflect the radiance distribution on the target surface.
Assuming uniform spectral channel responses across the system, each channel corresponds to a unique radiometric calibration curve. By measuring signals from blackbodies at multiple temperatures, the influence of signal instability can be partially mitigated. For a channel with a central wavelength λ , the radiance received by the detector and the corresponding digital value (DN) of the pixel at coordinates (m,n) for a blackbody temperature T k are denoted as L m , n λ , T k and D N m , n λ , T k , respectively. These data are incorporated into a linear calibration model:
L m , n λ , T k = a D N m , n λ , T k + b ,
where a and b are radiometric calibration coefficients: a represents the system responsivity, and b is the response offset. The coefficients are determined using a least-squares algorithm to achieve calibration results for each channel.
The relationship between grayscale values (DN) and radiance for each channel is established through the following steps:
  • Acquire spectral data from blackbodies at multiple temperatures: Set blackbody temperatures from 30 °C to 60 °C in 5 °C increments. To account for potential instability in the infrared imaging system’s measurement signals and temperature errors in the blackbody, 100 consecutive frames are collected at each temperature point and averaged to improve calibration accuracy.
  • Generate grayscale–radiance curves: Plot the grayscale (DN values) against the blackbody radiance. A linear fitting method is applied to derive the conversion relationship between the DN values and radiance.
Similarly, a correspondence between background temperature and digital values (DN) can be established using analogous procedures.
To address the temperature drift issue in uncooled detectors, a dual-blackbody calibration method, as proposed by Tang et al. [15], is employed. The procedure is as follows: Two standard blackbody radiation sources are positioned directly in front of the system, with one blackbody maintained at a fixed temperature and the other adjustable. Radiation and temperature calibration are performed using a large-area blackbody radiation source system, independently developed by the University of the Chinese Academy of Sciences, Hangzhou Institute for Advanced Study. The system consists of a temperature controller, a planar radiating cavity, and a water chiller. It provides a highly stable and uniform radiation reference for infrared systems, as shown in Figure 5. The technical specifications of the temperature-controllable blackbody source are as follows
Operating temperature range: 0~90 °C;
Temperature resolution: 0.001 °C;
Temperature stability: ±0.002 °C @ 35 min;
Emissivity: ≥0.995 ± 0.001.
Figure 6 presents the results of radiometric calibration in the gas absorption band. The raw digital number (DN) values obtained from the infrared camera are converted into physical radiance values using the linear calibration equation. L denotes the spectral radiance in units of W/(m2·sr·μm), and DN is the grayscale output of the camera. The figure demonstrates that the radiometric correction effectively transforms the image data from arbitrary grayscale values into physically meaningful radiometric quantities, enabling subsequent gas detection analysis.
Figure 7 shows the results of temperature calibration for the non-absorption band. The DN values in this spectral region are converted into background temperature using the empirical calibration function. T is the retrieved background temperature in Kelvin (K) obtained from the digital number (DN) using the temperature calibration equation. This figure demonstrates that the non-absorption band provides a reliable reference for temperature estimation. It is worth noting that in this study, a linear approximation is used for the conversion from DN to temperature due to the relatively narrow temperature range involved. Within this limited range, the nonlinearity introduced by the Stefan–Boltzmann law is minimal, and the linear model offers a reasonable and practical simplification. However, for scenarios involving a broader temperature span, the linear assumption may no longer be valid. In such cases, more sophisticated calibration approaches should be considered to accurately capture the nonlinear relationship between DN and temperature.

3.3. Atmospheric Correction

The atmospheric correction in this study is based on the HITRAN (High-resolution Transmission Molecular Absorption Database) 2020 version. At the current stage, only the influence of water vapor (H2O) has been considered, as it is the dominant absorber in near-surface infrared radiation transmission. This approach allows us to model the atmospheric transmittance affecting gas detection with reasonable accuracy.
Atmospheric transmittance can be computed using environmental humidity, temperature, pressure, and observation distance. The measured humidity value is first converted to water vapor concentration using the following equation:
C H 2 O = R H P s T a P ,
where R H is the relative humidity (unitless), P s T a is the saturation vapor pressure at ambient temperature T a (in Pa), and P is the atmospheric pressure (in Pa).
Subsequently, the atmospheric transmittance τ a t m , λ is calculated via the Lambert–Beer law:
τ a t m , λ = exp i α i λ C i s = e α H 2 O λ C H 2 O d ,
where α H 2 O is the absorption coefficient of water vapor (in cm−1/(g·m−3)), obtained from the HITRAN database, and d is the optical path length of water vapor (in m).
We collect the atmospheric parameters from the detection area. Given measured environmental parameters (temperature: 25 °C; relative humidity: 40%; pressure: 1013 Pa), the atmospheric transmittance for infrared radiation can be calculated based on water vapor absorption and optical path length. Considering only water vapor absorption, the procedure is as follows.
We calculate the saturation vapor pressure P s T a using the Magnus formula:
P s T a = 6.112 exp 17.67 T T + 243.5
We apply the Lambert–Beer law with α H 2 O , d , and C H 2 O to determine τ a t m . During field experiments, temperature and humidity data are retrieved in real time from the local meteorological station, ensuring timely and accurate input for the atmospheric correction model. In laboratory experiments, temperature and pressure sensors are connected to the gas cell to monitor its internal physical conditions, while environmental temperature and humidity sensors are used to measure ambient conditions. For water vapor under an optical path length of 60 m, the atmospheric transmittance ( τ a t m ) at 10.55 μm is calculated τ a t m , λ 1 = 0.997548 . At an ambient temperature of 25 °C, the atmospheric path radiance is modeled as the product of the blackbody radiance at T = 25 + 273.15 K and the atmospheric emissivity. The spectral radiance of the blackbody is derived from Planck’s law B λ 1 , T = 5.3696 × 10 4 cm 2 μ m 1 Sr 1 , and the atmospheric path radiance is then computed accordingly L path , λ 1 = 1.3166 × 10 6 cm 2 μ m 1 Sr 1 .

3.4. Background Radiation Reconstruction

The aim is to reconstruct the theoretical background radiation (assuming no gas presence) within the absorption band, enabling differential extraction of gas-specific signals. Background Radiation Reconstruction Procedure
a.
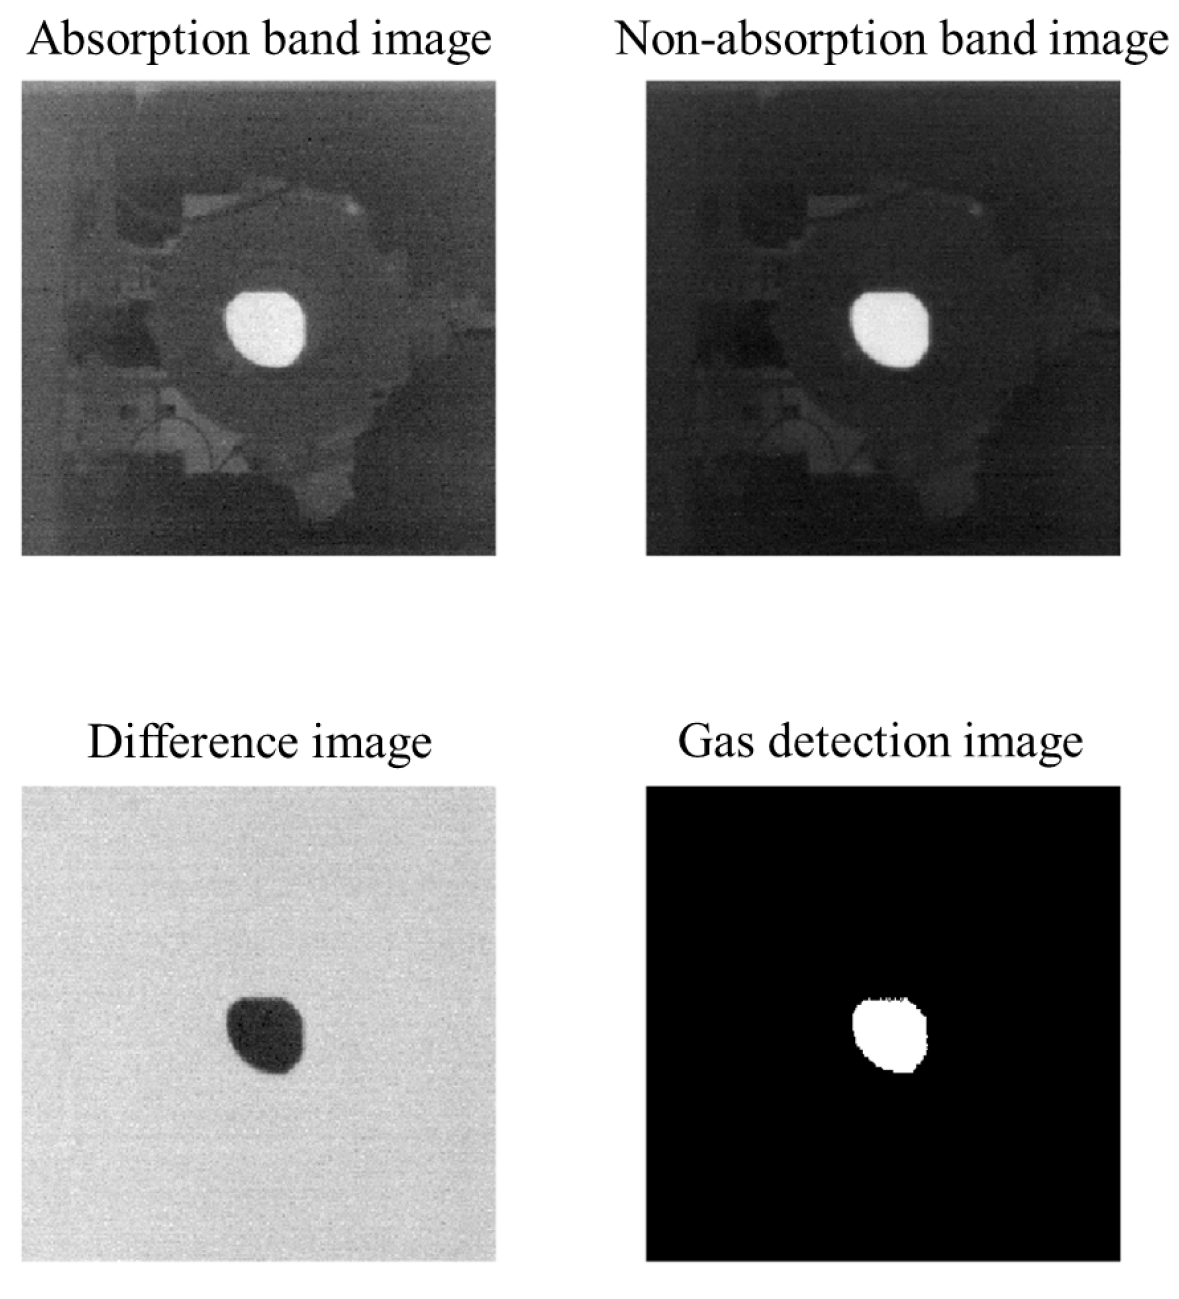
Non-Absorption Band Analysis
For the non-absorption band, the measured radiance contains only background radiation and atmospheric path radiance as the target gas has negligible absorption at this wavelength:
L λ 2 = L b g , λ 2 τ a t m , λ 2 + L p a t h , λ 2
b
Background Radiation Mapping
Assuming consistent background temperature between the absorption and non-absorption bands, we use the non-absorption band data to estimate the background temperature T b g ; then, we calculate the theoretical radiance L t h m e   a s u r e d , λ 1 in the absorption band using T b g :
L t h m e   a s u r e d , λ 1 = L T b g , λ 1 τ a t m , λ 1 L p a t h , λ 1
c.
Gas Signal Extraction via Differential Analysis
We subtract the theoretical background radiation L t h m e a s u r e d , λ 1 from the measured radiance L m e a s u r e d , λ 1 in the absorption band:
Δ L = L m e a s u r e d , λ 1 L t h m e a s u r e d , λ 1
We then apply threshold segmentation to ΔL: If ΔL > threshold, we classify the pixel as containing the target gas. To avoid recalculating blackbody radiance B λ 1 , T for temperatures between 1 and 100 °C, a pre-computed lookup table (LUT) is established, accelerating real-time processing.
Figure 8 displays the detection results from an outdoor SF6 gas release experiment. Row 1: Absorption-band infrared images; Row 2: Non-absorption-band infrared images; Row 3: Radiation difference images (ΔL); Row 4: Threshold-segmented gas detection images. Columns represent sequential frames, illustrating the dynamic process of SF6 gas accumulation. As shown in the figure, gas detection remains unaffected by moving objects in the scene, while the algorithm accurately delineates the morphology of gas leaks and captures their temporal diffusion process from initial release to full development.
In addition, to evaluate the robustness and adaptability of the proposed algorithm under varying thermal conditions, we conducted controlled experiments in a laboratory environment. As shown in the experimental setup Figure 9, the gas pool was placed under conditions where the blackbody temperature was set to 50 °C and the background temperature was set to 20 °C. Detection tests were then performed for two scenarios: those with and without gas present in the cell.
The corresponding results are presented in Figure 10 and Figure 11, where Figure 10 shows the detection image with gas present, and Figure 11 shows the result without gas. These results demonstrate that even under significant temperature gradients, the dual-band background inversion algorithm remains effective in identifying gas leak regions, confirming its environmental adaptability and potential for practical deployment.

4. Conclusions

This study addresses the modern industrial requirements for gas leak detection—non-contact operation, 24/7 applicability, and rapid response—by proposing a method based on dual-band radiation background inversion for gas detection and elucidating the working principles of infrared gas imaging. The methodology involves radiometric calibration, temperature calibration, and atmospheric correction for gas detection. Specifically, the theoretical radiation background in the absorption band is reconstructed by inverting the background temperature using data from the non-absorption band. Gas leaks are then identified by calculating the difference between this reconstructed background and the actual measured radiation in the absorption band. Experimental results demonstrate that the algorithm effectively detects gas plume morphology without requiring prior acquisition of reference backgrounds, making it suitable for field applications.
However, the detection accuracy heavily depends on the outcomes of radiometric and temperature corrections, as well as the empirically selected threshold (currently derived from image analysis rather than gas-specific minimum detectable concentration limits). Furthermore, while the radiation difference could theoretically enable quantitative gas concentration analysis, this necessitates additional gas calibration experiments, highlighting a critical area for future research.
It should also be noted that the current validation is limited to SF6 gas. Due to experimental constraints, tests on other industrial gases, such as CH4 and CO2, could not be conducted, which restricts the assessment of the method’s generalizability. Future studies are encouraged to extend the methodology to gases with diverse absorption characteristics to further validate its applicability across different scenarios.
In addition, a quantitative comparison with existing methods—such as conventional image subtraction or deep learning-based detection algorithms—has not been performed. The absence of standardized datasets and shared implementation platforms limits the direct evaluation of performance indicators such as detection accuracy, false-alarm rates, and computational cost. Nonetheless, the proposed method demonstrates unique advantages, including the elimination of the need for reference background acquisition and the ability to adapt to dynamic environments, laying a solid foundation for future comparative analyses.
Finally, the proposed method aligns with key considerations in industrial safety standards for gas detection. For example, IEC 60079 [16] specifies requirements for explosive atmospheres, while ISO 26142 [17] outlines performance criteria for infrared gas leak detection systems. Although formal certification is beyond the current study’s scope, the non-contact, real-time nature of the method—along with its demonstrated sensitivity—suggests strong potential for compliance with these standards. Future work will consider integrating standard-specific evaluation protocols and calibration procedures to further support practical deployment in safety-critical environments.

Author Contributions

Methodology, L.C.; Software, L.C.; Formal analysis, Z.Y.; Resources, L.C.; Data curation, Z.Y.; Writing—original draft, L.C.; Supervision, L.C.; Project administration, L.C. All authors have read and agreed to the published version of the manuscript.

Funding

This research was funded by the Zhejiang Provincial “Jianbing Lingyan + X” Research and Development Program of China, grant numbers 2024C01126, 2024C03032, and 2023C012.

Institutional Review Board Statement

Not applicable.

Informed Consent Statement

Not applicable.

Data Availability Statement

Data are contained within the article.

Conflicts of Interest

The authors declare no conflicts of interest.

References

  1. Meribout, M. Gas Leak-Detection and Measurement Systems: Prospects and Future Trends. IEEE Trans. Instrum. Meas. 2021, 70, 4505813. [Google Scholar] [CrossRef]
  2. Wang, L.; Cheng, Y.; Gopalan, S.; Luo, F.; Amreen, K.; Singh, R.K.; Goel, S.; Lin, Z.; Naidu, R. Review and Perspective: Gas Separation and Discrimination Technologies for Current Gas Sensors in Environmental Applications. ACS Sens. 2023, 8, 1373–1390. [Google Scholar] [CrossRef] [PubMed]
  3. Wang, X.; Xu, S.; Dong, K.; Jin, W. Infrared gas image segmentation method based on background modeling and density clustering. Infrared Technol. 2024, 46, 1355–1361. [Google Scholar]
  4. Wang, Q.; Sun, Y.; Pan, X.; Xing, M.; Zhao, Y. Optical Gas Imaging for Accurate Leakage Source Measurement Based on Optical Flow Analysis. IEEE Trans. Instrum. Meas. 2025, 74, 8. [Google Scholar] [CrossRef]
  5. Zhao, Q.; Nie, X.; Luo, D.; Wang, J.; Li, Q.; Chen, W. An Effective Method for Gas-Leak Area Detection and Gas Identification with Mid-Infrared Image. Photonics 2022, 9, 992. [Google Scholar] [CrossRef]
  6. Wang, M.; Yuan, P.; Qiu, S.; Jin, W.; Li, L.; Wang, X. Dual-Encoder UNet-Based Narrowband Uncooled Infrared Imaging Denoising Network. Sensors 2025, 25, 1476. [Google Scholar] [CrossRef] [PubMed]
  7. Wang, Q.; Xing, M.; Sun, Y.; Pan, X.; Jing, Y. Optical gas imaging for leak detection based on improved deeplabv3+ model. Opt. Lasers Eng. 2024, 175, 108058. [Google Scholar] [CrossRef]
  8. Xu, S.; Wang, X.; Sun, Q.; Dong, K. MWIRGas-YOLO: Gas Leakage Detection Based on Mid-Wave Infrared Imaging. Sensors 2024, 24, 4345. [Google Scholar] [CrossRef] [PubMed]
  9. Yu, H.; Wang, J.; Wang, Z.; Yang, J.; Huang, K.; Lu, G.; Deng, F.; Zhou, Y. A lightweight network based on local–global feature fusion for real-time industrial invisible gas detection with infrared thermography. Appl. Soft Comput. 2024, 152, 111138. [Google Scholar] [CrossRef]
  10. Yao, J.J.; Xiong, Z.H.; Li, S.G.; Yu, Z.; Liu, Y. TSFF-Net: A novel lightweight network for video real-time detection of SF6 gas leaks. Expert Syst. Appl. 2024, 247, 15. [Google Scholar] [CrossRef]
  11. Kastek, M.; Sosnowski, T.; Orżanowski, T.; Kopczyński, K.; Kwaśny, M. Multispectral gas detection method. WIT Trans. Ecol. Environ. 2009, 123, 227–236. [Google Scholar]
  12. Marc-André, G.; Karl-Alexandre, J.; Frédérick, M.; Pierre, T.; Vincent, F.; Éric, G.; Martin, C. Time-resolved thermal infrared multispectral imaging of gases and minerals. In Electro-Optical and Infrared Systems: Technology and Applications XI; SPIE: Bellingham, WA, USA, 2014; Volume 9249, pp. 268–277. [Google Scholar]
  13. Tian, C.; Yang, B.; Cai, M.; Fan, Q.; Wang, B.; Wang, W.; Qu, S. Influence of atmospheric Background on infrared target detection. Infrared Laser Eng. 2014, 43, 438–441. (In Chinese) [Google Scholar]
  14. Flanigan, D.F. Limits of passive remote detection of hazardous vapors by computer simulation. In Electro-Optical Technology for Remote Chemical Detection and Identification; SPIE: Bellingham, WA, USA, 1996; Volume 2763, pp. 117–127. [Google Scholar]
  15. Tang, G.; Ding, F.; Li, D.; Zhao, B.; Li, C.; Wang, J. Enhancing Open-Space Gas Detection Limit: A Novel Environmentally Adaptive Infrared Temperature Prediction Method for Uncooled Spectroscopy. Sensors 2024, 24, 7173. [Google Scholar] [CrossRef] [PubMed]
  16. IEC E. 60079; Explosive Atmospheres—Part 0: Equipment—General Requirements. International Electrotechnical Commission: Geneva, Switzerland, 2017.
  17. ISO 26142:2022; Hydrogen Detection Apparatus—Stationary applications. ISO: Geneva, Switzerland, 2022.
Figure 1. Spectral absorption curve of SF6.
Photonics 12 00570 g001
Figure 2. Daul-band filter transmittance.
Photonics 12 00570 g002
Figure 3. Three-layer atmospheric radiative transmission detection model.
Photonics 12 00570 g003
Figure 4. Temperature drift correction.
Photonics 12 00570 g004
Figure 5. Large-area blackbody radiation source (300 × 300 mm2).
Photonics 12 00570 g005
Figure 6. Radiometric correction in the absorption band.
Photonics 12 00570 g006
Figure 7. Temperature correction in the non-absorption band.
Photonics 12 00570 g007
Figure 8. Detection results of SF6 gas release experiment in the external field: (a) frame 20; (b) frame 80; (c) frame 150; (d) frame 200; (e) frame 250; (f) frame 300.
Photonics 12 00570 g008
Figure 9. The experimental setup.
Photonics 12 00570 g009
Figure 10. Gas present in the gas pool.
Photonics 12 00570 g010
Figure 11. Non-gas present in the gas pool.
Photonics 12 00570 g011
Disclaimer/Publisher’s Note: The statements, opinions and data contained in all publications are solely those of the individual author(s) and contributor(s) and not of MDPI and/or the editor(s). MDPI and/or the editor(s) disclaim responsibility for any injury to people or property resulting from any ideas, methods, instructions or products referred to in the content.

