Article

Finite Element Method-Based Modeling of a Novel Square Photonic Crystal Fiber Surface Plasmon Resonance Sensor with a Au–TiO2 Interface and the Relevance of Artificial Intelligence Techniques in Sensor Optimization

Department of Electrical and Electronics Engineering, Ariel University, Ariel 40700, Israel
*
Author to whom correspondence should be addressed.
Photonics 2025, 12(6), 565; https://doi.org/10.3390/photonics12060565
Submission received: 16 April 2025 / Revised: 17 May 2025 / Accepted: 28 May 2025 / Published: 4 June 2025
(This article belongs to the Special Issue Optical Measurement Systems, 2nd Edition)

Abstract

:
This research presents a novel square-shaped photonic crystal fiber (PCF)-based surface plasmon resonance (SPR) sensor, designed using the external metal deposition (EMD) technique, for highly sensitive refractive index (RI) sensing applications. The proposed sensor operates effectively over an RI range of 1.33 to 1.37 and supports both x- polarized and y-polarized modes. It achieves a wavelength sensitivity of 15,800 nm/RIU and 14,300 nm/RIU, and amplitude sensitivities of 11,584 RIU−1 and 11,007 RIU−1, respectively, for the x-pol. and y-pol. The sensor also reports a resolution in the order of 10−6 RIU and a strong linearity of R2 ≈ 0.97 for both polarization modes, indicating its potential for precision detection in complex sensing environments. Beyond the sensor’s structural and performance innovations, this work also explores the future integration of artificial intelligence (AI) into PCF-SPR sensor design. AI techniques such as machine learning and deep learning offer new pathways for sensor calibration, material optimization, and real-time adaptability, significantly enhancing sensor performance and reliability. The convergence of AI with photonic sensing not only opens doors to smart, self-calibrating platforms but also establishes a foundation for next-generation sensors capable of operating in dynamic and remote applications.

1. Introduction

Photonic crystal fiber (PCF)-based surface plasmon resonance (SPR) sensors present a cutting-edge technology in the field of optical sensing, offering advantages like high sensitivity and precise detection in various research fields such as biosensing, chemical detection, biomedical analysis, and environmental monitoring [1,2]. The merger of PCF SPR enables an unprecedented level of performance, especially in applications requiring sensitivity to small changes in the detection of biological markers at very low concentrations, such as pollutant detection, food quality analysis, and medical applications [3]. PCF is a specialized subset of optical fiber that incorporates a periodic arrangement of micro-structured air holes running along the length of the fiber. This structure can further be varied as per convenience to obtain more sensitive and cutting-edge features. These fibers’ properties can be varied by altering the size, shape, and arrangement of the air holes [4]. This structural flexibility gives PCFs an edge over traditional fibers in various optical applications, particularly in sensors. PCF SPR sensors possess unique properties, some of which can be listed as follows:
  • The periodic arrangement of air holes allows for fine-tuning of the effective refractive index (RI), making PCFs ideal for controlling light propagation in sensing applications [5].
  • The ability of PCF to guide light in the core while exposing it to the surrounding medium maximizes the light–matter interaction (LMI), making PCFs particularly sensitive to small changes in the RI, which is crucial for detecting biomolecular interactions, pollutants, or other trace elements [6].
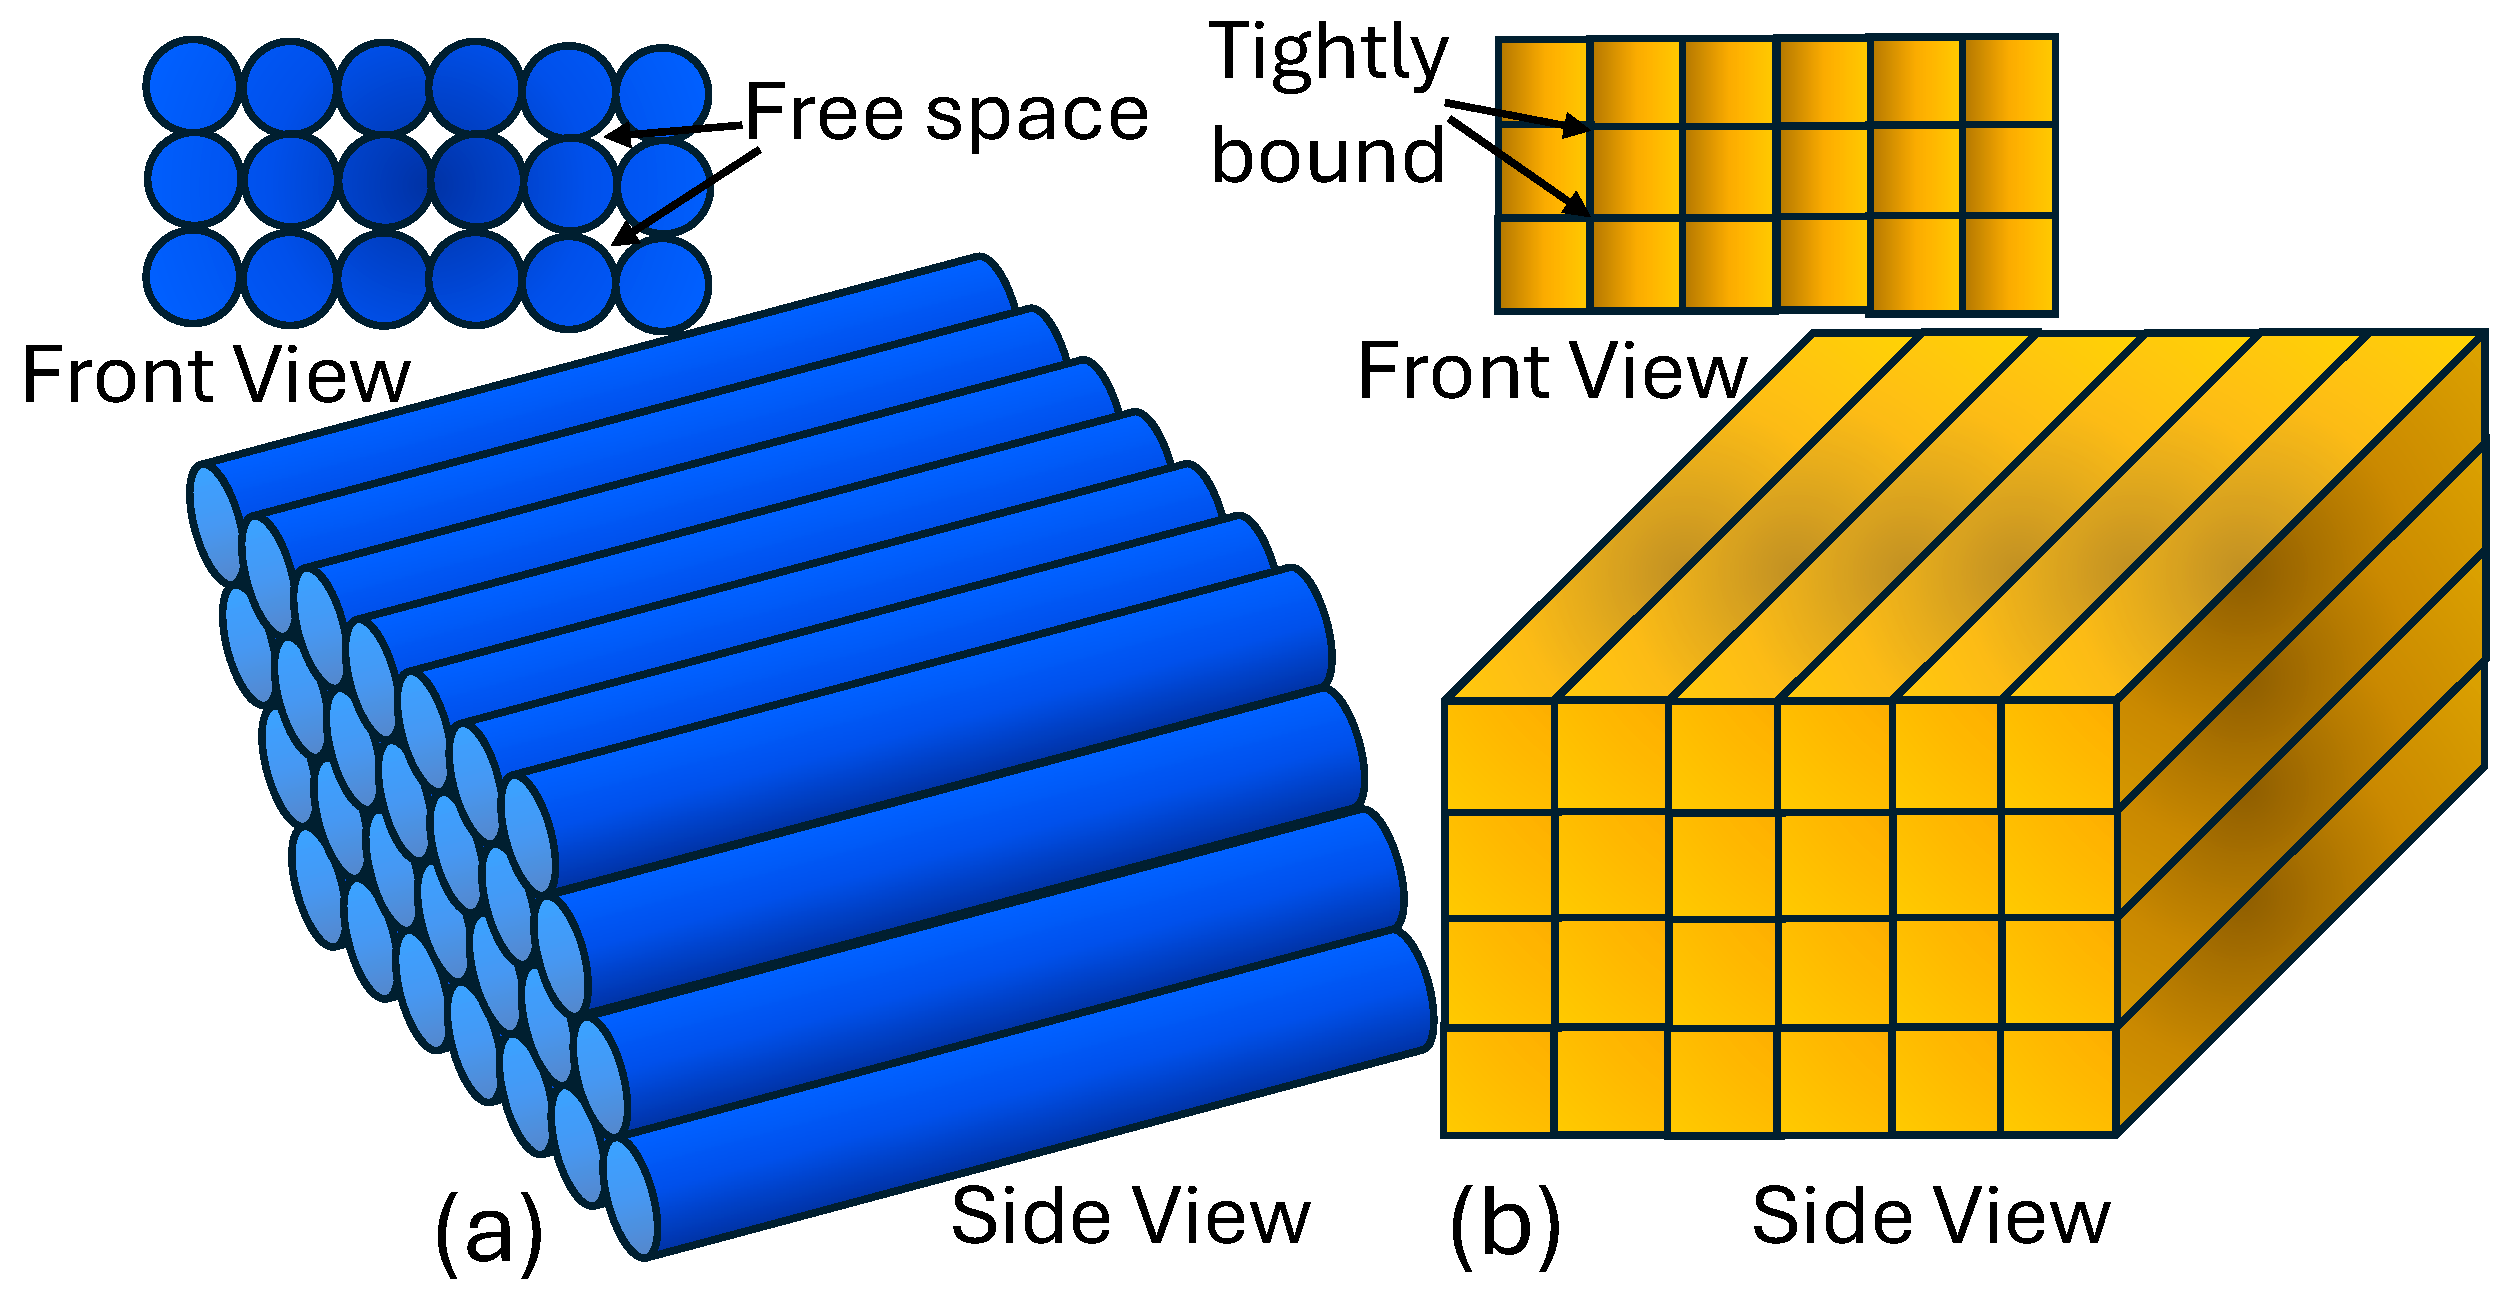
  • The optimization of light confinement in the core and the ability to work in both single-mode and multi-mode configurations result in minimal transmission losses, enhancing the sensitivity of sensors based on PCFs [7].
In recent years, a wide range of optical sensing platforms have been developed, including micro-ring resonators [8], fiber Bragg gratings [9], fiber-based lasers [10], multi-mode interference-based sensors [11], and SPR systems [12]. Among these, SPR sensors have emerged as highly promising due to their exceptional sensitivity and adaptability to various sensing environments. The integration of PCF structures with SPR mechanisms has further enhanced their potential, as the customizable architecture of PCFs allows for the efficient manipulation of the evanescent field and supports optimized single-mode light guidance, thereby facilitating strong plasmon light coupling.
SPR technique uses the phenomenon of surface plasmon excitation, where electromagnetic waves lie at the interface between a metal and a dielectric surface, which results in the development of the resonance condition that is highly sensitive to changes in the RI at the metal surface [13]. SPR sensors are widely used to detect minute changes in the RI, which is indicative of interactions occurring at the sensor’s surface. The sensitivity of SPR sensors to the local RI at the sensor surface makes them useful in biosensing applications, where even small concentrations of biomolecules can cause detectable shifts in the resonance wavelength (RW) [14]. The combination of PCF and SPR in optical sensing provides a powerful and highly sensitive platform for detecting molecular and environmental changes. The inherent advantages of PCF, such as enhanced light confinement, high sensitivity, and tunable properties, complement the SPR technique’s ability to detect minute RI changes at the metal–dielectric interface. In PCF-SPR sensors, the interaction between surface plasmon polaritons (SPPs) and the guided core mode occurs at a specific wavelength referred to as the RW, where the real components of their effective refractive indices coincide. This resonance condition makes the device highly responsive to even minor changes in the surrounding RI, leading to noticeable spectral shifts that can be used for precise analyte detection [5].
A diverse range of plasmonic materials has been explored to enhance the performance of SPR sensors. These materials include noble metals like gold (Au), silver (Ag), and copper (Cu) [15]; two-dimensional (2D) materials such as graphene; metal oxides like titanium dioxide (TiO2) [16]; and a variety of transparent conducting oxides (TCOs), including indium tin oxide (ITO) and aluminum-doped zinc oxide (AZO) [17]. Each material offers distinct optical properties that influence the sensitivity, stability, and spectral response of the SPR sensor [18].
Au remains the most extensively utilized plasmonic material due to its excellent chemical inertness, long-term stability in harsh environments, and strong plasmonic resonance in the visible and near-infrared regions [19]. Although Ag provides a sharper and more pronounced plasmonic resonance, which can result in higher sensitivity, its susceptibility to oxidation and degradation limits its long-term usability, particularly in aqueous or biological sensing environments [20]. Graphene and graphene-based composites have recently attracted significant attention for SPR enhancement due to their tunable conductivity, high carrier mobility, large surface-to-volume ratio, and biocompatibility. When layered over traditional metals or used in hybrid structures, graphene can improve sensor sensitivity and enable functionalization for specific biochemical targets [21]. TCOs, such as ITO and AZO, offer an alternative plasmonic response in the near-infrared region, along with electrical tunability and compatibility with CMOS processing [22].
PCFs have evolved into various structural configurations to enhance their performance for sensing applications, particularly in SPR-based sensors. Common types include solid-core PCFs, which guide light via modified total internal reflection (TIR) and are often used with external metal coatings for SPR excitation [23]. Hollow-core PCFs, guiding light through a photonic bandgap effect, allow for direct interactions with analytes such as gases or low-index fluids [24]. Suspended-core PCFs feature a small core connected by thin silica struts within a large air hole, offering increased evanescent field exposure for enhanced sensitivity [25]. Slotted-core designs incorporate narrow gaps in the core, boosting field–analyte interactions and plasmonic coupling [26]. Dual-core or twin-core PCFs support mode coupling between two adjacent cores, improving sensitivity through resonance shifts [27]. D-shaped PCFs, formed by side-polishing or etching, provide a flat surface for efficient metal deposition and field interaction [28]. Tapered PCFs gradually reduce in diameter, concentrating the optical field and improving sensitivity, while multi-core PCFs integrate several cores for multi-parameter or multi-analyte sensing [29]. In PCFs based on the internal metal deposition (IMD) technique, the material coat is provided at the internal surface of the air holes, and in the external metal deposition (EMD) technique, the material coat is applied at the external body of the PCF [30]. Each geometry offers unique benefits in terms of light confinement, plasmonic interaction, and analyte accessibility, making PCF design a critical factor in the optimization of SPR sensor performance. In this research, we have presented a PCF SPR sensor model based on the EMD technique with a novel square-shape structure different from the conventional circular-shape structure. The square-shape PCF possess several advantages over the circular, which are discussed in the upcoming sections of this article.
Finally, the combination of PCF SPR sensors creates a powerful platform for optical sensing with enhanced sensitivity and versatility across a range of applications. By integrating artificial intelligence (AI) into this system, the performance of PCF SPR sensors can be further optimized through real-time data analysis, pattern recognition, and adaptive feedback mechanisms. This integration not only boosts the performance of these sensors but also enables their deployment in more complex, dynamic environments, opening the door to next-generation sensing solutions in biosensing [31], environmental monitoring [32], and chemical detection [33]. Thus, the use of AI in PCF SPR sensors will revolutionize the experimental and simulation scenario computation.

2. Artificial Intelligence Algorithms for Enhancing PCF SPR Sensor Design and Performance

The integration of AI into PCF SPR sensors offers a transformative approach to optical sensing by enabling intelligent data processing, real-time adjustments, and optimization. The complexity of the data generated by these sensors, coupled with the need for high precision in dynamic environments, makes AI a crucial tool for improving sensor accuracy, efficiency, and reliability [34].
PCF SPR sensors usually generate large amounts of data, especially when monitoring multiple sensing parameters. AI algorithms, particularly machine learning (ML), can process these data efficiently and extract meaningful information that is not immediately identified through traditional analysis methods [35,36]. This allows for a more accurate real-time interpretation of sensor signals. In biosensing applications, ML models can classify and interpret minute shifts in the RW caused by molecular interactions, identifying specific biomarkers with greater sensitivity and accuracy. AI techniques can be employed to recognize complex patterns in the sensor data. This is especially valuable in applications like disease detection or environmental monitoring, where the relationships between sensor readings and real-world phenomena can be complex and nonlinear. AI can be used to continuously monitor sensor performance and environmental factors, by adjusting parameters in real-time to ensure optimal sensitivity and accuracy. For instance, if the sensor detects environmental interference or drift in its readings, AI can adjust operational parameters automatically, improving the sensor’s robustness. AI can help PCF SPR sensors adapt to changing conditions by learning from previous data and making intelligent predictions about future behavior [37]. This can lead to self-calibrating sensors that can adjust their performance autonomously, without the need for manual intervention. AI can also be used to monitor the health of the sensor system, detecting early signs of malfunction or drift. This is particularly beneficial in long-term or remote applications, such as environmental monitoring, where human intervention may not be feasible.

2.1. Bayesian Regularization Artificial Neural Networks (BRANNs) in PCF SPR Sensors

Bayesian regularization artificial neural networks (BRANNs) are a powerful and intelligent approach to enhance the performance of PCF-SPR sensors [38]. PCF-SPR sensors detect changes in the RI by monitoring RW shifts; however, these measurements can be affected by the optical system noise, fabrication imperfections, and environmental fluctuations. The BRANN algorithm effectively addresses these challenges by learning the complex nonlinear relationships between sensor inputs, such as spectral shifts, polarization (pol.) modes, environmental variables, and structural parameters, and target outputs like RI or analyte concentrations.
By applying BRANN, it minimizes overfitting, improves generalization to unseen data, and provides uncertainty estimates, making it ideal for real-time, high-accuracy predictions even with small or noisy datasets [39]. This makes BRANN especially effective for tasks such as calibrating sensor data, enhancing data interpretation in complex scenarios, and enabling the inverse design of sensor structures [40]. Its ability to self-regulate model complexity and handle nonlinear data relationship positions means that BRANN acts as a vital AI tool for advancing the accuracy, adaptability, and intelligence of PCF-SPR-based photonic sensing systems. The BRANN model can enhance the performance of PCF-SPR sensor design for analyte detection. PCF-SPR sensors are highly sensitive to changes in the RI of their surrounding medium, and accurately interpret the resulting spectral shifts by the critical identification of specific analytes. However, as we know, these sensors can be affected by noise, fabrication variations, and nonlinear environmental influences. To address these challenges, a BRANN algorithm can be utilized that mimics the human brain’s neuronal network, where interconnected artificial neurons (nodes) process input data such as RW shifts, pol. responses, and RI changes.
As shown in Figure 1a, the ANN architecture consists of input, hidden, and output layers, with each connection governed by adjustable weights. These weights are learned during training to establish accurate relationships between sensor outputs and target parameters like biomarker concentrations. The model employs a loss function to minimize prediction error during training [41]. Figure 1b presents the flowchart of the BRANN optimization algorithm used to classify the PCF SPR sensor models. One key concern in neural networks is overfitting, where the model performs well on training data but poorly on new, unseen inputs. BRANN mitigates this through Bayesian regularization, which controls model complexity by optimizing weight distributions and preventing overfitting, which is especially useful in scenarios with limited or noisy experimental data [42]. Unlike traditional neural networks that require separate datasets for training, validation, and testing, BRANN uses the full dataset for both fitting and evaluation, maximizing the utility of scarce sensor data. This intelligent modeling approach improves the reliability, precision, and adaptability of PCF-SPR sensors in real-world biomedical applications.

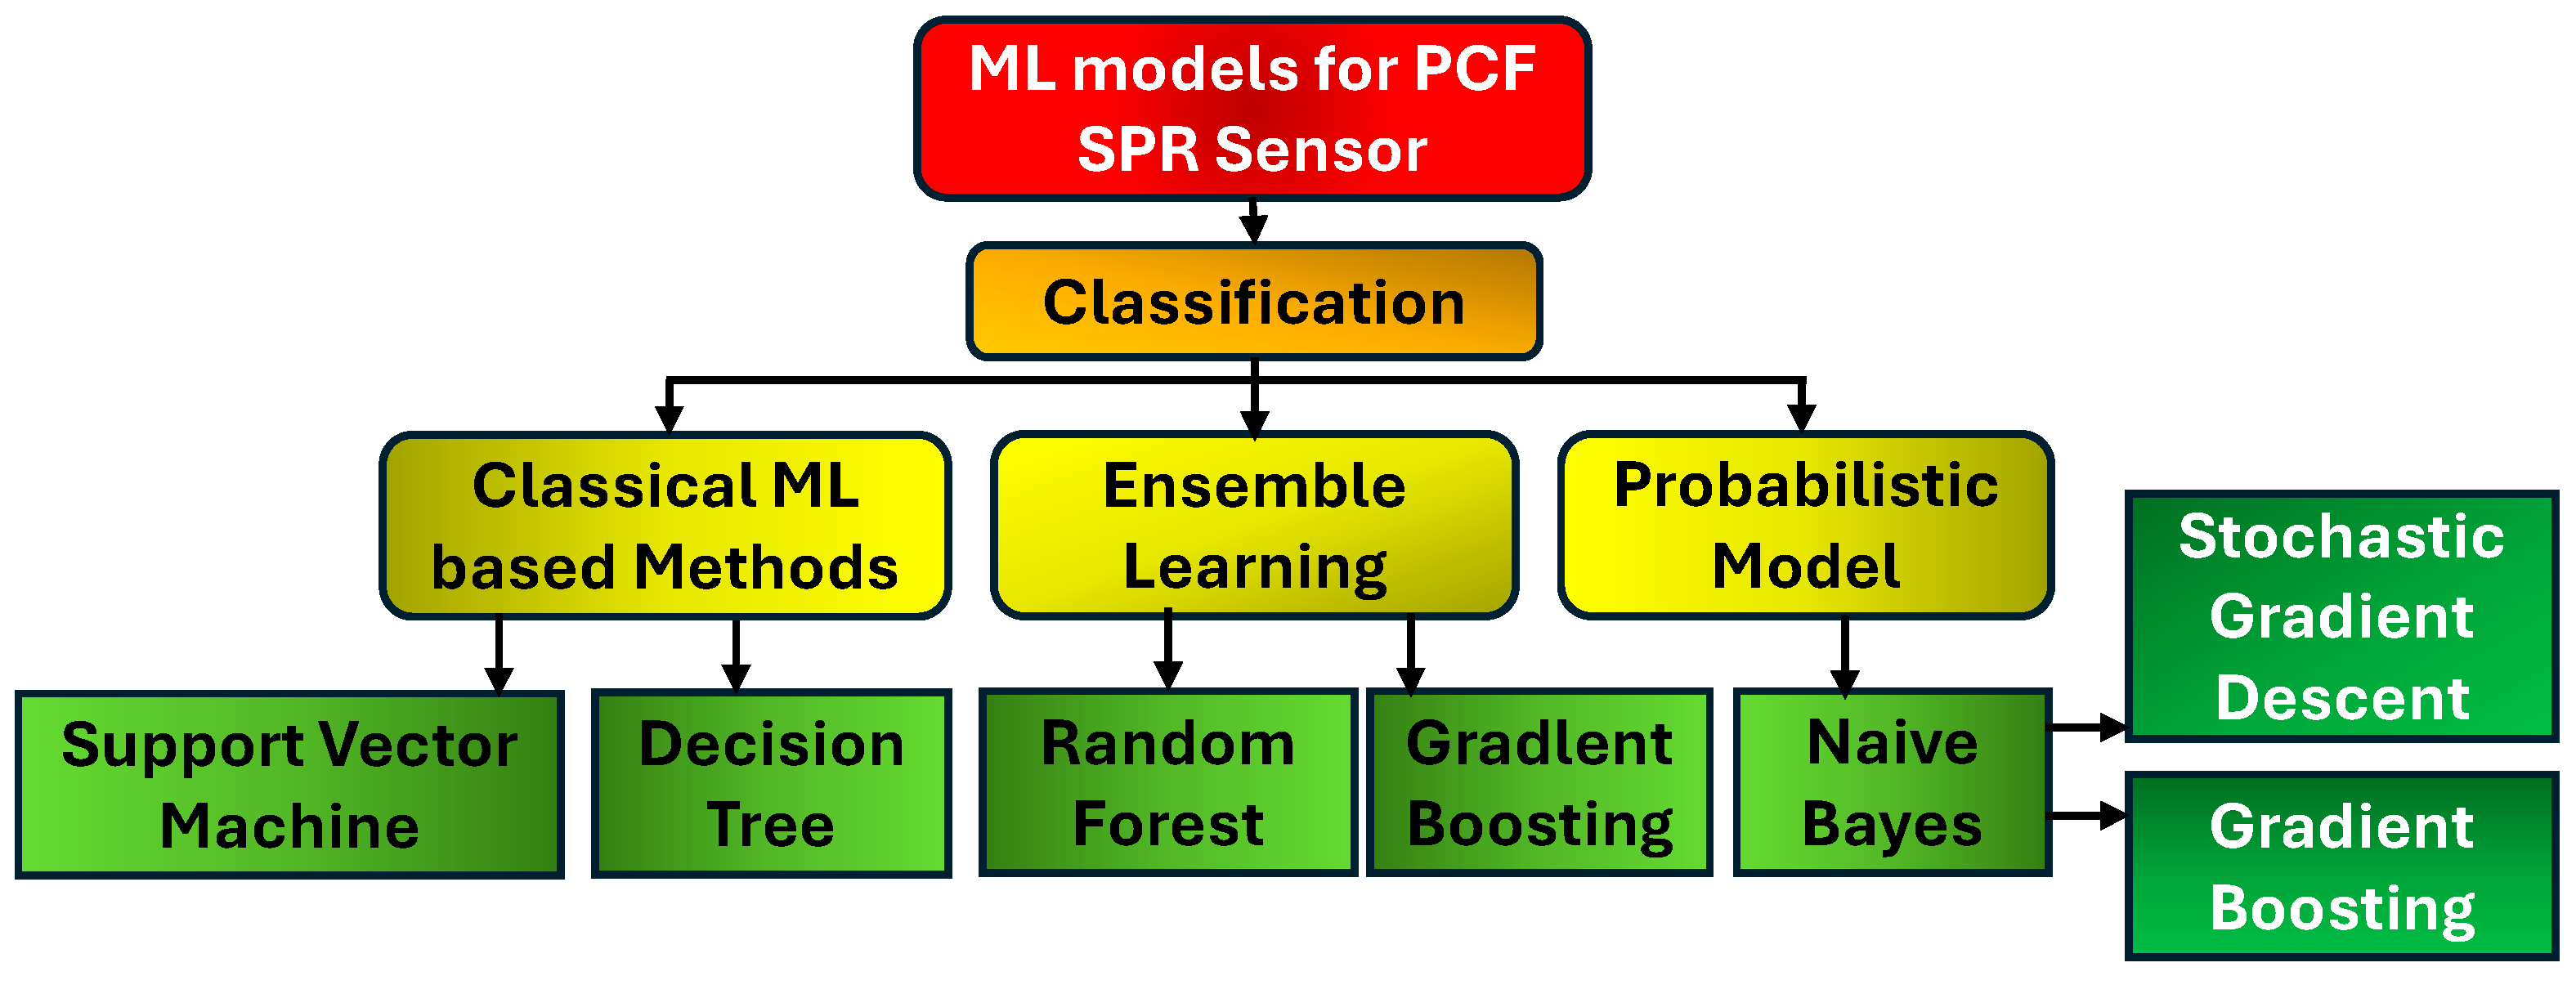
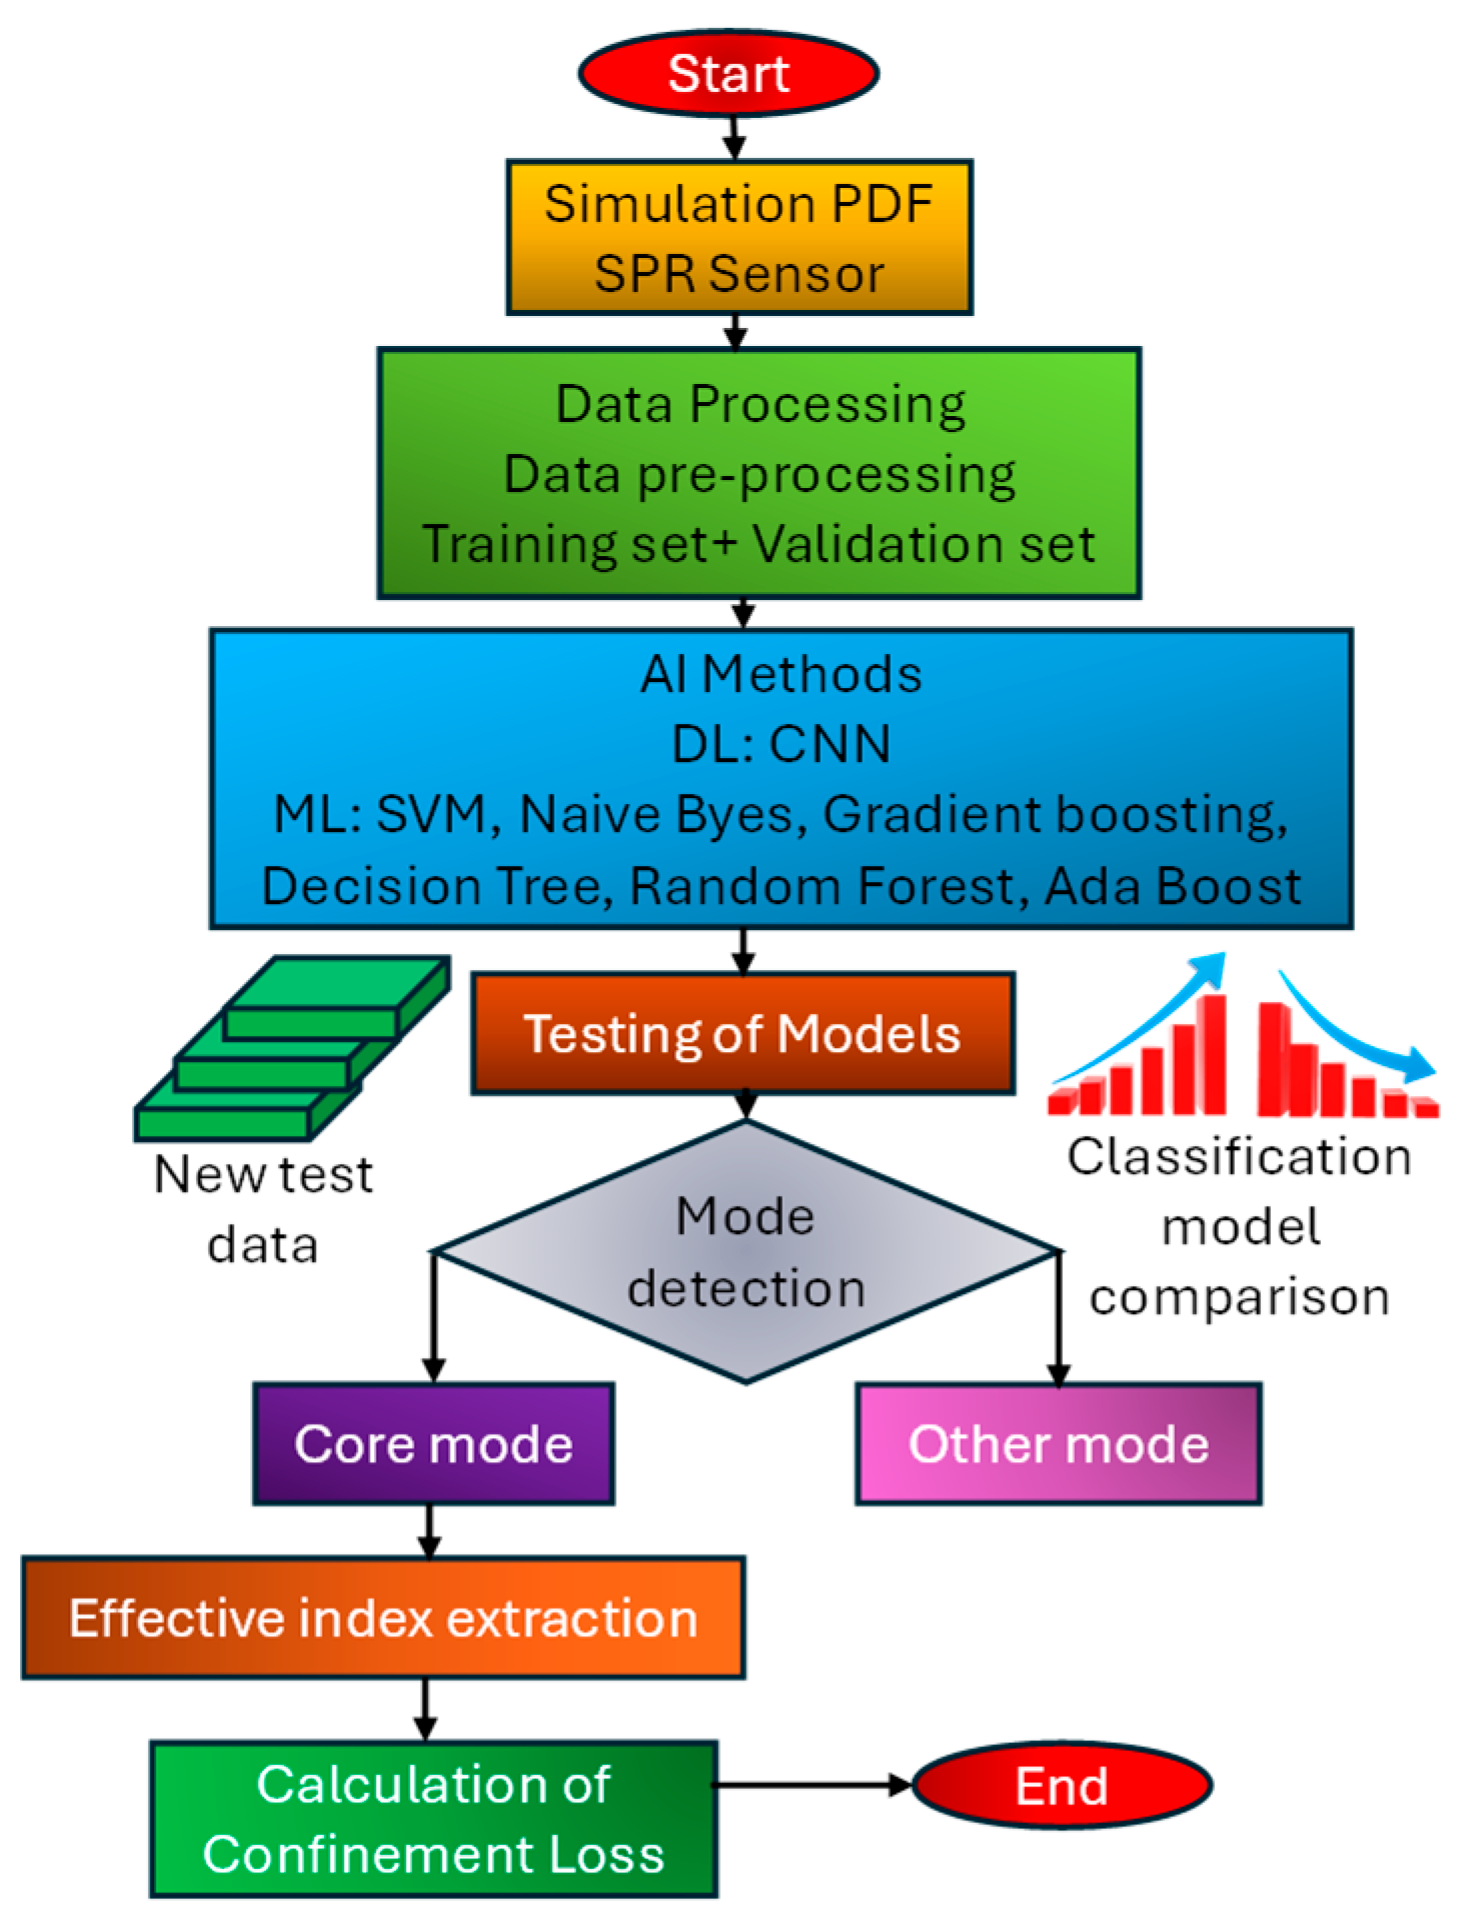
2.2. Machine Learning Models for PCF SPR Sensors

Supervised learning techniques can also be employed for the priori classification of the desired photonic modes concerning PCF SPR sensors. Classical ML approaches such as support vector machines (SVMs) and decision trees (DTs) can be employed [43,44]. Furthermore, ensemble learning techniques (ELTs), including both bagging and boosting methods, can be applied [45]. Specifically, random forest (RF), as a bagging-based approach [46], and Adaboost (AB) [47] and gradient boosting (GB) [48], as boosting-based algorithms, can be employed. Figure 2 presents the classification of the various ML algorithms which can be employed for PCF SPR sensor investigation.
In bagging, a bootstrap method is applied to generate multiple subsamples of the photonic mode sensor dataset with replacement. RF, as a bagging-type ELT, aggregates the predictions from multiple base learners and selects the majority-voted class (core mode or other modes) as the final output. In boosting algorithms like AB and GB, the output of one weak learner is sequentially passed to the next, incrementally improving the model to form a strong classifier. The mode images generated from simulations are used as the input dataset Xi, where i=1, 2, …, n (with n being the total number of modes), and the corresponding labels yi ∈ {0, 1} indicate core or non-core modes. Initially, AB assigns equal weights to all samples. At each iteration, a weak learner is trained. Misclassified samples have their weights increased, and a new learner is trained using the updated sample distribution. This process is repeated for f iterations, and the final class prediction is determined by a weighted majority vote among all learners. Additional comparisons can be made using naive bayes (NB) [49], a probabilistic ML model, and stochastic gradient descent (SGD) [50], which is considered to be a modern optimization-based classification technique.

2.3. Deep Learning Models for PCF SPR Sensors

The convolutional neural network (CNN)-based models can be used effectively for PCF SPR sensor modeling and investigation due to their unique properties of data analysis based on feature selection [51]. CNN models are usually used for image classification tasks due to their precise predictions. However, they possess drawbacks like a high computational time and demand a significant amount of annotated data during the training phase. In addition to having multiple model options, it may be necessary to use more than one performance index to assess their sensitivity to the available data [52]. Despite these drawbacks, CNN models can be used in PCF SPR sensing during this initial phase of the merger of AI and sensing. The integration of DL models with PCF SPR sensors presents a transformative approach for enhancing their design, performance prediction, and real-time application. DL techniques such as feedforward neural networks (FNNs) [53], convolutional neural networks (CNNs) [54], variational autoencoder (VAEs) [55] and conditional GANs [56] can been employed to predict sensor responses, classify analytes, and perform the inverse design of PCF structures based on target sensitivities. These models enable the rapid estimation of RW shifts and sensitivity values based on input parameters like RI, wavelength, and fiber geometry. Furthermore, denoising autoencoders and 1D CNNs can be used to filter noise from experimental and simulation data, improving signal clarity and robustness. In advanced applications, deep reinforcement learning (DRL) facilitates multi-parameter optimization for sensor configurations under physical and material constraints [57]. This synergy between DL and PCF SPR technology significantly accelerates sensor development, enhances analyte classification accuracy, and enables smart, real-time diagnostics in biomedical, and sensing applications. Figure 3 presents a flowchart of a DL-based model for PCF SPR sensor modeling and investigation.

3. Geometrical Modeling of the Proposed Sensor

The primary objective of designing the fiber structure in a square lattice is to optimize storage efficiency when multiple fibers are bundled together. Figure 4a illustrates a cluster of circular-shaped fibers, where significant empty space can be observed between adjacent fibers from the front view. In contrast, Figure 4b shows a cluster of square-shaped fibers, which are tightly packed with minimal or no gaps between them. This compact arrangement enhances space utilization. Therefore, a square-shaped PCF structure is proposed, based on SPR, for efficient analyte detection.
The sensor fiber is designed in a novel square-shape geometry. Figure 5a represents the 2D model of the proposed PCF SPR sensor with the distribution of the square air holes along the background material silica, the coat of plasmonic materials Au and TiO2, and the stacking of the PML over the analyte channel. Figure 5b represents the mesh configuration of the designed sensor.
The air holes of the proposed fiber are also designed in a square shape. Two lattices of square air holes are presented in the proposed PCF. The first lattice of air holes has a side length of 0.8 μm and is rotated across 360° degrees with a step of 45°. Similarly, the second lattice of air holes has a side length of 1.2 μm and is rotated across 360° degrees with a step of 30°. Two air holes lying at the top of the +y axis and bottom of the -y axis are removed from the lattice for proper mode formation.
The background material in the sensor model is fused silica. The RI is presented by the “Sellmeier equation” and expressed by Equation (1) [58].
n 2 λ = 1 + i = 1 3 B i × λ 2 λ 2 C i
where λ denotes the free-space wavelength in micrometers (µm), and Bi and Ci are empirically determined Sellmeier coefficients specific to fused silica. The values of these coefficients for fused silica are expressed as B 1 = 0.6961663, B 2 = 0.4079426, B 3 = 0.8974794, C 1 = 0.00467914826 μm2, C 2 = 0.0135120631 μm2, and C 3 = 97.9340025 μm2. A dual coat of plasmonic material Au and TiO2 is used in the sensor model. The thickness of the plasmonic material Au is taken as 50 nm and the thickness of the plasmonic material TiO2 is selected as 80 nm, respectively. These are optimized thicknesses of the materials at which the sensor will provide the most suitable sensing parameters. The RI of the Au is expressed by Equation (2) [59].
ε ω = ε ω p 2 ω 2 + i γ ω + j = 1 N ε j ω j 2 ω j 2 ω 2 i Γ j ω
where ε ω is the complex permittivity (dielectric function), ω is the angular frequency ( 2 π c / λ ) , ε is the high-frequency dielectric constant (background), ω p 2 is the bulk plasma frequency, γ is the Drude damping constant, ε j is the oscillator strength of the j th Lorentz oscillator, ω j 2 is the resonant frequency of the j th Lorentz oscillator, Γ j is the damping frequency of the j th Lorentz oscillator, and N is the number of Lorentz oscillators.
Similarly, the RI of TiO2 is expressed by Equation (3) [60].
n 2 λ = 5.913 + 0.2441 λ 2 0.0803
Au and TiO2 are deposited over PCF using the chemical vapor deposition (CVD) technique [61]. Au is considered a good plasmonic material because it is chemically inert, and a combination with TiO2 provides necessary adhesion and prevents it from being flaked off during extreme pressure. A square-shaped analyte layer is installed over the plasmonic coating to analyze the behavior of the analytes flowing through the channel. The thickness of the analyte channel is selected as 2.0 μm. Finally, the perfectly matched layer (PML) of a thickness of 2.25 μm is installed over the analyte channel to prevent the light from leaking out, especially in lossy or plasmonic modes. The analytes with RIs ranging from 1.33 to 1.37 which have a step size of 0.01 are investigated from the proposed sensor model.
In our proposed sensor model, Au and TiO2 are used as the plasmonic materials due to their complementary optical properties, which significantly enhance the overall sensing performance.
Key features for using Au as a plasmonic material are listed as follows:
  • Chemical stability and resistance to oxidation, which ensures long-term operation [62].
  • Strong and well-defined SPR in the visible and near-infrared (NIR) range, leading to enhanced field confinement and high sensitivity [62].
  • Biocompatibility, making it ideal for biosensing applications [62].
Key features for using TiO2 as a plasmonic material are expressed as follows:
  • It has a high RI, which enhances the evanescent field penetration into the sensing medium [63,64].
  • The ability to improve the adhesion and uniformity of the Au layer on the fiber surface [63,64].
  • It provides better field confinement, leading to sharper resonance peaks and improved detection accuracy [63,64].
When used together, the Au–TiO2 bilayer structure offers the following advantages:
  • TiO2 enhances the plasmonic coupling efficiency between the core mode and the surface plasmon mode supported by the Au layer [65].
  • The combination results in a stronger and more confined surface plasmon field, yielding higher sensitivity and sharper resonance dips [65].
  • TiO2 also helps reduce metal loss and provides a stable interface, thus enhancing the resolution and durability of the sensor [65].
Besides the use of traditional plasmonic materials, new AI-based approaches can also be implemented which can guide the selection of the optimum single or combination of plasmonic materials for PCF SPR sensor models. Some of these approaches are listed as follows:
The implementation of ML algorithms for material property prediction:
  • AI, particularly ML algorithms such as SVMs, random forests, and ANNs, can predict the key optical properties of materials, e.g., permittivity, RI, and plasmonic resonance frequency, based on structural and compositional features [66].
High-throughput computational screening:
  • AI can be integrated with density functional theory (DFT) and finite element method (FEM) simulations to conduct high-throughput screening of large material libraries. This helps identify candidates with optimal optical properties and minimal losses for plasmonic applications [67].
Generative models for novel material discovery:
  • Generative adversarial networks (GANs) and variational autoencoders (VAEs) can be applied to design new plasmonic materials by generating suitable candidates with target optical behaviors which have not yet been explored experimentally [68,69].
AI in experimental design optimization:
  • DRL algorithms can be used to guide experimental parameter tuning, e.g., the thickness of metal/dielectric layers, nanostructure dimensions, etc., to achieve desired plasmonic responses with fewer experimental iterations [70].
Figure 6 represents the mesh growth rate which controls how gradually the mesh size increases away from fine regions. The mesh statistical features are mesh vertices: 10,440, triangles: 20,684, edge elements: 2188, and vertex elements: 92. The domain element statistics include number of elements: 20,684, minimum element quality: 0.1437, average element quality: 0.8585, element area ratio: 0.002898, and mesh area: 176.6 μm2. Figure S1 represents a simulation movie for the proposed sensor, where the behavior of the core mode, the SPP mode, and the dispersion behavior for various eigen frequencies can be visualized. The simulation analysis of the sensor is conducted using COMSOL Multiphysics software package version 6.2, employing the electromagnetic waves, frequency domain (ewfd) interface. An FEM-based mode analysis study is performed to compute the fundamental guided modes and analyze their interactions with the plasmonic surface. To ensure accurate field confinement and eliminate reflections at the outer boundary, a scattering boundary condition (SBC) is applied to the sensor model.
Figure 7a illustrates the block diagram of the sensing setup designed for the detection of various analytes. A light source emitting at a suitable wavelength is directed through the proposed sensor. The input port is used for introducing different analyte samples into the sensor via appropriate infiltration techniques. The output port allows the processed sample to exit the sensor. During this process, the interaction between the light and the analyte is monitored using an optical spectrum analyzer (OSA). The resulting spectral response, including any RW shifts, is displayed on a connected laptop screen. These shifts correspond to different analytes, enabling accurate identification and detection.
Figure 7b presents the stack-and-draw fabrication technique employed for the proposed sensor structure. This method utilizes a combination of solid rods and capillary tubes arranged according to the designed geometry of the sensor. Capillaries, being the critical components, typically possess diameters smaller than those of the solid rods, making their precise positioning a significant challenge. If the capillary diameter is increased, it can reduce the number of air holes formed in the final PCF structure, potentially compromising the sensor’s performance. Therefore, selecting appropriately dimensioned capillaries is crucial for achieving the desired structural fidelity, then coats of Au and TiO2 are applied using CVD. During the drawing process, the furnace temperature must be set higher than the standard threshold, typically around 2000 °C, to enhance the surface tension of silica, facilitating better structural uniformity. An optimized balance between the drawing speed, capillary arrangement, and preform feed rate is essential to ensure the successful and reproducible fabrication of the proposed PCF-based sensor. Figure 7c represents the three-dimensional (3D) prototype of the proposed PCF.
SPR arises from the coupling of incident light with the collective oscillations of free electrons at the interface between a Au and a dielectric medium (analyte). In this design, light propagates through the core of a PCF, and an evanescent field extends into the adjacent cladding region, where the metal–dielectric interface is established. When transverse magnetic (TM) (x-pol.) and transverse electric (TE) (y-pol.) light meets the phase-matching condition between the guided core mode and the SPP mode at the metal interface, strong resonance occurs, resulting in a significant drop in transmitted intensity and an RW shift that is highly sensitive to changes in the analyte’s RI. The Au coating serves as the primary plasmonic material due to its chemical stability and low optical losses in the visible to NIR range. It facilitates strong plasmonic field confinement at the Au–analyte interface. The TiO2 dielectric layer plays a critical role in enhancing the electric field localization and tuning the effective RI at the interface. TiO2, with its high RI, acts as a coupling layer that improves the field penetration depth into the analyte region, allowing for increased sensitivity. It also helps to reduce the damping losses typically associated with metal-only SPR structures, thereby improving the sensitivity and resolution of the sensor. Overall, the plasmon excitation in the PCF-SPR sensor is governed by the phase-matching condition between the fundamental guided mode of the PCF and the SPP mode supported at the Au–TiO2 analyte interface. When the analyte’s RI changes, this condition changes, resulting in a measurable shift in the RW. This mechanism allows the sensor to operate in a label-free, real-time scenario, offering high sensitivity and specificity across a wide range of analytes. The 2D and 3D field distribution profiles of the core mode and SPP mode for the proposed sensor obtained for the analyte with an RI of 1.36 are presented in Figure 8.

4. Numerical Analysis of the Performance Parameters of the Proposed Sensor

The performance of the proposed sensor is evaluated based on standard sensing parameters like confinement loss (CL), amplitude sensitivity (AS), wavelength sensitivity (WS), sensor resolution (SR), the linear relationship between RW and RI, etc. In many cases, it has been observed that strong coupling occurs only along the single pol. mode. As a result, performance evaluations are typically limited to that pol. only. However, in the proposed sensor design, strong coupling is achieved along both pol. modes, owing to the symmetrical arrangement of the air hole geometries. According to the coupled-mode theory of light propagation, light can travel in both horizontal and vertical directions within the fiber. Therefore, the performance of the presented sensor is analyzed for both pol. modes. The simulation results are presented for the optimized thickness of plasmonic materials. Another reason to include both pol. in this investigation is to make readers aware that mode analysis is performed for 160 eigen frequencies, and this is a single case, which is why the role of AI has become utterly important in futuristic sensor investigations.

4.1. Calculation of CL for the Sensor Model

CL refers to the loss of energy as the guided light interacts with the cladding and core structure of the PCF. In these sensors, light is typically guided along the fiber, but a fraction of the light may leak out or be absorbed by the surrounding materials, causing the energy to dissipate. This loss can significantly affect the sensor’s performance, especially in sensing applications where the sensitivity and accuracy of measurements are critical. It is expressed by Equation (4) [71].
C L   ( d B / c m ) = 8.686 × ( 2 π / λ ) × I m ( n e f f ) × 10 4
where 2 π / λ is the wave number and I m ( n e f f ) is the imaginary part of the effective RI. The values of CL for the RIs of 1.33, 1.34, 1.35, 1.36, and 1.37 are 23.34, 18.73, 16.54, 13.87, and 11.57 dB/cm, respectively, for x-pol. and represented by Figure 9a. These values of CL are obtained at RWs of 932, 997, 1095, 1229, and 1387 nm, respectively. Similarly, the values of CL for the RIs of 1.33, 1.34, 1.35, 1.36, and 1.37 are 27.62, 24.89, 21.42, 16.27, and 13.89 dB/cm, respectively, for y-pol. and represented by Figure 9b. These values of CL are obtained at RWs of 928, 989, 1072, 1195, and 1338 nm, respectively.

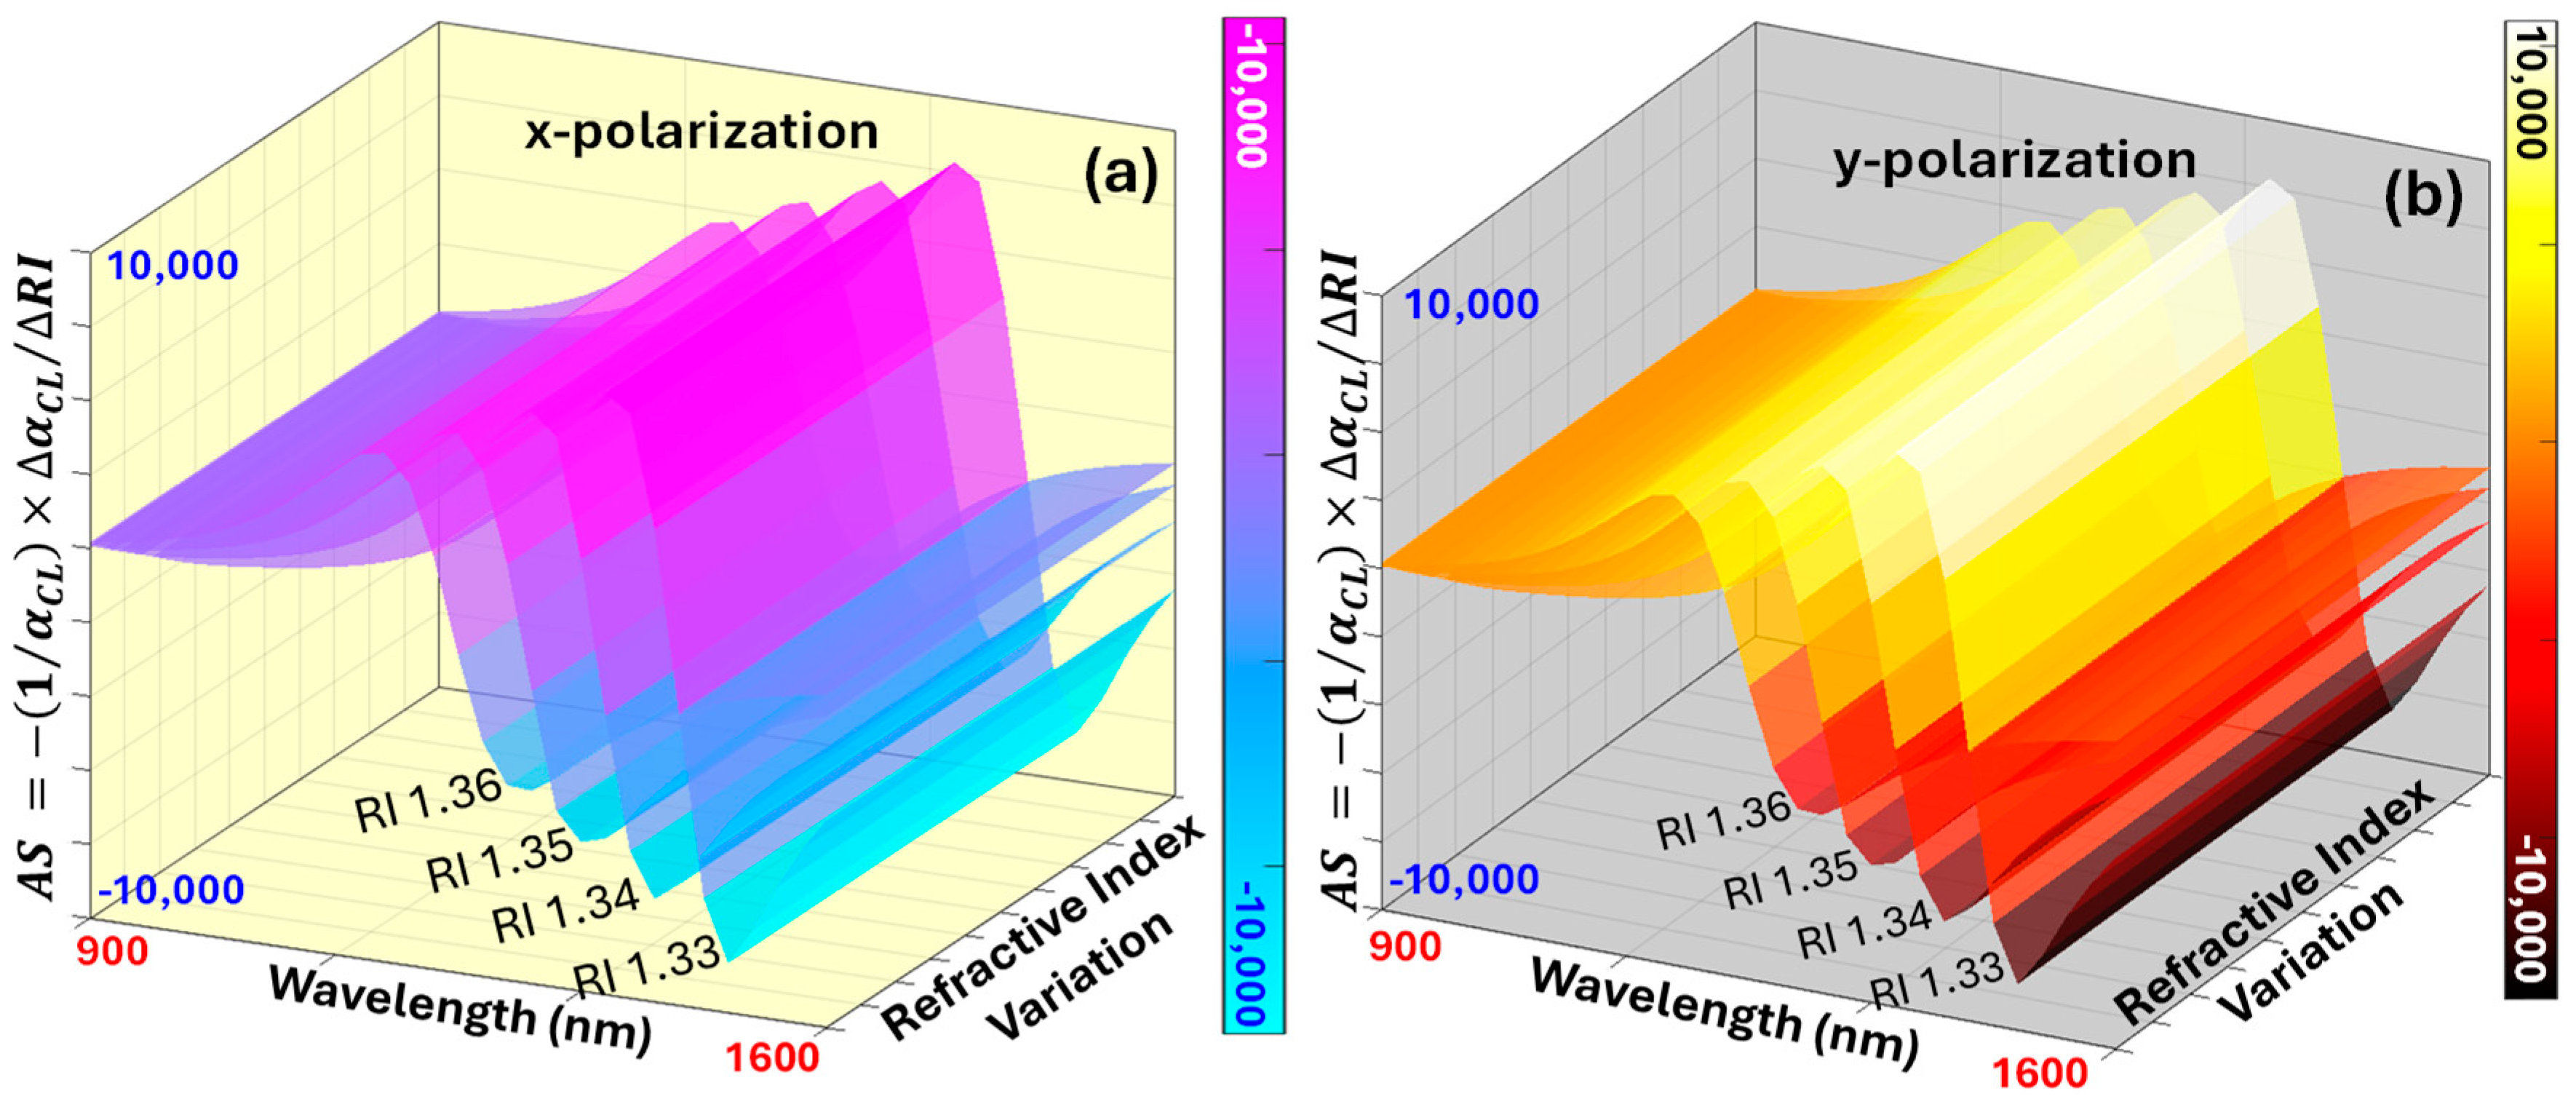
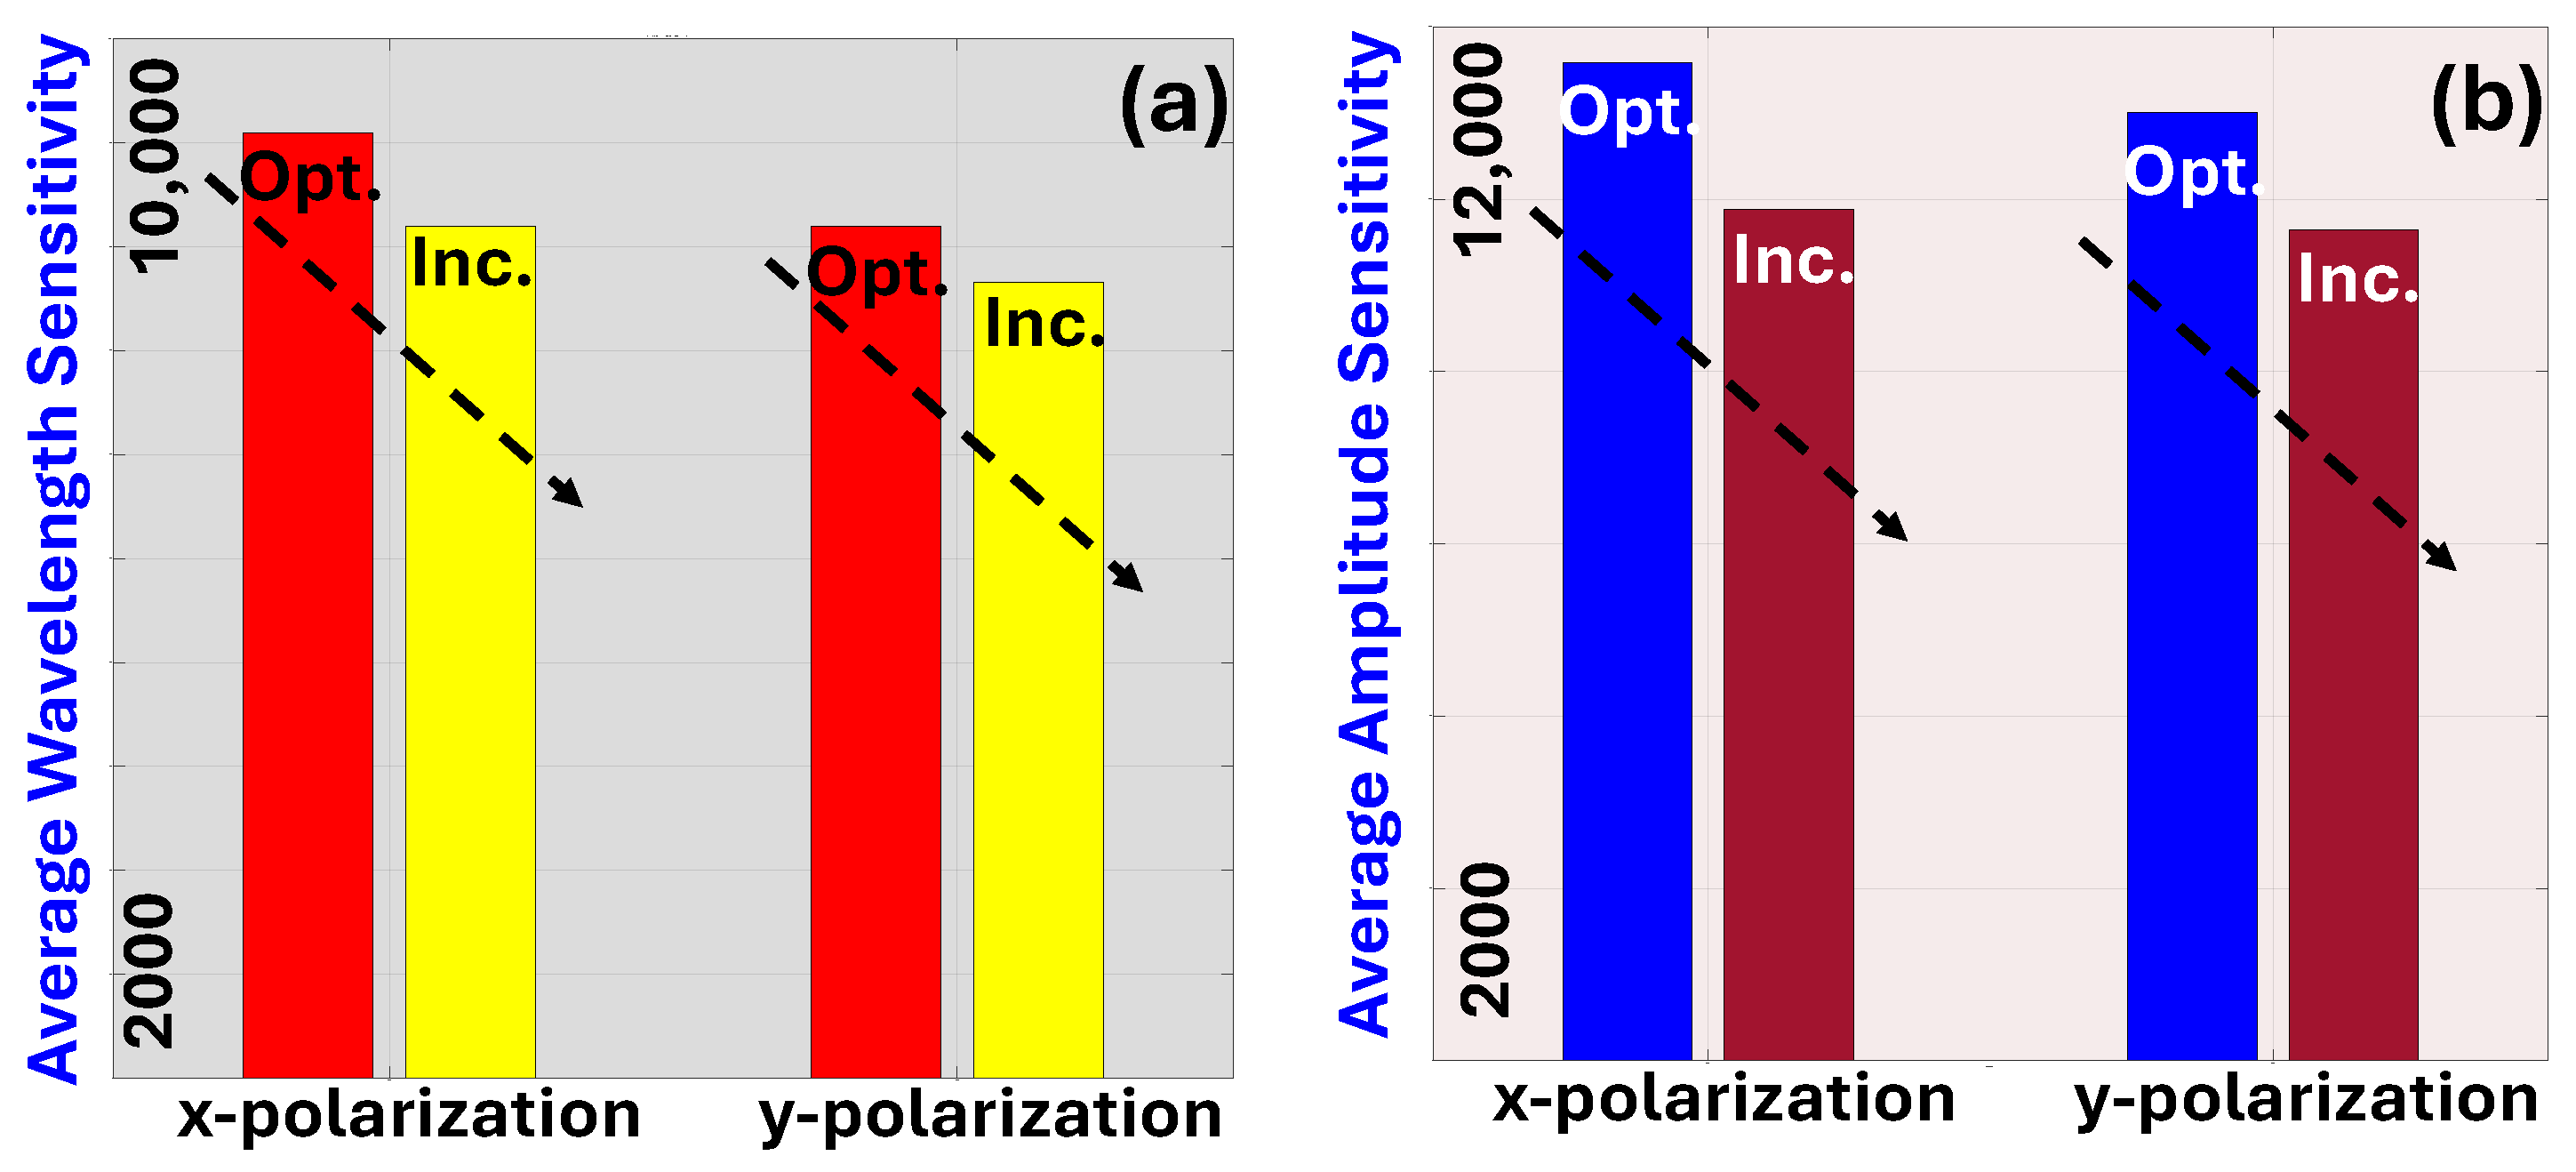
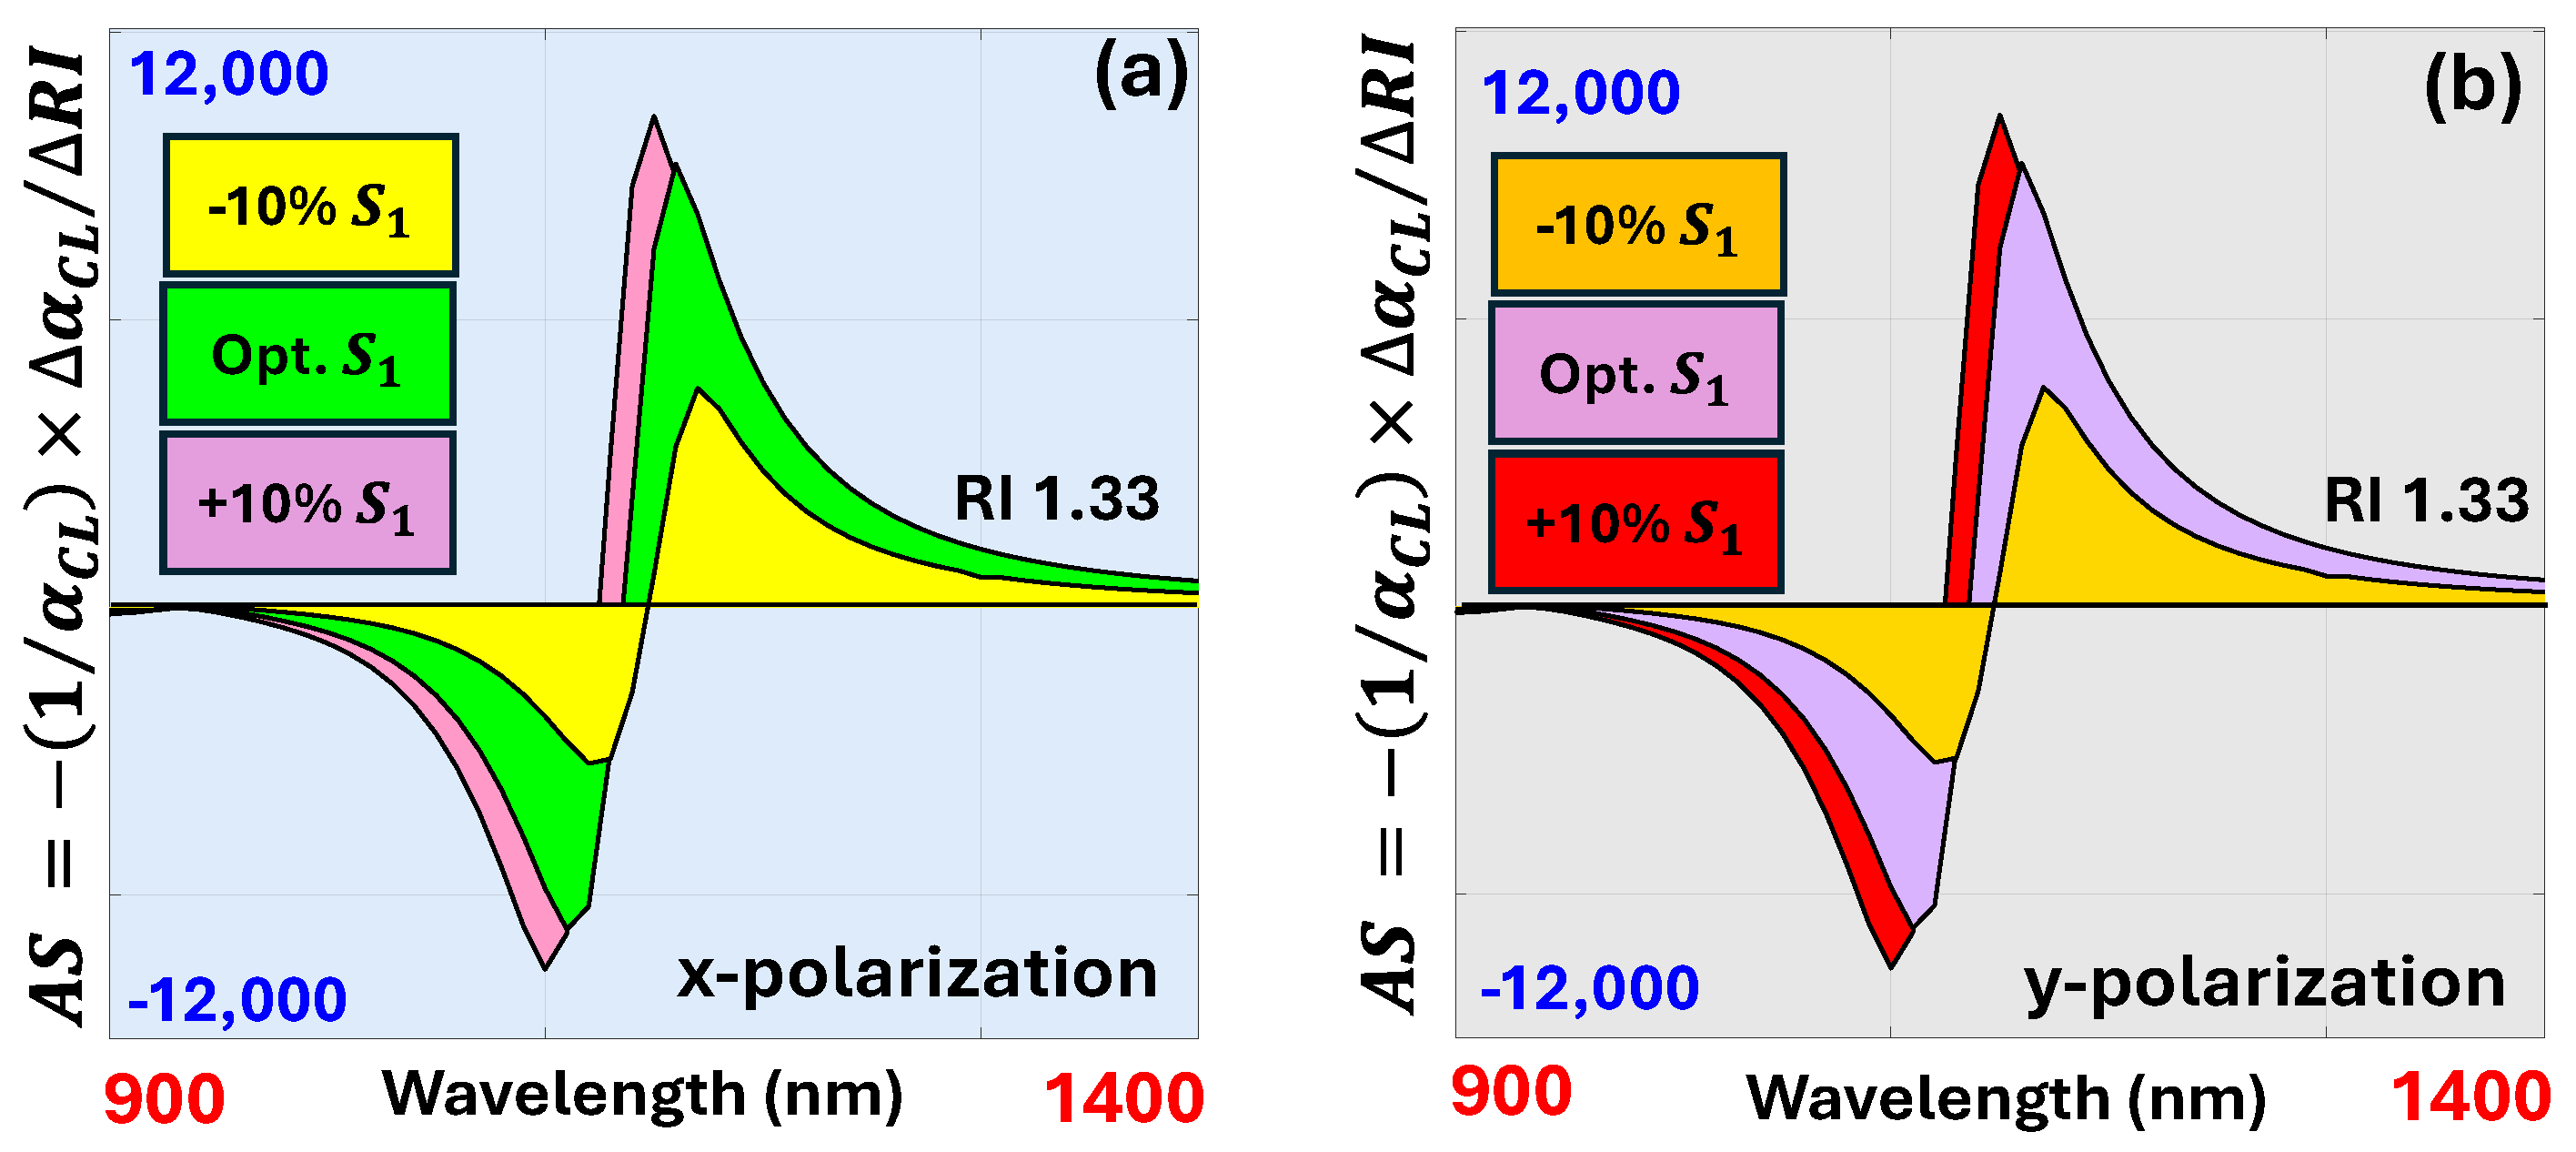
4.2. Calculation of AS for the Sensor Model

AS in a PCF SPR sensor refers to the ability of the sensor to detect changes in the amplitude of the reflected or transmitted light when the RI of the surrounding medium changes. Essentially, it is a measure of how much the amplitude of the SPR signal varies in response to small changes in the RI of the material near the surface of the PCF. It is expressed by Equation (5) [72].
A S   R I U 1 = ( 1 / α C L ) × α C L / R I
where α C L represents change in CL and R I represents change in RI of two consecutive analytes. The ASs corresponding to x-pol. with RIs of 1.33, 1.34, 1.35, and 1.36 are 11,584, 10,081, 8987, and 7211 RIU−1, respectively, as presented in Figure 10a. Similarly, the ASs corresponding to y-pol. with RIs of 1.33, 1.34, 1.35, and 1.36 are 11,007, 9877, 7942, and 6729 RIU−1, respectively, as presented in Figure 10b. Thus, the maximum AS of the proposed sensor is 11,584 RIU−1 and 11,007 RIU−1 for an RI of 1.33, corresponding to x-pol. and y-pol., respectively.

4.3. Calculation of WS for the Sensor Model

WS in a PCF SPR sensor refers to the ability of the sensor to detect shifts in the RW in response to changes in the surrounding RI. It is a key parameter that determines how well the sensor can detect changes in the surrounding environment. It is expressed by Equation (6) [73].
W S   ( n m / R I U ) = λ P / R I
where λ P represents the change in the RWs of two consecutive analytes. The WSs of 6500, 9800, 13,400, and 15,800 nm/RIU are obtained for RIs of 1.33, 1.34, 1.35, and 1.36, respectively, corresponding to x-pol. Similarly, the WSs of 6100, 8300, 12,300, and 14,300 nm/RIU are obtained for RIs of 1.33, 1.34, 1.35, and 1.36, respectively, corresponding to y-pol. Thus, the maximum WS of the proposed sensor corresponding to x-pol. and y-pol. is 15,800 nm/RIU and 14,300 nm/RIU, respectively.

4.4. Calculation of SR for the Sensor Model

SR in a PCF SPR sensor refers to the smallest detectable change in the RI that the sensor can reliably measure. It is a crucial parameter for determining how precisely the sensor can detect minute changes in the surrounding environment. It is expressed by Equation (7) [74].
S R   ( R I U ) = R I × λ m i n / λ p
where λ m i n is the minimum spectral resolution and is equal to 0.1 nm. The computed values of SR are 1.53 × 10⁻⁵, 1.02 × 10⁻⁵, 7.46 × 10⁻⁶, and 6.32 × 10⁻⁶ RIU for RIs of 1.33, 1.34, 1.35, and 1.36, respectively, corresponding to x-pol. Similarly, the computed values of SR are 1.63 × 10⁻⁵, 1.20 × 10⁻⁵, 8.13 × 10⁻⁶, and 6.99 × 10⁻⁶ RIU for RIs of 1.33, 1.34, 1.35, and 1.36, respectively, corresponding to y-pol. Thus, the proposed sensor has obtained an SR in the order of 10−6, corresponding to both x-pol. and y-pol., respectively.

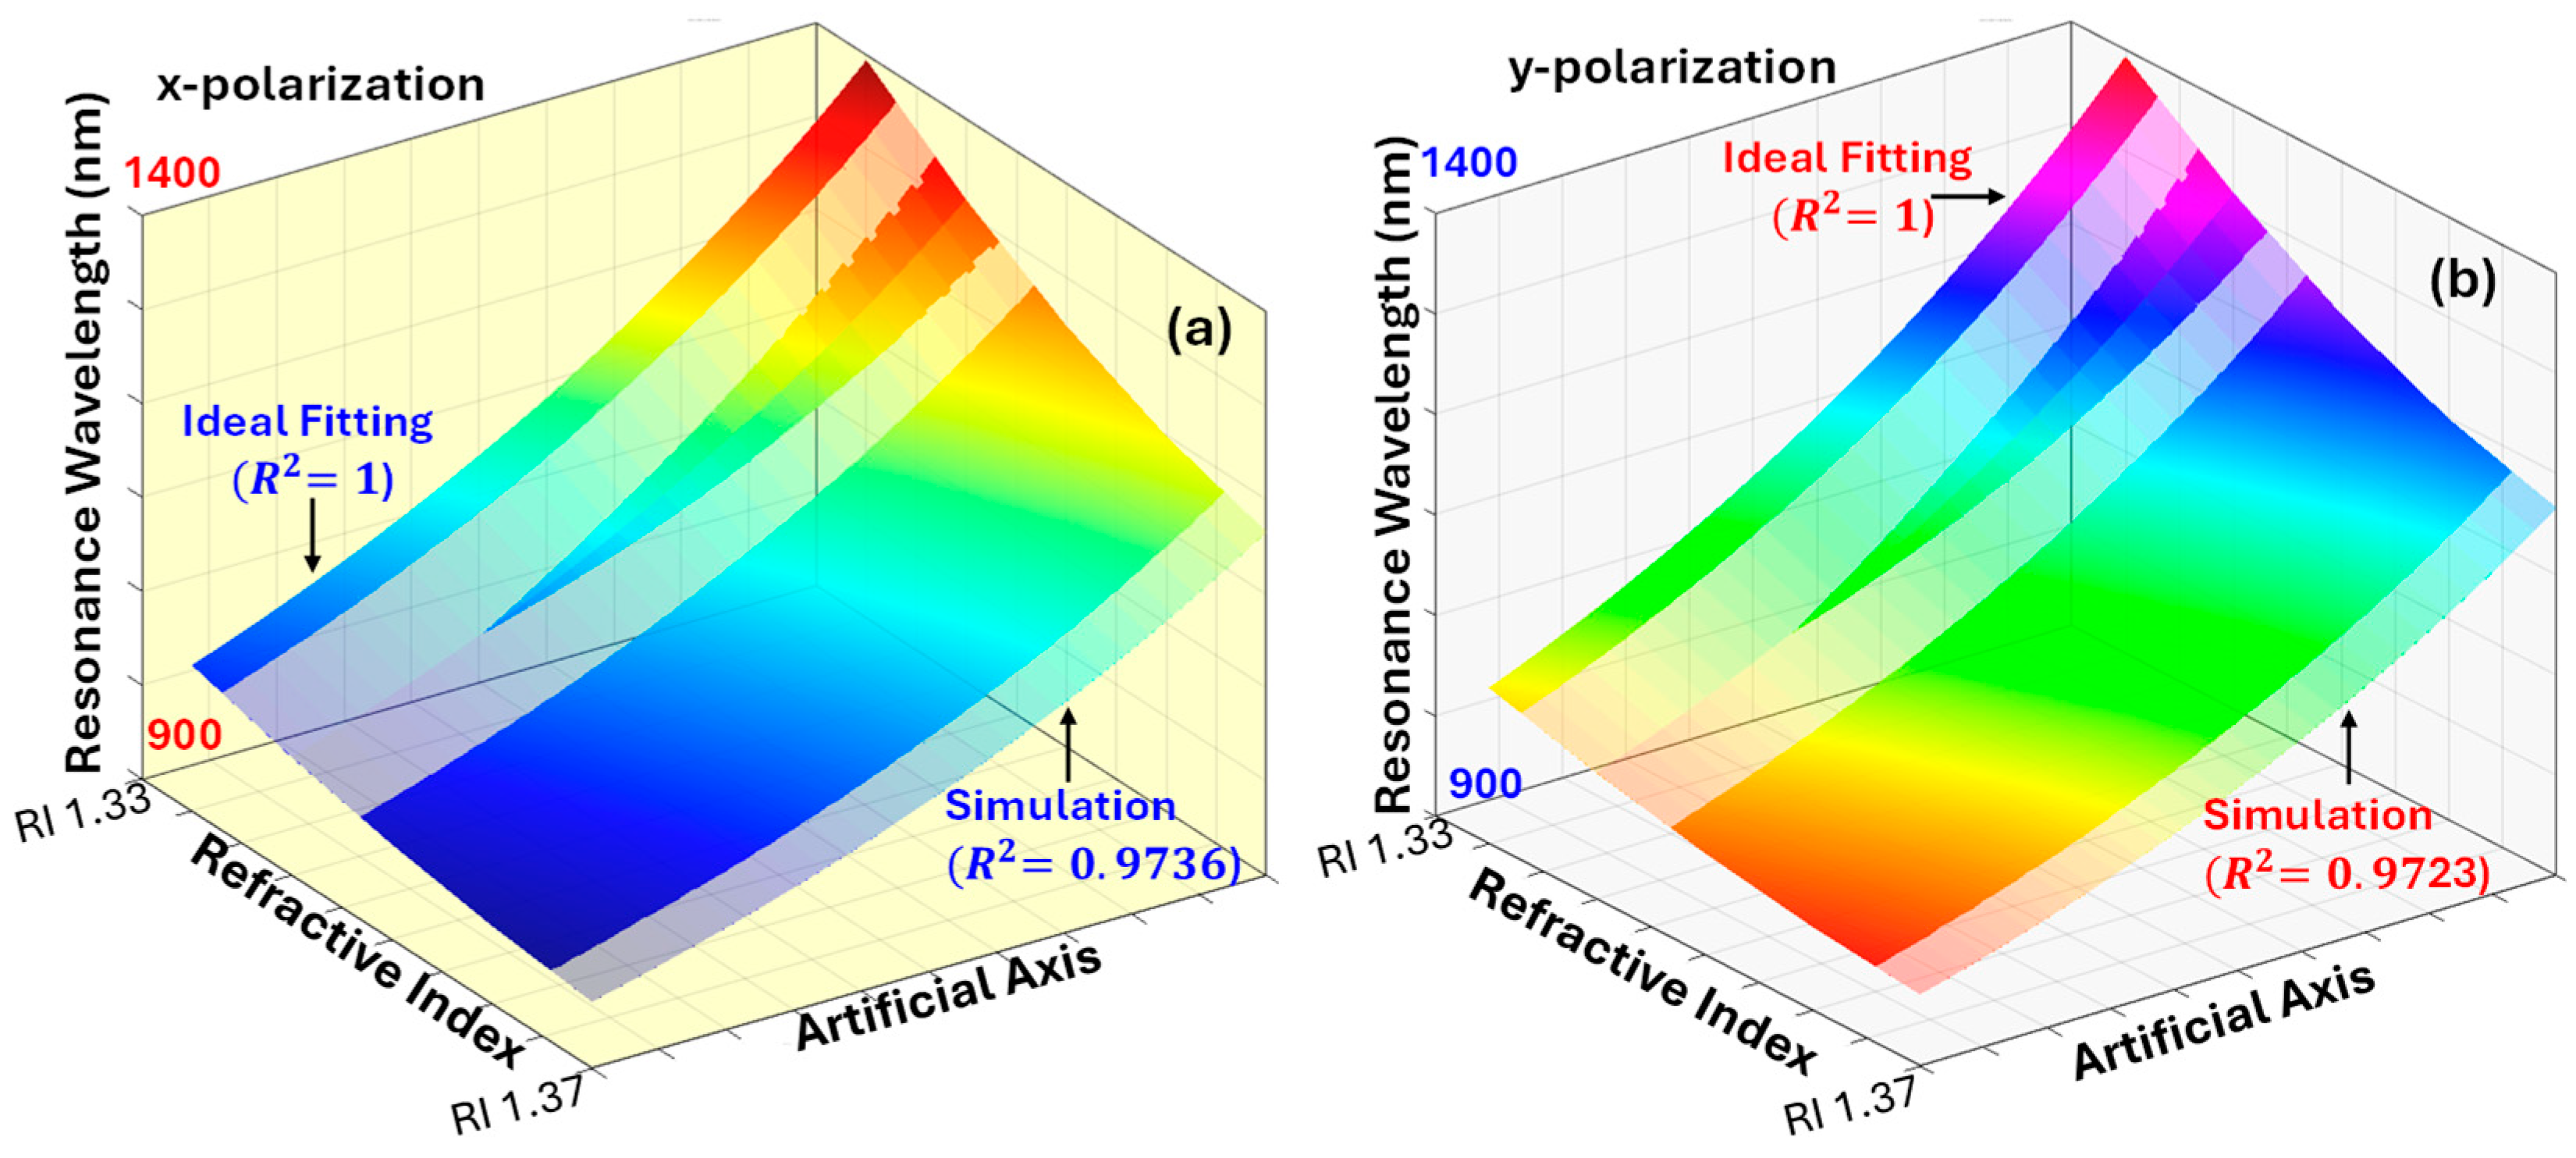
4.5. Linear Fitting Between the Resonance Wavelength and Refractive Index of the Sensor Parameters

Another important sensor parameter is fitting between RW and RI, which provides a means to understand the functional relationship between the two variables. In many research articles, researchers have performed fitting of second order, third order, or an even higher order to obtain the value of the coefficient of determination close to unity. However, in this work, we have opted for a first order (linear) fitting approach to maintain the simplicity and physical interpretability of the model, while still achieving a sufficiently high coefficient of determination (R2) value. This ensures that the sensor response remains predictable and practical for real-world sensing applications.
By choosing a first order fitting degree, the behavior of the sensor can be predicted under different conditions. Figure 11a represents the first order polynomial fitting between the RW and RI corresponding to x-pol. The expression of the fitting is expressed by Equation (8).
f ( λ ) = p 1 × λ + p 2
where p 1 = 1.142 × 10⁴ and p 2 = −1.4289 × 10⁴, the value of the fitting parameters’ sum of squared error (SSE)=3.5316 × 10³, the coefficient of determination R2 = 0.9736, and the root mean squared error (RMSE)= 31.3103.
Similarly, the fitting between RW and RI corresponding to y-pol. is expressed by Figure 11b and the values of the fitting parameters are expressed as p 1 = 1.026 × 10⁴ and p 2 = −1.2747 × 10⁴, SSE = 2.9936 × 10³, R2 = 0.9723, and RMSE = 31.5890.
Therefore, it can be observed that the proposed sensor performs quite well for different sensing parameters. The most prominent sensing parameters, the computation procedures, have been discussed in this section. In addition, there are some other parameters like sensor length, dispersion relation, sensing parameter behavior upon changing the geometrical dimensions, etc., which can be further used to provide the additional details of the sensor.
Finally, the performance of the Au-TiO2-coated PCF SPR sensor can be affected by several other environmental variables such as temperature, pressure, and humidity. Temperature fluctuations can alter the RI of the analyte and the plasmonic materials due to the thermo-optic effect, leading to shifts in RW and WS, variations in CL, and changes in AS and SR. Pressure may induce slight structural deformations in the PCF geometry or modify the RI of the surrounding medium, subtly affecting mode confinement and resonance conditions. Humidity can result in the adsorption of water molecules onto the TiO2 or Au surface, especially if TiO2 is porous, thereby altering the effective RI at the sensing interface. These changes can influence sensor accuracy, especially in unregulated environments. To ensure stability and precision, environmental compensation techniques or protective coatings may be necessary for use in the practical deployment.

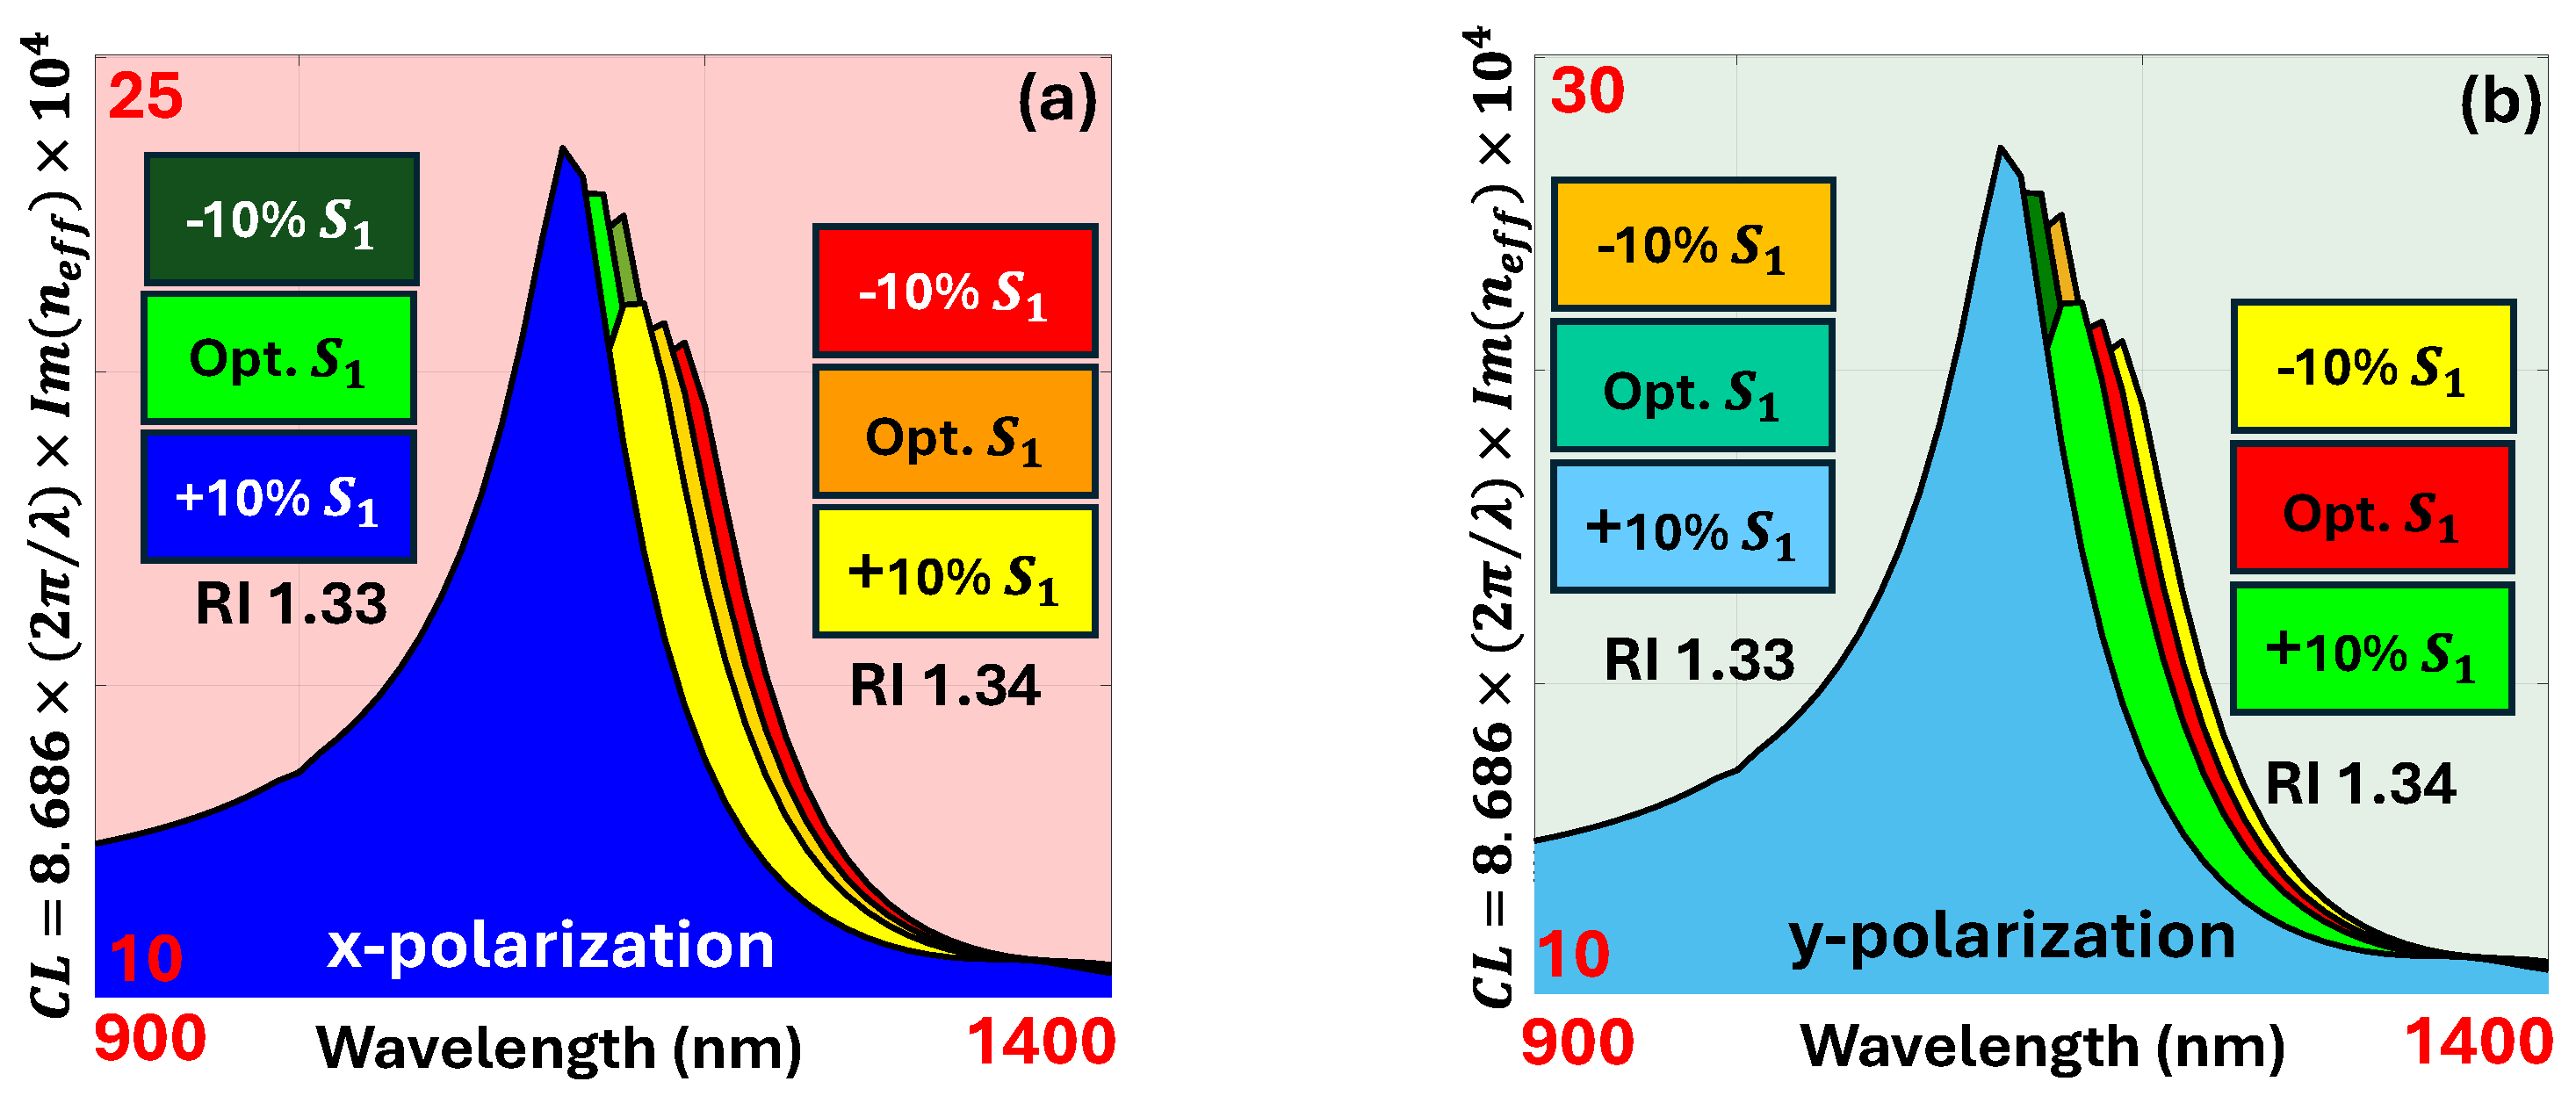
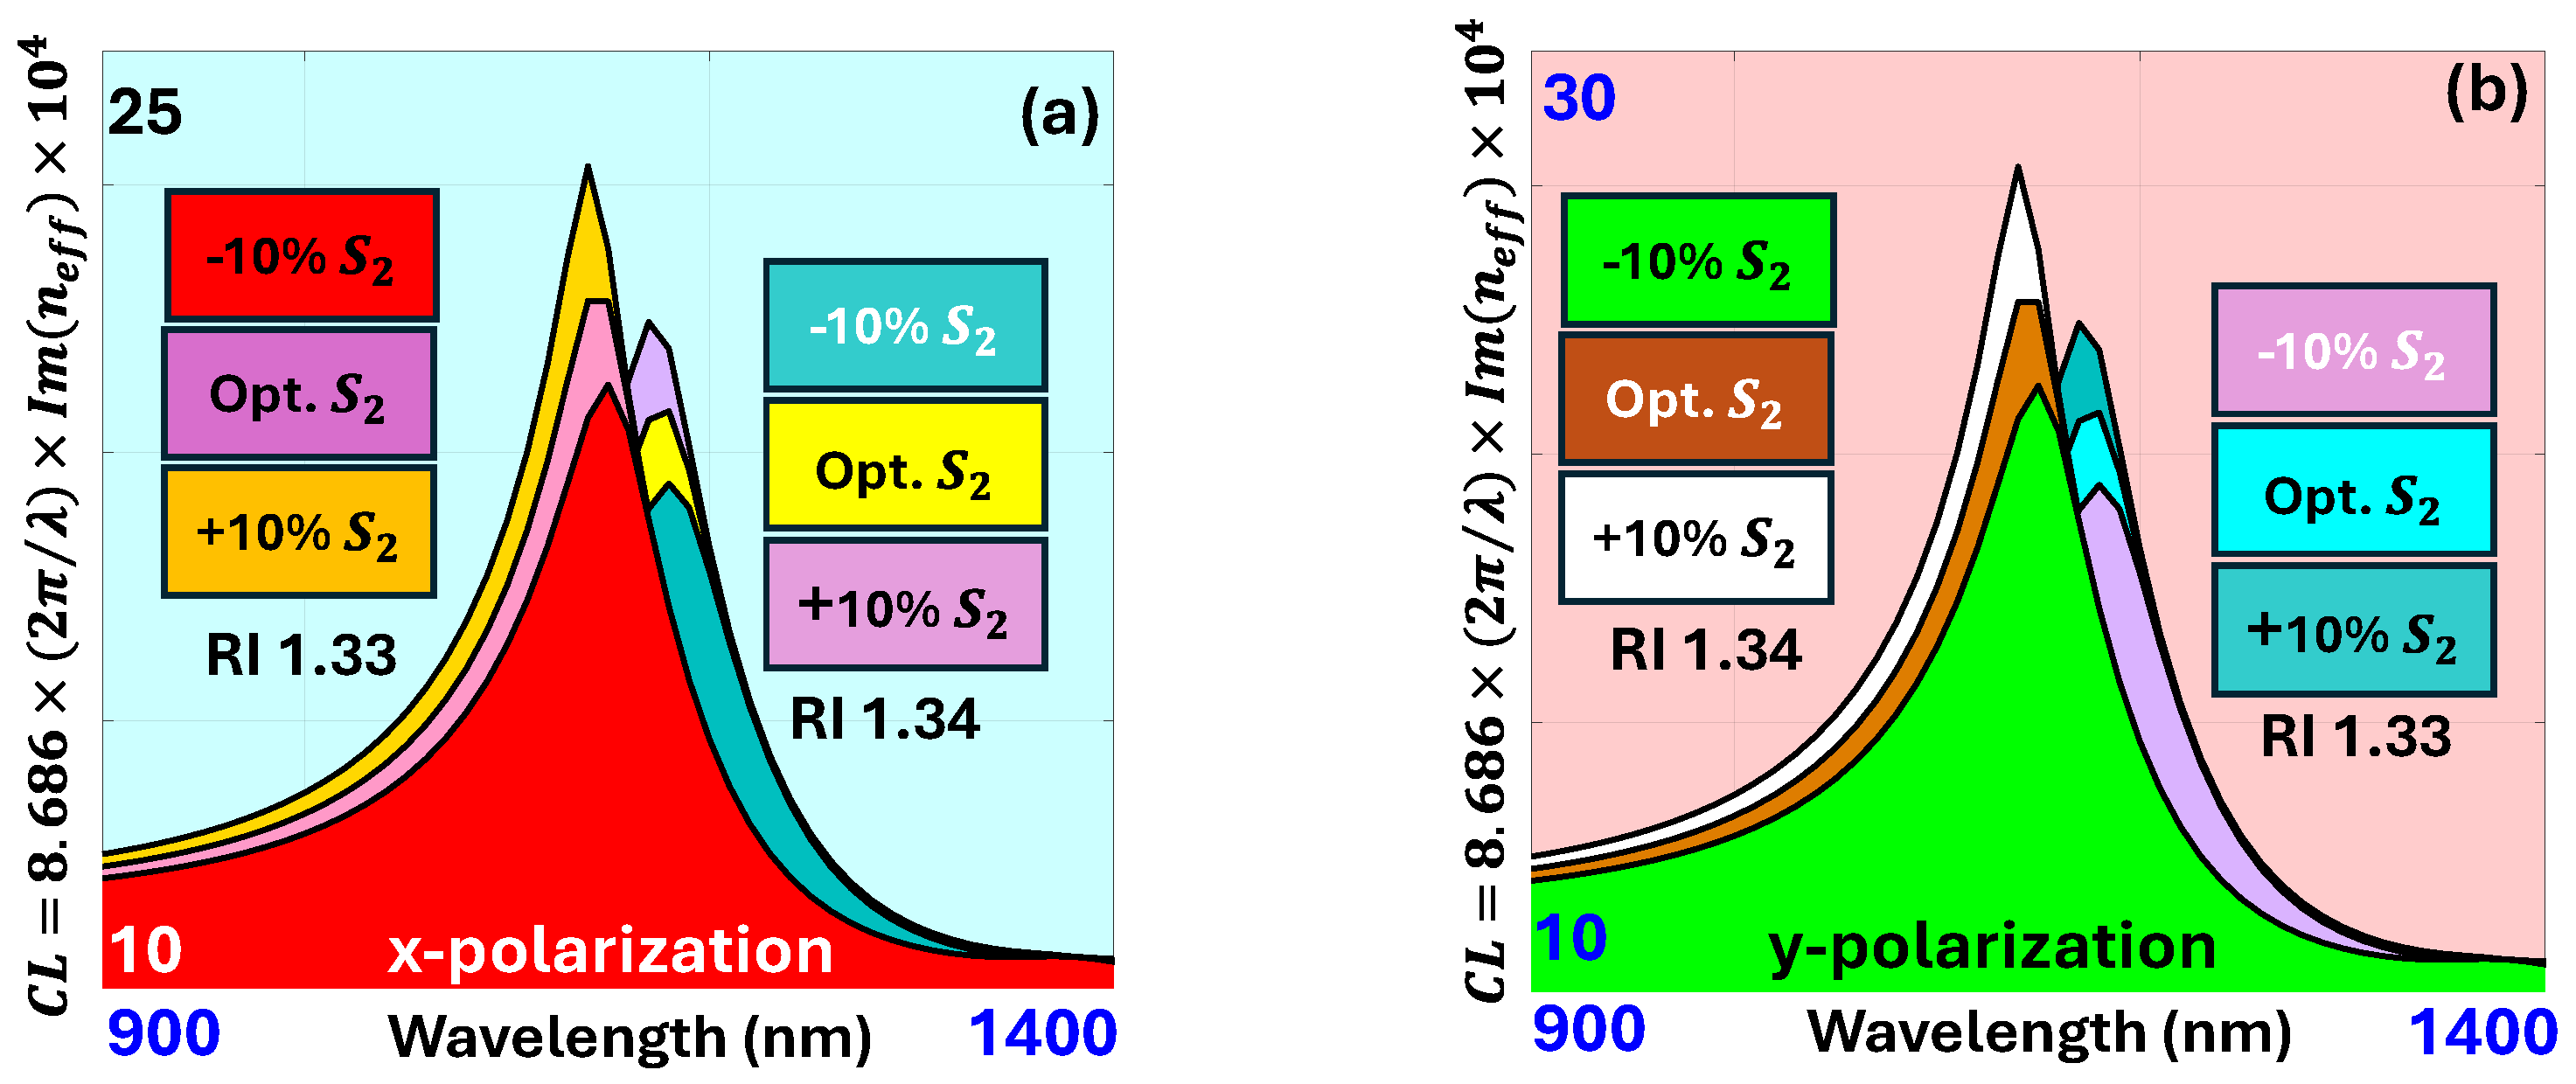
4.6. Analysis of the Sensor Parameters by Increasing the Thickness of Plasmonic Coating Beyond the Optimum Thickness

In this section, we investigate the effect of increasing the thickness of the plasmonic material beyond its previously determined optimal value. The aim is to examine how such deviations influence the key sensing performance parameters, including CL and AS. By analyzing these changes, we gain insight into the trade-offs involved in overcoating the plasmonic layer and how it impacts the efficiency of SPR-based sensing. This analysis is crucial for understanding the tolerance of the sensor design to fabrication variations and for optimizing real-world performance. The optimal thicknesses for the plasmonic layers of Au and TiO2 were previously determined to be 50 nm for Au and 80 nm for TiO2, based on their ability to produce strong plasmonic resonance and high sensor performance. In this section, we explore the effect of increasing the thickness of each layer by 10 nm, resulting in new thicknesses of 60 nm for Au and 90 nm for TiO2. This deliberate deviation from the optimal configuration allows us to assess the sensitivity of the sensor’s performance to changes in material thickness. By analyzing how the RW and sensitivity respond to this modification, we gain a deeper understanding of the design tolerances and robustness of the sensor structure. This analysis is also valuable for practical fabrication, where small deviations in layer thickness may occur.
Figure 12 represents the behavior of the CL with the improved thickness. The values of the CL for RIs of 1.33, 1.34, 1.35, 1.36, and 1.37 are 43.26, 34.27, 24.39, 19.84, and 13.76 dB/cm, respectively, for x-pol. and are represented by Figure 12a. These values of CL are obtained at RWs of 1023, 1084, 1169, 1293, and 1433 nm, respectively. Similarly, the values of CL for RIs of 1.33, 1.34, 1.35, 1.36, and 1.37 are 52.14, 46.81, 37.26, 26.94, and 18.21 dB/cm, respectively, for y-pol. and are represented by Figure 12b. These values of CL are obtained at RWs of 1038, 1093, 1171, 1286, and 1421 nm, respectively. It is observed that the CL exhibits a significant increase for both pol. modes when the thickness of the plasmonic material is increased beyond its optimal value. This increase in CL can be attributed to the enhanced damping of surface plasmon waves due to the additional thickness of the metal layer, which intensifies absorption losses. As the plasmonic layer becomes thicker, the propagation of the evanescent field into the sensing region is reduced, leading to greater energy dissipation within the metal itself. Consequently, this results in higher CL, which may adversely affect the sensor’s performance by lowering the quality of the plasmonic resonance. This observation emphasizes the importance of maintaining an optimized thickness for the plasmonic layer to ensure efficient plasmon excitation and minimal energy loss.
The WSs of 6100, 8500, 12,400, and 14,000 nm/RIU are obtained for RIs of 1.33, 1.34, 1.35, and 1.36, respectively, corresponding to x-pol. Similarly, the WSs of 5500, 7800, 11,500, and 13,500 nm/RIU are obtained for RIs of 1.33, 1.34, 1.35, and 1.36, respectively, corresponding to y-polarization. Thus, the maximum WSs of the proposed sensor corresponding to x-pol. and y-pol. are 14,000 nm/RIU and 13,500 nm/RIU, respectively. However, it is noteworthy that these WS values are significantly lower than those obtained under the optimal plasmonic and dielectric layer thickness conditions. The reduction in WS upon increasing the thickness of the plasmonic material beyond its optimal value can be attributed to the weakened coupling efficiency between the guided mode and the surface plasmon mode. Thicker metal layers cause greater damping of the plasmonic field and limit its extension into the sensing medium, thereby reducing the resonance shift for a given RI change. As a result, the sensitivity of the sensor to RI variations diminishes, underlining the importance of the precise optimization of structural parameters to achieve peak performance.
The ASs corresponding to x-pol. with RIs of 1.33, 1.34, 1.35, and 1.36 are 9879, 8732, 7411, 6823, and 5482 RIU−1, respectively, as presented in Figure 13a. Similarly, the ASs corresponding to y-polarization with RIs of 1.33, 1.34, 1.35, and 1.36 are 9644, 8314, 7329, 6112, and 5329 RIU−1, respectively, as presented in Figure 13b. Thus, the maximum AS of the proposed sensor is 9879 RIU−1 and 5329 RIU−1 for an RI of 1.33, corresponding to x-polarization and y-polarization, respectively.
It is evident from these values that AS significantly decreases with increasing RI, and more importantly, with the increased thickness of the plasmonic material beyond its optimal value. This decline in AS can be attributed to the increased damping of the surface plasmon waves due to the thicker metal layer, which results in higher absorption losses and reduced interaction between the evanescent field and the analyte. A thicker plasmonic layer restricts the penetration of the field into the sensing region, thereby weakening the sensor’s responsiveness to changes in the RI. This highlights the critical role of optimizing the plasmonic layer’s thickness to achieve maximum amplitude sensitivity and enhance the overall performance of the SPR-based sensor.
Figure 14a illustrates a comparison of the average WS between the optimized and increased thicknesses of the plasmonic material. Similarly, Figure 14b shows a comparison of the average AS under the same conditions. It is evident that increasing the thickness of the plasmonic layer leads to a noticeable decline in key sensor performance metrics such as WS and AS. Additionally, other important sensing characteristics, including SR and effective sensor length, also exhibit a reduction in their respective values, indicating an overall degradation in sensor performance with increased plasmonic thickness.

4.7. Fabrication Tolerance Assessment for the Proposed Sensor

The fabrication tolerance assessment (FTA) of sensor models is crucial for evaluating the impact of manufacturing imperfections on sensor performance. This involves analyzing how variations in key sensor parameters such as air hole side, air hole size, pitch, and coating thickness affect the sensor parameters and overall detection accuracy of the sensor model. Several researchers have obtained an FTA of ±2% to ±5% for their designed sensor [75]. This section analyzes the effect on the proposed sensor parameters like CL and AS by varying the sides of air holes by ±10%.
In this quest, firstly, the dimension of side S 1 is varied by ±10%. The newly reported dimensions of side S 1 are 1.32 µm for +10% and 1.08 µm for −10%, respectively. Figure 15a illustrates the CL corresponding to x-pol. The CL increases by 0.1984 dB/cm and decreases by 0.1877 dB/cm for a ∓10% variation concerning side S 1 for an RI of 1.33. Similarly, for an RI of 1.34, CL increases by 0.2145 dB/cm and decreases by 0.1845 dB/cm for a ∓10% variation in side S 1 .
Figure 15b illustrates the CL corresponding to y-pol. The CL increases by 0.1984 dB/cm and decreases by 0.1877 dB/cm for a ∓10% variation concerning side S 1 for an RI of 1.33. Similarly, for an RI of 1.34, CL increases by 0.2145 dB/cm and decreases by 0.1845 dB/cm for a ∓10% variation concerning side S 1 .
Figure 16a presents the AS corresponding to x-pol. for an RI of 1.33, which shows an increase of 38.48 RIU−1 and a decrease of 87.95 RIU−1 for a +10% and −10% variation in side S 1 , respectively.
Figure 16b presents the AS corresponding to y-pol. for an RI of 1.33, which increases by 42.84 RIU−1 and decreases by 68.74 RIU−1 for a +10% and −10% variation in side S 1 , respectively.
Similarly, the dimension of side S 2 is varied by ±10%. The newly reported dimensions of side S 2 are 0.88 µm for +10% and 0.72 µm for −10%, respectively.
Figure 17a illustrates the CL corresponding to x-pol. The CL increases by 1.1784 dB/cm and decreases by 1.1988 dB/cm for a ∓10% variation in side S 2 for an RI of 1.33. Similarly, for an RI of 1.34, CL increases by 1.2475 dB/cm and decreases by 1.2777 dB/cm for a ∓10% variation in side S 2 .
Figure 17b illustrates the CL corresponding to y-pol. The CL increases by 1.144 dB/cm and decreases by 1.1997 dB/cm for a ∓10% variation in side S 2 for an RI of 1.33. Similarly, for an RI of 1.34, CL increases by 1.2248 dB/cm and decreases by 1.1988 dB/cm for a ∓10% variation in side S 2 .
Figure 18a presents the AS corresponding to x-pol. for an RI of 1.33, which shows an increase of 64.48 RIU−1 and which decreases by 78.44 RIU−1 for a +10% and −10% variation in side S 2 , respectively.
Figure 18b presents the AS corresponding to y-pol. for an RI of 1.33, which increases by 68.45 RIU−1 and decreases by 48.44 RIU−1 for a +10% and −10% variation in side S 2 , respectively.
Thus, it can be observed that sensor parameters like CL and AS show a significant amount of change in their values when the sides of the air holes S 1 and S 2 are varied by ∓10% of their initial values. This indicates that even small variations in the air hole dimensions can substantially influence the performance of the sensor, emphasizing the importance of precise fabrication and structural optimization in sensor design. Such analysis helps in identifying the optimal design conditions and enhances the sensor’s ability to detect minute changes caused due to the analyte’s properties.
The proposed PCF SPR sensor introduces several key innovations that distinguish it from previously reported designs. Unlike conventional circular-shaped PCF structures, the presented sensor features a square-shaped PCF design, which provides enhanced control over mode confinement and plasmonic field interaction. This novel geometry improves the coupling efficiency between the core mode and the surface plasmon mode, thereby enhancing the sensor’s sensitivity and performance. Additionally, the sensor has been systematically analyzed under both x-pol. and y-pol. modes, offering a comprehensive understanding of polarization-dependent behavior. This dual-polarization investigation allows for optimized sensing configurations and improved detection accuracy across a range of analyte RIs. These innovations collectively contribute to a more sensitive, stable, and adaptable sensor platform, expanding the applicability of PCF SPR sensors in precision biomedical and different sensing applications. Finally, the comparison of the sensing parameters of the proposed sensor model at the optimum thickness of plasmonic materials with the previously reported sensors is presented in Table 1.

5. Discussion and Potential Use of AI in the Future

PCF-SPR sensors have emerged as highly sensitive platforms for RI detection due to their structural flexibility, enhanced LMI, and tunability across a wide RI range. The design flexibility offered by PCFs, such as varying air hole configurations, core shapes, and plasmonic coating techniques, allows for precise control over evanescent field penetration and plasmonic coupling. This has led to the development of highly responsive sensors capable of detecting minute changes in RI, making them suitable for applications in biochemical sensing, environmental monitoring, and medical diagnostics. Despite the promising performance demonstrated by PCF-SPR sensors, traditional modeling and optimization approaches are often computationally intensive and rely heavily on trial-and-error or parametric sweeps. These methods may not fully capture the complex, nonlinear interactions between design parameters and sensor performance metrics. Here, AI comes into the picture, offering a transformative approach. ML and DL algorithms can accelerate the design and simulation process by learning from high-dimensional data, recognizing hidden patterns, and predicting optimal configurations with minimal iterations. Incorporating AI in PCF-SPR sensor development can contribute to three major areas: inverse design and optimization, where AI models can rapidly predict sensor geometries for desired sensitivity or resonance characteristics; real-time calibration and drift correction, using adaptive learning models to maintain sensor accuracy over time and under changing environmental conditions; and finally, automated material selection, enabling the data-driven identification of suitable plasmonic materials based on application-specific requirements. Moreover, AI enables multi-objective optimization, balancing sensitivity, resolution, and fabrication feasibility. This is particularly relevant for complex PCF structures with multiple variables such as air hole pitch, core diameter, and metal layer thickness. The integration of AI into SPR sensors, particularly those based on PCF, offers promise in several day-to-day applications; however, the complexity of these systems increases. Traditional numerical methods, like finite element analysis (FEA) [80], FEM [81], and finite difference time domain (FDTD) [82], are quite popular and powerful, but often face challenges when dealing with large datasets, intricate parameter interactions, and nonlinear systems. This is where AI can play a transformative role.

5.1. Complexity and Large Dataset Generation in PCF SPR Sensors

PCF SPR sensors are highly sensitive devices whose performance is influenced by a multitude of parameters, including the RI of the surrounding medium, the core geometry, and the plasmonic materials. Modeling the behavior of these sensors involves complex physical principles, including LMI, waveguiding effects, and plasmonic resonance. As the number of design parameters increases, the simulation space becomes higher dimensional, making it computationally expensive and time-consuming to explore the design space exhaustively. AI and ML algorithms offer a solution to simplify this process by learning the underlying patterns and relationships in the data [83,84]. ML algorithms, such as ANNs, can model the nonlinear relationships between the various parameters of PCF SPR sensors and their resulting responses, allowing them the faster and more efficient optimization of sensor designs.

5.2. Simulation and Design Optimization

AI techniques, particularly optimization algorithms like genetic algorithms (GAs) [85], particle swarm optimization (PSO) [86], and DRL [87], have proven effective in solving complex optimization problems. For PCF SPR sensors, these AI-driven methods can be employed to rapidly explore the design space, identifying optimal configurations for sensing applications. This is especially important when dealing with large parameter sets that would be impractical to optimize manually or through traditional numerical methods.

5.3. Data Interpretation and Feature Extraction

AI techniques can also be used in the analysis of experimental and simulation data obtained from PCF SPR sensors. The data generated by these sensors often contain complex patterns that are difficult to interpret using traditional statistical methods [88]. For example, the RW shifts observed in sensing applications may be influenced by several factors, such as the RI of the analyte, temperature variations, and sensor drift. AI-based algorithms, such as DL and ANN, can be employed to automatically extract relevant features from the data and provide more accurate predictions of the sensor’s performance [89]. These techniques can help in the classification and identification of specific biomarkers, chemicals, or environmental factors based on the observed resonance shifts, improving the sensor’s diagnostic capabilities.

5.4. Material and Plasmonic Coating Selection

Another promising application of AI in PCF SPR simulation and analysis is the selection and design of plasmonic materials and coatings. The performance of an SPR sensor is heavily dependent on the plasmonic material’s properties, such as its RI, dielectric constant, and the geometry of the coating. AI techniques can be used to identify novel materials or optimize the existing plasmonic layers by predicting their performance in various sensing environments [90]. Through AI-based simulations, researchers can explore a wider range of materials, including those with complex and nonlinear optical properties, that may not be easily identifiable through traditional methods. This provides the opportunity to discover new plasmonic materials that could improve the sensitivity and specificity of PCF SPR sensors.
Thus, PCF SPR sensors have found wide-ranging applications due to their exceptional sensitivity, label-free detection, and real-time monitoring capabilities. These sensors are extensively used in biomedical diagnostics for detecting the biomarkers associated with diseases such as cancer, diabetes, and infectious conditions. In environmental monitoring, PCF SPR sensors enable the detection of trace amounts of hazardous substances like heavy metals, pesticides, and chemical pollutants in water and air. They are also crucial in chemical and biochemical sensing, where they help identify specific analytes or molecular interactions in complex mixtures. Additionally, PCF SPR sensors are gaining attention in the food safety industry and pharmaceutical analysis, where the precise monitoring of contaminants, drug compounds, and quality control parameters is vital. The integration of AI into these application areas will further amplify their impact. AI algorithms can enhance data interpretation, automate analyte identification, detect patterns in complex sensor outputs, and enable real-time decision-making. For instance, ML models can classify disease states from sensor signals, predict contamination trends in environmental monitoring, or optimize sensor parameters for maximum sensitivity. Thus, the merger between PCF SPR sensing and AI opens new frontiers for developing smart, adaptive, and high-throughput sensing systems across various domains.

6. Conclusions

This research presents a square-shaped PCF-SPR sensor, designed using the EMD technique, which demonstrates excellent performance across an RI range of 1.33 to 1.37. The sensor supports both x-pol. and y-pol. modes, yielding a WS of 15,800 nm/RIU for x-pol. and 14,300 nm/RIU for y-pol. The corresponding ASs reach 11,584 RIU−1 and 11,007 RIU−1, respectively, with an SR in the order of 10−6 RIU. A high linear correlation coefficient of R2 ≈ 0.97 is obtained for both polarizations. These results underscore the sensor’s high sensitivity, strong polarization response, and suitability for precise RI detection in diverse application areas. Moving forward, the integration of AI into the simulation, material selection, and structural optimization processes holds immense potential to further enhance the capabilities of PCF-SPR sensors. AI-based models could significantly reduce design iteration time, uncover complex nonlinear relationships, and enable real-time tuning and adaptive sensing. Future research should focus on the development of AI-assisted inverse design frameworks and data-driven optimization strategies to create smarter, more efficient, and highly customizable plasmonic sensors. The merger of AI and photonic sensor technology marks a vital evolution toward intelligent, high-performance optical sensing platforms capable of addressing increasingly complex real-world challenges.

Supplementary Materials

The following supporting information can be downloaded at: https://www.mdpi.com/article/10.3390/photonics12060565/s1, Figure S1: Simulation movie of the core mode and SPP mode variation for the proposed sensor.

Author Contributions

A.R.: data curation; formal analysis; investigation; methodology; resources; visualization; writing—original draft; writing—review. A.K.S.: conceptualization; data curation; formal analysis; investigation; methodology; resources; visualization; writing—original draft; writing—review and editing. A.B.: review; supervision; validation. All authors have read and agreed to the published version of the manuscript.

Funding

This research received no external funding.

Institutional Review Board Statement

Not applicable.

Informed Consent Statement

Not applicable.

Data Availability Statement

The original contributions presented in this study are included in the article. Further inquiries can be directed to the corresponding author(s).

Acknowledgments

A.R. wishes to express her sincere gratitude to Ariel University for the Postdoctoral Fellowship (PDF) and financial support that enabled this research work. The authors acknowledge the use of the ChatGPT (GPT-4) tool integrated with DALL·E 3 to generate Figure 7b in this article. The AI system assisted in the conceptualization and creation of the visuals by providing foundational representations, which were subsequently refined and adapted by the authors to align with the research context. All AI-generated content was thoroughly reviewed and edited, and the authors take full responsibility for the final version of the figure. The authors wish to thank all anonymous reviewers for their constructive and valuable suggestions in improving the content of the article.

Conflicts of Interest

The author confirms that there are no financial or personal relationships that could be perceived as influencing the research presented in this paper.

References

  1. Fei, Y.; Luo, B.; An, M.; Hu, T.; Lin, W.; Jia, H. A Highly Efficient D-Shaped Dual-Core PCF-SPR Sensor Coated with ITO Film for Refractive Index Detection. Plasmonics 2025, 20, 1379–1393. [Google Scholar] [CrossRef]
  2. Zhang, Z.; Yin, Z.; Li, S. A SPR Sensor With Wide RI Measuring Range and Narrow FWHM Based on PCF-Silver Film Structure. J. Light. Technol. 2024, 42, 7398–7404. [Google Scholar] [CrossRef]
  3. Shakya, A.K.; Ramola, A.; Singh, S.; Vidyarthi, A. Optimized Design of Plasmonic Biosensor for Cancer Detection: Core Configuration and Nobel Material Coating Innovation. Plasmonics 2025, 20, 1789–1810. [Google Scholar] [CrossRef]
  4. Saad, N.M.; Rabaie, E.-S.M.E.; Khalaf, A.A.M. Highly universal sensitive star core photonic crystal fiber (S-PCF)-based sensor for both chemical and biomedical applications. J. Opt. 2024, 1–26. [Google Scholar] [CrossRef]
  5. Ji, Y.; Du, Y.; Dai, J.; Zou, H.; Zhang, R.; Zhou, D. Dual-Core Photonic Crystal Fiber Polarization Beam Splitter Based on a Nematic Liquid Crystal with an Ultra-Short Length and Ultra-Wide Bandwidth. Electronics 2024, 13, 2343. [Google Scholar] [CrossRef]
  6. Ferdous, A.I.; Hosen, M.S.; Khandakar, K.; Kundu, D.; Bani, M.M.; Noor, S.A.T.K.S. Pioneering terahertz blood analysis: Hollow-core PCF with optimized sensitivity and low loss. PLoS ONE 2025, 20, e0319860. [Google Scholar] [CrossRef] [PubMed]
  7. Yu, Q.; Liu, M.; Qi, Y.; Luan, N.; Bai, Z.; Ding, J. Tunable Single and Multi-Wavelength Er-Doped Mode-Locked Fiber Laser Based on GIMF-PCF-GIMF. IEEE Photonics Technol. Lett. 2023, 35, 1043–1046. [Google Scholar] [CrossRef]
  8. Fallahi, V.; Kordrostami, Z.; Hosseini, M. Sensitivity and quality factor improvement of photonic crystal sensors by geometrical optimization of waveguides and micro-ring resonators combination. Sci. Rep. 2024, 14, 2001. [Google Scholar] [CrossRef]
  9. Theodosiou, A. Recent Advances in Fiber Bragg Grating Sensing. Sensors 2024, 24, 532. [Google Scholar] [CrossRef]
  10. Shakya, A.K.; Cheng, F.; Carmon, T. Ultracoherent emission by orthogonal lasers. In SPIE 13012 Integrated Photonics Platforms III; SPIE: Strasbourg, France, 2024. [Google Scholar]
  11. Sun, A.; Wu, Z.; Fang, D.; Zhang, J.; Wang, W. Multimode Interference-Based Fiber-Optic Ultrasonic Sensor for Non-Contact Displacement Measurement. IEEE Sens. J. 2016, 16, 5632–5635. [Google Scholar] [CrossRef]
  12. Capelli, D.; Scognamiglio, V.; Montanari, R. Surface plasmon resonance technology: Recent advances, applications and experimental cases. TrAC Trends Anal. Chem. 2023, 163, 117079. [Google Scholar] [CrossRef]
  13. Falah, A.A.S.; Wong, W.R.; Adikan, F.R.M. Single-mode eccentric-core D-shaped photonic crystal fiber surface plasmon resonance sensor. Opt. Laser Technol. 2022, 145, 107474. [Google Scholar] [CrossRef]
  14. Mittal, S.; Saharia, A.; Ismail, Y.; Petruccione, F.; Bourdine, A.V.; Morozov, O.G. Design and Performance Analysis of a Novel Hoop-Cut SPR-PCF Sensor for High Sensitivity and Broad Range Sensing Applications. IEEE Sens. J. 2024, 24, 2697–2704. [Google Scholar] [CrossRef]
  15. Zakaria, R.; Zainuddin, N.A.M.; Raya, S.A.; Alwi, S.A.K.; Anwar, T.; Sarlan, A.; Ahmed, K.; Amiri, I.S. Sensitivity Comparison of Refractive Index Transducer Optical Fiber Based on Surface Plasmon Resonance Using Ag, Cu, and Bimetallic Ag–Cu Layer. Micromachines 2020, 11, 77. [Google Scholar] [CrossRef]
  16. Alhawari, A.R.; Almawgani, A.H.; Taya, S.A.; Daher, M.G.; Prajapati, Y.K.; Gumaih, H.S. Highly sensitive protein sensor based on surface plasmon resonance nanostructure employing titanium dioxide and graphene layers. Diam. Relat. Mater. 2025, 151, 111867. [Google Scholar] [CrossRef]
  17. Jaffray, W.; Saha, S.; Shalaev, V.M.; Boltasseva, A.; Ferrera, M. Transparent conducting oxides: From all-dielectric plasmonics to a new paradigm in integrated photonics. Adv. Opt. Photonics 2022, 14, 148–208. [Google Scholar] [CrossRef]
  18. Ramola, A.; Shakya, A.K.; Bergman, A. ComprehensivAnalysis of Advancement in Optical Biosensing Techniques for Early Detection of Cancerous Cells. Biosensors 2025, 15, 292. [Google Scholar] [CrossRef]
  19. Zheng, J.; Cheng, X.; Zhang, H.; Bai, X.; Ai, R.; Shao, L.; Wang, J. Gold Nanorods: The Most Versatile Plasmonic Nanoparticles. Chem. Rev. 2021, 121, 13342–13453. [Google Scholar] [CrossRef]
  20. Montes-García, V.; Squillaci, M.A.; Diez-Castellnou, M.; Ong, Q.K.; Stellacci, F.; Samorì, P. Chemical sensing with Au and Ag nanoparticles. Chem. Soc. Rev. 2021, 50, 1269–1304. [Google Scholar] [CrossRef]
  21. Paul, A.K.; Mollah, M.A.; Hassan, M.Z.; Gomez-Cardona, N.; Reyes-Vera, E. Graphene-Coated Highly Sensitive Photonic Crystal Fiber Surface Plasmon Resonance Sensor for Aqueous Solution: Design and Numerical Analysis. Photonics 2021, 8, 155. [Google Scholar] [CrossRef]
  22. Mahmood, K.; Munir, R.; Kang, H.W.; Sung, H.J. An atmospheric pressure-based electrospraying route to fabricate the multi-applications bilayer (AZO/ITO) TCO films. RSC Adv. 2013, 3, 25741–25751. [Google Scholar] [CrossRef]
  23. Lou, J.; Yang, Y.; Qu, Q.; Li, S. Research on application of secondary drawing technology in the preparation of various solid-core and hollow-core photonic crystal fibers. Opt. Laser Technol. 2024, 174, 110678. [Google Scholar] [CrossRef]
  24. Islam, M.S.; Ferdous, A.I.; Noor, K.S.; Bani, M.M. Designing hollow-core PCF sensors for high-performance terahertz detection of NaCN and KCN. Heliyon 2024, 10, e37681. [Google Scholar] [CrossRef] [PubMed]
  25. Zhu, J.; Nan, P.; Lim, K.-S.; Liu, X.; Dang, W.; Li, Z. Double F-P Interference Optical Fiber High Temperature Gas Pressure Sensor Based on Suspended Core Fiber. IEEE Sens. J. 2021, 21, 26805–26813. [Google Scholar] [CrossRef]
  26. Singer, A.M.; Hameed, M.F.O.; Heikal, A.M.; El-Mikati, H.A.; Obayya, S.S.A. Highly birefringent slotted core photonic crystal fiber for terahertz waveguiding. Opt. Quantum Electron. 2021, 53, 1–15. [Google Scholar] [CrossRef]
  27. Chen, N.; Yue, W.; Xu, Y.; Guo, W.; Xiao, Y.; Ren, Z.; Ding, X.; Li, M.; Xu, Y.; Wu, T.; et al. Design and simulation of a compact polarization beam splitter based on dual-core photonic crystal fiber with elliptical gold layer. Sci. Rep. 2024, 14, 18017. [Google Scholar] [CrossRef]
  28. Singh, S.; Chaudhary, B.; Upadhyay, A.; Taya, S.A. Bottom side partially etched D-shaped PCF biosensor for early diagnosis of cancer cells. Eur. Phys. J. Plus 2023, 138, 511. [Google Scholar] [CrossRef]
  29. Zhang, J.; Tong, Z.; Zhang, W.; Zhao, Y.; Li, J. Research on simultaneous temperature and relative humidity measurement based on tapered PCF Mach-Zehnder interferometer. Opt. Fiber Technol. 2021, 61, 102408. [Google Scholar] [CrossRef]
  30. Shakya, A.K.; Singh, S. Design of novel Penta core PCF SPR RI sensor based on fusion of IMD and EMD techniques for analysis of water and transformer oil. Measurement 2022, 188, 110513. [Google Scholar] [CrossRef]
  31. Hasan, M.S.; Kalam, M.A.E.; Faisal, M. PCF Based Four-Channel SPR Biosensor with Wide Sensing Range. IEEE Trans. NanoBiosci. 2023, 23, 233–241. [Google Scholar] [CrossRef]
  32. Gamal, Y.; Younis, B.M.; Abd-Elkader, A.E.-S.; Furniss, D.; Farries, M.; Phang, S.; Benson, T.M.; Seddon, A.B.; Hameed, M.F.O.; Obayya, S.S.A. Mid-infrared water pollutant sensor based on SPR-PCF. Opt. Quant. Electron. 2023, 55, 966. [Google Scholar] [CrossRef]
  33. Hossain, M.S.; Sen, S. Design and Performance Improvement of Optical Chemical Sensor Based Photonic Crystal Fiber (PCF) in the Terahertz (THz) Wave Propagation. Silicon 2020, 13, 3879–3887. [Google Scholar] [CrossRef]
  34. Kaziz, S.; Echouchene, F.; Gazzah, M.H. Optimizing PCF-SPR sensor design through Taguchi approach, machine learning, and genetic algorithms. Sci. Rep. 2024, 14, 7837. [Google Scholar] [CrossRef] [PubMed]
  35. Shi, Y.; Yang, K.; Jiang, T.; Zhang, J.; Letaief, K.B. Communication-Efficient Edge AI: Algorithms and Systems. IEEE Commun. Surv. Tutor. 2020, 22, 2167–2191. [Google Scholar] [CrossRef]
  36. Dogan, Y.; Katirci, R.; Erdogan, I. Machine learning-based optimization for D-shaped PCF SPR refractive index sensor. Opt. Commun. 2025, 575, 131304. [Google Scholar] [CrossRef]
  37. Guedri-Knani, L.; Kaziz, S.; Dridi, C. Performance Prediction of a Highly Sensitive Optimized PCF-SPR Biosensor for Cancer Cell Detection Using MLP-Based ANN Model. IEEE Sens. J. 2025, 25, 17136–17143. [Google Scholar] [CrossRef]
  38. Goswami, M.; Khare, P.; Shakya, S. AI Algorithm for Mode Classification of PCF-SPR Sensor Design. Plasmonics 2024, 19, 363–377. [Google Scholar] [CrossRef]
  39. Truong, T.T.; Airao, J.; Hojati, F.; Ilvig, C.F.; Azarhoushang, B.; Karras, P.; Aghababaei, R. Data-driven prediction of tool wear using Bayesian regularized artificial neural networks. Measurement 2024, 238, 115303. [Google Scholar] [CrossRef]
  40. Shaik, N.B.; Mantrala, K.M.; Bakthavatchalam, B.; Gillani, Q.F.; Rehman, M.F. Corrosion Behavior of LENS Deposited CoCrMo Alloy Using Bayesian Regularization-Based Artificial Neural Network (BRANN). J. Bio-Tribo-Corros. 2024, 7, 116. [Google Scholar] [CrossRef]
  41. Ghiassi, M.; Saidane, H. A dynamic architecture for artificial neural networks. Neurocomputing 2005, 63, 397–413. [Google Scholar] [CrossRef]
  42. Abioduna, O.I.; Jantan, A.; Omolara, A.E.; Dada, K.V.; Mohamed, N.A. State-of-the-art in artificial neural network applications: A survey. Heliyon 2018, 4, e00938. [Google Scholar] [CrossRef] [PubMed]
  43. Shakya, A.K.; Ramola, A.; Vidyarthi, A. Modeling of texture quantification and image classification for change prediction due to COVID lockdown using Skysat and Planetscope imagery. Model. Earth Syst. Environ. 2022, 8, 2767–2792. [Google Scholar] [CrossRef] [PubMed]
  44. Shakya, A.K.; Ramola, A.; Singh, S.; Vidyarthi, A. Optimum supervised classification algorithm identification by investigating PlanetScope and Skysat multispectral satellite data of Covid lockdown. Geosyst. Geoenviron. 2023, 2, 100163. [Google Scholar] [CrossRef]
  45. Lucas, T.J.; Figueiredo, I.S.D.; Tojeiro, C.A.C.; Almeida, A.M.G.D.; Scherer, R.; Brega, J.R.F. A Comprehensive Survey on Ensemble Learning-Based Intrusion Detection Approaches in Computer Networks. IEEE Access 2023, 11, 122638–122676. [Google Scholar] [CrossRef]
  46. Samuel, D.; Khan, S.; Balos, C.J.; Abuelhaj, Z.; Dutoi, A.D.; Kari, C.; Mueller, D.; Pallipuram, V.K. A2Cloud-RF: A random forest based statistical framework to guide resource selection for high-performance scientific computing on the cloud. Concurr. Comput. Pract. Exp. 2020, 32, e5942. [Google Scholar] [CrossRef]
  47. Li, X.; Wang, L.; Sung, E. AdaBoost with SVM-based component classifiers. Eng. Appl. Artif. Intell. 2008, 21, 785–795. [Google Scholar] [CrossRef]
  48. Bentéjac, C.; Csörgő, A.; Martínez-Muñoz, G. A comparative analysis of gradient boosting algorithms. Artif. Intell. Rev. 2021, 54, 1937–1967. [Google Scholar] [CrossRef]
  49. Jiang, L.; Zhang, H.; Cai, Z. A Novel Bayes Model: Hidden Naive Bayes. IEEE Trans. Knowl. Data Eng. 2009, 21, 1361–1371. [Google Scholar] [CrossRef]
  50. Tian, Y.; Zhang, Y.; Zhang, H. Recent Advances in Stochastic Gradient Descent in Deep Learning. Mathematics 2023, 11, 682. [Google Scholar] [CrossRef]
  51. Li, Z.; Liu, F.; Yang, W.; Peng, S.; Zhou, J. A Survey of Convolutional Neural Networks: Analysis, Applications, and Prospects. IEEE Trans. Neural Netw. Learn. Syst. 2022, 33, 6999–7019. [Google Scholar] [CrossRef]
  52. Kattenborn, T.; Leitloff, J.; Schiefer, F.; Hinz, S. Review on Convolutional Neural Networks (CNN) in vegetation remote sensing. ISPRS J. Photogramm. Remote Sens. 2021, 173, 24–49. [Google Scholar] [CrossRef]
  53. Svozil, D.; Kvasnicka, V.; Pospichal, J. Introduction to multi-layer feed-forward neural networks. Chemom. Intell. Lab. Syst. 1997, 39, 43–62. [Google Scholar] [CrossRef]
  54. Vakalopoulou, M.; Christodoulidis, S.; Burgos, N.; Colliot, O.; Lepetit, V. Deep Learning: Basics and Convolutional Neural Networks (CNNs). In Machine Learning for Brain Disorders; Springer: New York, NY, USA, 2023; pp. 77–115. [Google Scholar]
  55. Kim, H.; Arigi, A.M.; Kim, J. Development of a diagnostic algorithm for abnormal situations using long short-term memory and variational autoencoder. Ann. Nucl. Energy 2021, 153, 108077. [Google Scholar] [CrossRef]
  56. Hamghalam, M.; Simpson, A.L. Medical image synthesis via conditional GANs: Application to segmenting brain tumours. Comput. Biol. Med. 2024, 170, 107982. [Google Scholar] [CrossRef] [PubMed]
  57. Wang, X.; Wang, S.; Liang, X.; Zhao, D.; Huang, J.; Xu, X.; Dai, B.; Miao, Q. Deep reinforcement learning: A survey. IEEE Trans. Neural Netw. Learn. Syst. 2022, 35, 5064–5078. [Google Scholar] [CrossRef]
  58. Ashrafian, M.; Olyaee, S.; Seifouri, M. Highly sensitive cancer detection using an open D-channel PCF-based SPR biosensor. Sci. Rep. 2025, 15, 10168. [Google Scholar] [CrossRef]
  59. Kadi, M.; Smaali, A.; Outemzabet, R. Analysis of optical and related properties of tin oxide thin films determined by Drude-Lorentz model. Surf. Coat. Technol. 2012, 211, 45–49. [Google Scholar] [CrossRef]
  60. Emon, W.; Chaki, A.; Mondal, T.P.; Nayan, M.F.; Mahmud, R.R. Photonic crystal fiber-based SPR biosensor coated with Ag-TiO2 and Au-TiO2 for the detection of skin cancer: A comparison. Opt. Quant. Electron. 2024, 56, 1332. [Google Scholar] [CrossRef]
  61. Danlard, I.; Akowuah, E.K. Assaying with PCF-based SPR refractive index biosensors: From recent configurations to outstanding detection limits. Opt. Fiber Technol. 2020, 54, 102083. [Google Scholar] [CrossRef]
  62. Homola, J. Surface Plasmon Resonance Sensors for Detection of Chemical and Biological Species. Chem. Rev. 2008, 108, 462–493. [Google Scholar] [CrossRef]
  63. Shakya, A.K.; Singh, S. Design of refractive index sensing based on optimum combination of plasmonic materials gold with indium tin oxide/titanium dioxide. J. Nanophotonics 2022, 16, 026010. [Google Scholar] [CrossRef]
  64. Shakya, A.K.; Singh, S. Design and analysis of dual polarized Au and TiO2-coated photonic crystal fiber surface plasmon resonance refractive index sensor: An extraneous sensing approach. J. Nanophotonics 2021, 15, 016009. [Google Scholar] [CrossRef]
  65. Tamm, A.; Acik, I.O.; Arroval, T.; Kasikov, A.; Seemen, H.; Marandi, M.; Krunks, M. Plasmon resonance effect caused by gold nanoparticles formed on titanium oxide films. Thin Solid Film. 2016, 616, 449–455. [Google Scholar] [CrossRef]
  66. Kumar, A.; Verma, P.; Jindal, P. Machine learning approach to surface plasmon resonance sensor based on MXene coated PCF for malaria disease detection in RBCs. Optik 2023, 274, 170549. [Google Scholar] [CrossRef]
  67. Zhang, S.; Yang, Y.; Dong, J. Ultra-wide measurement range D-shaped photonic crystal fiber sensor based on surface plasmon resonance. Eur. Phys. J. D 2024, 78, 111. [Google Scholar] [CrossRef]
  68. Islam, N.; Hasan, M.M.S.; Shibly, I.H.; Rashid, M.B.; Yousuf, M.A.; Haider, F.; Aoni, R.A.; Ahmed, R. Plasmonic sensor using generative adversarial networks integration. Opt. Express 2024, 32, 34184–34198. [Google Scholar] [CrossRef]
  69. Ahammed, M.T.; Hossain, M.F. Inverse Design of a PCF-Based SPR Sensor Using Machine Learning. In Proceedings of the IEEE International Conference on Computing, Applications and Systems (COMPAS), Cox’s Bazar, Bangladesh, 25–26 September 2024. [Google Scholar]
  70. Kaium, S.M.A.; Mollah, M.A. Optical properties estimation of photonic crystal fiber using Gaussian process regression. Opt. Contin. 2024, 3, 1369–1388. [Google Scholar] [CrossRef]
  71. Islam, M.R.; Jamil, M.A.; Zaman, M.S.-U.; Ahsan, S.A.H.; Pulak, M.K.; Mehjabin, F. Design and analysis of birefringent SPR based PCF biosensor with ultra-high sensitivity and low loss. Optik 2020, 221, 165311. [Google Scholar] [CrossRef]
  72. Li, W.; Chen, Y.; Xu, J.; Jiang, M.; Zou, H. A D-Shaped SPR-Based PCF Sensor with an Extremely High-Amplitude Sensitivity for Measuring the Refractive Index. Micromachines 2022, 14, 1295. [Google Scholar] [CrossRef]
  73. Meng, F.; Wang, H.; Fang, D. Research on D-Shape Open-Loop PCF Temperature Refractive Index Sensor Based on SPR Effect. IEEE Photonics J. 2022, 14, 5727605. [Google Scholar] [CrossRef]
  74. Hoque, A.M.T.; Al-Tabatabaie, K.F.; Ali, M.E.; Butt, A.M.; Mitu, S.S.I.; Qureshi, K.K. U-Grooved Selectively Coated and Highly Sensitive PCF-SPR Sensor for Broad Range Analyte RI Detection. IEEE Access 2023, 11, 74486–74499. [Google Scholar] [CrossRef]
  75. Mukhopadhyay, A.K.; Sarkar, S.; Mukherjee, S.; Das, N.R. Optimization and characterization of a PCF-based SPR sensor for enhanced sensitivity and reliability in diverse chemical and biological applications. J. Opt. Soc. Am. B 2025, 42, 97–104. [Google Scholar] [CrossRef]
  76. Islam, N.; Masum, M.M.U.; Arif, M.F.H.; Asaduzzaman, S.; Roy, M.; Yousuf, M.A. Enhanced Sensitivity of Open Channel SPR-Based PCF Sensor Employing Plasmonic Materials for Analyte Sensing. Plasmonics 2022, 17, 2075–2087. [Google Scholar] [CrossRef]
  77. Zhang, S.; Wang, Y. A PCF-SPR sensor for dual-polarization and wide refractive index detection range. Opt. Commun. 2024, 569, 130810. [Google Scholar] [CrossRef]
  78. Islam, M.R.; Khan, M.M.I.; Naser, A.M.A.; Mehjabin, F.; Jaba, F.Z.; Chowdhury, J.A.; Anzum, F.; Islam, M. Design of a quad channel SPR-based PCF sensor for analyte, strain, temperature, and magnetic field strength sensing. Opt. Quant. Electron. 2022, 54, 563. [Google Scholar] [CrossRef]
  79. Mim, M.A.; Khatun, M.R.; Hossain, M.M.; Rahman, W. Advanced PCF-SPR biosensor design and performance optimization using machine learning techniques. Optik 2025, 333, 172391. [Google Scholar] [CrossRef]
  80. Panagiotopoulou, O. Finite element analysis (FEA): Applying an engineering method to functional morphology in anthropology and human biology. Ann. Hum. Biol. 2009, 36, 609–623. [Google Scholar] [CrossRef]
  81. Zeng, W.; Liu, G.R. Smoothed Finite Element Methods (S-FEM): An Overview and Recent Developments. Arch. Comput. Methods Eng. 2018, 25, 397–435. [Google Scholar] [CrossRef]
  82. Teixeira, F.L.; Sarris, C.; Zhang, Y.; Na, D.-Y.; Berenger, J.-P.; Su, Y.; Okoniewski, M.; Chew, W.C.; Backman, V.; Simpson, J.J. Finite-difference time-domain methods. Nat. Rev. Methods Primers 2023, 3, 75. [Google Scholar] [CrossRef]
  83. Feng, J.; Phillips, R.V.; Malenica, I.; Bishara, A.; Hubbard, A.E.; Celi, L.A.; Pirracchio, R. Clinical artificial intelligence quality improvement: Towards continual monitoring and updating of AI algorithms in healthcare. npj Digit. Med. 2022, 5, 66. [Google Scholar] [CrossRef]
  84. Plumb, A.P.; Rowe, R.C.; York, P.; Brown, M. Optimisation of the predictive ability of artificial neural network (ANN) models: A comparison of three ANN programs and four classes of training algorithm. Eur. J. Pharm. Sci. 2005, 25, 395–405. [Google Scholar] [CrossRef] [PubMed]
  85. Tang, K.; Man, K.; Kwong, S.; He, Q. Genetic algorithms and their applications. IEEE Signal Process. Mag. 1996, 13, 22–37. [Google Scholar] [CrossRef]
  86. Wang, D.; Tan, D.; Liu, L. Particle swarm optimization algorithm: An overview. Soft Comput. 2018, 22, 387–408. [Google Scholar] [CrossRef]
  87. Arulkumaran, K.; Deisenroth, M.P.; Brundage, M.; Bharath, A.A. Deep reinforcement learning: A brief survey. IEEE Signal Process. Mag. 2017, 34, 26–38. [Google Scholar]
  88. Elish, M.C.; Boyd, D. Situating methods in the magic of Big Data and AI. Commun. Monogr. 2017, 85, 57–80. [Google Scholar] [CrossRef]
  89. Chiroma, H.; Abdullahi, U.A.; Abdulhamid, S.M.; Alarood, A.A.; Gabralla, L.A.; Rana, N. Progress on Artificial Neural Networks for Big Data Analytics: A Survey. IEEE Access 2018, 7, 70535–70551. [Google Scholar] [CrossRef]
  90. Dobrzański, L.; Staszuk, M.; Honysz, R. Application of artificial intelligence methods in PVD and CVD coatings properties modelling. Arch. Mater. Sci. Eng. 2012, 58, 152–157. [Google Scholar]
Figure 1. (a) ANN architecture. (b) Flowchart of BRANN for optimization of α and β.
Photonics 12 00565 g001
Figure 2. Classification of ML algorithm.
Photonics 12 00565 g002
Figure 3. Classification of algorithm for PCF SPR sensor configuration.
Photonics 12 00565 g003
Figure 4. (a) Side and front view of the circular-shaped fiber cluster. (b) Side and front view of the square-shaped fiber cluster.
Photonics 12 00565 g004
Figure 5. (a) Two-dimensional model of the proposed sensor with two square lattices of air holes rotated across 360° degrees and (b) mesh configuration of the sensor model.
Photonics 12 00565 g005
Figure 6. Mesh growth rate of the sensor model.
Photonics 12 00565 g006
Figure 7. (a) Implementation setup for analyte sensing via the proposed sensor; (b) fabrication process of the fiber using the stack-and-draw technique; (c) 3D illustration of the proposed PCF.
Photonics 12 00565 g007
Figure 8. Two-dimensional model of the proposed sensor: (a) x-pol. core mode (2D); (b) x-pol SPP mode (2D); (c) y-pol. core mode (2D); (d) y-pol. SPP mode (2D). Three-dimensional model of the proposed sensor: (e) x-pol. core mode; (f) x-pol SPP mode; (g) y-pol. core mode; (h) y-pol. SPP mode.
Photonics 12 00565 g008
Figure 9. Confinement loss: (a) x-polarization; (b) y-polarization.
Photonics 12 00565 g009
Figure 10. Amplitude sensitivity: (a) x-polarization; (b) y-polarization.
Photonics 12 00565 g010
Figure 11. Relation between RW and RI: (a) x-polarization; (b) y-polarization.
Photonics 12 00565 g011
Figure 12. Confinement loss: (a) x-polarization; (b) y-polarization.
Photonics 12 00565 g012
Figure 13. Amplitude sensitivity: (a) x-polarization; (b) y-polarization.
Photonics 12 00565 g013
Figure 14. Comparison of the WS and AS at optimized (Opt.) and increased (Inc.) thicknesses of plasmonic materials: (a) average WS; (b) average AS.
Photonics 12 00565 g014
Figure 15. CL for RI of 1.33 and RI of 1.34 by varying side S 1 by ∓10%: (a) x-pol.; (b) y-pol.
Photonics 12 00565 g015
Figure 16. AS for RI of 1.33 by varying side S 1 by ∓10%: (a) x-pol.; (b) y-pol.
Photonics 12 00565 g016
Figure 17. CL for RI of 1.33 and RI of 1.34 by varying side S 2 by ∓10%: (a) x-pol.; (b) y-pol.
Photonics 12 00565 g017
Figure 18. AS for RI of 1.33 by varying side S 2 by ∓10%: (a) x-pol.; (b) y-pol.
Photonics 12 00565 g018
Table 1. Comparison of the sensing parameters with previous sensor models.
RefSensor ShapeMethodologyRIPol.WS (nm/RIU)AS (RIU−1)SR (RIU)Order/R2
[76]CircularEMD 1.33–1.40y-pol.6000573.8310−5NA
[77]CircularH-shaped
EMD
1.29–1.35x-pol.7800NANANA
1.37–1.41y-pol.11,700
[78]CircularEMD 1.33–1.43x-pol. and
y-pol.
10,0004646.110−6II/0.999
[79]CircularEMD 1.31–1.40y-pol.90001241.9310−5I/0.86–0.99
Proposed
Sensor
SquareEMD 1.33–1.37x-pol.15,80011,58410−6I/0.9736
y-pol.14,30011,00710−6I/I0.9723
Disclaimer/Publisher’s Note: The statements, opinions and data contained in all publications are solely those of the individual author(s) and contributor(s) and not of MDPI and/or the editor(s). MDPI and/or the editor(s) disclaim responsibility for any injury to people or property resulting from any ideas, methods, instructions or products referred to in the content.

