Abstract
Phase consistency among hydrophones in fiber-optic hydrophone (FOH) arrays is crucial for effective beamforming. In this study, we investigate the photoelectric detection phase characteristics of FOHs based on the 3 × 3 coupler demodulation technique. We develop a theoretical model combining the 3 × 3 coupler demodulation algorithm with coupled-mode theory to analyze acoustic signal responses. Our model reveals that phase shifts from coupler-to-photodetector and coupler-to-sensing-arm connections arise from different mechanisms, and both are capable of causing π rad phase inversions in demodulated signals. We demonstrate that distinct connection configurations can be classified into groups yielding identical polarity outcomes, and that the input port selection for incident light does not affect output signal phase polarity. Experimental results validate these theoretical predictions. This work establishes critical hardware-level prerequisites for phase polarity consistency in FOH arrays, complementing existing calibration techniques and enhancing array performance in underwater target detection and localization.
1. Introduction
Fiber-optic hydrophones (FOHs) offer high sensitivity, electromagnetic immunity, and the ability to easily form large arrays [1,2], making them valuable for underwater target detection [3], oil and gas exploration [4], and seismic monitoring [5]. While research has focused on improving sensitivity and expanding operating frequency ranges, phase consistency—ensuring each FOH outputs signals with an identical phase when receiving the same sound signal—is equally critical. In large-scale arrays, this consistency enables effective beamforming for accurate underwater target localization. Phase inconsistencies can lead to ambiguity in direction finding and the misidentification of underwater objects.
Two principal approaches have been proposed to address phase inconsistency. The traditional approach is active calibration using reference sources [6]. These reference sources increase system complexity and are less effective if the calibration environment differs from the actual working conditions. Another approach is self-calibration, which adjusts the array parameters directly using the received signal [7]. Liu et al. applied a self-adapting probability search based on a genetic algorithm to estimate and correct array errors without reference sources [8]. Friedlander et al. extended multiple time intervals to extend self-calibration capabilities [9]. However, these methods face limitations with large-scale arrays due to increased computational complexity and data processing demands. This indicates a need for hardware-level solutions.
The FOH output phase depends on probe structural characteristics, material properties, and photoelectric detection techniques. While the basic principles of 3 × 3 couplers are established, their specific impact on phase polarity control remains understudied.
In this study, we address this gap by investigating the photoelectric detection phase characteristics of FOHs based on the 3 × 3 coupler demodulation technique. A theoretical model is built based on the 3 × 3 coupler-based demodulation algorithm and coupled mode theory to simulate demodulated signal phases under various configurations; subsequently, this model is validated through comparative experiments.
A common presumption in FOH array integration is that any deviation from standard connection configurations between couplers, photodetectors (PDs), and sensing arms will cause phase polarity reversal. However, our research clarifies the specific conditions under which phase polarity reversal occurs. We found that phase shifts from coupler-to-PD and coupler-to-sensing-arm connections arise from different mechanisms. The input port for the incident light does not affect the output signal phase polarity. We classify all possible configurations into groups according to their polarity outcomes, providing a framework for understanding phase behavior in FOH systems. This research offers practical guidance for achieving phase consistency in large-scale arrays, improving underwater acoustic sensing accuracy.
2. Theory
2.1. Structure of Mandrel FOH Probe
The mandrel structure is widely used in FOH probe design because of its simple structure and excellent resistance to hydrostatic pressure. Figure 1 illustrates the structure of the mandrel FOH probe examined in this study, which consists of an optical-fiber Michelson interferometer (MI) and elastic mandrels. In the MI, any two of the three output ports of a 3 × 3 fiber-optic coupler are connected to the single-mode fibers, which are tightly wound around the outer surfaces of two elastic mandrels (an inner mandrel and an outer mandrel). The ends of the fibers are connected to Faraday rotation mirrors (FRMs), which reflect the transmitted light and eliminate polarization fading effects. An air-filled gap between the inner and outer mandrels forms an air-backed structure [10]. The theoretical analysis is predicated on the assumptions of an ideal, symmetric 3 × 3 coupler and perfect FRMs.
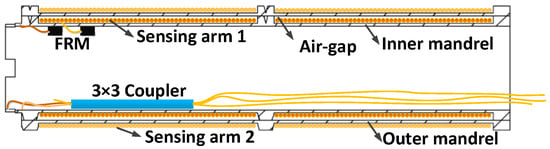
Figure 1.
Structure of the mandrel FOH sensing probe.
When the FOH is disturbed by underwater sound pressure signals, one mandrel (either the inner or outer) is compressed while the other is expanded, leading to circumference changes in the mandrels. This deformation causes variations in the length of the fibers wrapped around the mandrels, consequently inducing interferometric signals in the MI.
2.2. The 3 × 3 Coupler Demodulation Technique
The 3 × 3 demodulation technique is a common method for demodulating a signal in an FOH system. It offers several advantages, such as a high dynamic range and simple signal structure, compared with the phase-generated carrier method [11,12,13,14]. A typical optical structure of an FOH based on the 3 × 3 demodulation technique is shown in Figure 2. It is composed of a light source, a sensing probe (marked by the red-dashed box), a fiber circulator, and three PDs. The light of a narrow linewidth laser is injected into one port of the 3 × 3 coupler after a fiber circulator. Within the probe, the 3 × 3 coupler splits the light into three beams. Two of these beams travel along the sensing arms and reflect off FRMs. The reflected lights then interfere in the coupler. Finally, the interferometric signals exit through the three ports of the coupler and are detected by the three PDs.
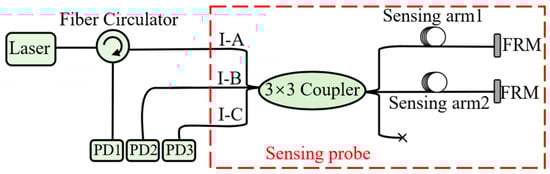
Figure 2.
Optical structure of an FOH based on 3 × 3 coupler demodulation technique.
The signals , , and , detected by PD1, PD2, and PD3, can be expressed as follows [15,16]:
where (n = 1, 2, 3) is the direct current (DC) component of the interference signal in the channel and (n = 1, 2, 3) is related to the visibility of the interference signal. is the signal to be measured. After calibration as described in [17,18], Equation (1) is simplified to
The summation of v1 and v3, multiplied by a factor of , produces the variable x as follows:
The difference between V1 and V3 generates y:
Thus, the acoustic signal can be extracted by computing the arctangent of the ratio between y and x:
2.3. Analysis of Phase Shifts in Different Connections Between the Coupler and PDs
The interference lights exit the coupler and enter the PDs. It is essential to define the connection configurations between the coupler and the PDs (PD1, PD2, and PD3). By labeling the 3 × 3 coupler ports as I-A, I-B, and I-C, we obtain six possible connection configurations (see Table 1).

Table 1.
Six configurations for connecting 3 × 3 couplers to PDs.
The sequence of the detected signals changes when the connection configurations between the coupler and the PDs are exchanged. For example, when connecting I-A to PD2 and I-B to PD1 (connection configuration IV), the signals detected by the PDs become
where , , and indicate the signals detected by PD1, PD2, and PD3 after exchanging connection configurations. For all connection configurations, we still use signals from PD1 and PD3 for signal demodulation, as shown in Equations (1)–(4). Then, we obtain the following relationship:
After dividing by and applying the arctangent to it, we obtain
We obtain by filtering the DC component. Thus, the signal demodulated using Equation (9) is opposite to that demodulated using Equation (5). Assuming that is a sinusoidal signal, the signal from configuration I exhibits a π phase shift compared with that from connection configuration IV. Similarly, the signal from configuration I also shows a π phase shift relative to configuration V (with PD1 and PD3 exchanged) and configuration VI (with PD2 and PD3 exchanged). Likewise, the signal from configuration IV shows an identical π phase shift to configurations II and III. These results confirm that a phase inversion occurs whenever exactly one pair of coupler-to-PD connections is exchanged.
Thus, configurations I, II, and III share identical phase states, which are diametrically opposed to those of configurations IV, V, and VI. The phase equivalence among configurations I, II, and III can be explained by the cancellation effect of two sequential pairwise exchanges. For example, when exchanging PD1 and PD2, followed by exchanging PD2 and PD3, the configuration changes from I to IV, then from IV to II. These two exchange operations introduce two π phase inversions that negate each other (π + π = 2π), thereby preserving the net phase in sinusoidal signals. Consequently, configurations I, II, and III are operationally equivalent, as their mutual conversions through double exchanges yield no measurable phase difference.
2.4. Analysis of Phase Shifts in Different Connections Between the Coupler and Sensing Arms
The 3 × 3 coupler MI can be configured in six different ways by connecting any two ports of the coupler to two sensing arms. As illustrated in Figure 1, these sensing arms can be wrapped around either the inner or the outer mandrel. For consistency in our analysis, we designate arm1 as the arm wrapped around the inner mandrel and arm2 as the arm wrapped around the outer mandrel. Figure 3 shows the six possible connection configurations between the coupler ports and the sensing arms. Table 2 summarizes these configurations. In configurations (a), (b), and (c), arm1 and arm2 are connected to ports O-A/O-B, O-B/O-C, and O-C/O-A, respectively. Configurations (d), (e), and (f) represent the reverse connections of arm1 and arm2 relative to configurations (a), (b), and (c), respectively.
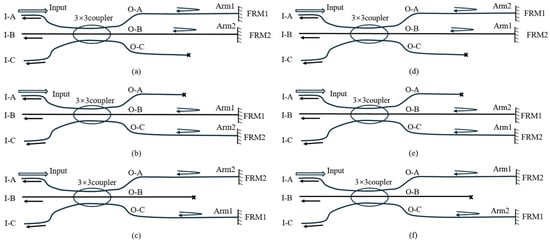
Figure 3.
Six connection configurations of the 3 × 3 coupler MI. (a–f) respectively represent 6 different connection configurations between the coupler and sensing arms.
Table 2.
Six connection configurations for connecting 3 × 3 couplers to sensing arms.
A fused-taper 3 × 3 fiber-optic coupler is a passive symmetric device made by fusing and tapering three identical fibers together in a small region. The device usually features three optical fiber tails on each side of the central fusion zone, totaling six tails. In the 3 × 3 coupler, port I-A corresponds to the direct port O-A, I-B to O-B, and I-C to O-C. This correspondence defines the transmission coefficient of the coupler. According to the coupled-mode theory, the transmission matrix Q of an ideal 3 × 3 coupler is given by [19]
where , , and is the imaginary unit. Here, m represents the transmission coefficient between the straight arms and n represents the transmission coefficient between the coupling arms.
We suppose that the light with a complex amplitude of is injected into the 3 × 3 coupler from the I-A port; then, the input complex amplitude matrix can be written as
where the symbol T represents transposition. The transmission matrix ( = a, b, c, d, e, f) has six forms, as illustrated in Figure 3. Connection configurations (a), (b), and (c) can be written as
where accounts for the phase change on the round-trip path through arm 1 of the MI, accounts for the phase change on the round-trip path through arm 2, accounts for the amplitude and phase change on the round-trip path through the unused fiber of the 3 × 3 coupler, (q = 1,2,D) denotes arm lengths, is the wavenumber, n is the effective modal refractive index, and r is the reflection coefficient of the unused fiber. We use angled cleaving to suppress reflections, which makes close to zero [17].
Ultimately, the complex amplitude matrix of the three outputs can be calculated by
For connection (a), the PDs record the optical intensity (), which is derived by
where , is the original length, and is the length change caused by pressure. The arm-length difference becomes . Substituting Equation (11) into Equation (1) results in a demodulated signal:
where .
For configurations (b) and (c), the corresponding signals are
Here, represents the signal influenced by environmental changes and is a rapidly varying term. After removing the DC component, the target signal remains consistent across configurations (a)–(c).
Similarly, for configuration (d), where arm 1 connects to O-B and arm 2 to O-A, the demodulated signal becomes
After removing the DC item, this results in , which is the inverse of . For brevity, we omit the detailed derivations for configurations (e) and (f), but note that the output signals in configurations (d)–(f) remain consistent with each other. However, configurations (d)–(f) produce phase-inverted signals relative to configurations (a)–(c).
2.5. Phase Characteristics Independent of Incident Light Port Choice
When the light source input port is changed from I-A to I-B (Figure 4), the input amplitude matrix is defined as
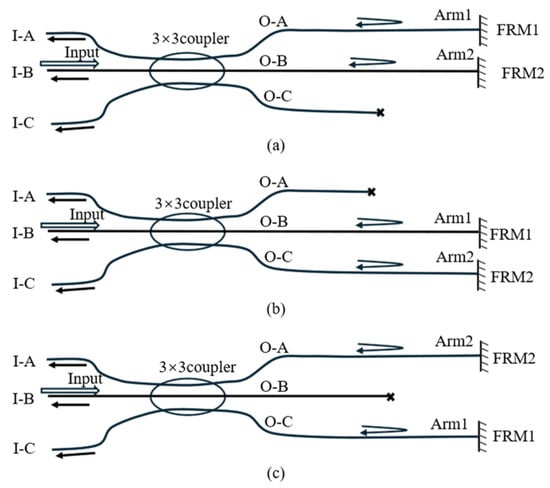
Figure 4.
Structure of the 3 × 3 MI with input from I-B. (a–c) exemplify three distinct connections selected from six possible coupler-to-sensing-arm configurations.
Substituting Equation (19) into Equation (13), the output interference intensities for configurations (a), (b), and (c) are
Substituting Equations (20)–(22) into Equation (1) results in the following demodulated signals:
After removing the DC component, all these connections acquire identical signals: . Similarly, when the connections are swapped, the demodulated signal inverts to .
Identical demodulated phase characteristics were observed when comparing the system’s response using input ports I-A and I-B. Furthermore, owing to the structural symmetry between ports I-A and I-C, utilizing I-C as the input port yielded the same phase characteristics. These findings indicate that the selection of the input port for incident light does not alter the demodulated output phase, thereby offering flexibility in system design and implementation.
3. Experiment Set-Up
In the experiments, the 3 × 3 coupler was positioned outside the probe rather than being integrated within it. This configuration facilitated easier modification of the connection configurations between the 3 × 3 coupler and the sensing arms, as illustrated in Figure 5.
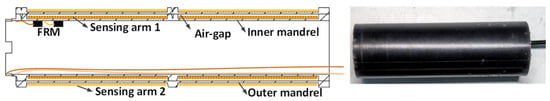
Figure 5.
Structure of the FOH probe: (left) schematic diagram of the hydrophone structure; (right) photograph of the fabricated device.
The experimental setup is illustrated in Figure 6. The red lines represent the optical paths, and the blue lines represent the electrical signal paths. A laser diode (LD, Orion™ series, RIO Photonics, Luna Innovations Inc., Santa Clara, CA, USA) with an output power of 10 mW was used as the light source. The light enters port 1 of the fiber circulator and exits through port 2. Then, the circulator sends the light to the I-A arm of the 3 × 3 coupler. The O-C arm, among the three output arms of the coupler, is not used. The O-A and O-B arms are connected to arm1 and arm2 of the probe, respectively. Arm1 coils around the inner mandrel, and arm2 coils around the outer mandrel.
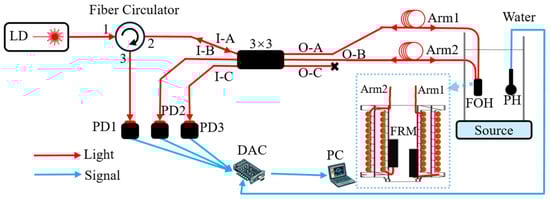
Figure 6.
Set-up of the experiment.
At the end of each arm, the FRM reflects the light and generates interference signals in the coupler. One interference signal exits through port I-A, returns to port 2 of the circulator, and then exits through port 3. Finally, PD1 detects this signal. Signals exiting ports I-B and I-C are detected by PD2 and PD3, respectively. The PDs convert optical signals to electrical signals. A digital acquisition card (DAC) collects these electrical signals and sends them to a personal computer (PC). Both piezoelectric hydrophone (PH) and FOH outputs were recorded simultaneously by the DAC at a sampling rate of 10 kHz per channel. The acoustic source placed at the base of the standing wave tube emitted sinusoidal acoustic signals with a signal-to-noise ratio exceeding 10 dB.
FOH and PH were both suspended 10 cm below the water surface in the standing wave tube (Figure 7). Both hydrophones experienced the same acoustic pressure [20]. The PH output served as a reference signal to compare the output phases of the FOH for each connection configuration.
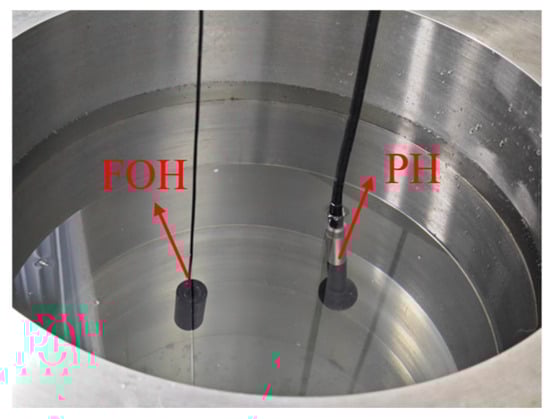
Figure 7.
Set-up of vibrating liquid column comparison.
4. Results
There are six connection configurations (I–VI) between the 3 × 3 coupler and the PDs (PD1, PD2, and PD3). There are also six connection configurations (a–f) between the coupler and the sensing arms (arm1 and arm2). Thus, 36 different connection configurations can be formed, as listed in Table 3. To clarify, the symbol “I–a” represents a connection configuration combining connection configuration (I) with configuration (a). This symbol convention is consistently applied to all other combinations. The port definition for the 3 × 3 coupler is the same as that shown in Figure 3.
Table 3.
Relationship of different connection configurations to ports of 3 × 3 coupler.
4.1. Phase Characteristics Influenced by Coupler-to-PD Configuration
We used the fast Fourier transform to extract the phases of the PH and FOH signals at the acoustic emission frequency and subsequently calculated the phase differences between them. The frequency of 120 Hz was selected for demonstration. The phase differences are shown in Figure 8. In this figure, the horizontal axis corresponds to the 36 connection configurations listed in Table 3, and the vertical axis represents the phase difference between the PH and FOH signals. The black lines at the top of each bar indicate error bars, and the different colors represent various coupler-to-sensing arm connections (marked by a–f), as previously defined in Figure 3. For example, the phase difference of the first connection configuration (I–a) is 0.02 rad, with a ±0.01 rad standard deviation.
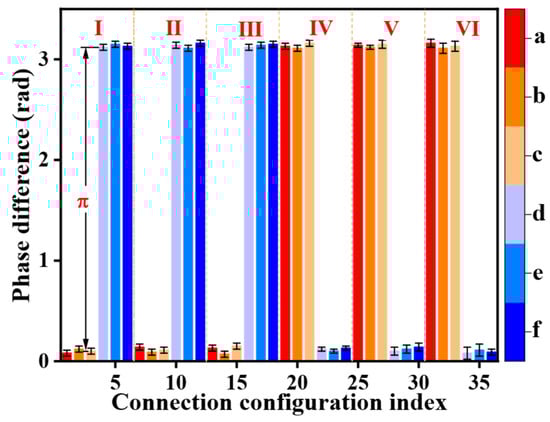
Figure 8.
Phase difference between FOH and PH for different connection configurations. Different colors respectively represent the coupler-to-sensing-arm configuration (a)–(f).
A slight system bias was observed, likely due to the difficulty in precisely aligning the acoustic centers of the PH and FOH [21]. Consequently, the measured phase differences deviate slightly from the ideal values of zero or π rad. While such a phase bias, stemming from acoustic center misalignment, could become a limiting factor at extremely high acoustic frequencies or in applications demanding exceptionally high phase precision, it generally remains within acceptable tolerances for our primary application domain of underwater target detection, particularly at frequencies below 2 kHz. Therefore, the experimental data are still sufficient to support our conclusions, even considering this uncertainty.
For configurations (I) to (VI) under configuration (a) (corresponding to connection configuration indexes 1, 7, 13, 19, 25, and 31), the phase differences for configurations I, II, and III are approximately zero rad. In contrast, configurations IV, V, and VI exhibit phase differences near π rad. This indicates that configurations I, II, and III have the same phase relationship, while configurations IV, V, and VI have the same phase relationship. However, there is a π rad phase difference between the first and the second group.
These results show that the experimental results closely match the theoretical predictions. The configurations for connecting the 3 × 3 coupler to the PDs significantly affect the output phase. Swapping one pair of PD connections reverses the phase of the demodulated signal, whereas swapping two pairs maintains the original phase. For example, swapping the connections between PD1 and PD3 changes configurations I, II, and III to IV, V, and VI. Swapping the other pair (PD1 and PD2) further changes these connection configurations to II, III, and I, respectively.
4.2. Phase Characteristics Influenced by Coupler–Sensing Arm Configuration
Figure 9 shows the time-domain signals of the FOH and PH for different coupler-to-sensing-arm connection configurations under configuration I. The signal amplitudes were normalized to clearly emphasize the phase relationships. The FOH and PH signals were compared under the same sinusoidal sound pressure.
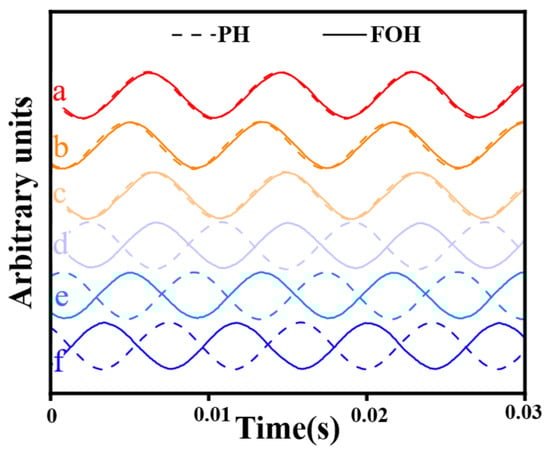
Figure 9.
Time-domain signal comparison of different coupler-to-sensing-arm connections (solid lines: FOH signals; dashed lines: PH signals). Different colors respectively represent the coupler-to-sensing-arm configuration (a)–(f).
The results indicate that FOH and PH outputs are all in the same phase under configurations (a), (b), and (c), whereas they are all in opposite phases under configurations (d), (e), and (f). Thus, the FOH signals maintain identical phases when arm1 connects to O-A/O-B/O-C and arm2 connects to O-B/O-C/O-A. Swapping these connections (arm1 to O-B/O-C/O-A and arm2 to O-A/O-B/O-C) causes a π phase shift.
This phase shift arises because swapping a single pair of sensing arm connections introduces a π rad shift. Conversely, swapping two pairs of connections maintains the original phase. Specifically, configurations (d), (e), and (f) differ from configuration (a) by one swapped pair and thus cause a π rad shift. Further swapping the other pair induces an additional π rad shift. However, the two π rad shifts are equal to no net phase change in the sinusoidal signal. Therefore, configurations (b) and (c) are identical to configuration (a) because both configurations (b) and (c) can revert to configuration (a) by swapping an additional pair from configuration (d).
These results show that the experimental results closely match the theoretical predictions and that strict adherence to the defined coupling sequence is important for maintaining the consistent phase across the FOH array.
4.3. Phase Characteristics Independent of Incident Light Port Choice
Figure 10 displays the time-domain signals for the FOH and PH obtained under configurations I–a using different input ports of the 3 × 3 coupler. Building on the visual language introduced earlier, red continues to denote the coupler-sensing-arm configuration (a). As evidenced by the near-zero phase differences shown in the figure, altering the input port connected to the laser source (via circulator port 2) had a negligible effect on the output phase. This observation indicates that for a symmetric 3 × 3 coupler, the choice of input port does not significantly influence the demodulated signal phase.
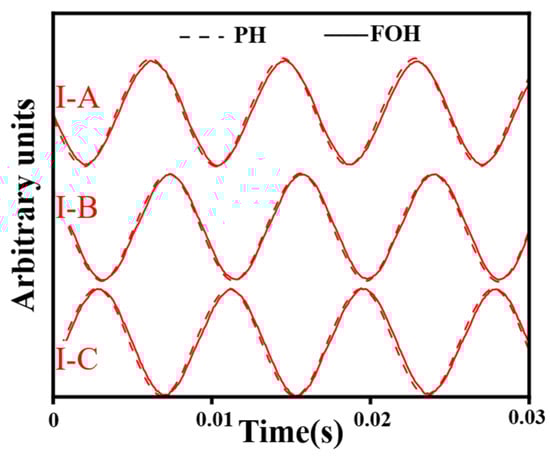
Figure 10.
Time-domain signal comparison of different input ports under connection configurations I-f (solid lines: FOH signals; dashed lines: PH signals). Red represent the coupler-sensing-arm configuration (a).
5. Discussion
Our study analyzed the phase polarity of photoelectric detection in FOHs using the 3 × 3 coupler demodulation technique. We found several key findings. The first discovery is that the connection between the 3 × 3 coupler and PDs, as well as the connection between the coupler and the sensor arm, will affect the phase polarity of the output signal. Another interesting phenomenon is that if a pair of connections are exchanged, whether coupler-to-PD or coupler-to-sensing-arm connections, it will cause a π rad phase shift, but if two pairs of connections are exchanged at the same time, the phase polarity will return to its original state. We also found that the choice of different input ports on the 3 × 3 coupler has no effect on the phase polarity of the output signal.
When a pair of coupler-to-PD connections are exchanged, the input of the algorithm changes so that the calculated phase will be different. However, if another pair of connections are exchanged, the phase polarity changes back to the original. The phase polarity changes caused by the coupler-to-sensing-arm connection may appear similar, but the principle is not the same. This effect originates from the interferometric principle in coupled-mode theory. Swapping the sensing arms inverts the relative optical path difference, causing a π rad phase shift in the interference signal. In practical applications, as long as there is a choice of any configuration in the first group (a, b, and c), the resulting signal will have the same phase polarity. In the same sense, with any configuration in the second group (d, e, and f) selected, although the polarity in the group is the same, it will be the opposite of the polarity of the first group. This feature is particularly useful when assembling FOHs, as long as the manufacturer ensures that all the hydrophones use the same polar group connection configuration.
In practice, the specific labeling of ports in three-port optical couplers has no impact on their physical behavior. These couplers are typically fabricated by fusing three identical fibers, resulting in a symmetrical structure. Because of this symmetry, all ports are functionally equivalent. Therefore, the specific labels assigned to input ports (e.g., I-A, I-B, I-C) are arbitrary, and do not affect the results or conclusions of our work.
The essential point is the one-to-one correspondence between each input and its respective output port (I-X to O-X). For instance, if we maintain fixed PDs and sensing arms while relabeling the input ports as I-C, I-A, and I-B, the corresponding output ports would accordingly be renamed O-C, O-A, and O-B, as depicted in Figure 11. Under identical experimental conditions, this mere redefinition of ports cannot alter the outputs of the system.
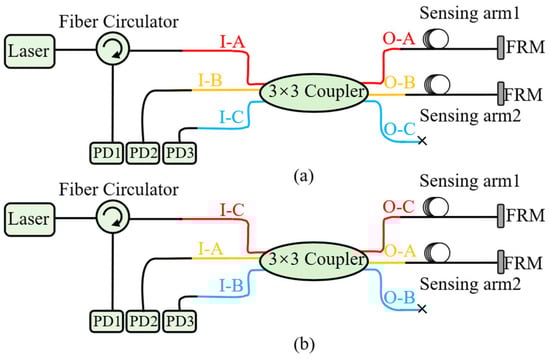
Figure 11.
Illustration of different port labeling schemes for the same connection configuration. (a) The previous labeling scheme; (b) The relabeling scheme.
This principle is validated by our experimental results, which demonstrate that the relabeled connection method (configuration 36) produces identical outputs to the original configuration (configuration 1). This confirms that our model accurately captures this fundamental symmetry property of the coupler, aligning with intuitive expectations.
However, it is important to emphasize that while coupler symmetry explains the invariance to port relabeling, it cannot account for the distinct phase polarity patterns we observed when altering the connections of PDs or sensing arms. The significant contribution of our work lies in its capacity to characterize these specific polarity behaviors in detail. This provides explanatory power that extends beyond what can be deduced from the general principle of coupler symmetry alone. Based on our findings, we propose a very simple assembly method to ensure that phase polarity is consistent. The specific approach is to set a standard connection method, such as connecting the direct port of the outer mandrel fiber to PD1, and the direct port of the inner mandrel fiber to PD2. Due to input port independence, it is not necessary to pay attention to which port the laser is from. Unlike active calibration methods that require reference sources [6], this is unnecessary for our method. Compared with the self-calibration method [7], the calculation is much smaller, and the data processing is not so cumbersome. Furthermore, this connection principle does not only apply to MIs. It serves as a universal principle applicable to any interferometric sensors relying on 3 × 3 coupler demodulation.
Although the experimental results are basically consistent with theoretical predictions, there are still some shortcomings. Our study resolved the π rad phase inversions caused by connection configurations but cannot explain phase shifts at other angles. However, eliminating these π phase inconsistencies is a necessary first step before investigating the more complex physical mechanisms responsible for non-π phase variations in the system. It is necessary to correct the problem of the π phase first. This study lays the foundation for hardware consistency and paves the way for subsequent calibration work. Future work should study the effect of coupling asymmetry on phase displacement and then compare other demodulation methods, such as the phase generate carrier or heterodyne detection, so that the understanding of phase consistency is more comprehensive.
6. Conclusions
This work provides a systematic theoretical analysis and experimental validation of the factors governing photoelectric detection phase polarity in FOHs based on the 3 × 3 coupler demodulation technique. Our primary contribution lies in establishing clear hardware-level rules that link specific coupler connection configurations to predictable output phase polarities. We have demonstrated that distinct groups of coupler-to-PD and coupler-to-sensing-arm connections yield identical phase polarities, clarified the π shift behavior resulting from single connection pair swaps, and confirmed the independence of phase polarity from input port choice in symmetric couplers. The significance of these findings is primarily practical: they offer explicit, easily implementable guidelines for FOH assembly that can ensure phase polarity consistency a priori, significantly simplifying the integration of large-scale arrays. By addressing a fundamental source of phase variability at the hardware level, this research complements existing calibration techniques and contributes towards enhancing the overall performance, particularly beamforming accuracy and target localization capabilities, of FOH array systems in critical underwater acoustic sensing applications.
Author Contributions
Conceptualization, Y.L. (Yatao Li) and J.W.; Data curation, Y.L. (Yatao Li); Formal analysis, Y.L. (Yatao Li); Funding acquisition, M.C.; Study, Y.L. (Yatao Li); Methodology, R.L.; Project administration, J.W., M.C., Z.M., X.H. and Y.L. (Yang Lu); Software, M.C.; Supervision, Z.M.; Validation, Y.L. (Yatao Li), R.L. and Y.C.; Visualization, Y.L. (Yatao Li); Writing—original draft, Y.L. (Yatao Li); Writing—review and editing, J.W. and M.C. All authors have read and agreed to the published version of the manuscript.
Funding
This research was funded by National Key Research and Development Program of China [2022YFB3205300], National Natural Science Foundation of China [Grant 42476189], and Postgraduate Scientific Research Innovation Project of Hunan Province [CX20240135].
Institutional Review Board Statement
Not applicable.
Informed Consent Statement
Not applicable.
Data Availability Statement
Data underlying the results presented in this paper are not publicly available at this time but may be obtained from the authors upon reasonable request.
Conflicts of Interest
The authors declare no conflicts of interest.
Abbreviations
The following abbreviations are used in this manuscript:
| FOH | Fiber-optic hydrophone |
| PH | Piezoelectric hydrophone |
| MI | Michelson interferometer |
| PD | Photodetector |
| FRM | Faraday rotation mirrors |
References
- Meng, Z.; Chen, W.; Wang, J.; Hu, X.; Chen, M.; Zhang, Y. Recent Progress in Fiber-Optic Hydrophones. Photonic Sens. 2021, 11, 109–122. [Google Scholar] [CrossRef]
- Yu, Z.; Cai, Y.; Mo, D. Comparative Study on Noise Reduction Effect of Fiber Optic Hydrophone Based on LMS and NLMS Algorithm. Sensors 2020, 20, 301. [Google Scholar] [CrossRef] [PubMed]
- Fan, H.; Nie, W.; Yao, S.; An, L.; Yu, F.; Zhang, Y.; Wu, Q. A High-Order Time-Delay Difference Estimation Method for Signal Enhancement in the Distorted Towed Hydrophone Array. J. Acoust. Soc. Am. 2024, 156, 1996–2008. [Google Scholar] [CrossRef] [PubMed]
- Ashry, I.; Mao, Y.; Wang, B.; Hveding, F.; Bukhamsin, A.Y.; Ng, T.K.; Ooi, B.S. A Review of Distributed Fiber–Optic Sensing in the Oil and Gas Industry. J. Light. Technol. 2022, 40, 1407–1431. [Google Scholar] [CrossRef]
- Janneh, M.; Bruno, F.A.; Guardato, S.; Donnarumma, G.P.; Iannaccone, G.; Gruca, G.; Werzinger, S.; Gunda, A.; Rijnveld, N.; Cutolo, A.; et al. Field Demonstration of an Optical Fiber Hydrophone for Seismic Monitoring at Campi-Flegrei Caldera. Opt. Laser Technol. 2023, 158, 108920. [Google Scholar] [CrossRef]
- Yuan, W.; Zhou, T.; Jiajun, S.; Du, W.; Wei, B.; Wang, T. Correction Method for Magnitude and Phase Variations in Acoustic Arrays Based on Focused Beamforming. IEEE Trans. Instrum. Meas. 2020, 69, 6058–6069. [Google Scholar] [CrossRef]
- Chi, F.; Zhao, M.; Xiao, Y. Calibration Method for Phase Consistency of Hydrophone Array Based on PSO-SA. In Proceedings of the 2023 IEEE 11th International Conference on Computer Science and Network Technology (ICCSNT), Dalian, China, 21–22 October 2023; pp. 212–218. [Google Scholar]
- Liu, Y.; Li, Y. Phase Error Calibration of the Linear Array Based on Genetic Algorithm. In Proceedings of the 2015 4th International Conference on Computer Science and Network Technology (ICCSNT), Harbin, China, 19–20 December 2015; Volume 1, pp. 1282–1285. [Google Scholar]
- Friedlander, B. Array Self Calibration Using Multiple Data Sets. In Proceedings of the 2016 50th Asilomar Conference on Signals, Systems and Computers, Pacific Grove, CA, USA, 6–9 November 2016; IEEE: Piscataway, NJ, USA, 2016; pp. 674–678. [Google Scholar]
- Yang, Y.; Chang, T.; Yu, M.; Wu, C.; Cheng, L.; Cui, H.-L. Physics-Based Performance Optimization of Fiber-Optic Interferometric Hydrophone with Push–Pull Mandrel Structure. IEEE Sens. J. 2022, 22, 19346–19356. [Google Scholar] [CrossRef]
- Todd, M.D.; Johnson, G.A.; Chang, C.C. Passive, Light Intensity-Independent Interferometric Method for Fibre Bragg Grating Interrogation. Electron. Lett. 1999, 35, 1970–1971. [Google Scholar] [CrossRef]
- Li, C.; Tang, J.; Jiang, Y.; Cheng, C.; Cai, L.; Yang, M. An Enhanced Distributed Acoustic Sensor with Large Temperature Tolerance Based on Ultra-Weak Fiber Bragg Grating Array. IEEE Photonics J. 2020, 12, 1–11. [Google Scholar] [CrossRef]
- Koo, K.P.; Tveten, A.B.; Dandridge, A. Passive Stabilization Scheme for Fiber Interferometers Using (3×3) Fiber Directional Couplers. Appl. Phys. Lett. 1982, 41, 616–618. [Google Scholar] [CrossRef]
- Zhang, J.; Wu, X.; Zhou, W.; Shi, J.; Guang, D.; Zuo, C.; Mu, S.; Liu, Y.; Lin, Z.; Fang, C.; et al. A Low Noise Floor 3 × 3 Coupler Phase Demodulation Scheme. J. Light. Technol. 2024, 42, 470–476. [Google Scholar] [CrossRef]
- Cameron, C.B.; Keolian, R.M.; Garrett, S.L. Garrett A Symmetric Analogue Demodulator for Optical Fiber Interferometric Sensors. In Proceedings of the [1991] Proceedings of the 34th Midwest Symposium on Circuits and Systems, Monterey, CA, USA, 14–17 May 1992; IEEE: Piscataway, NJ, USA, 1992; Volume 2, pp. 666–671. [Google Scholar]
- Zhang, H.; Zhang, M.; Wang, L.; Liao, Y.; Wang, D.N. Output Noise Analysis of Optical Fiber Interferometric Sensors Using a 3 × 3 Coupler. Meas. Sci. Technol. 2011, 22, 125203. [Google Scholar] [CrossRef]
- Zhang, Y.; Wang, J.; Meng, Z.; Hu, X.; Lu, Y.; Liang, Y.; Chen, M. The Echo-Induced Influence on the Frequency-Modulating Calibration of the 3×3 Coupler-Based Michelson Interferometer and Its Suppression. J. Light. Technol. 2021, 39, 5995–6007. [Google Scholar] [CrossRef]
- Xia, Q.; Wu, X.; Liu, X.; Zhang, J.; Zhou, W.; Wang, T.; Shi, J.; Luo, J.; Yu, B. Low Noise 3 × 3 Coupler Demodulation Scheme Based on Spectral Subtraction with Multi-Window Minimum Statistical Noise Estimation. Opt. Express 2024, 32, 40416. [Google Scholar] [CrossRef] [PubMed]
- Huang, S.-C.; Lin, W.-W.; Chen, M.-H. Cross-Talk Analysis of Time-Division Multiplexing of Polarization-Insensitive Fiber-Optic Michelson Interferometric Sensors with a 3 × 3 Directional Coupler. Appl. Opt. 1997, 36, 921. [Google Scholar] [CrossRef] [PubMed]
- Malarkodi, A.; Latha, G.; Sridhar, P.; Bøgholm, N.V. Design Considerations and Establishment of a Low Frequency Hydrophone Calibration Setup Using the Principle of Vibrating Water Column. Int. J. Acoust. Vib. 2018, 23, 44–48. [Google Scholar] [CrossRef]
- Chen, M.-H.; Lin, W.-W.; Shih, S.-T. Analysis of Fibre Optic Michelson Interferometric Sensor Distortion Caused by the Imperfect Properties of Its 3 × 3 Coupler. IEE Proc. Optoelectron. 1997, 144, 377–382. [Google Scholar] [CrossRef]
Disclaimer/Publisher’s Note: The statements, opinions and data contained in all publications are solely those of the individual author(s) and contributor(s) and not of MDPI and/or the editor(s). MDPI and/or the editor(s) disclaim responsibility for any injury to people or property resulting from any ideas, methods, instructions or products referred to in the content. |
© 2025 by the authors. Licensee MDPI, Basel, Switzerland. This article is an open access article distributed under the terms and conditions of the Creative Commons Attribution (CC BY) license (https://creativecommons.org/licenses/by/4.0/).