Research on Maximum Likelihood Decoding Algorithm and Channel Characteristics Optimization for 4FSK Ultraviolet Communication System Based on Poisson Distribution

 ,
,
Abstract
1. Introduction
2. Signal Processing Principles
2.1. Poisson Statistical Properties in Optical 4FSK Communications
2.2. Pulse Frequency Slicing and Counting
2.3. Frequency Correlation Detection
2.4. CDR Matrix Synchronization Operations to Obtain Synchronization Moments
2.5. Codeword-Level Maximum Likelihood Decoding
2.6. Construction of LDPC and RS Codes
3. System Design with Simulation and Experimental Results
3.1. UV Channel Modeling Analysis and Simulation
3.1.1. LOS Model
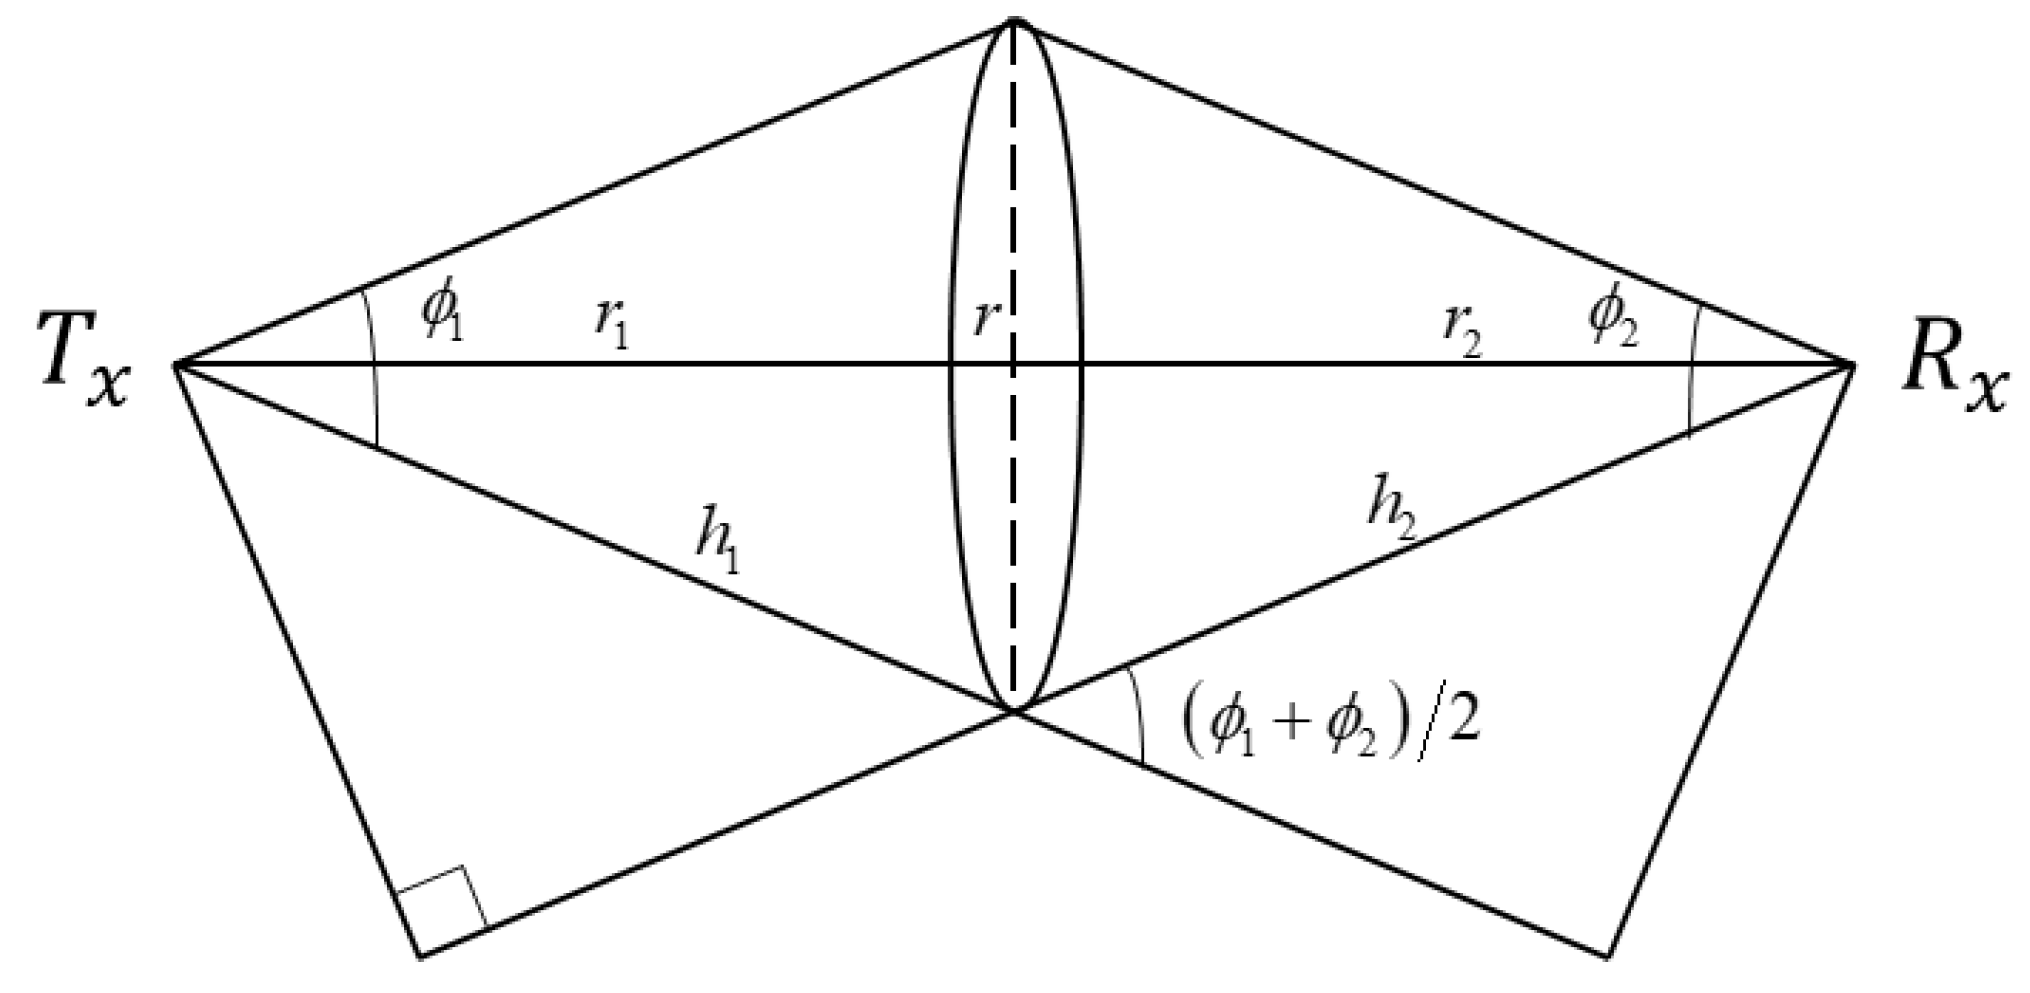
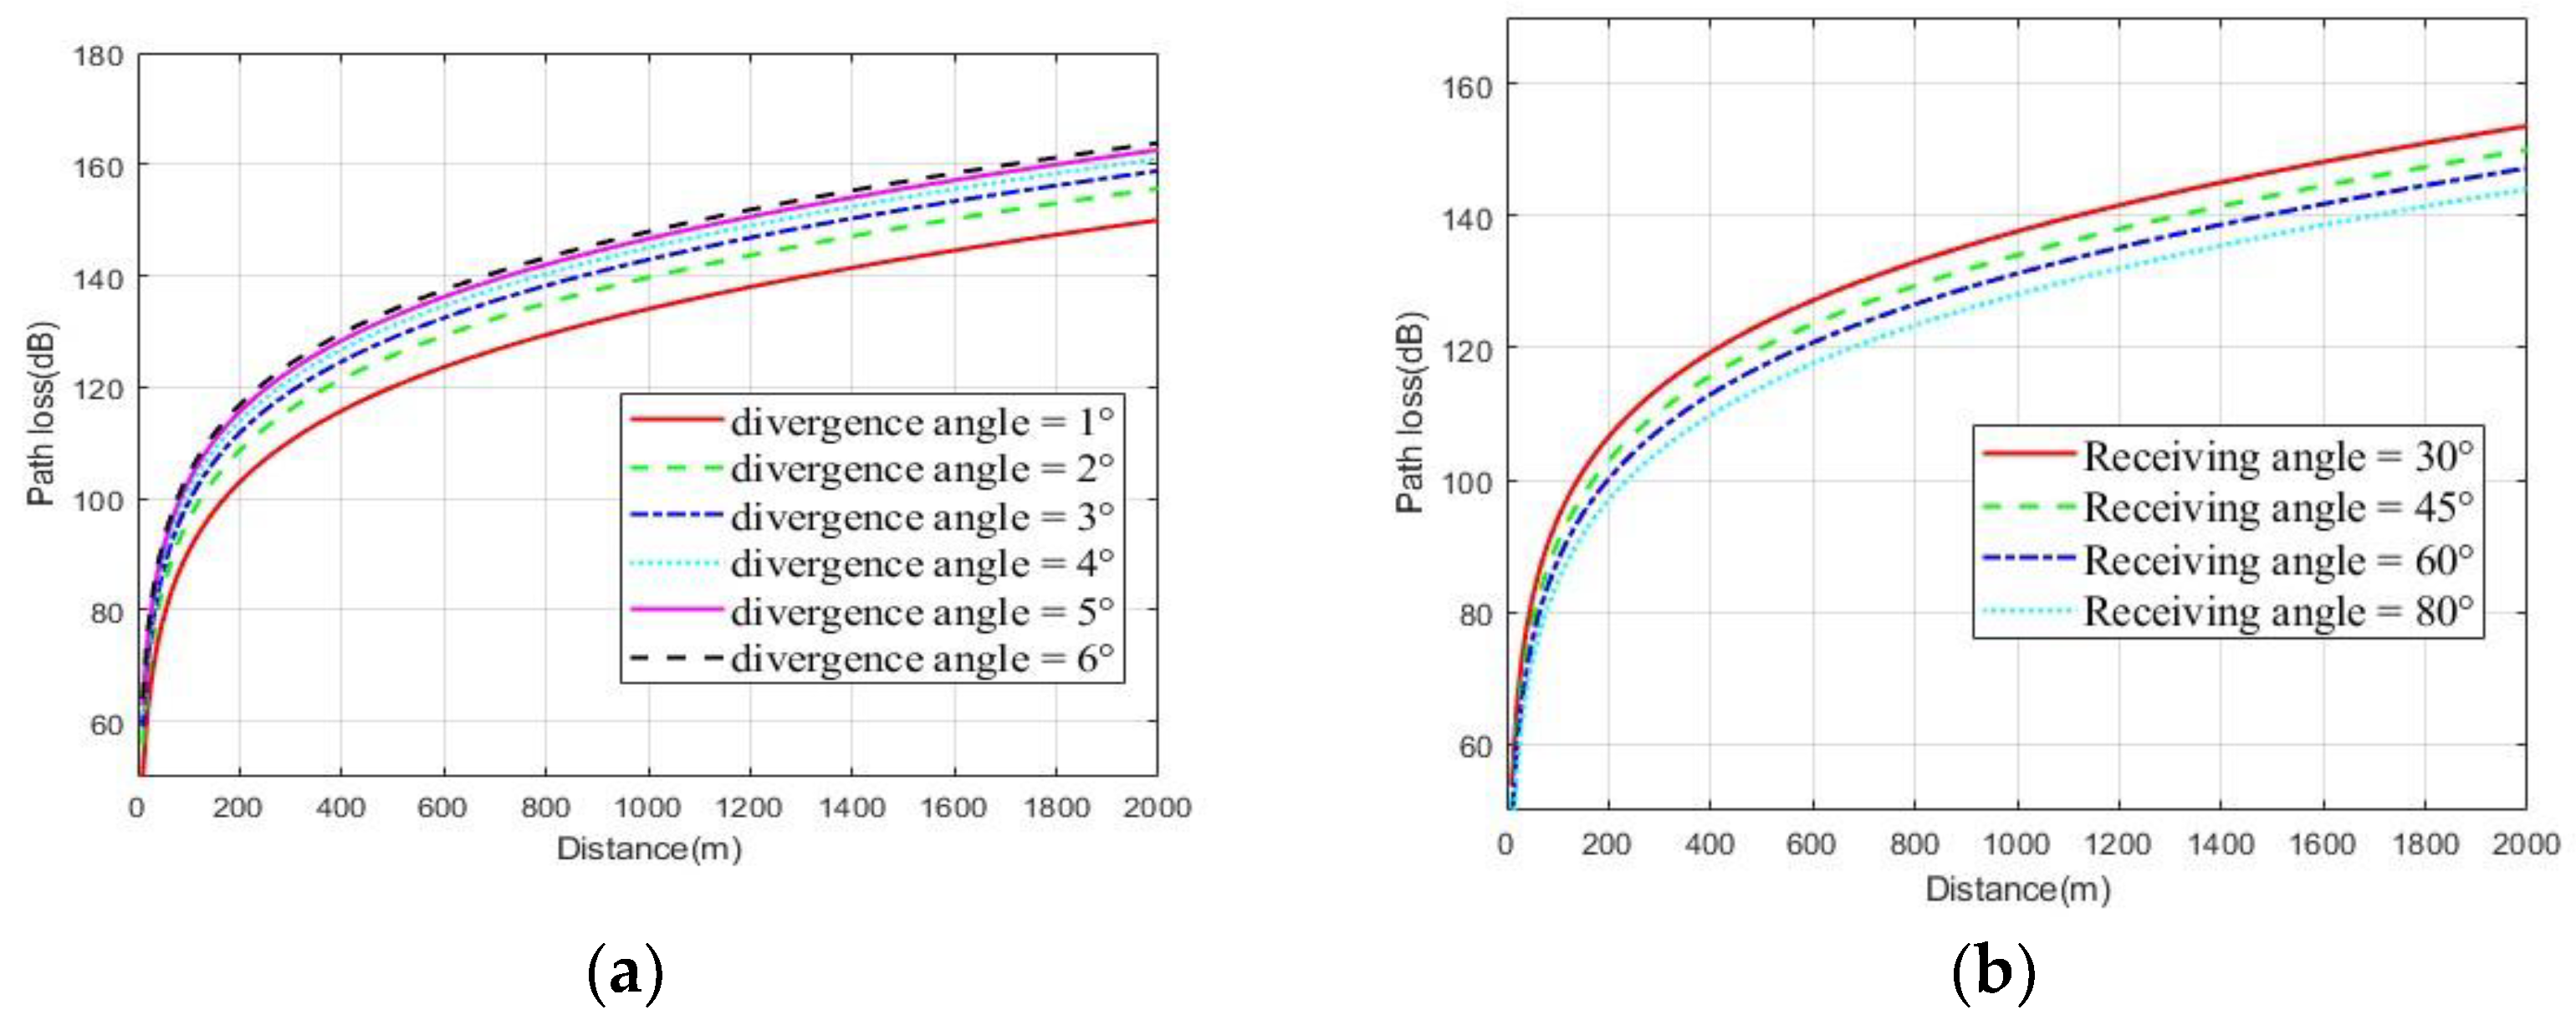
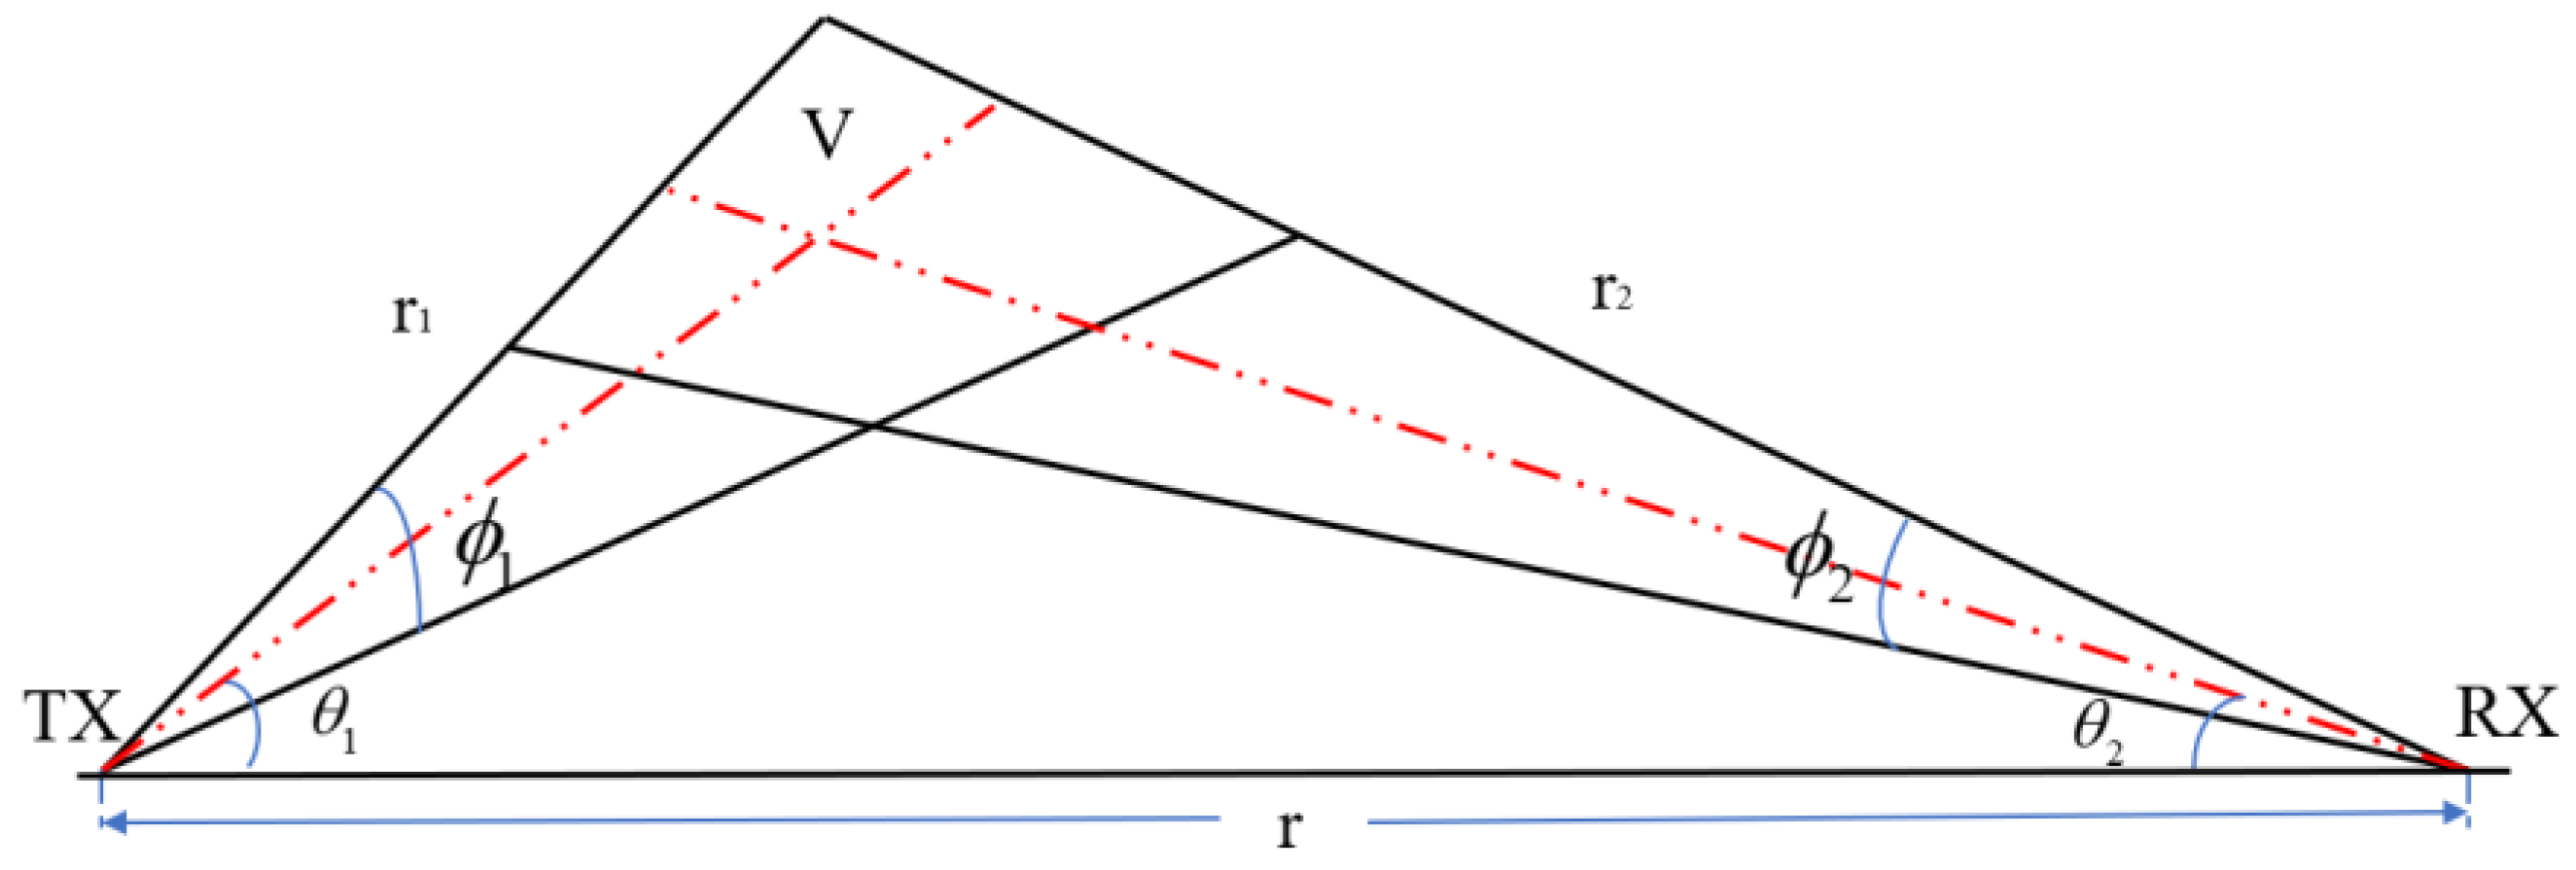
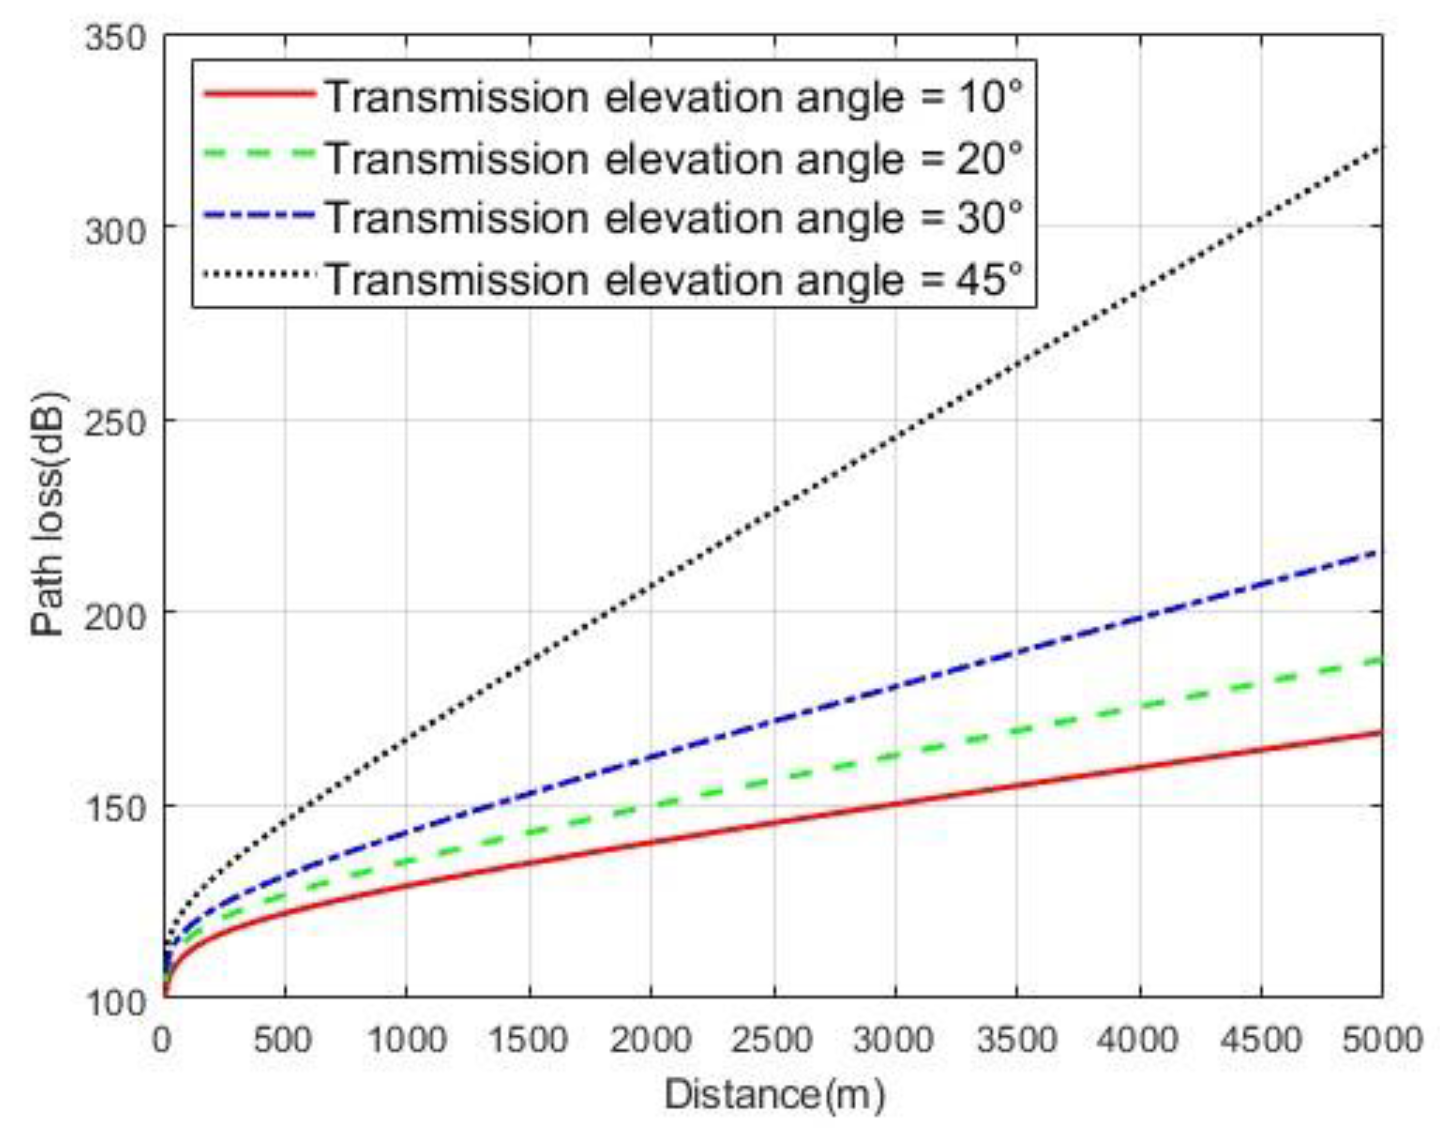
3.1.2. NLOS Single Scattering Model
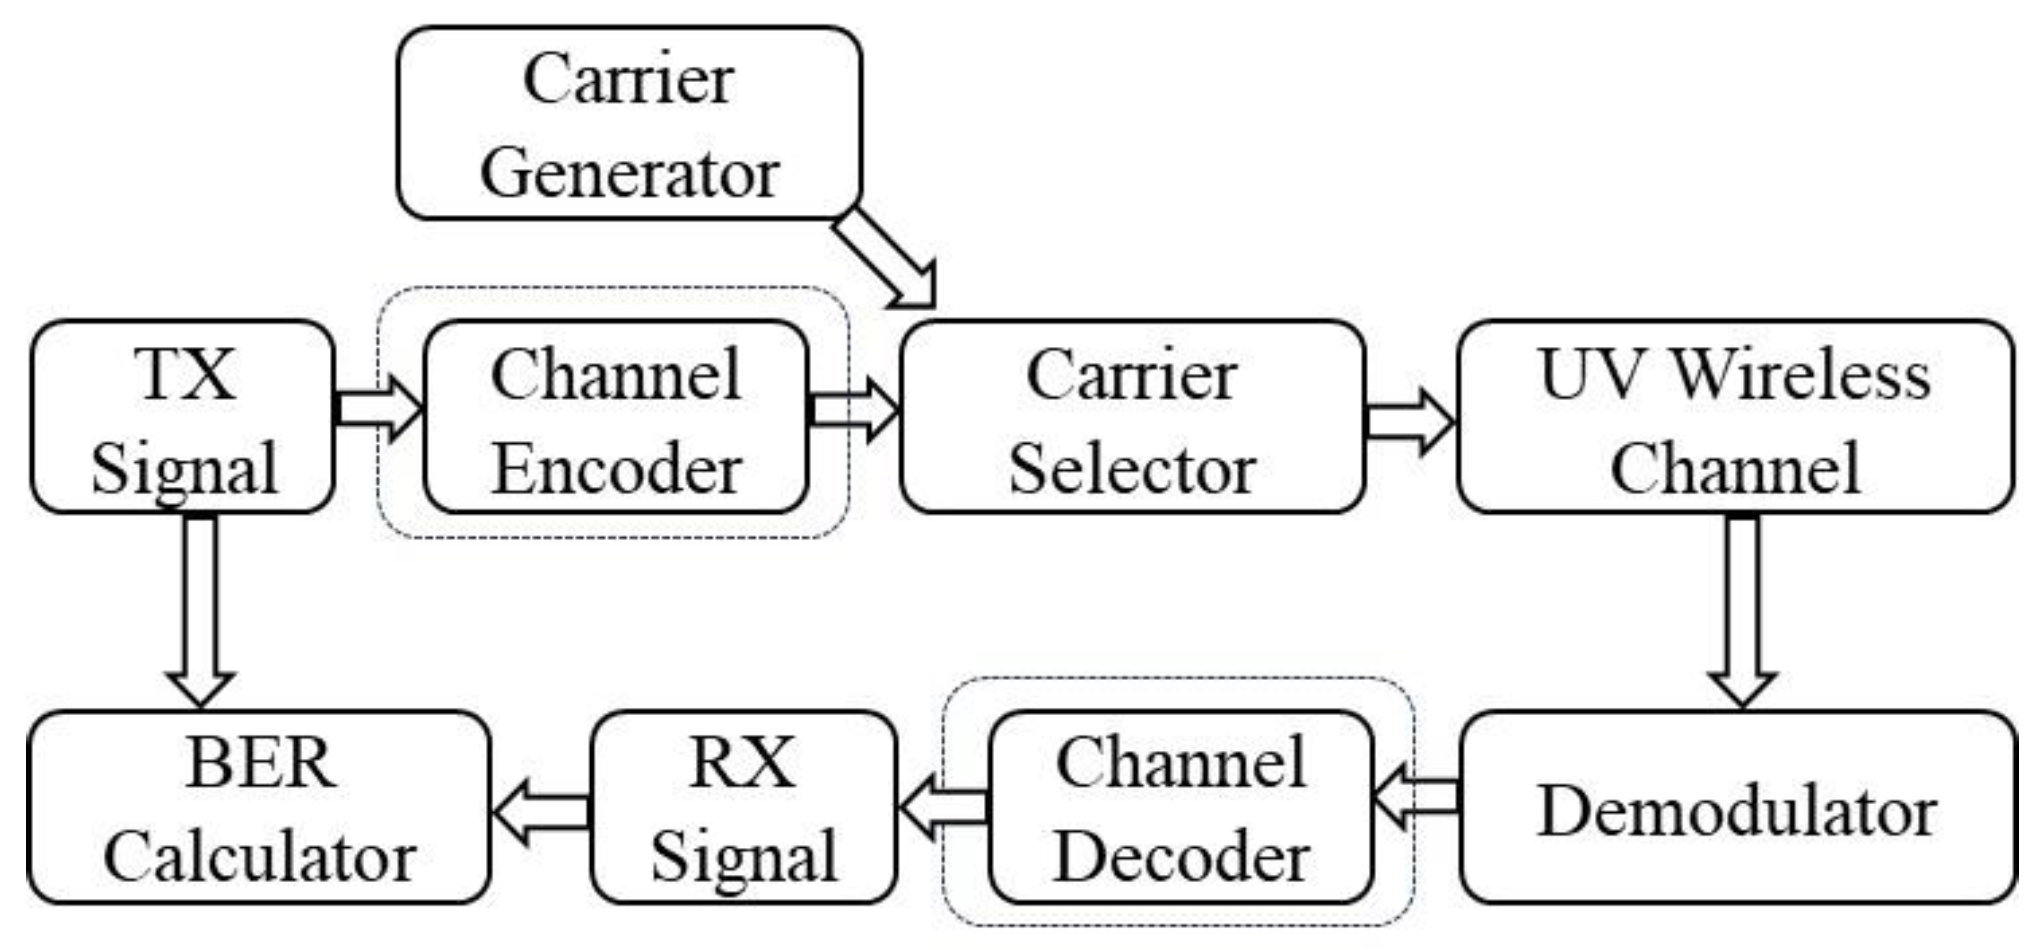
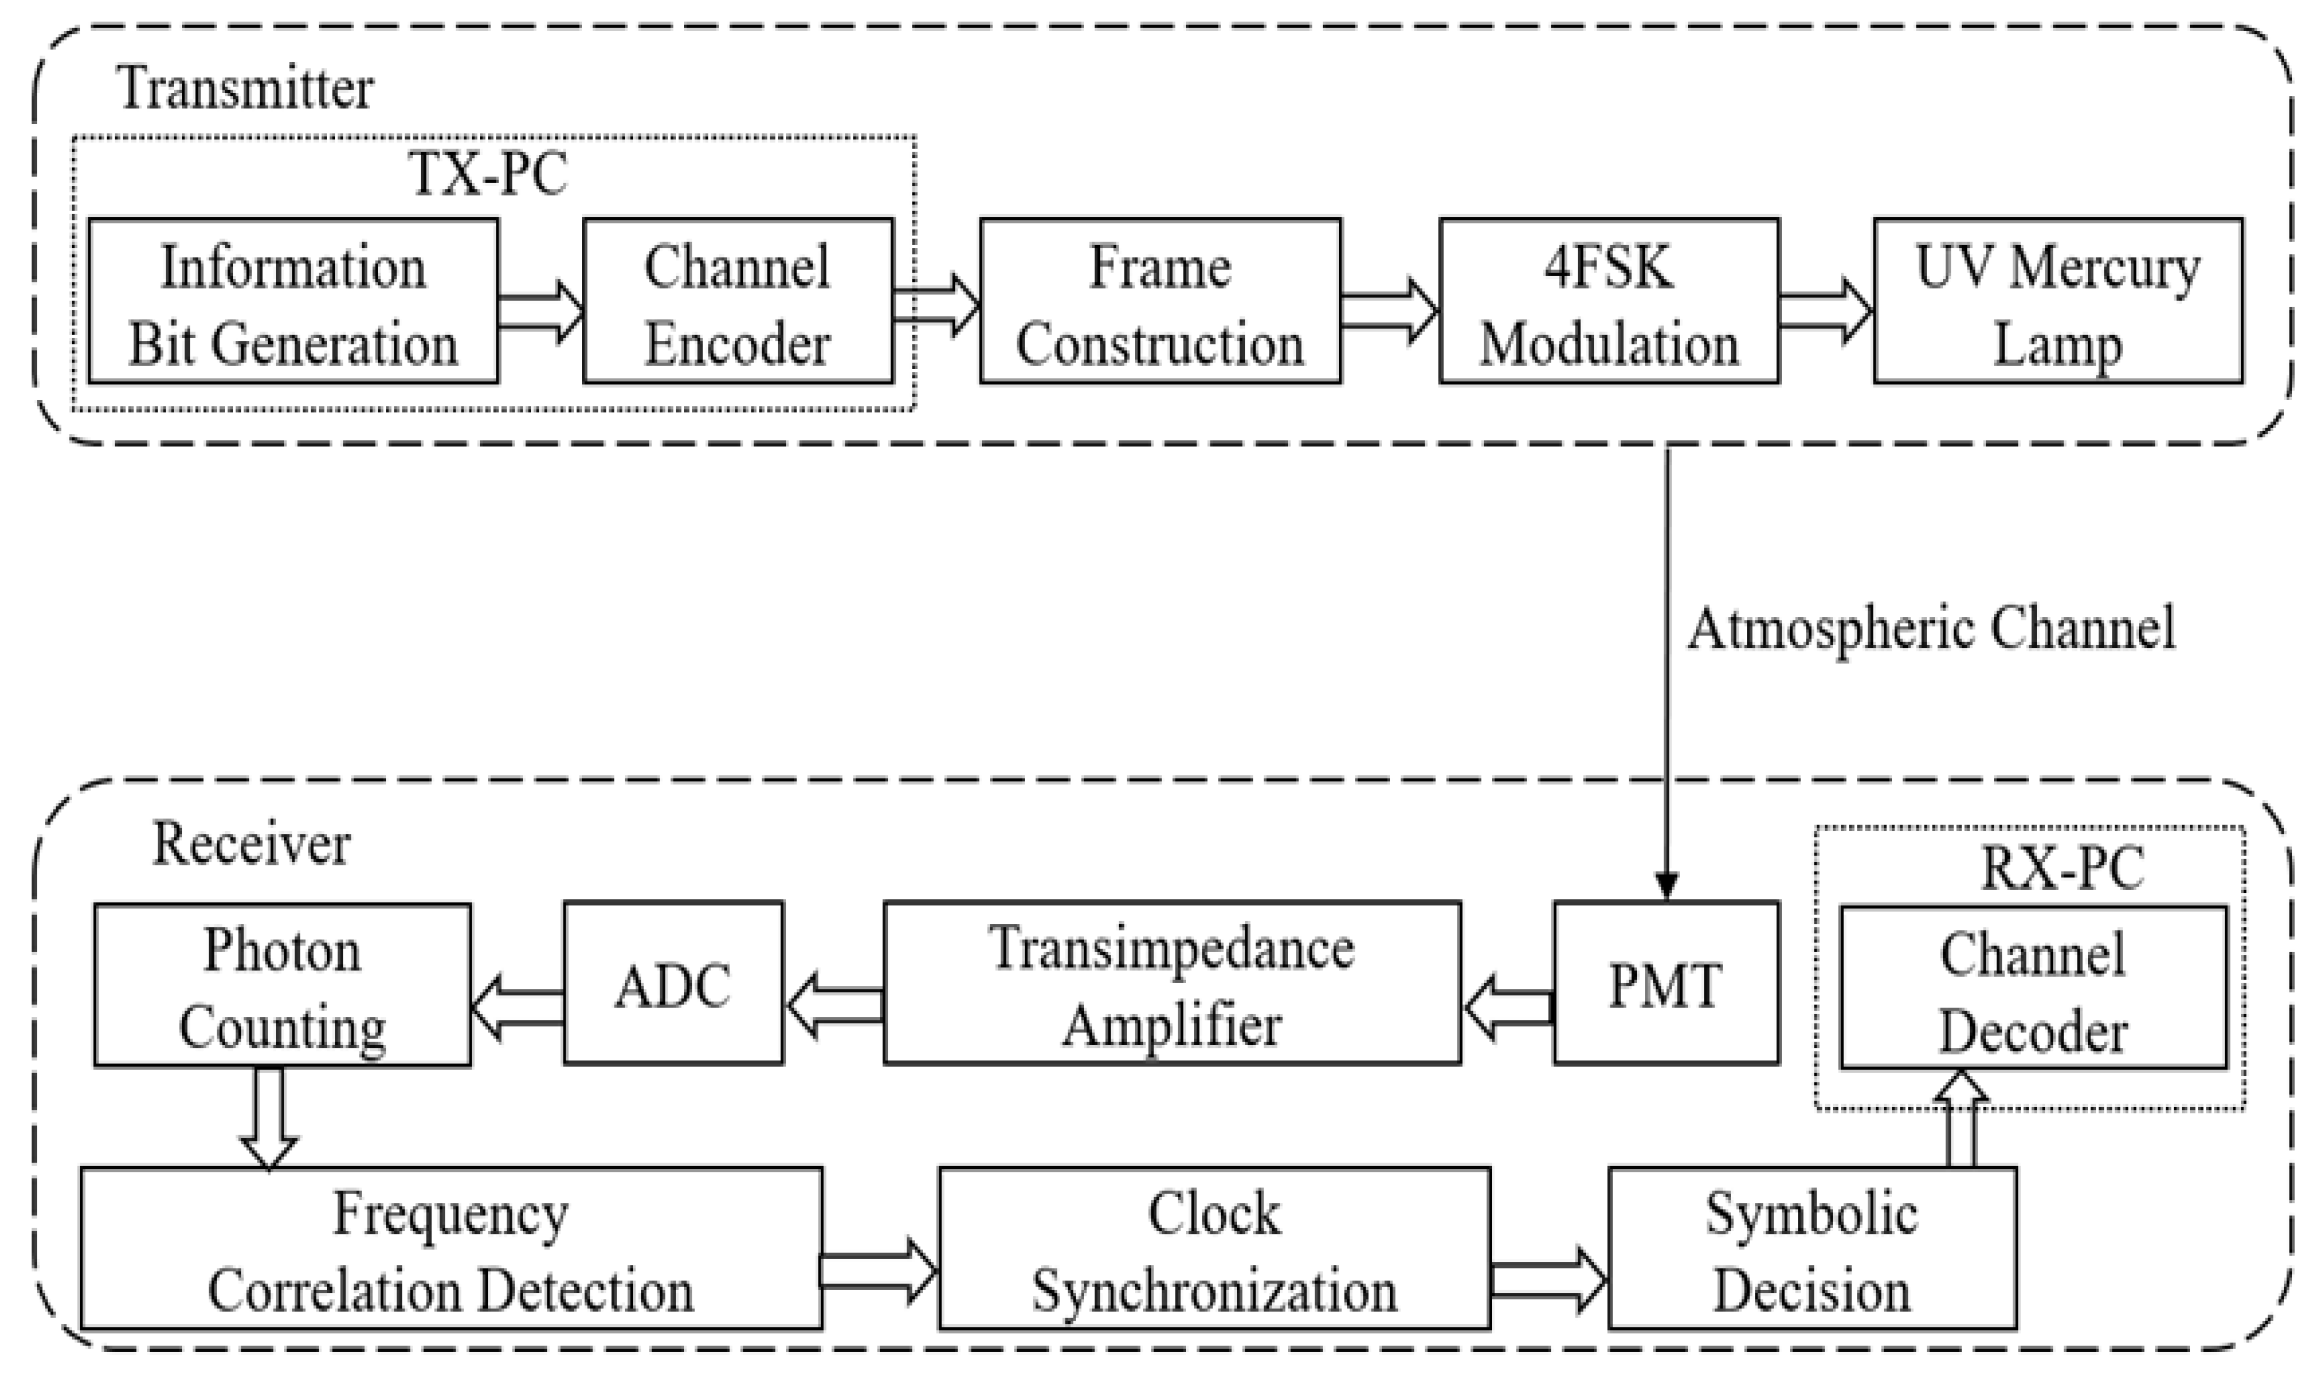
3.2. 4FSK Communication System Simulation Design
3.3. System Simulation and Experimentation
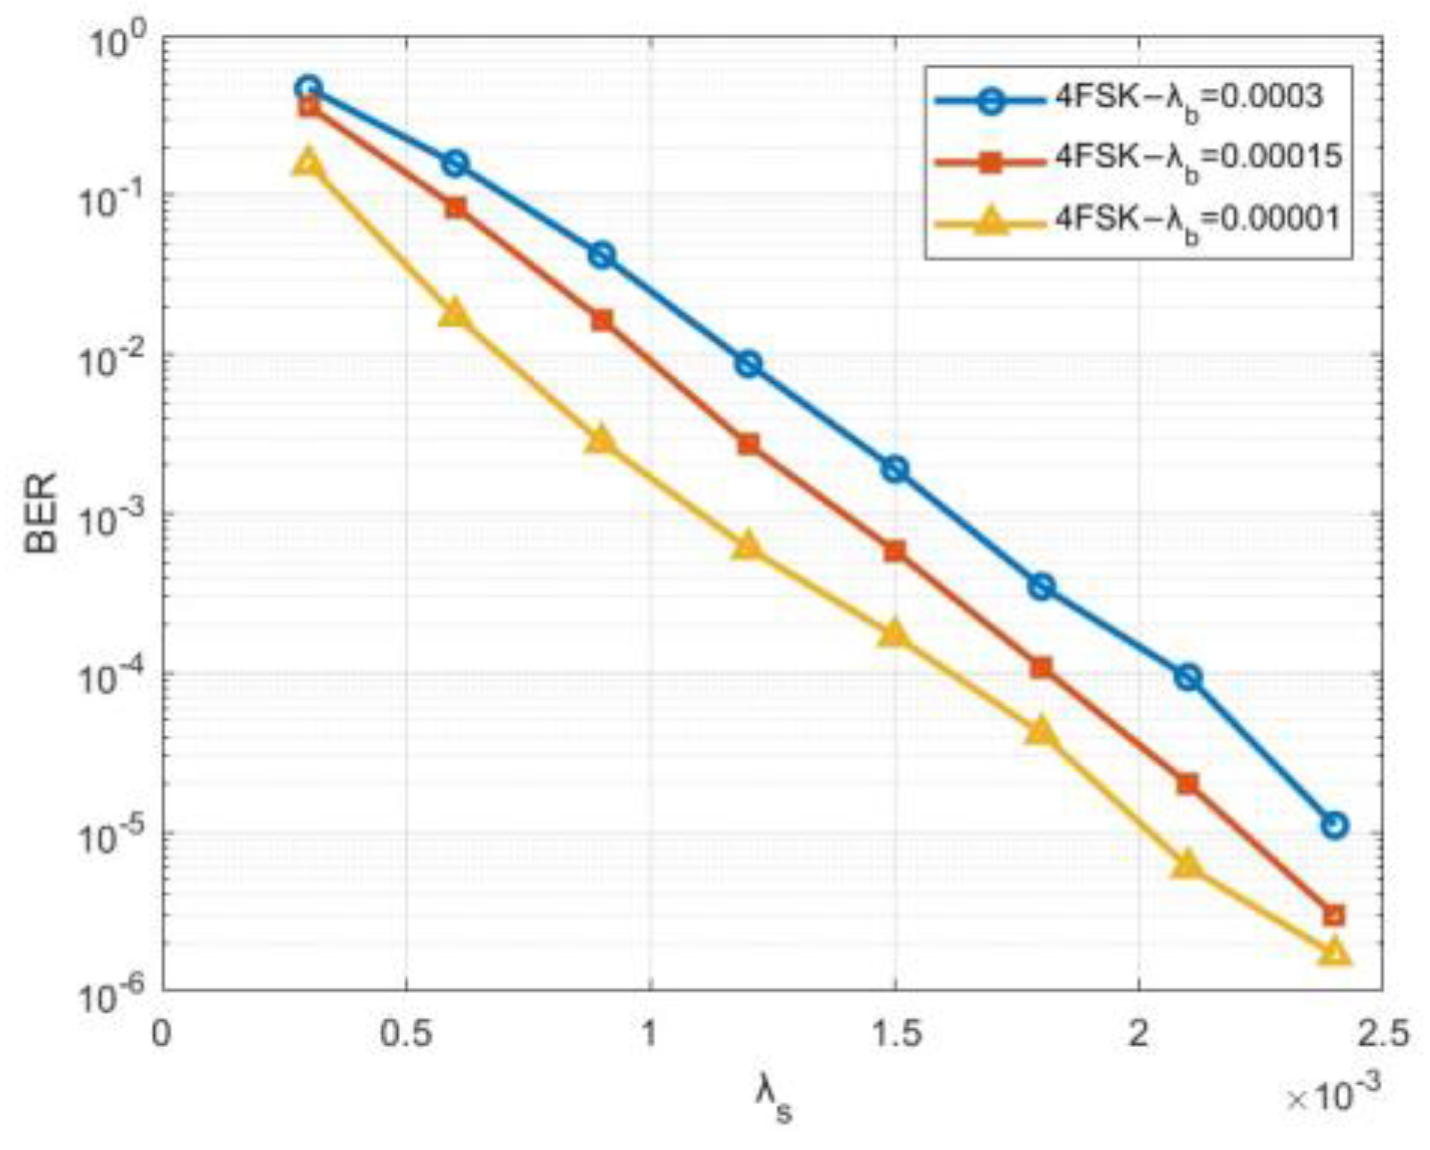
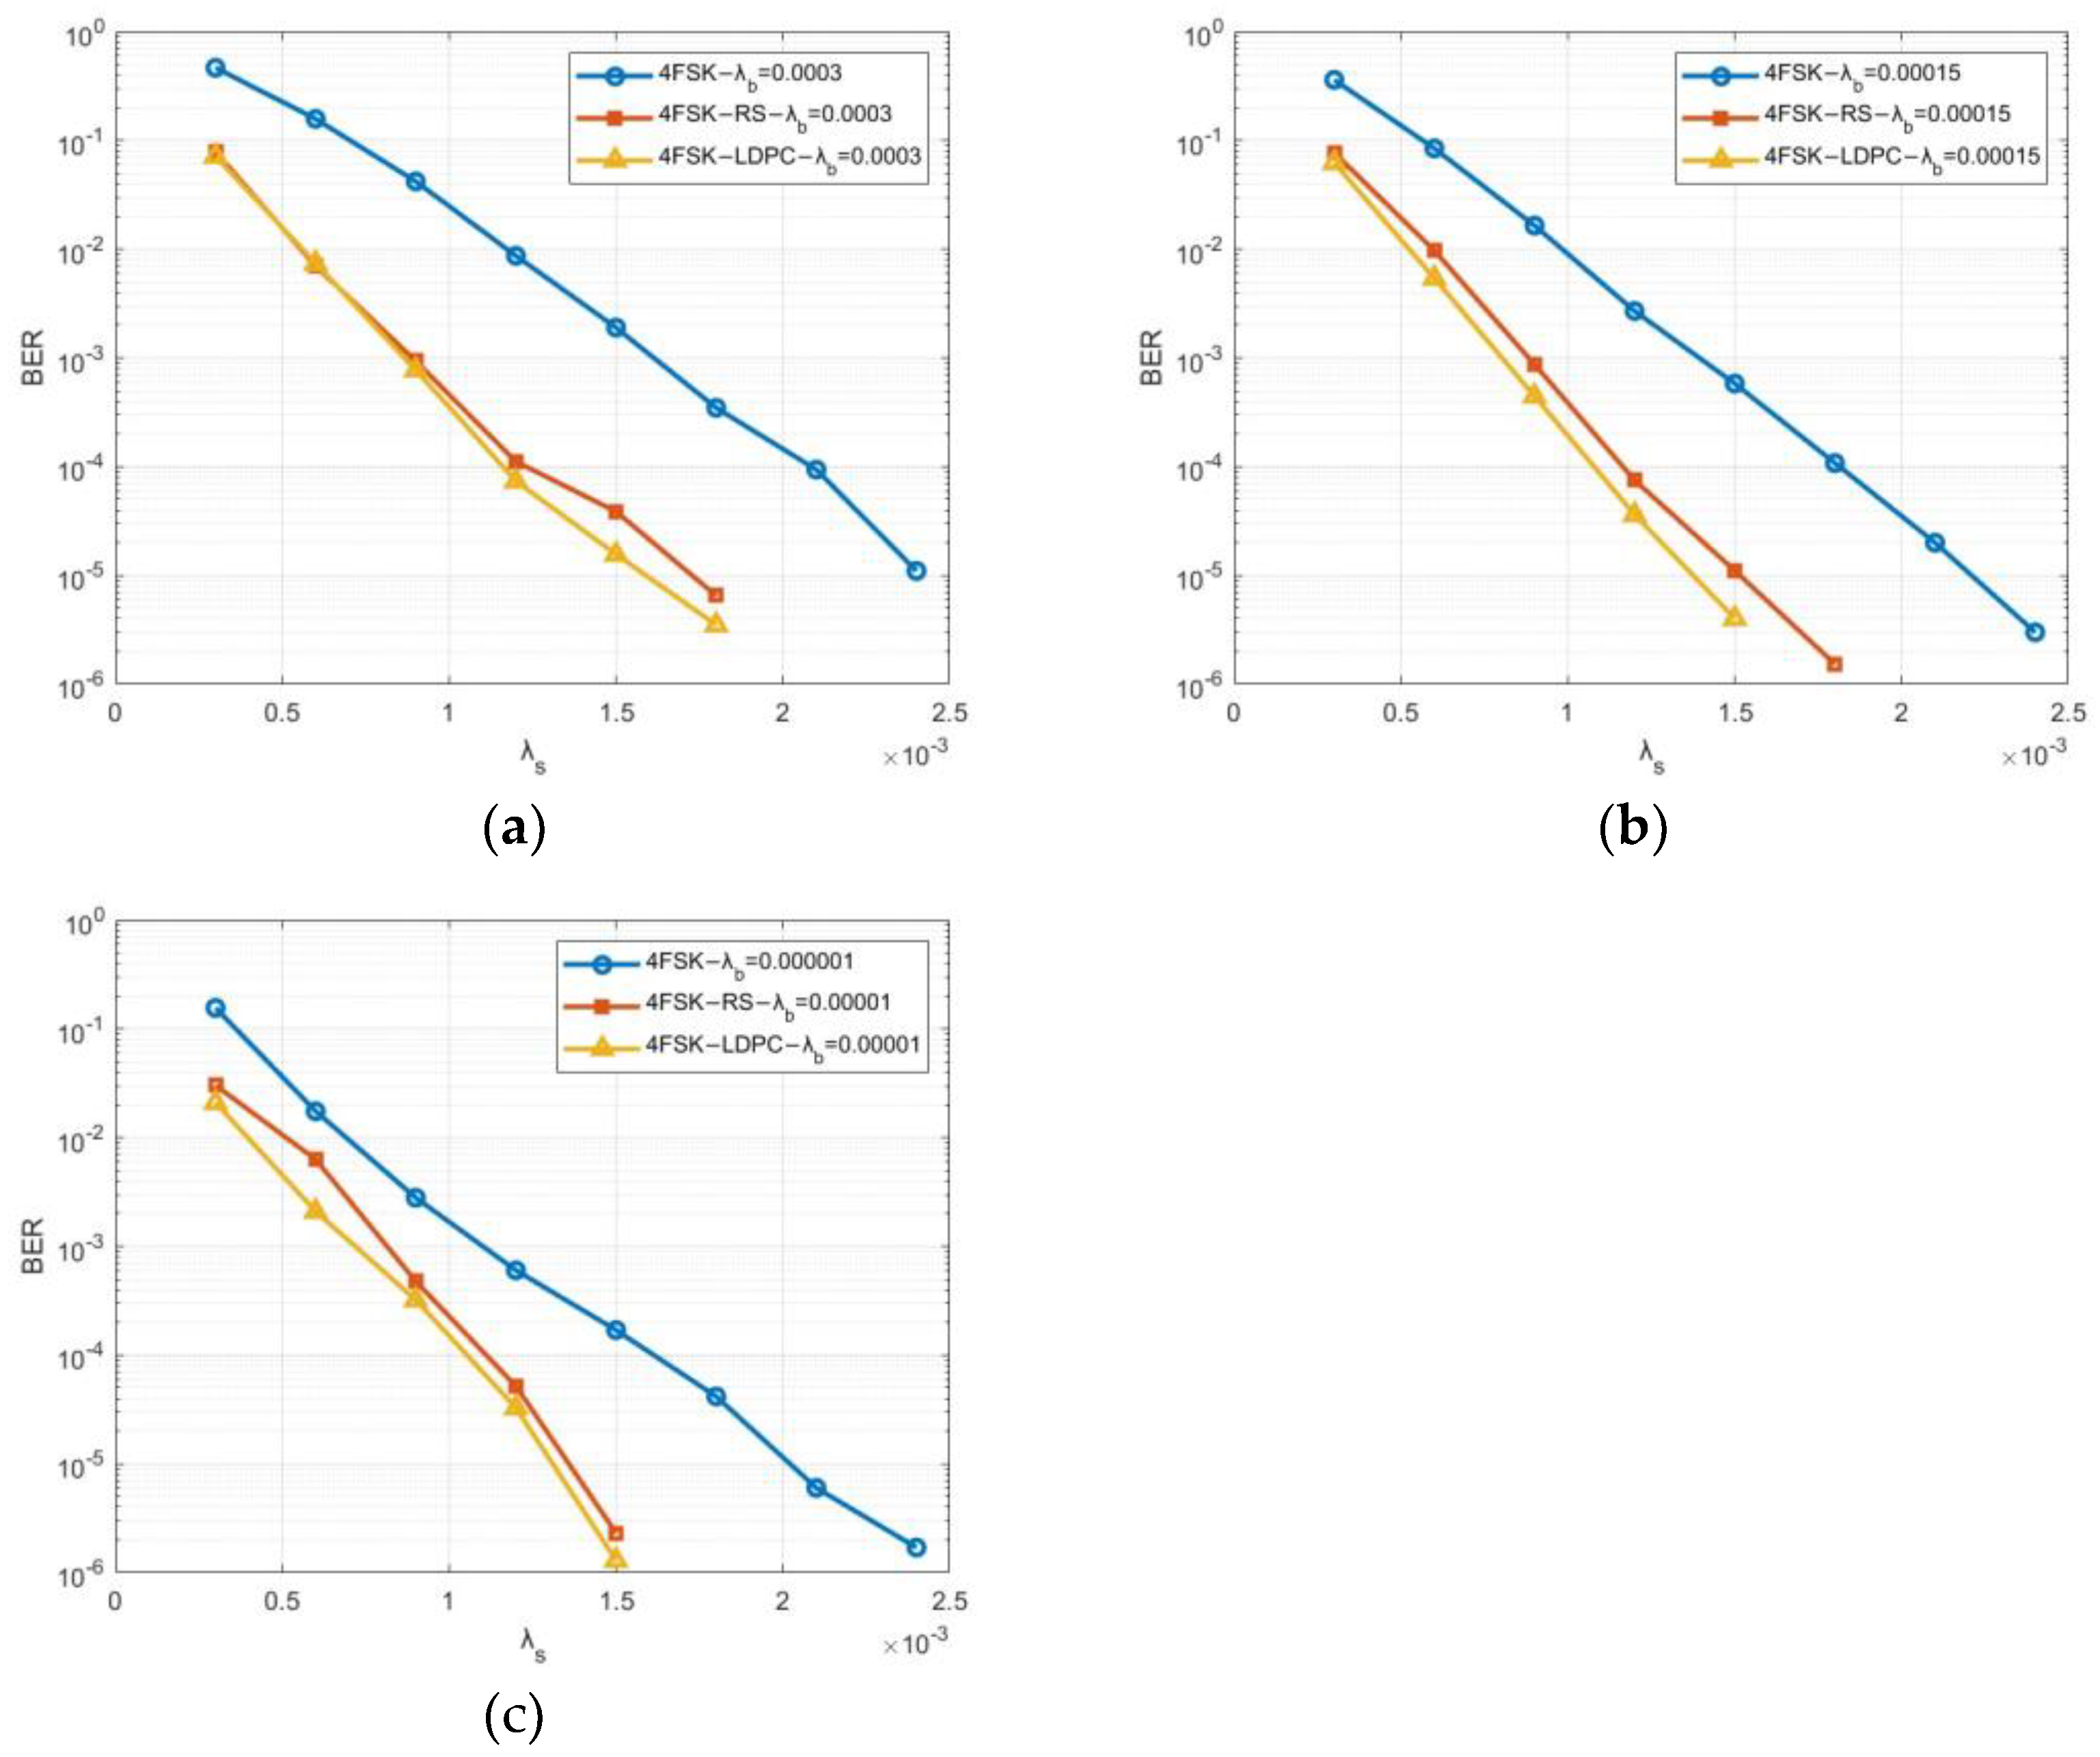
3.3.1. Communication System Simulation
3.3.2. Experimental Test
4. Conclusions
- Poisson modeling of photon statistical properties to optimize the decoding performance at low signal-to-noise ratio.
- Expected photon number normalization based on frame header to improve channel adaptability.
- Combination of code element level accumulation and maximum likelihood estimation to reduce BER.
- Compensation of 4FSK’s BER defects under low-light channels through the error correction capability of LDPC codes.
Author Contributions
Funding
Institutional Review Board Statement
Informed Consent Statement
Data Availability Statement
Conflicts of Interest
References
- Durand, G.; Lavigne, C.; Roblin, A. Ultraviolet light propagation under low visibility atmospheric conditions and its application to aircraft landing aid. Appl. Opt. 2006, 45, 9140–9150. [Google Scholar]
- Hamza, A.S.; Deogun, J.S.; Alexander, D.R. Classification Framework for Free Space Optical Communication Links and Systems. IEEE Commun. Surv. Tutor. 2019, 21, 1346–1382. [Google Scholar] [CrossRef]
- Ying, D.; Jing-Tao, F.; Shou-Feng, T.; Hui-Lin, J.; Ke-Yan, D. Approach of Distance Improving of Atmospheric UV Communication. Acta Photonica Sin. 2012, 41, 1047–1052. [Google Scholar] [CrossRef]
- Shaw, G.A.; Siegel, A.M.; Model, J. Extending the range and performance of non-line-of-sight ultraviolet communication links. In Proceedings of the Defense and Security Symposium, Orlando, FL, USA, 2 May 2006. [Google Scholar]
- Xu, Z.; Sadler, B.M. Ultraviolet Communications: Potential and State-Of-The-Art. Commun. Mag. IEEE 2008, 46, 67–73. [Google Scholar]
- Ding, H.; Chen, G.; Majumdar, A.; Xu, Z. A parametric single scattering channel model for non-line-of-sight ultraviolet communications. In Proceedings of the Proceedings of SPIE—The International Society for Optical Engineering, San Diego, CA, USA, 19 August 2008. [Google Scholar]
- Ding, H.; Chen, G.; Majumdar, A.K.; Sadler, B.M.; Xu, Z. Modeling of non-line-of-sight ultraviolet scattering channels for communication. IEEE J. Sel. Areas Commun. 2009, 27, 1535–1544. [Google Scholar] [CrossRef]
- Zuo, Y.; Xiao, H.; Wu, J.; Li, Y.; Lin, J. A single-scatter path loss model for non-line-of-sight ultraviolet channels. Opt. Express 2012, 20, 10359–10369. [Google Scholar] [CrossRef]
- Xu, Z.; Ding, H.; Sadler, B.M.; Chen, G. Analytical performance study of solar blind non-line-of-sight ultraviolet short-range communication links. Opt. Lett. 2008, 33, 1860–1862. [Google Scholar] [CrossRef] [PubMed]
- Chen, G.; Xu, Z.; Ding, H.; Sadler, B.M. Path loss modeling and performance trade-off study for short-range non-line-of-sight ultraviolet communications. Opt. Express 2009, 17, 3929–3940. [Google Scholar] [CrossRef]
- Xu, C.; Zhang, H. Monte-Carlo based modeling for ultraviolet non-line-of-sight communication channels with typical obstacles. In Proceedings of the International Conference on Wireless Communications & Signal Processing, 15–17 October 2015; pp. 1–5. [Google Scholar]
- Jiang, X.; Luo, P.; Zhang, M. Performance analysis of none-line-of-sight ultraviolet communications with multi-user interference. In Proceedings of the 2013 IEEE/CIC International Conference on Communications in China (ICCC), Xi’an, China, 12–14 August 2013; pp. 199–203. [Google Scholar]
- Borah, D.; Mareddy, V.; Voelz, D. Single and double scattering event analysis for ultraviolet communication channels. Opt. Express 2021, 29, 5327–5342. [Google Scholar] [CrossRef]
- Ardakani, M.H.; Heidarpour, A.R.; Uysal, M. Performance analysis of relay-assisted NLOS ultraviolet communications over turbulence channels. J. Opt. Commun. Netw. 2017, 9, 109–118. [Google Scholar] [CrossRef]
- Ali, R.; Mohamed, A.; El-Mahallawy, M.S.; Aly, M.H. Performance analysis of multiple NLOS UV communication cooperative relays over turbulent channels. Opt. Express 2018, 26, 19972–19985. [Google Scholar]
- Chen, G.; Liao, L.; Li, Z.; Drost, R.J.; Sadler, B.M. Experimental and simulated evaluation of long distance NLOS UV communication. In Proceedings of the IEEE 9th International Symposium on Communication Systems, Networks & Digital Sign, Manchester, UK, 16 October 2014; pp. 904–909. [Google Scholar]
- Liao, L.; Drost, R.J.; Li, Z.; Lang, T.; Sadler, B.M.; Chen, G. Long-distance non-line-of-sight ultraviolet communication channel analysis: Experimentation and modelling. IET Optoelectron 2015, 9, 223–231. [Google Scholar] [CrossRef]
- El-Shimy, M.A.; Hranilovic, S. Spatial-Diversity Imaging Receivers for Non-Line-of-Sight Solar-Blind UV Communications. J. Light. Technol. 2015, 33, 2246–2255. [Google Scholar] [CrossRef]
- Wang, G.; Wang, K.; Gong, C.; Zou, D.; Jiang, Z.; Xu, Z. A 1 Mbps Real-Time NLOS UV Scattering Communication System with Receiver Diversity over 1 km. IEEE Photonics J. 2018, 10, 1–13. [Google Scholar]
- Sun, X.; Kong, M.; Alkhazragi, O.; Shen, C.; Ooi, B.S. Non-line-of-sight methodology for high-speed wireless optical communication in highly turbid water. Opt. Commun. 2020, 461, 125264. [Google Scholar] [CrossRef]
- Wang, K.; Gong, C.; Zou, D.; Jin, X.; Xu, Z. Demonstration of a 400 kbps real-time non-line-of-sight laser-based ultraviolet communication system over 500 m. Chin. Opt. Lett. 2017, 15, 040602. [Google Scholar] [CrossRef]
- Li, Y.; Geng, T.-w.; Gao, S. Likelihood based synchronization algorithms in optical pulse position modulation systems with photon-counting receivers. Opt. Express 2022, 30, 31472–31485. [Google Scholar] [CrossRef]
- Long, F.; Tang, J.; Li, L.; Chen, J.; Gong, C.; Xu, Z. Adaptive Modulation and Coding with LDPC Codes and Retransmission for Ultraviolet Communication. IEEE Photonics J. 2024, 16, 3392669. [Google Scholar] [CrossRef]
- Tian, T.; Jones, C.R.; Villasenor, J.D.; Wesel, R.D. Selective Avoidance of Cycles in Irregular LDPC Code Construction. IEEE Trans. Inf. Theory 2004, 52, 1242–1247. [Google Scholar] [CrossRef]
- Bucholtz, A. Rayleigh-scattering calculations for the terrestrial atmosphere. Appl. Opt. 1995, 34, 2765–2773. [Google Scholar] [CrossRef]
- Zhao, Y.; Du, A.; Jiao, Y.; Kuang, L.; Chen, J.; Sun, N.; Liu, J. Investigation of Characteristics of Ultraviolet Light Pulse Weak Signal Communication System Based on Fourth-Order Frequency-Shift Keying Modulation. Photonics 2024, 11, 395. [Google Scholar] [CrossRef]


| Parameters | Values |
|---|---|
| UV light wavelength | 254 nm |
| Center wavelength of the optical filter | 261 nm |
| Power of UV light | 3 W |
| Bit Rate | 5 kbps |
| Receiver elevation angle (NLOS) | ≈45° |
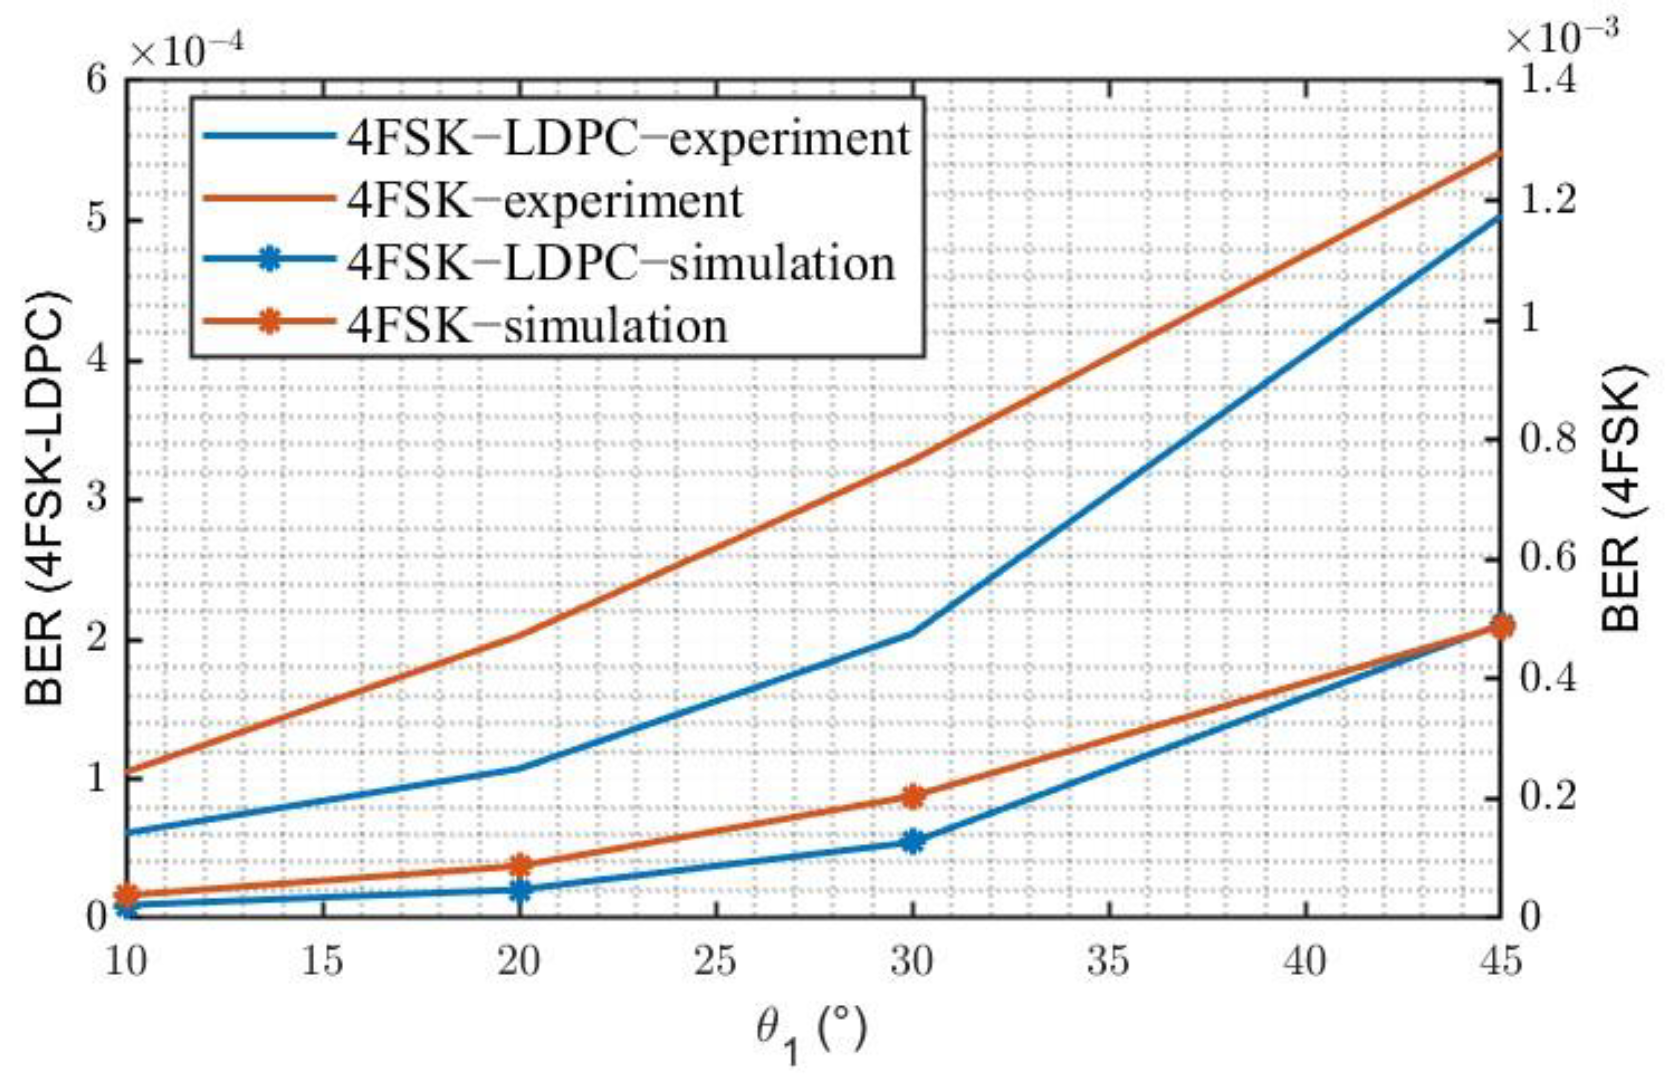
| Transmitter elevation angle (NLOS) | 10~45° |
| Transmission range (NLOS) | 60 m |
| Height of obstacle (NLOS) | 4~5 m |
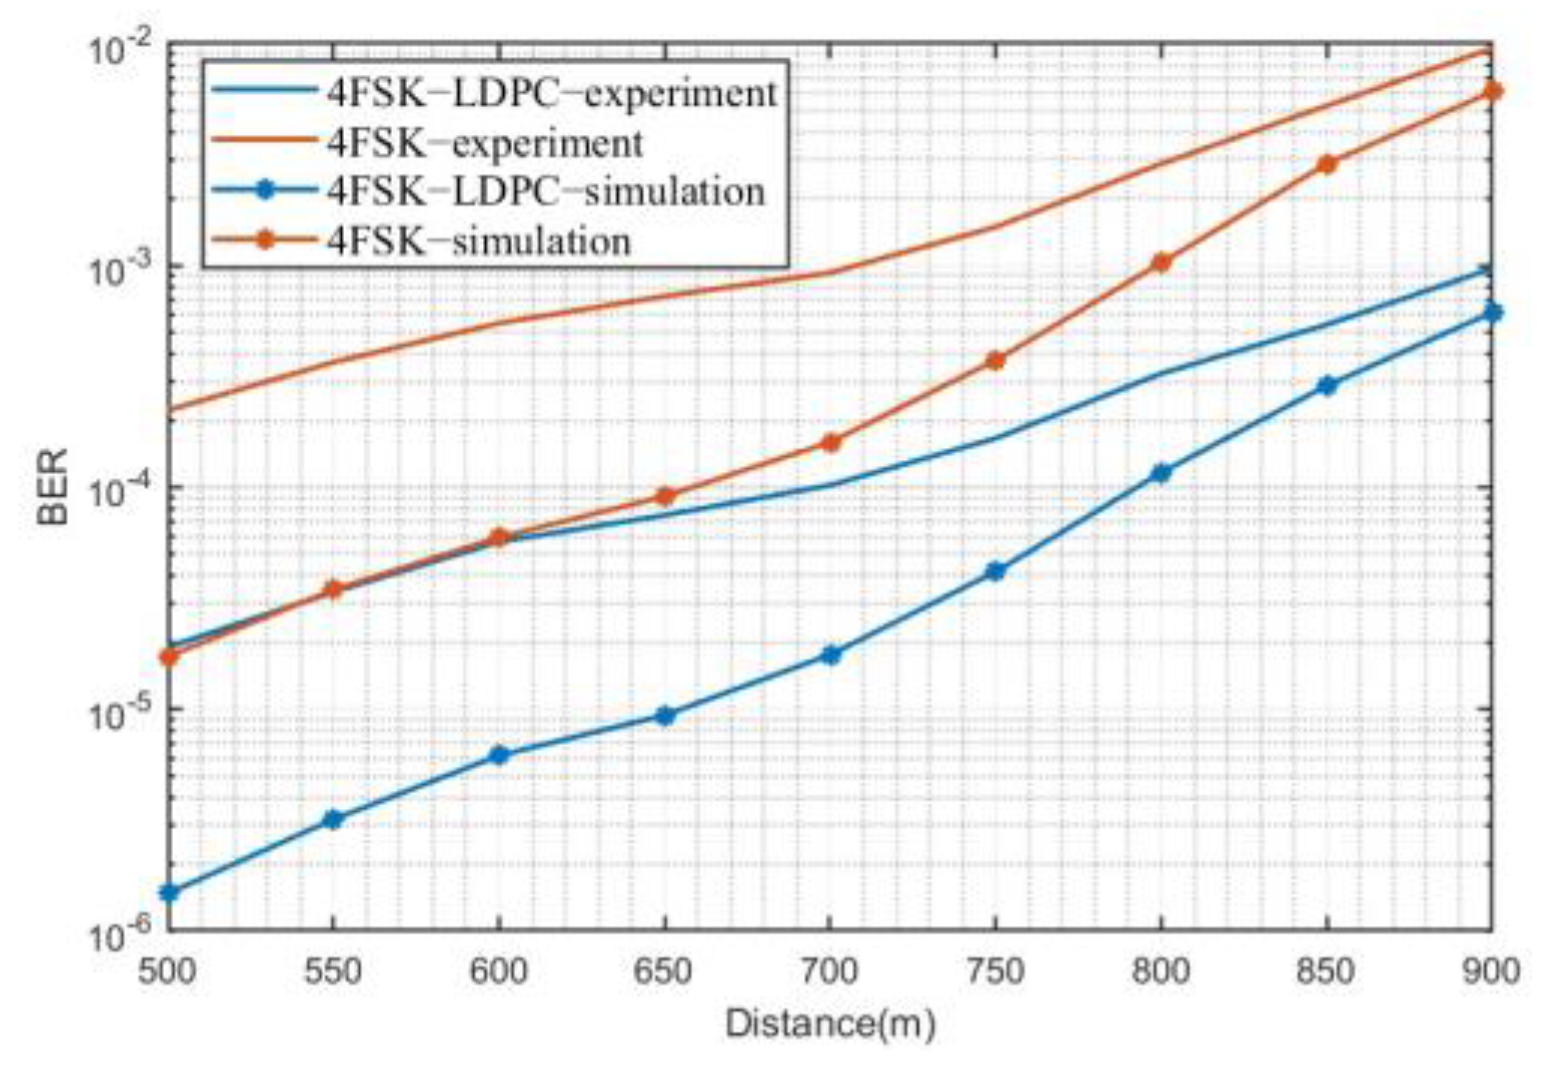
| Transmission range (LOS) | 500–900 m |
Disclaimer/Publisher’s Note: The statements, opinions and data contained in all publications are solely those of the individual author(s) and contributor(s) and not of MDPI and/or the editor(s). MDPI and/or the editor(s) disclaim responsibility for any injury to people or property resulting from any ideas, methods, instructions or products referred to in the content. |
© 2025 by the authors. Licensee MDPI, Basel, Switzerland. This article is an open access article distributed under the terms and conditions of the Creative Commons Attribution (CC BY) license (https://creativecommons.org/licenses/by/4.0/).
Share and Cite
Kuang, L.; Zhao, Y.; Li, K.; Wang, X.; Li, L.; Zhu, H.; Zhang, W.; Liu, J. Research on Maximum Likelihood Decoding Algorithm and Channel Characteristics Optimization for 4FSK Ultraviolet Communication System Based on Poisson Distribution. Photonics 2025, 12, 419. https://doi.org/10.3390/photonics12050419
Kuang L, Zhao Y, Li K, Wang X, Li L, Zhu H, Zhang W, Liu J. Research on Maximum Likelihood Decoding Algorithm and Channel Characteristics Optimization for 4FSK Ultraviolet Communication System Based on Poisson Distribution. Photonics. 2025; 12(5):419. https://doi.org/10.3390/photonics12050419
Chicago/Turabian StyleKuang, Li, Yingkai Zhao, Kangjian Li, Xingfa Wang, Linyi Li, Huishi Zhu, Weijie Zhang, and Jianguo Liu. 2025. "Research on Maximum Likelihood Decoding Algorithm and Channel Characteristics Optimization for 4FSK Ultraviolet Communication System Based on Poisson Distribution" Photonics 12, no. 5: 419. https://doi.org/10.3390/photonics12050419
APA StyleKuang, L., Zhao, Y., Li, K., Wang, X., Li, L., Zhu, H., Zhang, W., & Liu, J. (2025). Research on Maximum Likelihood Decoding Algorithm and Channel Characteristics Optimization for 4FSK Ultraviolet Communication System Based on Poisson Distribution. Photonics, 12(5), 419. https://doi.org/10.3390/photonics12050419