Article

Measurement of Coherence Time in Cold Atom-Generated Tunable Photon Wave Packets Using an Unbalanced Fiber Interferometer

1
School of Information and Communication Engineering, North University of China, Taiyuan 030051, China
2
The State Key Laboratory of Quantum Optics and Quantum Optics Devices, Institute of Opto-Electronics, Collaborative Innovation Center of Extreme Optics, Shanxi University, Taiyuan 030006, China
3
Shanxi Dazhong Electronic Information Industry Group Co., Ltd., Taiyuan 030024, China
*
Authors to whom correspondence should be addressed.
Photonics 2025, 12(5), 415; https://doi.org/10.3390/photonics12050415
Submission received: 24 March 2025 / Revised: 19 April 2025 / Accepted: 21 April 2025 / Published: 25 April 2025

Abstract

:
In the realm of quantum communication and photonic technologies, the extension of coherence time for photon wave packets is essential for improving system efficacy. This research introduces a methodology for measuring coherence time utilizing an unbalanced fiber interferometer, specifically designed for tunable pulse-width photon wave packets produced by cold atoms. By synchronously generating write pulses, signal light, and frequency-locking light from a single laser source, the study effectively mitigated frequency discrepancies that typically arise from the use of multiple light sources. The implementation of frequency-resolved photon counting under phase-locked conditions was accomplished through the application of polarization filtering and cascaded filtering techniques. The experimental results indicated that the periodicity of frequency shifts in interference fringe patterns diminishes as the differences in delay arm lengths increase, while fluctuations in fiber length and high-frequency laser jitter adversely affect interference visibility. Through an analysis of the correlation between delay and photon counts, the coherence time of the write laser was determined to be 2.56 µs, whereas the Stokes photons produced through interactions with cold atoms exhibited a reduced coherence time of 1.23 µs. The findings suggest that enhancements in laser bandwidth compression and fiber phase stability could further prolong the coherence time of photon wave packets generated by cold atoms, thereby providing valuable technical support for high-fidelity quantum information processing.

1. Introduction

The generation of nonclassical photon pairs exhibiting correlated temporal properties is crucial for a wide array of applications, spanning from fundamental research to quantum communication and metrology. Research in this field has encompassed experiments on two-photon interference (TPI) utilizing quantum light sources, including photon pairs sourced from atomic ensembles [1,2], optical fibers [3], nanophotonic devices [4], and free-space environments [5]. Quantum optical investigations leveraging atom–photon interactions during spontaneous four-wave mixing processes to produce narrowband photon pairs from atomic ensembles [6,7,8,9,10,11] constitute a significant quantum resource with extensive applicability in quantum communication [12], quantum storage [13,14], entanglement swapping [15,16], quantum computing [17], and quantum relay technologies [18].
For an effective photon–atom quantum interface, it is imperative that the bandwidth of the photons is less than the natural linewidth of the corresponding atomic transition [19]. To achieve photons that are sufficiently narrow and possess extended coherence times, various experimental schemes have been proposed. For instance, experiments aimed at measuring the photon number states of narrowband single photons generated by a cold atomic ensemble through balanced homodyne detection have recorded coherence times of several hundred nanoseconds [10]. The coherence time for narrowband photon pairs produced by laser-cooled atomic ensembles has been measured at 1.72 µs [19], while a tunable single-photon source established between two remote ion traps has demonstrated coherence times ranging from 70 ns to 1.6 µs [20]. In addition to identical quantum nodes, the rapid advancement of hybrid quantum network technology has underscored the importance of the bandwidth of interface photons from these quantum systems in successfully establishing long-distance connections among quantum nodes with varying bandwidths. The preparation of tunable wave packet photons [20,21,22] has been instrumental in facilitating interfacing within hybrid networks. The coherence times of the photons can be evaluated using an arbitrary delay-based temporal post-selection method, which is employed to conduct two-photon interference measurements on continuous-wave coherent light sources [23]. Furthermore, two-photon interference measurements can be performed on phase-randomized weak coherent pulses utilizing time-resolved coincidence detection techniques [24]. Prior studies have demonstrated that the maximum visibility of Hong-Ou-Mandel (HOM)-type interference observed with both coherent and thermal light sources is fundamentally limited to 0.5 due to the Poissonian photon statistics of classical light fields [23,24,25]. Notably, advancements in interferometric stabilization systems have achieved remarkable phase stability and high raw visibility in single-photon interference experiments using weak coherent light [26]. However, these studies predominantly focus on weak coherent light sources, while the measurement of coherence properties for cold atom-generated photon wave packets using unbalanced fiber interferometers remains experimentally unexplored.
In this study, we illustrate that the bandwidth of Stokes photons is intricately linked to the bandwidth of the write laser. The generation of a Stokes photon necessitates the storage of a spin-wave excitation within the atomic ensemble, thereby establishing a concurrent photon–atom entanglement. To examine the coherence characteristics of the wave packet-tunable Stokes photons, these photons are introduced into an unbalanced interferometer. By employing optical fibers with appropriate delay lengths, the wave packet photons from the early time bin E (originating from the longer arm) and the late time bin L (from the shorter arm) can be interfered, resulting in the formation of interference fringes. In the scenario of a locked interferometer, the peaks and troughs of the interference fringes can be quantified by varying the phase difference, which facilitates the calculation of interference visibility. The coherence times of the photons can be directly inferred from the reduction in maximum visibility observed in the interferogram as the wave packet length of the photons increases [24].
The generation of photon pairs through light–atom interactions plays a crucial role in the functioning of quantum repeaters [27] and the establishment of consensus within quantum networks [28]. Particularly, asynchronous two-photon interference occurring on the microsecond timescale, which can be realized through coherent states, presents significant opportunities for advancements in quantum communication [29]. The extended coherence times associated with these photon pairs are essential for executing high-fidelity quantum operations, which are fundamental to the field of quantum computing. This study introduces technical enhancements that can improve quantum gate operations and facilitate the integration of diverse quantum systems within hybrid networks [30]. Such advancements are critical for the practical realization of quantum computers and the expansion of quantum technologies. Furthermore, our research contributes to the fields of quantum sensing and metrology by enabling more accurate measurements. Photons exhibiting longer coherence times are particularly important for applications that require high precision, such as interferometric measurements and the synchronization of atomic clocks. The technical developments presented herein not only enhance existing quantum systems but also pave the way for future innovations, including the implementation of ultra-stable lasers and sophisticated detection systems.

2. Theoretical Basis and Methods

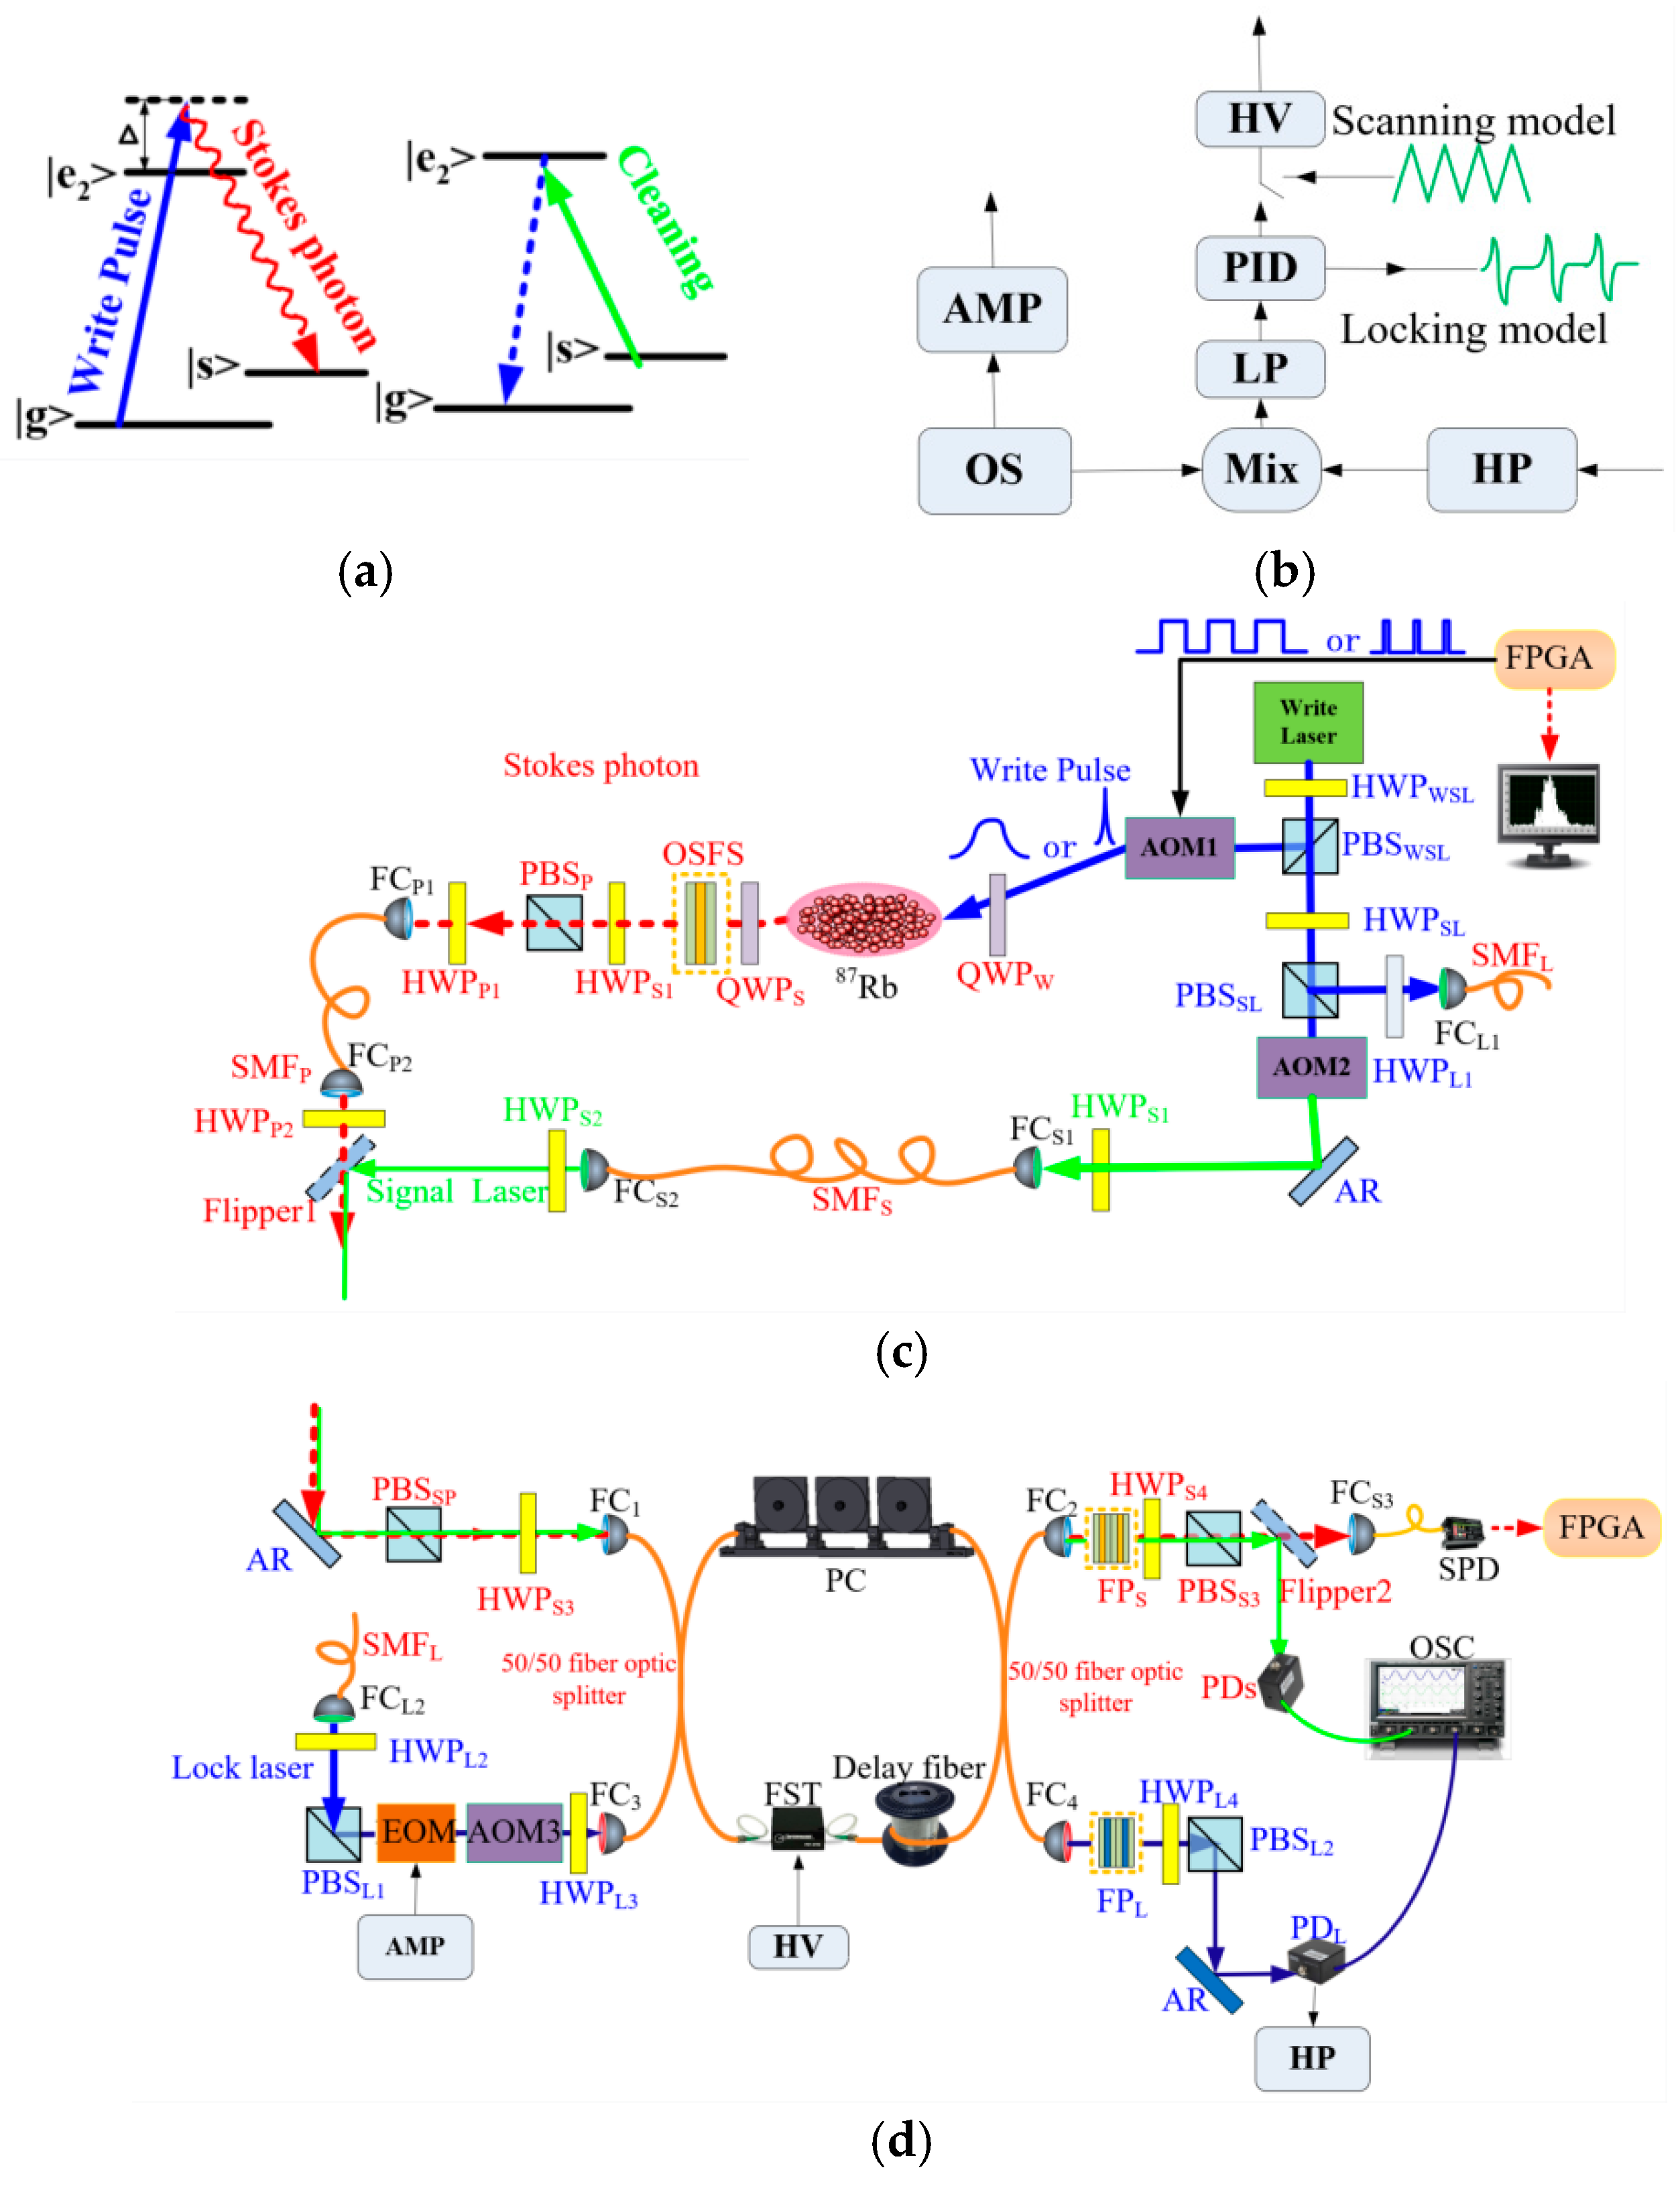
2.1. Cold Atom-Generated Tunable Photon Wave Packets

The atomic ensemble utilized in this study consists of a cloud of cold 87Rb atoms, which serves as the medium for the generation of wave packet-tunable photons, and the relevant atomic levels are as shown in Figure 1, where g = 5 2 S 1 / 2 , F = 1 , e 2 = 5 2 P 1 / 2 , F = 2 , and s = 5 2 S 1 / 2 , F = 2 . The 87Rb atomic ensemble is prepared to be in the ground state g at the initial time. The write laser beam is sourced from a DLC Pro laser (Toptica Photonics AG, Gräfelfing, Germany), which is stabilized on the saturation absorption line D1. Write pulses of varying durations are produced through the on–off timing control of the Acousto-Optic Modulator (AOM1), managed by a Field-Programmable Gate Array (FPGA), as illustrated in Figure 1. The write laser beam is subsequently directed through a Half-Wave Plate HWPWSL and the Polarizing Beam Splitter PBSWSL that has been configured for V polarization, which is ∆ = 20 MHz blue-detuned to the g e 2 transition. The write pulse also induces the spontaneous Raman transition g s via e 2 , thereby generating the Stokes photons and storing a spin wave simultaneously. In the Stokes detection channel, we transform the Stokes photons into horizontally (H)-polarized photons using Quarter-Wave Plates (QWPs). The Stokes photons are collected at an angle of approximately 1° relative to the write pulse beam direction. Next, the Stokes photons pass through an Optical Spectrum Filter Set (OSFS), which consists of three Fabry–Perot etalons that filter out noise photons from other frequency bands. After detection, a cleaning pulse is s e 2 transition with a duration of 200 ns, which is applied to pump the atoms into the initial level g . Each write pulse is excited with a specific probability to produce a photon that is distributed in any 10 ns detection sampling window within the wave packet duration; since the excitation rate is at the order of thousands, this necessitates the execution of 106 or more operational cycles. By employing an FPGA to control the duration of the write pulse interactions with the atomic ensemble, we can generate tunable Stokes photons through stimulated Raman scattering (SRS). As illustrated in Figure 1a, the energy level structure indicates that the bandwidth of the Stokes photons is closely associated with the bandwidths of both the write laser and the atomic transitions. Considering that the atomic bandwidth is in the MHz range while the laser bandwidth is in the hundreds of the kHz range, it can be inferred that the bandwidth of the generated photons is more closely aligned with that of the write laser pulse.

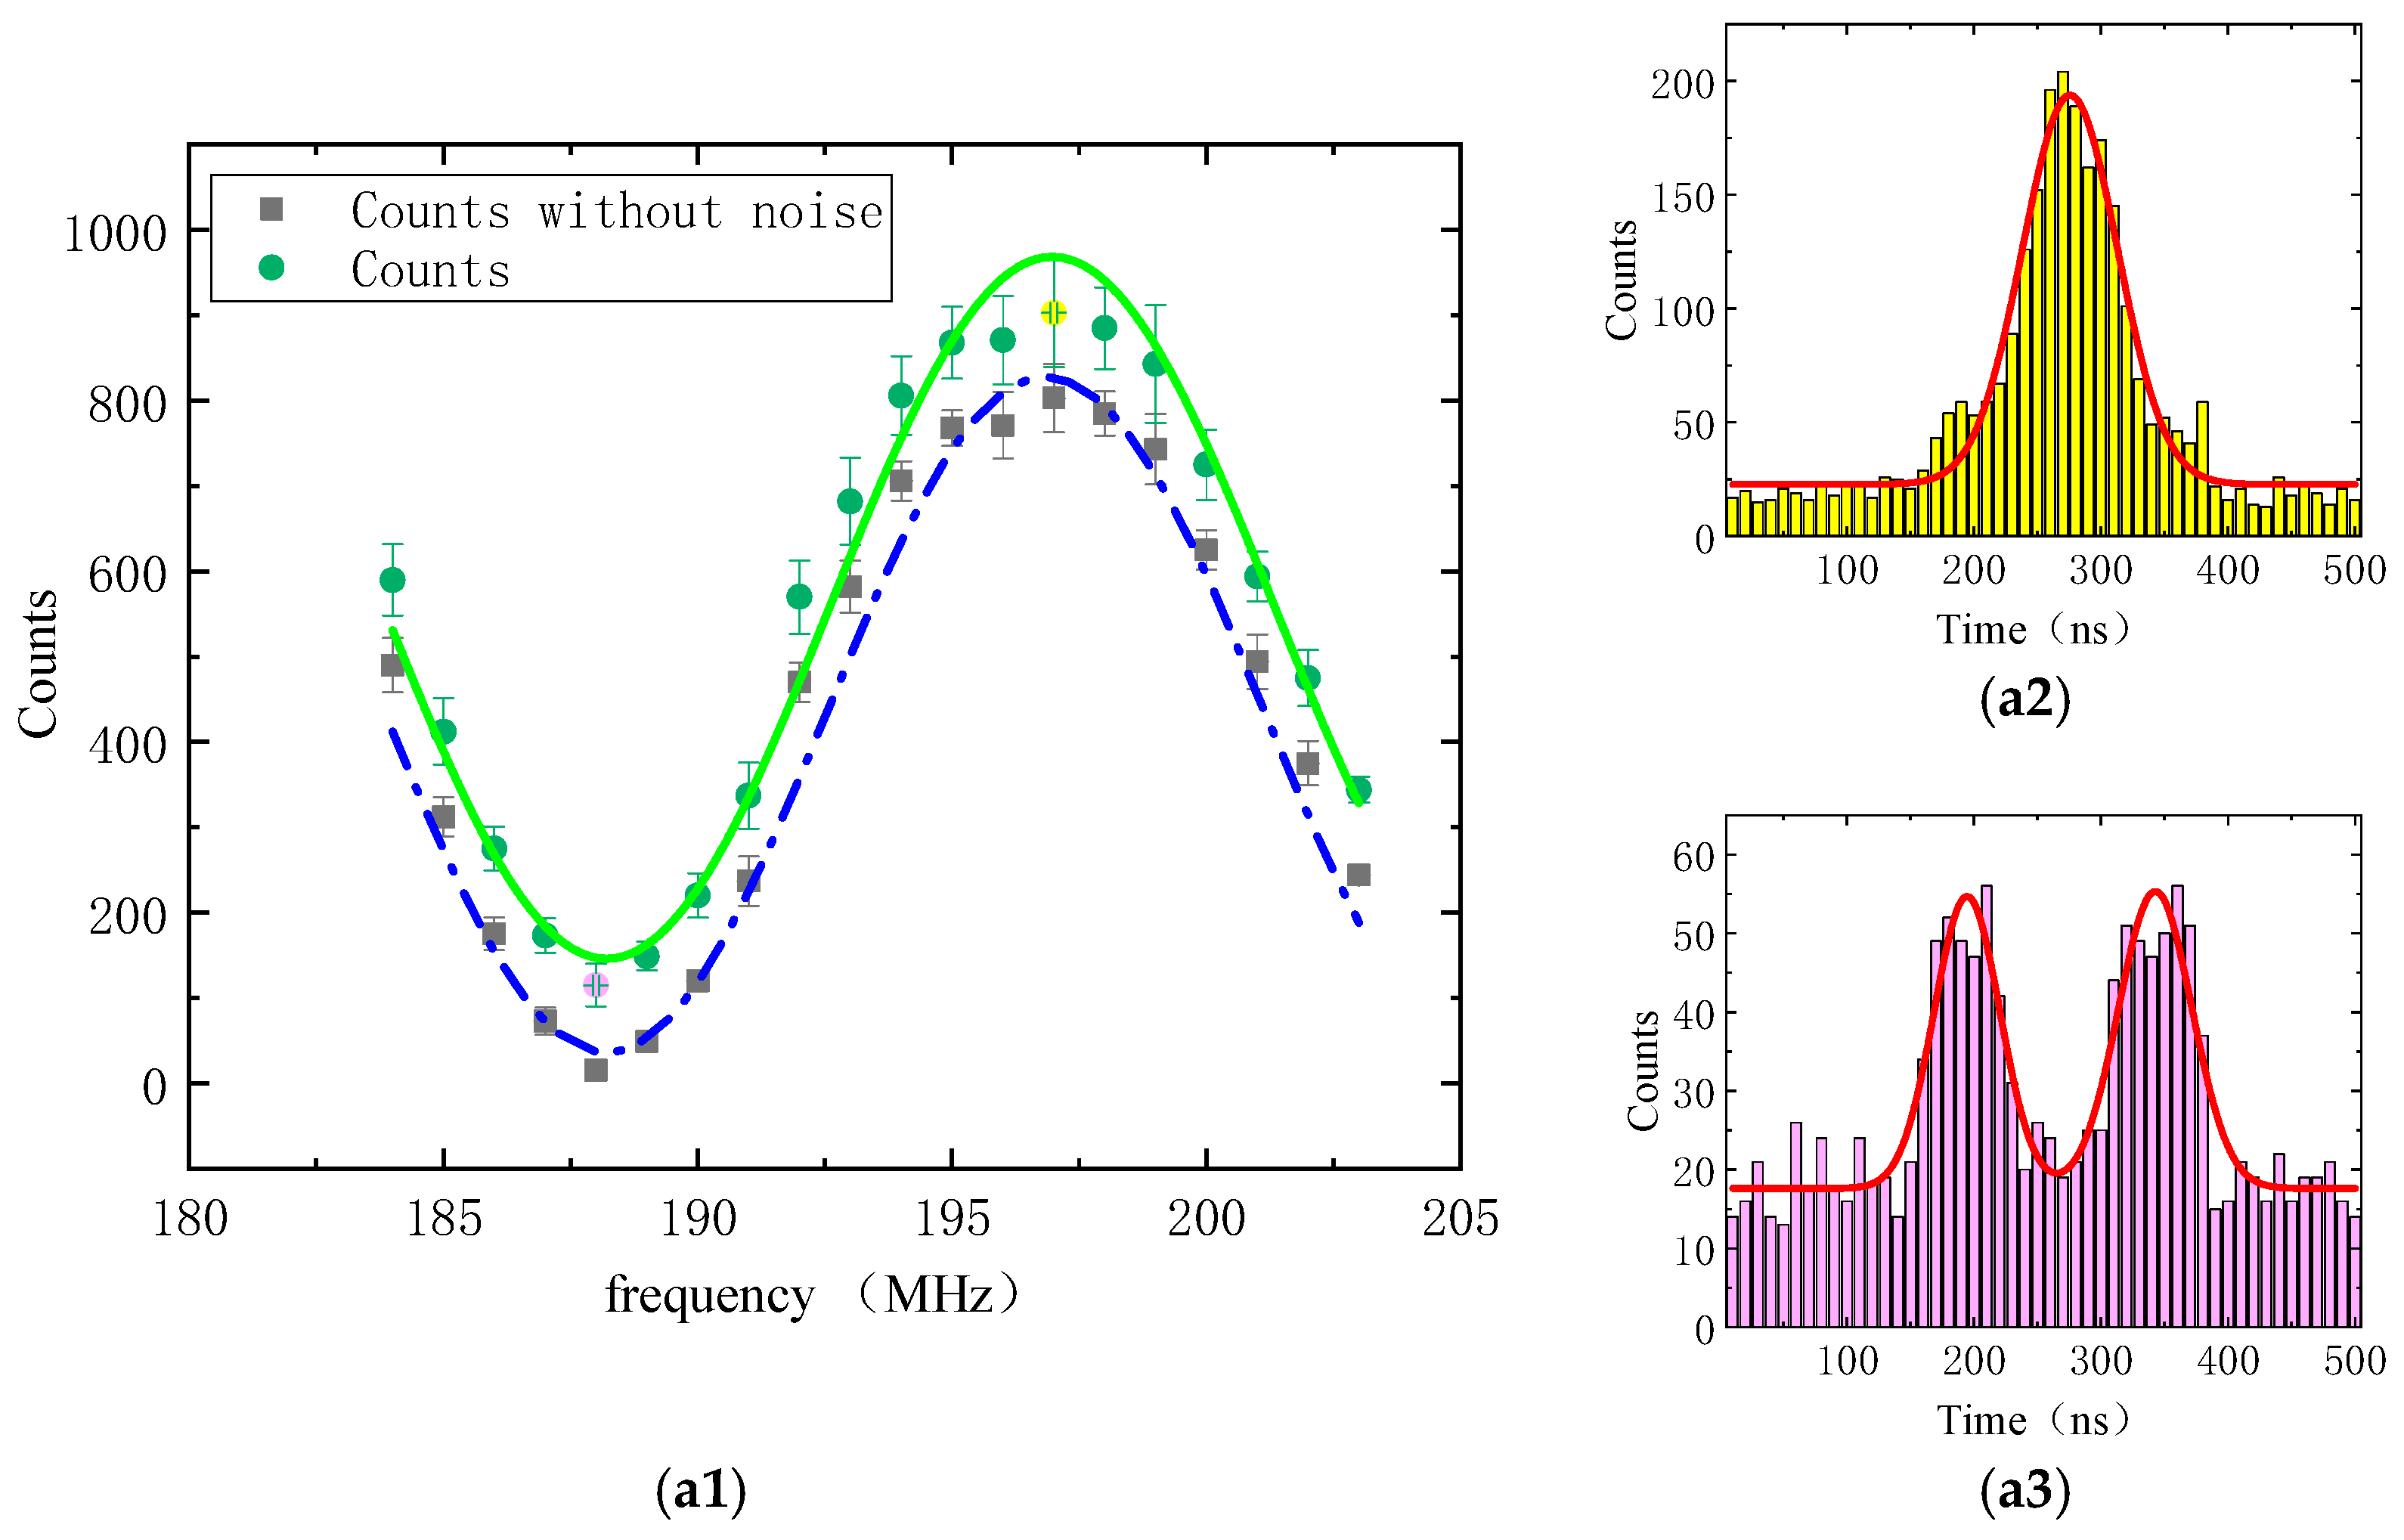
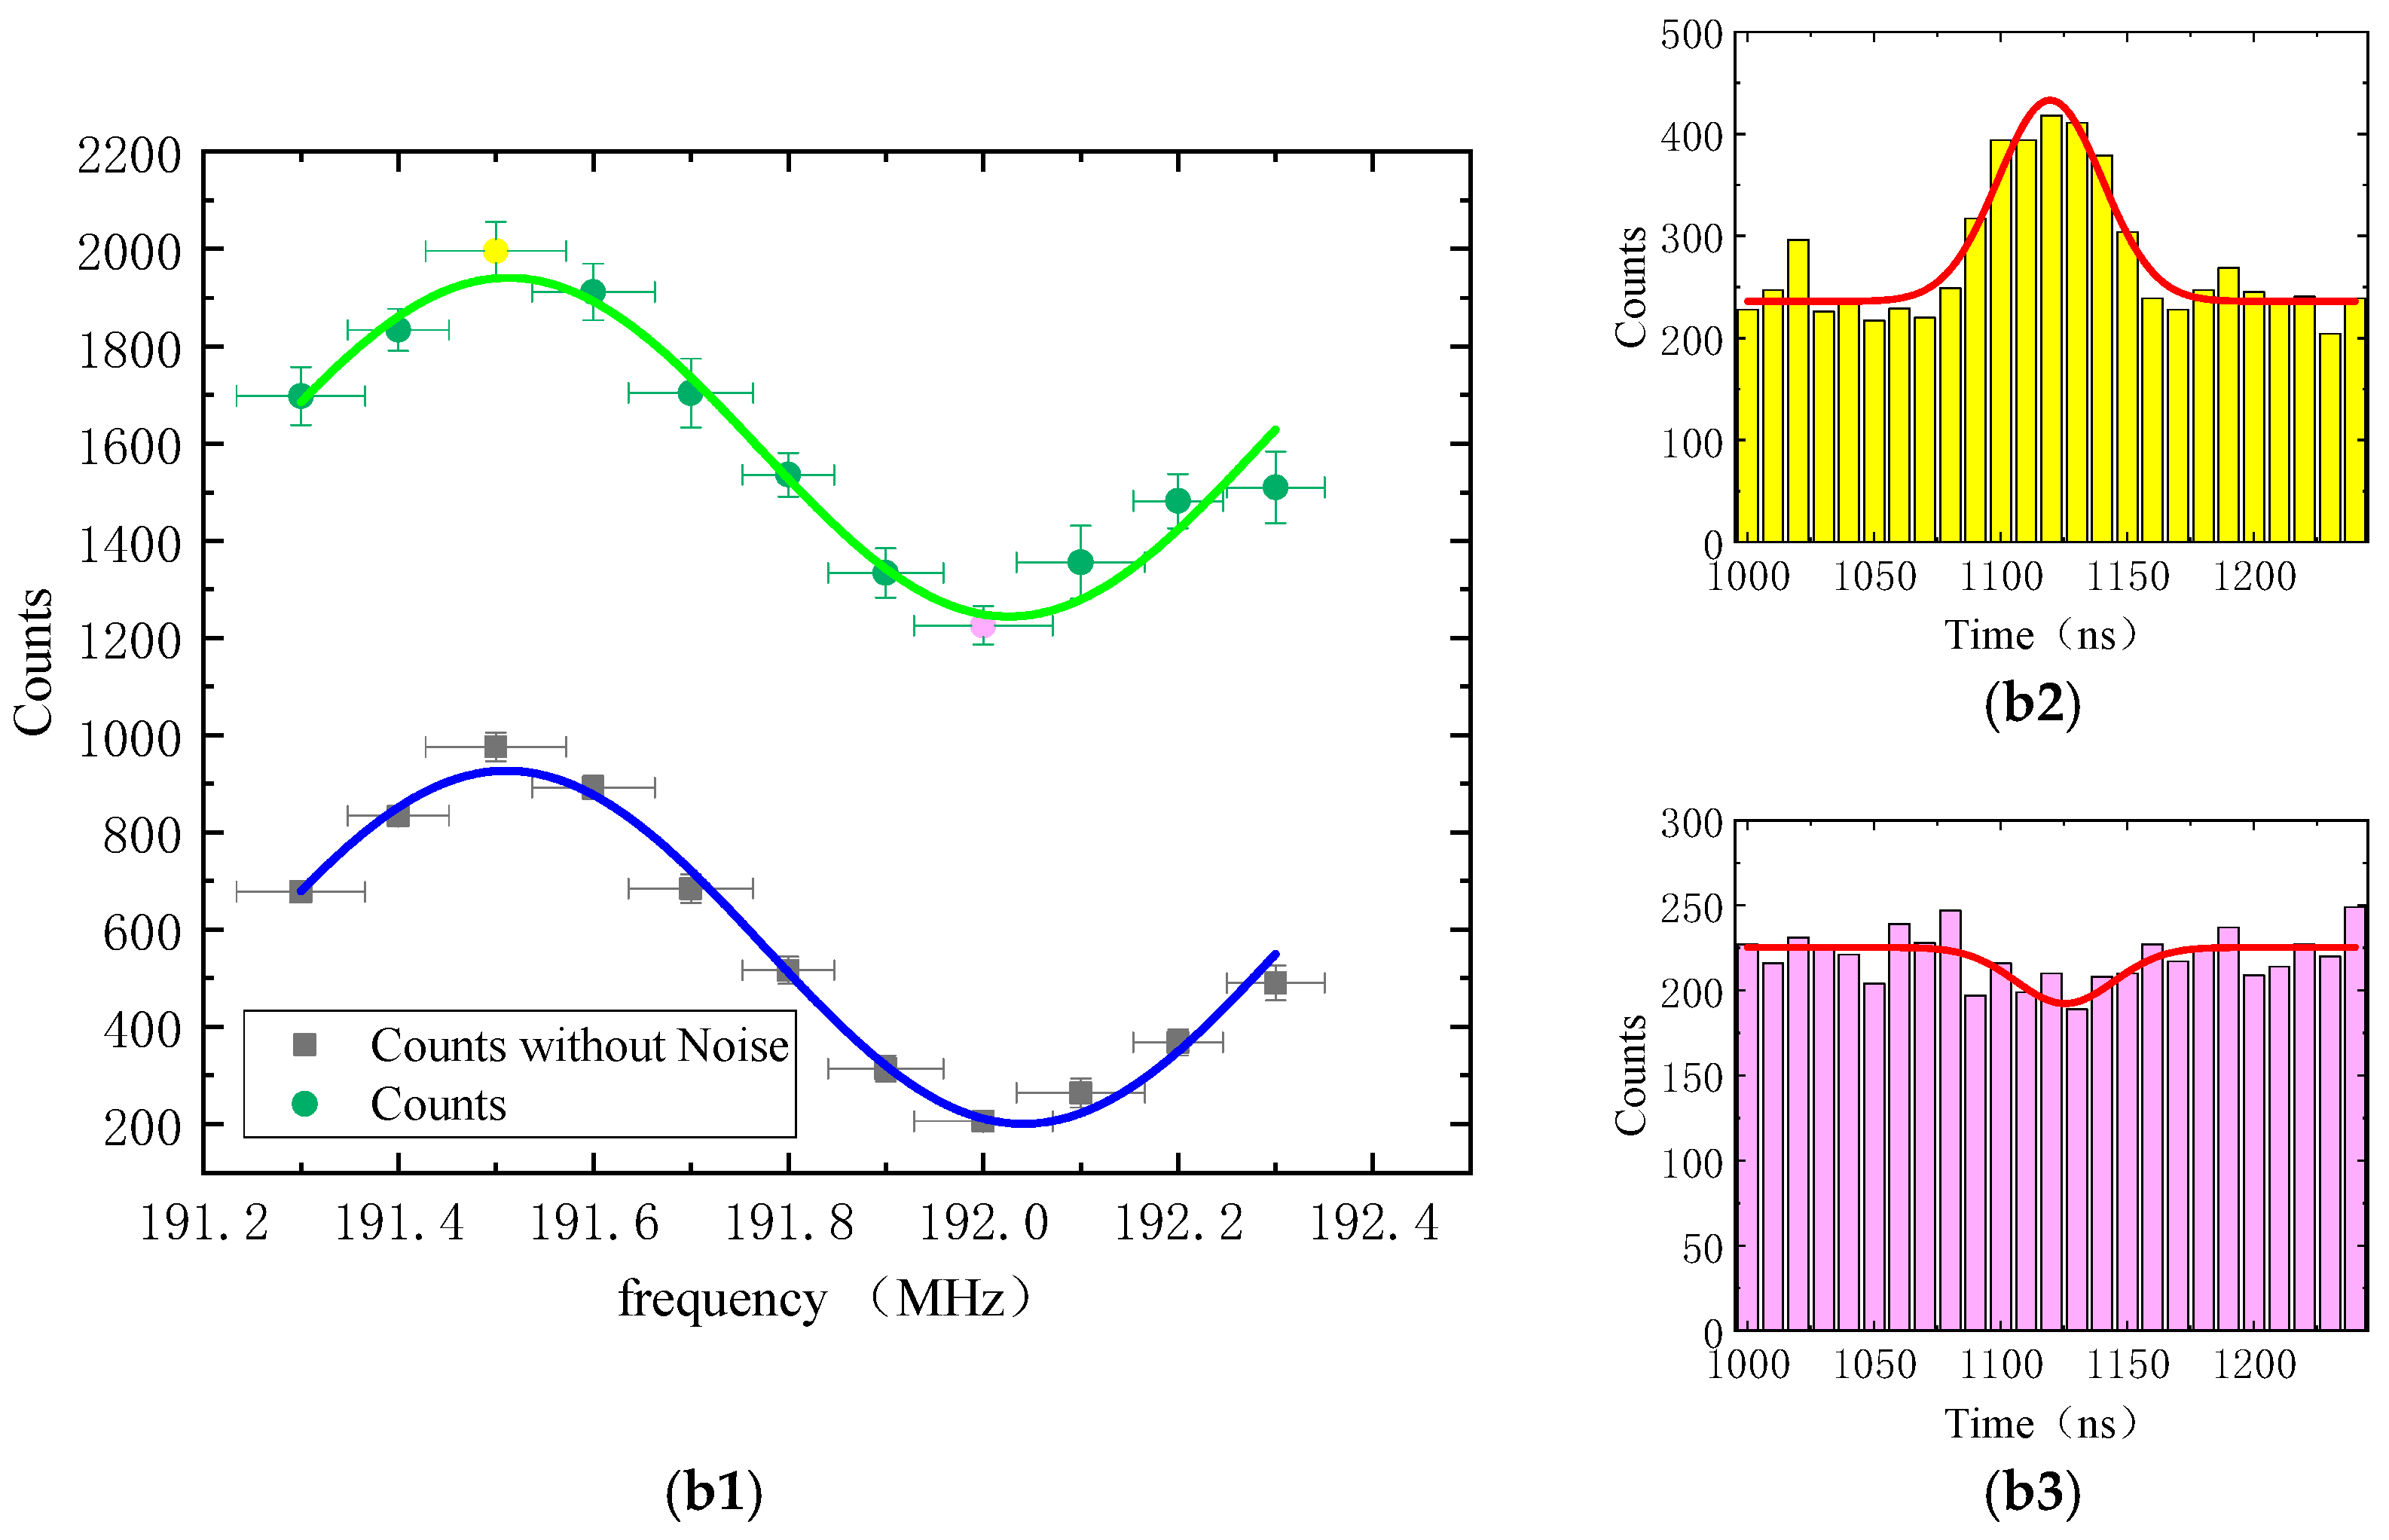
2.2. Theoretical Basis of the Unbalanced Fiber Interferometer

The bandwidth of the write laser is primarily influenced by phase noise. Coherence serves as a metric for quantifying the intensity of noise present in the laser light field. To assess the coherence characteristics of the photons, we developed an unbalanced fiber interferometer, as illustrated in Figure 1. This interferometer is capable of transforming the phase noise of the laser light into intensity noise through the incorporation of a delay fiber. The write laser, which is stabilized to the saturation absorption line of rubidium atoms, exhibits stochastic phase noise. Consequently, the determination of the visibility of the write laser necessitates the computation of an average value over the entire duration of observation. In order to evaluate the coherence of the Stokes photons, it is essential to count the photons within the designated interference region.
The single-longitudinal-mode laser beam is a monochromatic optical field that has a stable amplitude and a perturbed phase. The light field can be expressed as E t = E 0 · exp i ω 0 t + Δ φ t , where E 0 is the amplitude of the light field, ω 0 is the central frequency of the light field, and the random phase disturbance Δ φ t = k L t , where k is the wave vector and L t is the optical path length due to the time-dependent temperature. The output light field of the short arm L 1 t of the interferometer is E 1 exp i ω 0 t + k 0 L 1 t and the output light field of the long arm L 2 t is E 2 exp i ω 0 + Δ ω t + k 0 + Δ k L 2 t , where Δ ω is the central frequency difference and Δ k is the wave vector difference between L 1 t and L 2 t . The intensities of the interference light corresponding to the output signal and the locking light in an unbalanced optical fiber interferometer can be mathematically represented as follows:
I S t = E 1 2 + E 2 2 + 2 E 1 E 2 cos ( φ S t ) I L t = E 1 2 + E 2 2 + 2 E 1 E 2 cos ( φ L t ) ,
where φ S t = Δ ω t + k S Δ L t + Δ k L 2 t ( φ L t = Δ ω t + k L Δ L t + Δ k L 2 t ) represents the phase difference of the signal (locking) light, Δ L t = L 2 t L 1 t is the length difference of the interferometer arm, k S = ω S v k L = ω L v is the wave vector of the signal (locking) light, ω S ω L is the frequency of the signal (locking) light, and v is the velocity of light within the fiber. The instantaneous value of the intensity I S t I L t is given by a specific phase fluctuation φ S t φ L t . The phase difference between the signal and locking lasers can be expressed as Δ φ t = φ S t φ L t = k S k L Δ L t = Δ k Δ L t , and this difference can be controlled using the change in the delay fiber length Δ L t produced by the Fiber Stretcher and the frequency difference Δ k between the locking and signal lasers. Due to the introduction of minor random fluctuations δ Δ L t in fiber length caused by temperature variations and mechanical vibrations, as well as alterations in the wave vector δ Δ k t resulting from laser frequency drift, the equation representing the phase difference in the signal (locking) light can be reformulated as follows:
φ S t = Δ ω t + k S Δ L t + δ Δ L t + Δ k + δ Δ k t L 2 t φ L t = Δ ω t + k L Δ L t + δ Δ L t + Δ k + δ Δ k t L 2 t ,
and the phase difference between the signal and locking lasers can then be rewritten as follows:
Δ φ t = Δ k + δ Δ k t Δ L + δ Δ L t ,
The instantaneous intensity value, denoted as I, at the output of the interferometer can be characterized by a particular phase fluctuation φ . The probability distribution associated with this phase fluctuation φ can be articulated as [31], P φ = e φ 2 / 2 δ 2 / δ 2 π where δ signifies the standard deviation of the Gaussian distribution. In order to obtain the characteristic phase noise, it is imperative to average the intensity I. The visibility and the distribution of the phase noise can be represented as follows:
V t = e δ 2 t 2 2 ,
where δ = 2 π υ , υ is the bandwidth, and t is the delay time caused by the difference in the interferometer arm length Δ L t .

2.3. Experimental Setup

Figure 1 depicts the methodology and experimental configuration employed to assess the coherence times of Stokes photons produced by atoms in a tunable delay fiber interferometer, with the observed results spanning from nanoseconds to microseconds. The cold atom cloud exhibits a longitudinal extent of one centimeter and is maintained at a temperature of 100 μK.
The configuration of the interferometer arms employs two 50/50 fiber beam splitters that are connected through flange joints. The short arm features a three-loop Polarization Controller (PC) designed for the precise management of polarization, while the long arm is equipped with a Fiber Stretcher (FST) and a tunable delay line. In the scanning mode, a 100 Hz triangular wave signal is applied to the high-voltage amplifier (HV) to drive the 12 m long Fiber Stretcher, resulting in the modulation of the signal period in accordance with the voltage at a rate of 0.14 µm/V. This modulation produces an interference pattern, as depicted in Figure 2.
In the locking mode, the interference signal detected by the Photodetector (PDL) is combined with the demodulated signal from the oscillator (OS) after undergoing high-pass filtering to eliminate high-frequency components. Subsequently, the signal is low-pass filtered and fed into a proportional-integral-derivative (PID) controller to generate an error signal. This error signal is then relayed back to the fiber stretching device via the high-voltage amplifier, facilitating phase locking of the interferometer. By manipulating the phase of the electro-optic modulator (EOM) through the optical switch (OS), the length of the long arm φ L t can be adjusted to be an even multiple of π. This configuration ensures that the locking laser maintains a consistent lock at its optimal position, as depicted in Figure 3. The phase difference Δ φ t between the signal laser and the locking laser can be precisely adjusted by altering the frequency of the locking laser via AOM3. When Δ φ t = 2 n π the phase difference is in-phase, denoted as n being a positive integer, and the write signal corresponding to constructive interference achieves its maximum amplitude. Conversely, when the phase difference is in antiphase, the signal associated with destructive interference reaches its minimum amplitude.
By manipulating the phase of the electro-optic modulator (EOM) through the optical switch (OS), the phase of the long arm φ L t can be adjusted to be an even multiple of π. This configuration ensures that the locking laser remains consistently stabilized at its optimal position, as depicted in Figure 3. The phase difference Δ φ t between the signal laser and the locking laser can be precisely adjusted by altering the frequency of the locking laser via AOM3. When Δ φ t = 2 n π , the phase difference is in-phase, denoted as n being a positive integer, and the write signal corresponding to constructive interference achieves its maximum amplitude I m a x t . Conversely, when Δ φ t = 2 n + 1 π , the phase difference is in antiphase, and the signal associated with destructive interference reaches its minimum amplitude I m i n t . Therefore, the visibility of the interference can be determined using the following equation [24]:
V t = I m a x t I m i n t I m a x t + I m i n t ,
Flipper1 and Flipper2, as illustrated in Figure 1, are capable of redirecting the signal laser to facilitate the entry of Stokes photons into the interferometer via Fiber Collimator FC1, while also regulating the interferometer’s length through the locking laser beam introduced from FC3. Subsequently, the Stokes photons are directed to the Single-Photon Detector (SPD), which transmits the resultant signal. As demonstrated in Figure 4, by modulating the frequency of the locking laser through AOM3, the phase difference between the Stokes photons and the locking laser exhibits periodic variations. This modulation leads to corresponding periodic fluctuations in the photon counts observed within the interference region.
In Figure 4, the longitudinal error is due to the fact that photon excitation is a probability event, and there will be differences in the number of excited photons measured in multiple experiments. The vertical error bars arise from statistical fluctuations inherent to the photon excitation process, with photon count variations across repeated trials corresponding to about 10% uncertainty in the excitation yield. The horizontal error bars reflect a residual central frequency drift of 0.1 MHz, originating from environmental perturbations: although the laser is stabilized to the saturated absorption line of rubidium atoms, temperature fluctuations and magnetic field variations induce subtle shifts in the optical cavity geometry and atomic energy levels, thereby perturbing the resonant frequency.

2.4. Filtering Techniques

Even lasers of identical models may demonstrate a phase discrepancy; consequently, we employ locking laser light that is sourced from the same write laser utilized for photon generation. According to the principles governing energy-level transitions, the frequency disparity between the Stokes photon and the locking laser is approximately 6.8 GHz. The signal laser beam is also derived from the write laser through an Acousto-Optic Modulator (AOM2), which introduces a frequency shift of 6.8 GHz, allowing this beam to resonate with the Stokes photon at the same frequency. Thus, this beam can serve as an auxiliary light source to enhance photon transmission efficiency and to regulate the temperature control point for the effective operation of the filters. To facilitate the separation of the Stokes photon (signal laser) and the locking light at the locations of FC1 and FC4, six Fabry–Perot (FP) filters are strategically positioned along the detection and locking paths. The FPL filter is employed to isolate the write light or the Stokes photon in order to extract the locking light, while the FPs filter is utilized to isolate the locking light to extract the write light or the Stokes photon. The transfer function of the cascade filter can be articulated as follows:
T ( δ f ) = i = 1 n T i ( δ f ) , T i ( ν ) = 1 1 + 2 F π 2 sin ϕ δ f 2 2 ,
where T i ( ν ) denotes the transfer function of the i th Fabry–Pérot (FP) filter cavity. The filter is Ultra-Low Expansion (ULE) material, the reflectivity is 0.9, with a specified thickness is L = 7.5 mm, and the fineness of the FP filter resonator is 30. The phase difference between two adjacent beams in the filter cavity can be expressed as follows: ϕ ν = 4 π δ f L / c ; here, c is for the speed of light in air and δ f is the frequency difference.
Figure 5 illustrates the correlation between the transmission rate and frequency difference, as derived from Equation (6). Due to the precision constraints of the temperature control system, the experiment restricts the transmittance of six FP cascade filters to 53%, and the extinction ratio of the cascaded FP filters is of the order of 10−16, which significantly surpasses that of a single filter, which is approximately 10−3. In addition, polarization filtering is used to perform further separation of the Stokes photons and the locking light with an extinction ratio of the order of 10−3, and PBSSP (PBSS3) and HWPS3 (HWPS4) are used to ensure that the horizontally polarized Stokes photons are transmitted to the SPD in the horizontal direction. PBSL1 (PBSL2) and HWPL3 (HWPL4) are used to ensure that the vertically polarized locking light is directed to the oscilloscope in the vertical orientation.

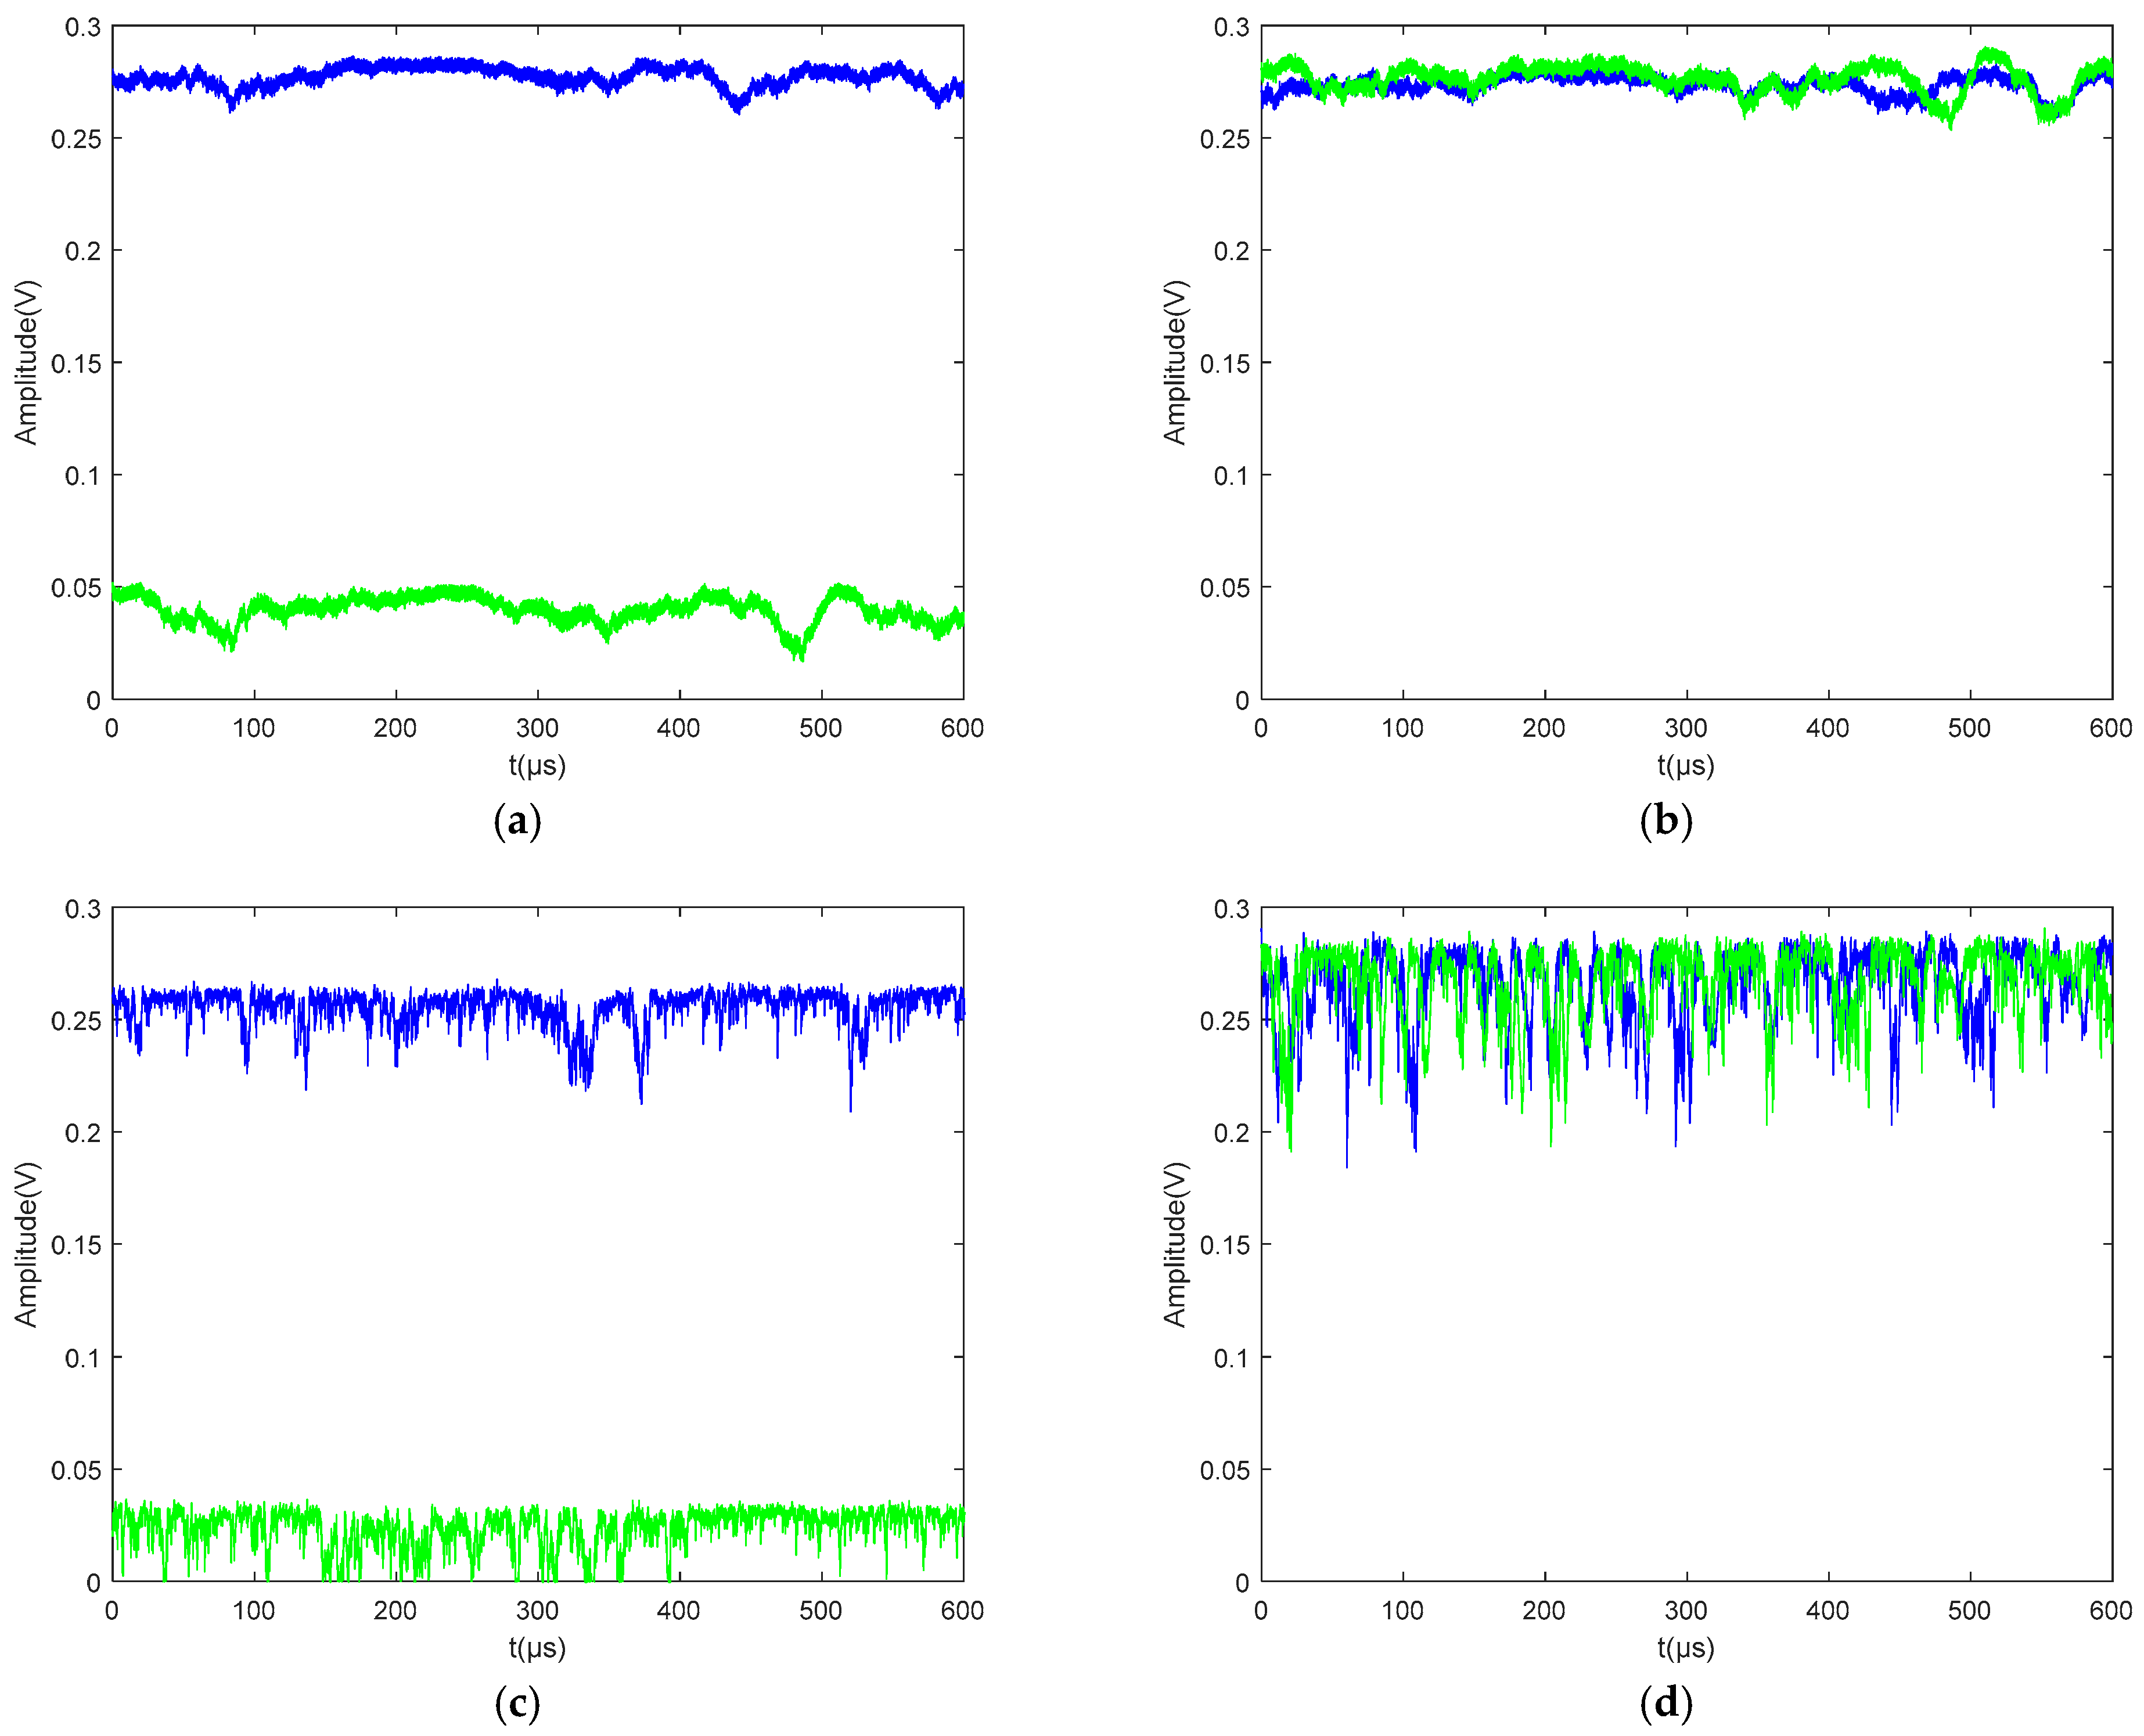
2.5. Phase Control Technology

During the experiment, the relative phase between the signal light and the locking light is precisely controlled by adjusting the frequency of the locking light via the acousto-optic modulator (AOM3), enabling phase scanning. Under the locked interferometer condition, the interference visibility is calculated by measuring the extremal signal values (maximum and minimum in Equation (5)) at identical polarization and fixed phase configurations. Notably, as the delay fiber length increases, the accumulated optical path difference accelerates the phase variation rate, thereby shortening the scanning frequency period. Consequently, higher-precision frequency control is required for long delay fibers to maintain a stable phase resolution. This relationship can be examined by considering the interference period in relation to the frequencies of both the signal laser (denoted as f 2 = 3.77112 × 10 14 H z ) and the locking laser (denoted as f 1 = 3.77105 × 10 14 H z ), where k 1 = 2 π f 1 / v represents the wave number of the write laser, k 2 = 2 π f 2 / v signifies the wave number of the signal light, and L denotes the difference in the fiber arm length associated with the m-th period ( m = k 2 L / 2 π ). When one period is traversed, the difference in the fiber arm length adjusts to δ L = 2 π m + 1 / k 2 , resulting in a corresponding frequency shift that is equivalent to one period. The frequency period Δ f = k 1 k 3 v / 2 π of the locking laser can be determined. Upon simplification, the expression for the frequency shift period can be articulated as follows:
Δ f = f 1 v v + f 2 L ,
Here, f 1 denotes the write (lock) laser frequency, which is locked on the saturation absorption line D1 corresponding to the g e 2 transition, f 2 denotes the frequency of the (signal laser) Stokes photons, and v = 2 × 10 8 m/s denotes the propagation velocity of the laser light or photons within an optical fiber. L denotes the delay fiber length.

3. Results and Discussion

In scanning mode, Figure 2 illustrates the interference patterns observed at various fiber lengths (12 m, 112 m, 212 m, and 312 m) with varying delays, where the upper blue line (lower green line) denotes the locking laser (write laser) signal. When the length difference Δ L t increases, the phase noise in φ L t φ S t is amplified based on Equation (2), and the signals shown in Figure 2b becoming increasingly indistinct. Equation (3) indicates that the phase difference can be adjusted by controlling the frequency of AOM3. Here, we list the anti-phase case shown in Figure 2 with Δ φ t = ( 2 n + 1 ) π .
When the locking laser (represented by the blue line) is stabilized at its maximum position, the signal laser (indicated by the green line) is subsequently stabilized at its lowest position in the anti-phase scenario (illustrated in Figure 3a,c), and at its highest position in the in-phase scenario (depicted in Figure 3b,d). An increase in the arm length difference within the interferometer results in the manifestation of phase noise as high-frequency jitter. To address this, the intensity of the corresponding phase must be averaged over a specified observation time window, a process that significantly diminishes the visibility of the interference. In addition to the limitations imposed by the inherent coherence time of the signal, which further reduces interference visibility, the low-frequency, large-amplitude jitter observed in the time domain is primarily attributed to the introduction of fiber, influenced by temperature fluctuations and vibrational effects. Although we have implemented insulation and damping measures to mitigate these effects, an increase in the length of the delay fiber will still amplify and introduce noise into the system. This phenomenon can be effectively demonstrated through real-time feedback concerning the substantial jitter of the locking light. By employing post-processing techniques, the green region depicted in Figure 3 is maintained within 90% of its maximum value by utilizing the moments when the jitter amplitude reaches the green region of the locked optical signal as trigger points, during which the signal light amplitude and photon count are recorded. The large-scale jitter represented in the red area is treated as a measurement error resulting from platform vibrations, thereby enabling the exclusion of non-useful data and facilitating the calculation of maximum interference visibility while minimizing measurement errors induced by noise in the interference arm during the interferometric measurement process. Consequently, the corresponding interference visibilities for the various delay optical fibers were computed using Equation (5) and are presented as experimental data points in Figure 6.
In the experiments, various delay times were introduced by the differing arm length discrepancies. In Figure 6, the delay time can be calculated based on the delay fiber length. These delay times include 60 ns, 310 ns, 560 ns, 1060 ns, 1560 ns, 2060 ns, 3060 ns, and 5060 ns. The corresponding interference visibilities were then measured and the results are presented in Figure 6. Based on Equation (4), the red line represents the fitting to the experimental data V from the signal laser with δ 2 = 0.2 , i.e., where the coherence time of the signal laser is approximately 2.56 μs when V = 0.5 . The blue dashed line corresponds to the fitting of the experimental data V of Stokes photons with δ 2 = 0.88 , i.e., the coherence time is approximately 1.23 μs when V = 0.5 .
The Stokes photons emitted from FC2 traverse a sequential filtering system before being converted into a digital signal by the Single Photon Detector (SPD), which they access through FCS3. This digital signal undergoes processing via a Field-Programmable Gate Array (FPGA) and is subsequently presented on a computer to depict the distribution of the photon wave packet. Furthermore, a statistical analysis is conducted on the number of photons present in the interference region. As illustrated in Figure 4, the interference contrast of the photons is assessed based on the maximum and minimum photon counts. The locked light that emerges from FC4 is transformed into an analog waveform signal by Photodetector PDL and is subsequently visualized on an oscilloscope. The error signal, derived from the combination of the locked laser signal and the demodulated signal from the optical system (OS), is then input into the proportional-integral-derivative (PID) controller. By adjusting the parameters of the PID controller, the Fiber Sensing Technology (FST) is able to regulate the arm length difference within the interferometer, thereby ensuring that the phase difference between the two arms remains an integer multiple of 2π. At this juncture, the energy of the locked light is sustained at the peak of constructive interference, as indicated by the blue line in Figure 3.
Utilizing a Field-Programmable Gate Array (FPGA) to control the on/off duration of AOM1 allows for precise adjustments of the write pulse length, enabling the generation of wave packet photons with pulse widths of 150 ns and 1.06 μs. These wave packet photons were subsequently employed as the write laser output and injected into the interferometer. Figure 4 depicts the photon distributions within the interference regions of 90 ns and 60 ns, corresponding to delay fiber lengths of 12 m and 212 m, respectively. The resulting interferograms exhibit periodicities of approximately 16.7 MHz and 0.94 MHz. Specifically, Figure 4(a2,a3) present the highest and lowest photon count distributions at frequencies of 196.6 MHz and 188.1 MHz for AOM3 with a delay fiber length of 12 m. In contrast, Figure 4(b2,b3) illustrates the highest and lowest photon count distributions at frequencies of 191.5 MHz and 192 MHz for AOM3, with a delay fiber length of 212 m. The green circles denote the measured values, while the black squares represent the results obtained in the absence of background noise. The black squares, calculated according to Equation (5), indicate corresponding interference visibility values of 94% and 67%, respectively. Due to constraints related to the signal-to-noise ratio and laser frequency drift, interference visibility measurements were limited to the 150 ns–1.06 μs wave packet-tunable photons. In Figure 4b, the transverse frequency error bar is primarily attributed to laser frequency drift, which contributes to the observed reduction in visibility. Conversely, the transverse frequency error depicted in Figure 4(a1) is relatively minor in comparison to the 17 MHz period. As the length of the photon wave packet increases, the interference fringe period associated with the arrival of the leading and trailing photons decreases, thereby exacerbating the impact of the transverse frequency error, as shown in Figure 4(b1), which is induced by laser frequency jitter, on the measurement of photon interference visibility.
As illustrated in Figure 4(a1,b1), an increase in the length of the delay fiber leads to a decrease in the period of the interference phase shift. As illustrated in Figure 7, the relationship between the frequency shift period and the delay fiber length is derived from Equation (7). The calculation results obtained using Equation (7) are consistent with the measured frequency shift periods of the signal laser light and the photons.

4. Conclusions

This study introduces a methodology utilizing an unbalanced fiber interferometer to assess the coherence time of tunable photon wave packets produced by cold atoms. The experimental findings indicate that as the length of the photon wave packet increases, the frequency period of the interference fringes diminishes, thereby exacerbating the influence of laser frequency jitter on the measurement of photon interference visibility. By examining the decay of visibility within the interference pattern, one can directly deduce the coherence time associated with each photon. The results reveal that the coherence time for the write laser is measured at 2.56 µs (V = 0.5), while the Stokes photons generated through the interaction with cold atoms exhibit a coherence time of 1.23 µs (V = 0.5).
The experiment employed several critical devices and techniques, including the unbalanced fiber interferometer, Fabry–Perot filters, Acousto-Optic Modulators (AOMs), and phase control technology. The unbalanced fiber interferometer facilitates the measurement of photon coherence time by transforming the phase noise of the laser into intensity noise via the adjustment of the fiber arm length difference. Fabry–Perot filters are utilized to isolate the Stokes photons and stabilize the light, thereby ensuring a high purity of signal photons. AOMs are implemented to generate tunable write pulses and achieve phase stability through frequency locking. The phase control technology stabilizes the interferometer’s phase through a feedback control system, thereby ensuring the visibility and stability of the interference fringes. The integration of these devices and techniques allows for an efficient measurement of the coherence time of photon wave packets, providing essential technical support for quantum information processing.
In the context of coherence time measurements, external environmental factors, encompassing both Markovian and non-Markovian effects, can significantly impact the measurement outcomes of signal photon coherence times. Markovian effects are typically associated with rapid decoherence, whereas non-Markovian effects may lead to non-exponential decoherence behavior, potentially resulting in prolonged coherence times in certain scenarios. To enhance the measurement of interference visibility for longer wave packet photons, we intend to employ ultra-stable cavity-locked lasers to mitigate the frequency drift of the write laser and utilize high-efficiency, low dark count Single-Photon Detectors to further reduce noise and improve the signal-to-noise ratio. Extended coherence times for photons are conducive to successful entanglement swapping between two atomic ensembles and facilitate high-fidelity quantum information processing. This research lays the groundwork for optimizing quantum communication and computing systems by prolonging the coherence time of photon wave packets.

Author Contributions

Conceptualization, Y.L. and W.W.; Formal analysis, Y.L. and C.S.; Methodology, Q.W. and H.W.; Resources, Y.C. and H.W.; Software, Y.L.; Validation, H.W. and W.Q.; Writing—original draft, Y.L.; Writing—review and editing, W.W., C.S., H.W. and W.Q. All authors have read and agreed to the published version of the manuscript.

Funding

This research was funded by the National Natural Science Foundation of China (U23A20636, 62204232) and the Natural Science Foundation of Shanxi Province (20210302124189, 202303021212208, 202403021222162). Research Project Supported by Shanxi Scholarship Council of China (20210038).

Institutional Review Board Statement

Not applicable.

Informed Consent Statement

Not applicable.

Data Availability Statement

The data of this study are available from the corresponding author upon request.

Conflicts of Interest

Author Weizhe Qiao was employed by the company Shanxi Dazhong Electronic Information Industry Group Co., Ltd. The remaining authors declare that the research was conducted in the absence of any commercial or financial relationships that could be construed as potential conflicts of interest.

Abbreviations

The following abbreviations are used in this manuscript:
OSFSOptical Spectrum Filter Set
FPFabry–Perot
PBSPolarizing Beam Splitter
FPGAField-Programmable Gate Array
FCFiber Collimator
AOMAcousto-Optic Modulator
SMFSingle-Mode Optical Fiber
QWPQuarter-Wave Plate
HWPHalf-Wave Plate
FSTFiber Stretcher
PCPolarization Controller
AMPPower Amplifier
PIDProportional-Integral-Derivative Controller
SPDSingle-Photon Detector
PDPhotodetector

References

  1. Jeong, T.; Lee, Y.-S.; Park, J.; Kim, H.; Moon, H.S. Quantum interference between autonomous single-photon sources from Doppler-broadened atomic ensembles. Optica 2017, 4, 1167–1170. [Google Scholar] [CrossRef]
  2. Park, J.; Kim, H.; Moon, H.S. Two-photon interferences of nondegenerate photon pairs from Doppler-broadened atomic ensemble. Opt. Express 2017, 25, 32064–32073. [Google Scholar] [CrossRef]
  3. Fulconis, J.; Alibart, O.; O’Brien, J.L.; Wadsworth, W.J.; Rarity, J.G. Nonclassical Interference and Entanglement Generation Using a Photonic Crystal Fiber Pair Photon Source. Phys. Rev. Lett. 2007, 99, 120501. [Google Scholar] [CrossRef] [PubMed]
  4. Rogers, S.; Mulkey, D.; Lu, X.; Jiang, W.C.; Lin, Q. High Visibility Time-Energy Entangled Photons from a Silicon Nanophotonic Chip. ACS Photonics 2016, 3, 1754–1761. [Google Scholar] [CrossRef]
  5. Sajeed, S.; Jennewein, T. Observing quantum coherence from photons scattered in free-space. Light Sci. Appl. 2021, 10, 121. [Google Scholar] [CrossRef] [PubMed]
  6. Srivathsan, B.; Gulati, G.K.; Chng, B.; Maslennikov, G.; Matsukevich, D.; Kurtsiefer, C. Narrow Band Source of Transform-Limited Photon Pairs via Four-Wave Mixing in a Cold Atomic Ensemble. Phys. Rev. Lett. 2013, 111, 123602. [Google Scholar] [CrossRef]
  7. Shu, C.; Chen, P.; Chow, T.K.; Zhu, L.; Xiao, Y.; Loy, M.M.; Du, S. Subnatural-linewidth biphotons from a Doppler-broadened hot atomic vapour cell. Nat. Commun. 2016, 7, 12783. [Google Scholar] [CrossRef]
  8. Ding, D.-S.; Zhang, W.; Shi, S.; Zhou, Z.-Y.; Li, Y.; Shi, B.-S.; Guo, G.-C. Hybrid-cascaded generation of tripartite telecom photons using an atomic ensemble and a nonlinear waveguide. Optica 2015, 2, 642–645. [Google Scholar] [CrossRef]
  9. Qin, X.; Liu, Z.; Shi, H.; Wang, Z.; Guan, X.; Shi, T.; Chen, J. Switchable Faraday laser with frequencies of 85Rb and 87Rb 780 nm transitions using a single isotope 87Rb Faraday atomic filter. Appl. Phys. Lett. 2024, 124, 161104. [Google Scholar] [CrossRef]
  10. Gu, Z.; Yang, C.; Chen, J.F. Characterization of the photon-number state of a narrow-band single photon generated from a cold atomic cloud. Opt. Commun. 2019, 439, 206–209. [Google Scholar] [CrossRef]
  11. Jeong, T.; Moon, H.S. Temporal- and spectral-property measurements of narrowband photon pairs from warm double-Λ-type atomic ensemble. Opt. Express 2020, 28, 3985–3994. [Google Scholar] [CrossRef] [PubMed]
  12. Yu, Y.; Liu, S.; Lee, C.-M.; Michler, P.; Reitzenstein, S.; Srinivasan, K.; Waks, E.; Liu, J. Telecom-band quantum dot technologies for long-distance quantum networks. Nat. Nanotechnol. 2023, 18, 1389–1400. [Google Scholar] [CrossRef]
  13. Wang, M.; Wang, S.; Xu, Z.; Ma, T.; Li, Y.; Li, S.; Wang, H. Lifetime reductions and read-out oscillations due to imperfect initial level preparations of atoms in a long-lived DLCZ-like quantum memory. Appl. Phys. B 2022, 128, 196. [Google Scholar] [CrossRef]
  14. Yu, Y.; Ma, F.; Luo, X.Y.; Jing, B.; Sun, P.F.; Fang, R.Z.; Yang, C.W.; Liu, H.; Zheng, M.Y.; Xie, X.P.; et al. Entanglement of two quantum memories via fibres over dozens of kilometres. Nature 2020, 578, 240–245. [Google Scholar] [CrossRef]
  15. Jin, J.; Grimau Puigibert, M.; Giner, L.; Slater, J.A.; Lamont, M.R.E.; Verma, V.B.; Shaw, M.D.; Marsili, F.; Nam, S.W.; Oblak, D.; et al. Entanglement swapping with quantum-memory-compatible photons. Phys. Rev. A 2015, 92, 12329. [Google Scholar] [CrossRef]
  16. Jing, B.; Wang, X.-J.; Yu, Y.; Sun, P.-F.; Jiang, Y.; Yang, S.-J.; Jiang, W.-H.; Luo, X.-Y.; Zhang, J.; Jiang, X.; et al. Entanglement of three quantum memories via interference of three single photons. Nat. Photonics 2019, 13, 210–213. [Google Scholar] [CrossRef]
  17. Zhong, H.-S.; Wang, H.; Deng, Y.-H.; Chen, M.-C.; Peng, L.-C.; Luo, Y.-H.; Qin, J.; Wu, D.; Ding, X.; Hu, P.; et al. Quantum computational advantage using photons. Science 2020, 370, 1460–1463. [Google Scholar] [CrossRef]
  18. Simon, C.; de Riedmatten, H.; Afzelius, M. Temporally multiplexed quantum repeaters with atomic gases. Phys. Rev. A 2010, 82, 010304. [Google Scholar] [CrossRef]
  19. Zhao, L.; Guo, X.; Liu, C.; Sun, Y.; Loy, M.M.T.; Du, S. Photon pairs with coherence time exceeding 1  μs. Optica 2014, 1, 84–88. [Google Scholar] [CrossRef]
  20. Almendros, M.; Huwer, J.; Piro, N.; Rohde, F.; Schuck, C.; Hennrich, M.; Dubin, F.; Eschner, J. Bandwidth-tunable single-photon source in an ion-trap quantum network. Phys. Rev. Lett. 2009, 103, 213601. [Google Scholar] [CrossRef]
  21. Farrera, P.; Heinze, G.; Albrecht, B.; Ho, M.; Chavez, M.; Teo, C.; Sangouard, N.; de Riedmatten, H. Generation of single photons with highly tunable wave shape from a cold atomic ensemble. Nat. Commun. 2016, 7, 13556. [Google Scholar] [CrossRef] [PubMed]
  22. Li, Y.; Wen, Y.; Wang, S.; Liu, C.; Liu, H.; Wang, M.; Sun, C.; Gao, Y.; Li, S.; Wang, H. Generation of entanglement between a highly wave-packet-tunable photon and a spin-wave memory in cold atoms. Opt. Express 2022, 30, 2792–2802. [Google Scholar] [CrossRef]
  23. Maring, N.; Farrera, P.; Kutluer, K.; Mazzera, M.; Heinze, G.; de Riedmatten, H. Photonic quantum state transfer between a cold atomic gas and a crystal. Nature 2017, 551, 485–488. [Google Scholar] [CrossRef] [PubMed]
  24. Jelezko, F.; Volkmer, A.; Popa, I.; Rebane, K.K.; Wrachtrup, J. Coherence length of photons from a single quantum system. Phys. Rev. A 2003, 67, 041802. [Google Scholar] [CrossRef]
  25. Qian, P.; Gu, Z.; Cao, R.; Wen, R.; Ou, Z.Y.; Chen, J.F.; Zhang, W. Temporal Purity and Quantum Interference of Single Photons from Two Independent Cold Atomic Ensembles. Phys. Rev. Lett. 2016, 117, 013602. [Google Scholar] [CrossRef] [PubMed]
  26. Cho, S.-B.; Noh, T.-G. Stabilization of a long-armed fiber-optic singlephoton interferometer. Opt. Express 2009, 17, 19027–19032. [Google Scholar] [CrossRef]
  27. Li, C.-L.; Bao, X.-H.; Yin, J.-P.; Jin, R.-B.; Jiang, Y.-F.; Zhang, Q.; Peng, K.; Pan, J.-W. Asynchronous quantum repeater using multiple quantum memory. Rep. Prog. Phys. 2024, 87, 127901. [Google Scholar] [CrossRef]
  28. Jing, X.; Qian, C.; Weng, C.X.; Li, B.H.; Chen, Z.; Wang, C.Q.; Tang, J.; Gu, X.W.; Kong, Y.C.; Chen, T.S.; et al. Experimental quantum Byzantine agreement on a three-user quantum network with integrated photonics. Sci. Adv. 2024, 10, eadp2877. [Google Scholar] [CrossRef]
  29. Xie, Y.-M.; Lu, Y.-S.; Weng, C.-X.; Cao, X.-Y.; Jia, Z.-Y.; Bao, Y.; Wang, Y.; Fu, Y.; Yin, H.-L.; Chen, Z.-B. Breaking the Rate-Loss Bound of Quantum Key Distribution with Asynchronous Two-Photon Interference. PRX Quantum 2022, 3, 020315. [Google Scholar] [CrossRef]
  30. Wang, F.-X.; Lu, Q.-H.; Chen, W.; Wang, S.; Fu, H.; Lu, Y.; Hao, P.; Chen, J.-L.; Ding, W.; Ma, J.; et al. Hybrid High-Dimensional Quantum Key Distribution for a Composable Quantum Network. Phys. Rev. Appl. 2023, 19, 054060. [Google Scholar] [CrossRef]
  31. Minář, J.; de Riedmatten, H.; Simon, C.; Zbinden, H.; Gisin, N. Phase-noise measurements in long-fiber interferometers for quantum-repeater applications. Phys. Rev. A 2008, 77, 052325. [Google Scholar] [CrossRef]
Figure 1. Experimental setup. (a) Laser interacts with atoms in energy-level transitions; (b) optical path lock hardware connection diagram; (c) Stokes photonic preparation system; (d) nonbalanced fiber interferometer; OSFS: Optical Spectrum Filter Set; FPs (FPL): Fabry–Perot cascade filters, PBS: Polarizing Beam Splitter; FPGA: Field-Programmable Gate Array; FC: Fiber Collimator; AOM: Acousto-Optic Modulator; SMF: Single-Mode Optical Fiber; QWP: Quarter-Wave Plate; HWP: Half-Wave Plate; FST: Fiber Stretcher; PC: Polarization Controller; AMP: Power Amplifier; HV: high voltage amplifier; OS: oscillator; LP: low-pass filter; HP: high-pass filter; PID: Proportional-Integral-Derivative Controller; OSC: oscilloscope; Flipper: flip-type optical element adjustment frame; AR: all-reflection mirror; PD: Photodetector; SPD: Single-Photon Detector (SPCM-AQRH, Excelitas Technologies Corp., Mississauga, ON, Canada).
Photonics 12 00415 g001
Figure 2. Interferograms collected via the oscilloscope of the write laser and the locking laser in the anti-phase case with delay fiber lengths of (a) 12 m, (b) 112 m, (c) 212 m, and (d) 312 m.
Photonics 12 00415 g002
Figure 3. Signals of the write laser and the locking laser as collected via the oscilloscope. (a,c) depict the in-phase locked case, and (b,d) depict the antiphase locked case, where the lengths of the delay fibers are 12 m in (a,b), and 212 m in (c,d).
Photonics 12 00415 g003
Figure 4. Interferometric measurements of wave packet photons with durations of 150 ns and 1.06 µs. (a1,b1) show the photon counts in the 90 ns and 60 ns interference regions, respectively, where the green circles show the measured results and the black squares show the denoised results; (a2) and (a3) show the highest and lowest photon count distributions at 196.6 MHz and 188.1 MHz, respectively, from AOM3 when a delay fiber length of 12 m; (b2,b3) show the highest and lowest photon count distributions at approximately 191.52 MHz and approximately 192.01 MHz, respectively, from AOM3 when the delay fiber length is 212 m. The time bin is 10 ns.
Photonics 12 00415 g004aPhotonics 12 00415 g004b
Figure 5. The relationship between transmission rate and frequency difference.
Photonics 12 00415 g005
Figure 6. The interference visibility V was assessed as a function of delay time t. The visibility measurements of the laser are denoted by diamond markers, the red solid line represents the fitted curve for the measured laser data distributed with the Gaussian distribution as described by Equation (4) with δ 2 = 0.2 ; the visibility of the wave packet-tunable Stokes photon measurements is denoted by the star markers, and the blue dashed line represents the fitted curve for the measured laser data distributed with the Gaussian distribution given by Equation (4) with δ 2 = 0.88 . The dask blue dashed lines calibrates the corresponding coherence duration when V = 0.5 .
Photonics 12 00415 g006
Figure 7. Frequency shift period as a function of the delay fiber length. The red dashed line represents the theoretical curve derived from Equation (7), which models the visibility decay as a function of delay time.
Photonics 12 00415 g007
Disclaimer/Publisher’s Note: The statements, opinions and data contained in all publications are solely those of the individual author(s) and contributor(s) and not of MDPI and/or the editor(s). MDPI and/or the editor(s) disclaim responsibility for any injury to people or property resulting from any ideas, methods, instructions or products referred to in the content.

