Review

Research Progress on Immunological Biochips Based on Surface Plasmon Resonance

1
School of Physics, Henan Normal University, Xinxiang 453007, China
2
Institute of Physics, Henan Academy of Sciences, Zhengzhou 450046, China
*
Authors to whom correspondence should be addressed.
Photonics 2025, 12(4), 294; https://doi.org/10.3390/photonics12040294
Submission received: 18 February 2025 / Revised: 14 March 2025 / Accepted: 20 March 2025 / Published: 21 March 2025

Abstract

:
Biomolecular detection plays essential and irreplaceable roles in safeguarding human health, impeding the transmission of diseases, and augmenting the efficacy of treatments. The precise and specific identification of biomarkers holds profound significance for the early diagnosis, real-time surveillance, and targeted treatment of various diseases. In the initial phases of numerous diseases, the absence of distinct biomarkers in the bloodstream often leads to weak detection signals when using traditional immune detection methods such as enzyme-linked immunosorbent assays (ELISAs), chemiluminescence, and fluorescence chromatography. With the surge in research on surface plasmons, innovative approaches have recently emerged that combine surface plasmon resonance (SPR) with immunological detection techniques, reducing the detection sensitivity to 283 ag/mL, shrinking the sensor size to 2.228 µm2, and shortening the detection time to 5.5 min. This review provides an overview of the theoretical foundations of surface plasmon resonance and immunoassays and then delves into the latest advancements in biosensors based on these principles, categorizing them according to their detection mechanisms and methodologies. Finally, we discuss future research directions, opportunities, and the challenges hindering the development of highly sensitive immuno-biochips.

1. Introduction

The early and prompt diagnosis of diseases is becoming increasingly critical. Diseases of diverse etiology, such as cancer, Alzheimer’s disease, severe acute respiratory syndrome (SARS), and the novel coronavirus, have emerged as significant global health threats, compromising human health and survival. Protein biomarkers, which are typically released from cells or organs, serve as indicators of disease. When infections occur, the expression of specific proteins in biological fluid becomes abnormal. As a result, biomarkers for many diseases have been identified and utilized for diagnostic or prognostic purposes. However, early-stage detection remains challenging due to the low concentrations of relevant biomarkers in bodily fluids and the high cost of commonly utilized detection equipment. This makes large-scale early screening and the rapid quantification of trace biomarkers substantially difficult to implement.
Immune biochips are specialized protein chips based on the specific recognition patterns between antibodies and antigens which combine the strengths of immunology and biochip technology [1,2,3]. They offer high-throughput capabilities and hold significant promise for clinical diagnosis and biological research. Existing biomarker detection methods include enzyme linked immunosorbent assay (ELISA) [4], fluorescence [5,6], surface plasmon resonance [7], and electrochemistry techniques [8,9]. Although traditional methods are widely employed, they still face challenges such as low sensitivity, poor specificity, high instrument costs, and complex, time-consuming labeling and signal collection processes. SIMOA technology, which is based on microarray chips, employs magnetic beads coated with capture antibodies to isolate target antigens in samples. An enzymatic reaction generates fluorescent products, which are imaged and quantified via high-resolution fluorescence microscopy to determine protein concentrations, achieving a detection limit at the femtomolar (fg/mL) level. This system exhibits over 1000-fold higher sensitivity than conventional ELISA, enabling ultrasensitive clinical diagnostics. However, it requires costly instrumentation and incurs relatively high testing expenses. Luminex’s platform utilizes fluorescently encoded microspheres for high-throughput multiplex detection, where distinct color-coded microspheres allow for the differentiation and identification of analytes. Target binding via specific antibodies or nucleic acid probes is quantified through laser-based fluorescence intensity analysis. Its most notable advantage is the capacity for the simultaneous detection of over 100 analytes, although it demands high-quality reagents and optimized reaction conditions, and presents detection precision typically ranging from 1 to 100 pg/mL. Therefore, enhancing the sensitivity and specificity of biochips is critical, which can be achieved through the development of new detection theories, optimizing chip designs, or improving sample processing methods.
In recent years, sensors based on surface plasmon resonance have garnered significant attention due to their ability to enable real-time, marker-free [10,11], high-resolution, and background-free dynamic biomarker detection. Enhancement of the electromagnetic field in sub-wavelength structures enables SPR-based biosensors to offer new possibilities for biomarker detection [12,13,14]. The near-field enhancement effect of surface plasmons amplifies the optical responses of surface-adsorbed biomolecules. Raman signals from biomolecules can be intensified by 106–1014-fold [15,16]. Additionally, the luminescence efficiency of fluorescent molecules near metallic nanostructures is significantly enhanced [1]. The wavelength (or angle) of plasmonic resonance is highly sensitive to the refractive index of the surrounding medium. When biomolecules bind to the metal surface, minute changes in the local refractive index induce measurable shifts in the resonance peak position. Through tracking these shifts in resonance angle or wavelength, real-time monitoring of biomolecular phenomena can be achieved. Plasmonic nanoparticles absorb light energy and convert it into thermal energy, facilitating drug release or target destruction, while simultaneously providing feedback through temperature-dependent signal detection. Ali et al. investigated a multi-modal refractive index plasmonic biosensor for the detection of various cancer cells, where two modes exhibited sensitivities of 80 nm/RIU and 570 nm/RIU, respectively [17]. A polarization change in the ferroelectric Bi2O2Te induces a significant plasmonic biosensing response, and Zheng et al. developed an ultrasensitive plasmonic biosensor using it as the sensitive layer material, which was shown to be capable of detecting charged biomolecules at an ultra-low concentration of 1 fmol (FM) [17,18]. This technology is particularly useful for detecting tumor markers in blood, and can additionally facilitate the rapid detection of foodborne pathogens for food safety monitoring. Compared to traditional biochips, SPR-based biochips offer advantages such as high sensitivity, better specificity, fast response speed, and simpler operation. Moreover, they enable direct detection in the liquid phase without complex sample preparation, significantly simplifying the experimental process and improving efficiency. Therefore, the combination of SPR and immune biochip technology is considered to be a promising approach that is expected to advance the rapid, sensitive, and quantitative detection of biomarkers associated with various diseases and overall health status.

2. Surface Plasmon Resonance

2.1. Basic Principles and Characteristics of Surface Plasmon Resonance

SPR is a phenomenon that occurs when incident light interacts with a metal–dielectric interface, exciting collective oscillations of free electrons in the metal. These oscillations, known as surface plasmons (SPs), can be classified into two main types: surface plasmon polaritons (SPPs) and localized surface plasmons (LSPs). As shown in Figure 1, SPPs are propagating electromagnetic waves that travel along the metal–dielectric interface, while LSPs correspond to the confined oscillations of electrons in metal nanoparticles. Both SPPs and LSPs can achieve SPR at specific excitation wavelengths, resulting in maximum energy transfer and the formation of strong near-field electromagnetic fields confined to the metal’s surface. The key feature of SPR is its ability to couple light with the free electrons at the surface of a metal, which significantly enhances light–matter interactions at the nanoscale. This coupling breaks the diffraction limit, allowing for the confinement of light to sub-wavelength regions [12]. In plasmonic nanostructures, SPR can be tuned by modifying the size, shape, and material properties of the metal particles, as well as through altering the surrounding dielectric environment. This makes SPR an incredibly versatile tool for investigating nano-scale phenomena and for applications ranging from biosensing to quantum optics [19].
The relaxation time of LSPR is the vital factor that influences their performance by impacting things such as the Q-factor and the local field enhancement. Two main relaxation mechanisms of LSPR include the radiative relaxation with a typical time scale in femtoseconds, and non-radiative relaxation with a typical time scale in picoseconds [20]. Non-radiative losses mainly come from electron-phonon scattering, electron-electron scattering, and electron-interface scattering. For radiative relaxation, the excited plasmons can couple with the electromagnetic field and emit photons into the surrounding space, showing important potential in highly localized excitations [21,22]. In 2020, Jiang et al. revealed that the LSP loss during the process of decaying into photons or surface plasmon polaritons on the surface of the gold film accounts for 64% of the total energy loss by studying the scattering spectra of a single nanocavity at different temperatures [23]. Because the emitted photons possess the same frequency as the light field that drives the plasmon to resonate, the radiative relaxation is affected by factors such as the size, shape, and composition of the metal nanostructure, as well as the surrounding dielectric environment [20,24]. Generally, these conditions will also have an impact on the interfacial scattering. When other molecules or other metal particles are adsorbed around the nanoparticles, this will lead to an additional decay channel for the attenuation of plasmons which thus can realize a stable controlling in the peak width of the LSPR [25,26,27].
The scattering of electrons by lattice phonons leads to the decay of plasmons and increases the phonon-assisted absorption of the system, which is essentially the infrared equivalent of Bloch’s theory of DC resistivity. Cooling can inhibit electron-phonon scattering and decrease the decay rate and LSPs linewidth [28,29,30]. For a long time, researchers generally believed that the dephasing time caused by electron-phonon scattering is only affected by temperature. In 2000, Del Fatti discovered that when the size of nanoparticles decreases to several nanometers, the local density of states of electrons drops sharply, leading to a reduction in the shielding effect. As a result, more electrons escape from the surface, increasing the interaction between electrons and the phonon [31]. Electron-electron scattering originates from the mutual collisions between electrons. This process is affected by the distribution of electrons near the Fermi level, and the distance between the electron energy and the Fermi level will change the probability of collisions between electrons. Therefore, the electron collision process will be affected by both temperature and frequency. Similarly to the electron-phonon scattering, electron-electron scattering depends on the size of the nanoparticle [32].

2.2. Excitation Mode of SPR

At the two-dimensional infinite metal-dielectric interface (x-y plane, z = 0), suppose that the wave propagates along the x direction, the electric field is as follows:
E x , y , z = E e i k x x
k j , y z 2 = k x 2 ε j k 0 2
where j = d, m denotes dielectric and metal, ed, em is a complex dielectric constant of the dielectric and metal, and k is the wavevector. For TM wave, E = E x , z e i k j , z z , according to Maxwell’s equations, we get the following:
2 H y z 2 + k 0 2 ε β 2 H y = 0
E x = i 1 ω ε 0 ε H y z
E z = β ω ε 0 ε H y
At the interface, these modes require continuity of the dielectric displacement D normal to the interface and the magnetic field component tangential H to the interface in the absence of surface charges, [Ed;x = Em;x, Dd;z = Dm;z, Hd;y = Hm;y]z = 0, and so we get the following:
k d , z k m , z = ε d ε m
We also obtain an expression for the component of the wavevector, which is as follows:
k j , z = k 0 ε j ε d + ε m
k SPPs = k x = ω c 0 ε d ε m ε d + ε m
For the SPP wavelength, we thus obtain the following:
λ SPPs = real 2 π k SPPs ω c 0 real ε m + ε d real ε m ε d
Similarly, for TE waves, it can be solved that the condition for satisfying the equation requires the electric field amplitude to be 0. This indicates that TE waves cannot excite SPPs, thus SPPs are longitudinal waves.
In the visible light regime, em < 0, the lSPPs < l0, so the SPPs can break the diffraction limit. The dispersion curve of SPPs is situated beyond the light cone of free space, and the wave vector of SPPs is smaller than that in vacuum, inherently leading to the inability to directly excite SPPs in free space. SPPs are typically excited via momentum-matching techniques. SPPs propagate along the two-dimensional interface between a conductor and a dielectric medium. As the propagation constant β of the SPPs is greater than the wave vector k of light at the medium interface, SPPs cannot be directly excited by focusing a light wave onto a metal-covered dielectric medium. Moreover, SPPs are confined near the interface, decaying on both sides as they propagate. The dispersion curve of SPPs lies to the right of the dispersion curve in the dielectric medium (ω = CK). Therefore, ordinary three-dimensional beams cannot excite SPPs without the use of specialized phase-matching techniques. Another method involves using films with an insulator/metal/insulator heterostructure for end coupling, which supports the transmission of weakly bound surface plasmons. This approach depends on spatial mode matching, rather than phase matching.
Through the utilization of different coupling techniques, the propagation constant of the incident light wave can be adjusted to match the propagation constant of the SPPs. SPR can be excited using methods such as prism coupling [33,34] and grating coupling, which provide additional momentum to facilitate excitation. These surface plasmons can propagate from tens to hundreds of microns along the metal surface, with the associated electric field decaying exponentially away from the surface (i.e., perpendicular to the metal–dielectric interface) [35]. The refractive index of the material above the metal affects the resonance condition of the surface plasmon, which can be detected in the form of intensity, wavelength, or angle changes in the sensor core [36]. Local surface plasmon resonance (LSPR) refers to a non-propagating form of surface plasmon resonance that can be excited on metal nanoparticles or around nanopores or nanowells in metal films. Common methods include: prism coupling (e.g., Kretschmann or Otto configurations), where evanescent waves from total internal reflection couple to SPPs; grating coupling, leveraging periodic structures to provide the required momentum; and nanostructure scattering, using localized plasmonic resonances in nanoparticles or nanostructured surfaces. Below, we briefly discuss prism coupling and grating coupling.

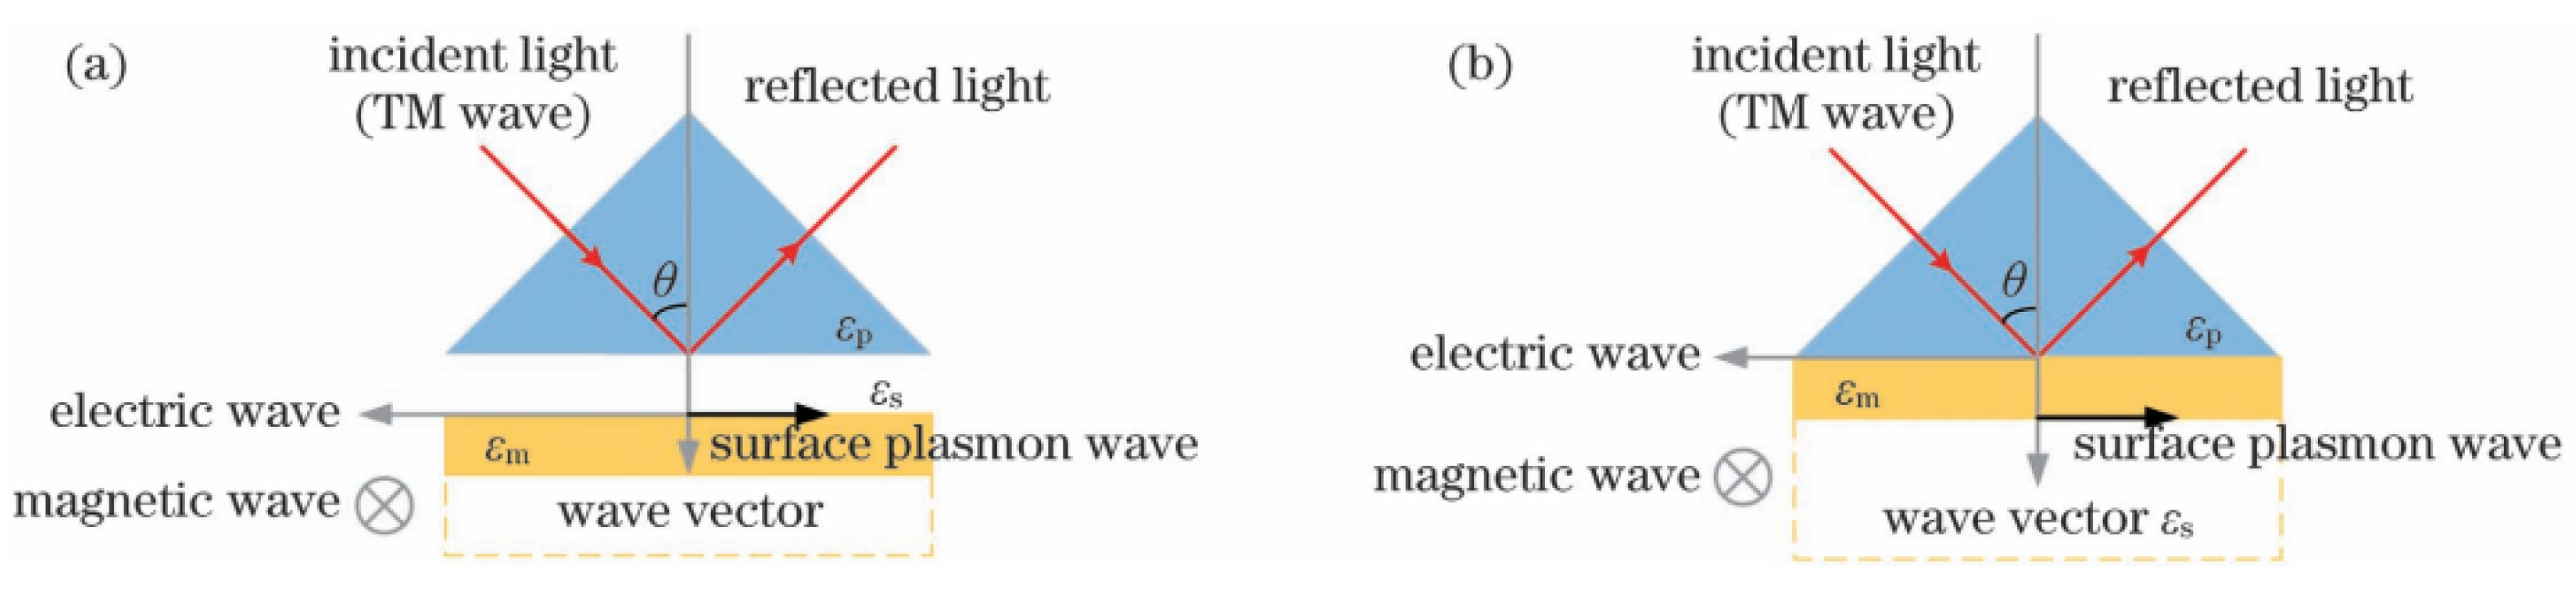
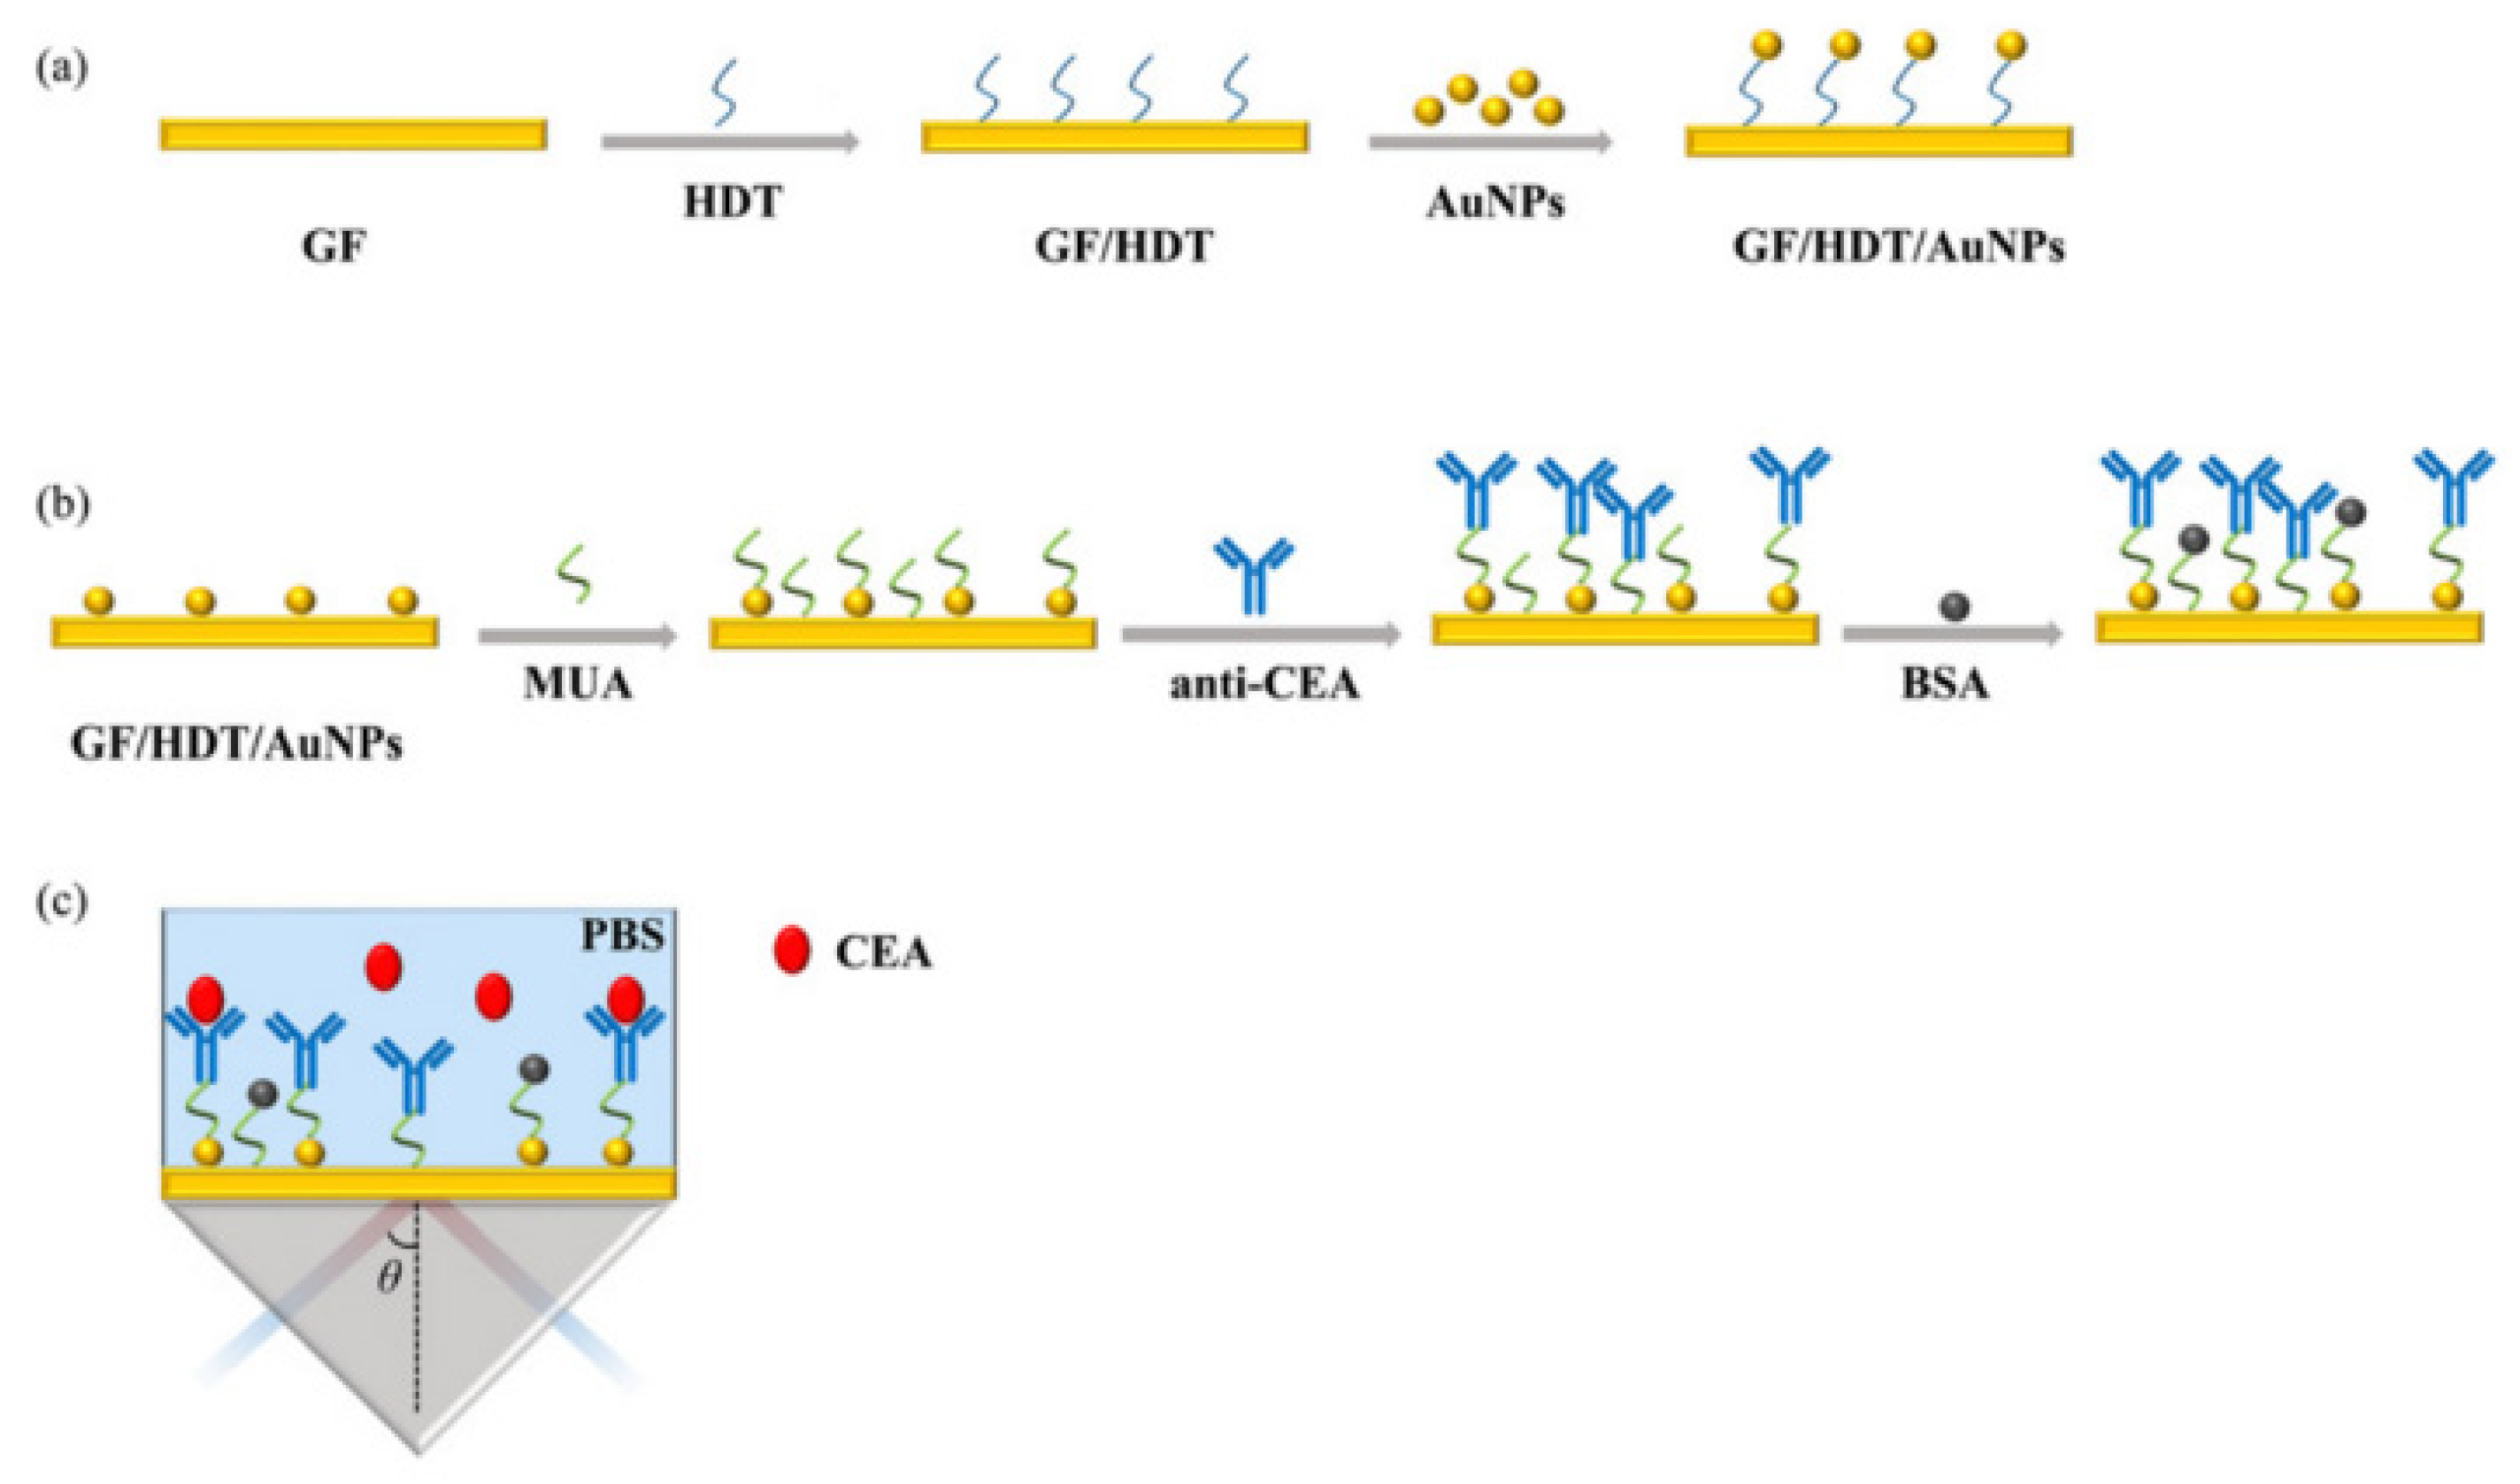
2.2.1. Prism Coupling

Prism coupling utilizes a prism made from a high refractive index material to provide wave vector compensation. Through adjusting the incident angle, the wave vector component of the incident light in the interface direction can be made equal to the wave vector of the surface plasmon wave, enabling coupling between the incident light and the surface plasmon. The prism coupling structure mainly includes the Otto configuration [34] and the Kretschmann configuration [33]. Otto proposed the first SPR sensing model based on total internal reflection. In this configuration, a narrow air gap is placed between the prism and the metal film, and total internal reflection occurs at the air–prism interface. Some photons tunnel into the air–metal interface, thus exciting SPPs. Later, Kretschmann and Raether improved Otto’s model by adding a metal film to the bottom of the prism. In this configuration, light is incident from one side of the prism at an angle greater than the critical angle of total internal reflection. Photons tunnel through the metal film and excite surface plasmons at the metal–air interface.
The structures of the Otto- and Kretschmann-type SPR sensors are shown in Figure 2, where εP, εm, and εs represent the dielectric constants of the prism, metal, and external environment, respectively [37]. Liedberg et al. [38] used a prism-based SPR sensor to detect immunoglobulin G (IgG) antibodies and demonstrated that this approach could provide valuable immunological insights. This marked the first application of SPR sensor technology in the field of biochemical detection. In 2017, Mukhtar et al. [39] designed a hemispherical (or semi-cylindrical) prism made of BK7 glass (refractive index = 1.51) in order to achieve strong SPR signals, with 82–98% of photons excited as SPR in Figure 3. This design resulted in sharp SPR curves with a small full width at half maximum. However, SPR biosensors based on the Kretschmann configuration require bulky instruments and incur high detection costs, making them unsuitable for miniaturization and point-of-care testing (POCT). The Otto structure, on the other hand, offers advantages in terms of non-contact measurements, such as surface quality studies of metal films.

2.2.2. Grating Excitation

Although sensors based on the prism coupling mechanism can achieve high sensitivity, they are not well-suited for integration and miniaturization. To overcome this limitation and eliminate the need for a prism, one can fabricate grooves or shallow holes with a grating constant a on the metal surface. The principle of grating-based SPR sensors is that the dielectric constant of the metal on the grating surface changes with the concentration of the substance being measured which, in turn, alters the refractive index. This change in refractive index causes a shift in the corresponding absorption peak. For the simplest one-dimensional groove grating, wave vector matching is achieved when the condition β = k sin θ ± ν g is satisfied, where g = 2 π a is the inverse lattice vector of the grating with period a and ν = ( 1 , 2 , 3 ) . As with prism coupling, when a minimum value is detected in the reflected light, it indicates that SPPs are generated via excitation.

2.3. The Properties of Nanoparticles and LSPR

The term ‘nanoparticles’ generally refers to microscopic particles with sizes ranging from 1 to 100 nanometers. When the particle size decreases below a critical value, the quantum size effect leads to significant differences in the optical, electrical, and magnetic properties of nanoparticles, compared to bulk materials [40]. Additionally, the ratio of surface atoms to total atoms in nanoparticles increases sharply as the particle size decreases. Surface atoms, with distinct crystal field environments and binding energies compared to internal atoms, exhibit high chemical reactivity [41,42]. Nanoparticles also demonstrate much stronger light absorption capabilities than conventional materials, often accompanied by a blue shift. Certain nanoparticles can emit fluorescence, phosphorescence, or other forms of luminescence under specific conditions. Through tuning their size and composition, nanoparticles can emit light across different wavelengths, enabling broad applications in fields such as biomolecular detection, bioimaging, and display technologies.
When light irradiates a metallic nanostructure, the free electrons in the metal undergo collective oscillations under the electromagnetic field of the incident light. If the frequency of the incident light matches the collective oscillation frequency of the free electrons in the metallic nanostructure, the charge distribution on the metal surface undergoes drastic changes, forming a highly localized charge density wave at the surface. This redistribution of charges generates a strongly localized electric field around the nanostructure, with an intensity that can exceed the incident light field by several orders of magnitude. Metallic nanostructures of different shapes exhibit distinct LSPR characteristics. For example, spherical nanoparticles typically display a single dipole resonance mode, while rod-shaped nanoparticles, in addition to dipole resonance, may exhibit higher-order multi-pole resonance modes. The resonance wavelength of these modes red-shifts as the aspect ratio (i.e., length-to-diameter ratio) increases. As the size of the metallic nanostructure increases, the LSPR wavelength generally red-shifts and the resonance intensity also changes. Beyond a critical size range, additional resonance modes may emerge. The refractive index of the surrounding medium significantly influences this resonance; for example, an increase in the medium’s refractive index induces a red-shift in the resonance wavelength and alters the resonance intensity. This occurs because changes in the refractive index modify the electromagnetic interactions between the nanostructure and its environment. Different metallic materials exhibit unique resonance properties due to variations in their electronic structures and optical characteristics. Gold and silver are widely used as they exhibit low optical losses and strong LSPR effects within the visible light spectrum.
Leveraging the sensitivity of LSPR to changes in the refractive index of the surrounding medium, metallic nanoparticles can be functionalized to specifically bind with biomolecules in order to detect their presence and concentration. When biomolecules bind to the nanoparticles, the resulting alteration in the local refractive index shifts the resonance wavelength or modulates its intensity. Through monitoring these changes, highly sensitive detection of biomolecules can be achieved [43]. The strong localized electric fields generated through resonance significantly enhance the spectral signals of molecules adsorbed onto the surface of metallic nanostructures. Examples include surface-enhanced Raman scattering (SERS) [44] and surface-enhanced fluorescence [1]. In SERS, the electric fields of both incident and scattered light are amplified through LSP resonance, leading to the dramatic enhancement of Raman scattering signals. This enables the detection and analysis of trace molecules at ultra-low concentrations.

3. Detection Method and Principle

Among various target readout technologies, optical sensing has been shown to possess excellent sensitivity and specificity in complex biological environments. Through coupling of a customized nanostructure or substrate with the analyte, the optical signal can be further enhanced by several orders of magnitude through plasmon or photon resonance. Immunobiological chips based on surface plasmons can be divided into those based on colorimetric sensing, surface-enhanced Raman scattering, plasmon fluorescence, and dark-field detection, according to the form of the detection signal. They can be applied as protein microarrays without additional detection steps, meeting higher requirements in terms of sensitivity, biocompatibility, and detection while allowing for the miniaturization demanded to enable future development.

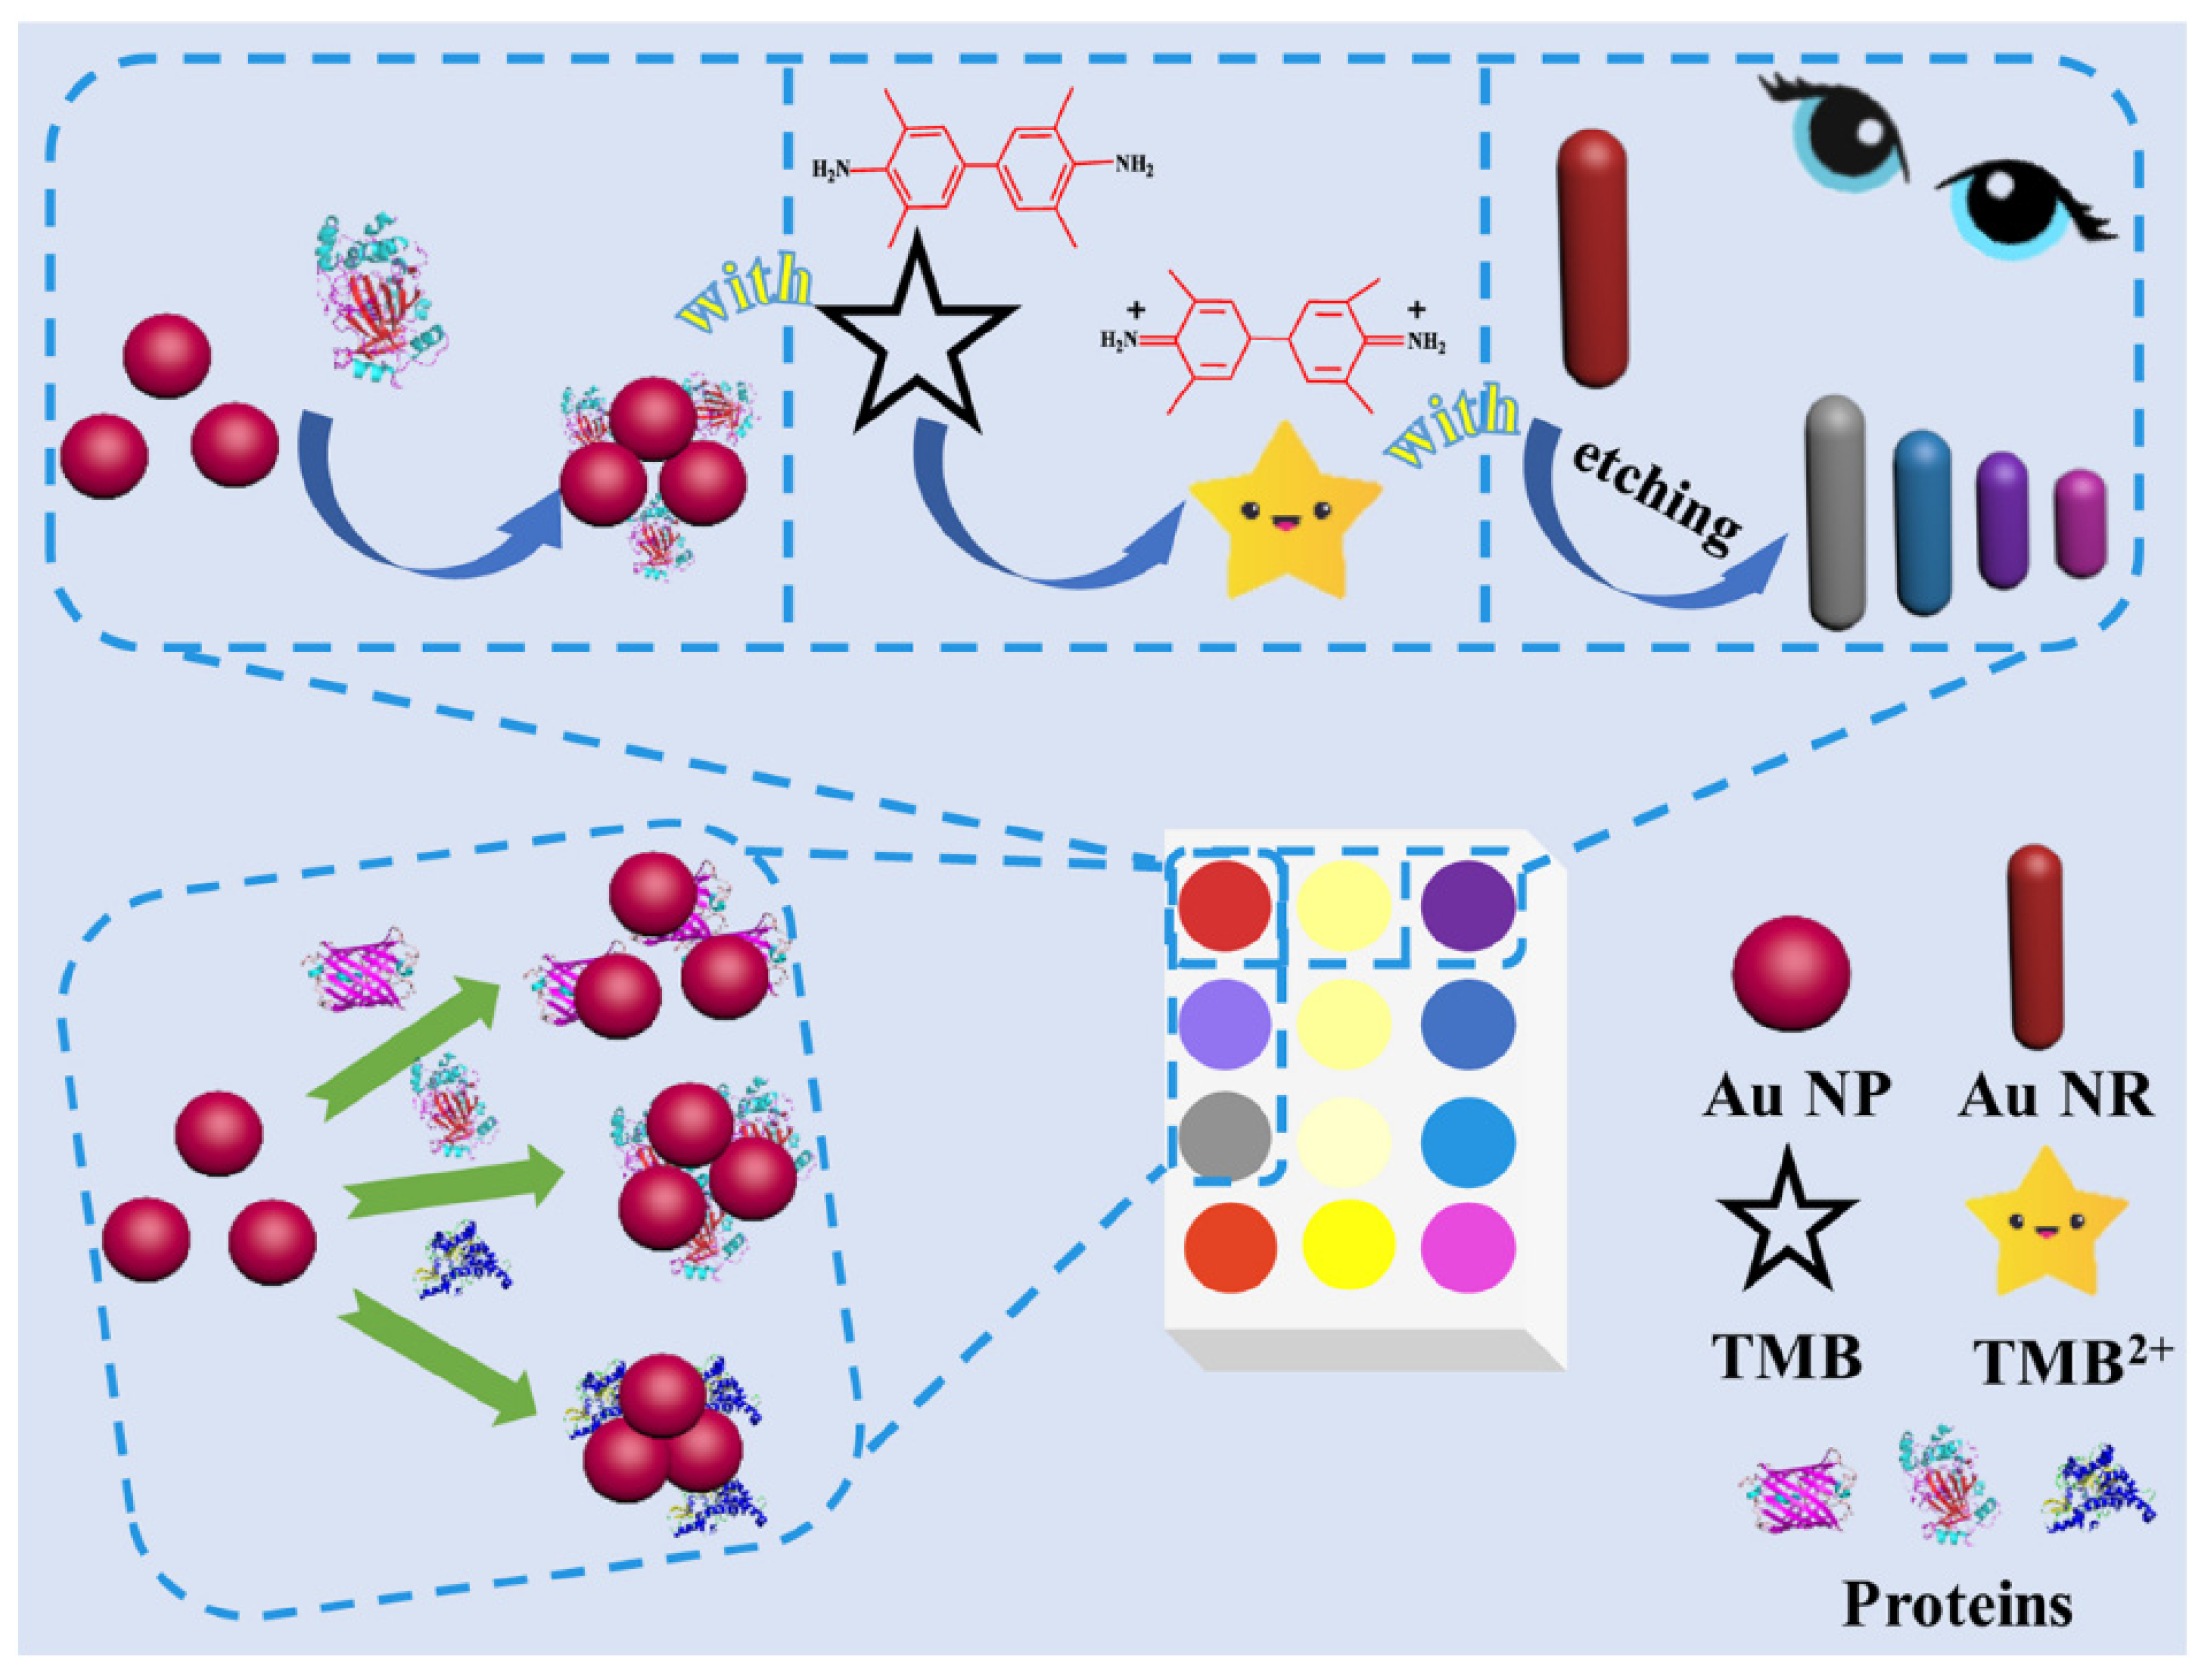
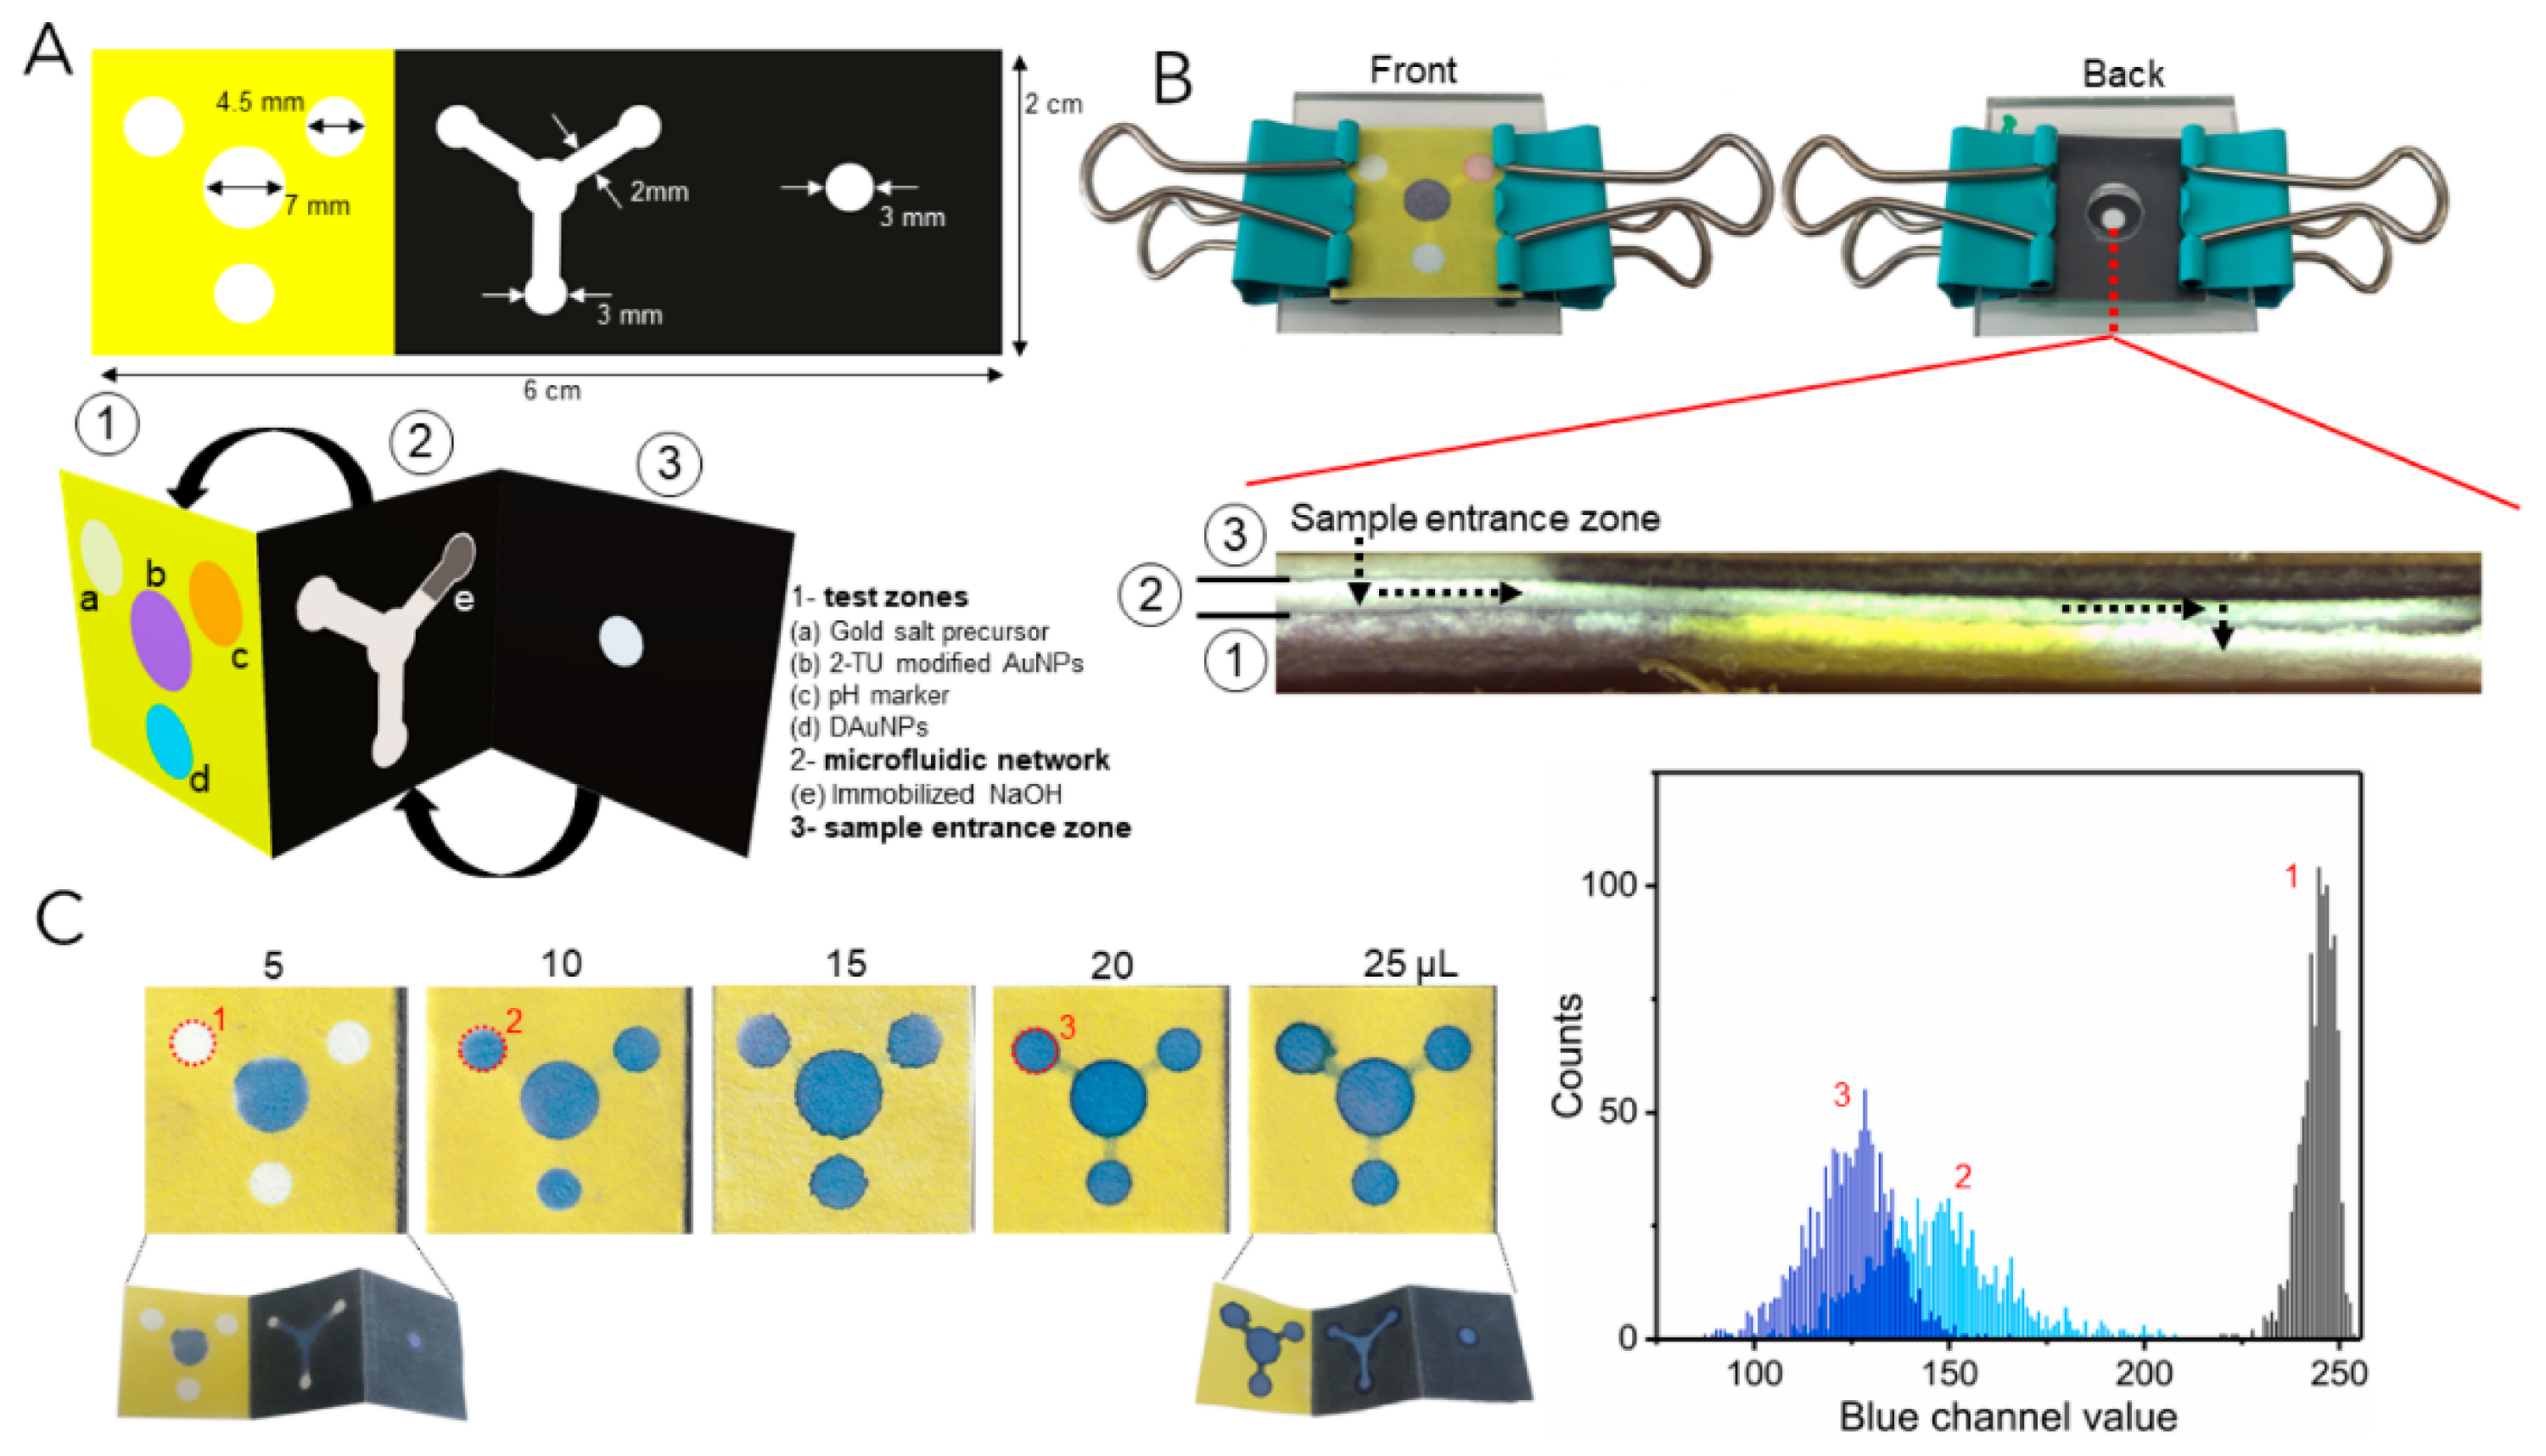
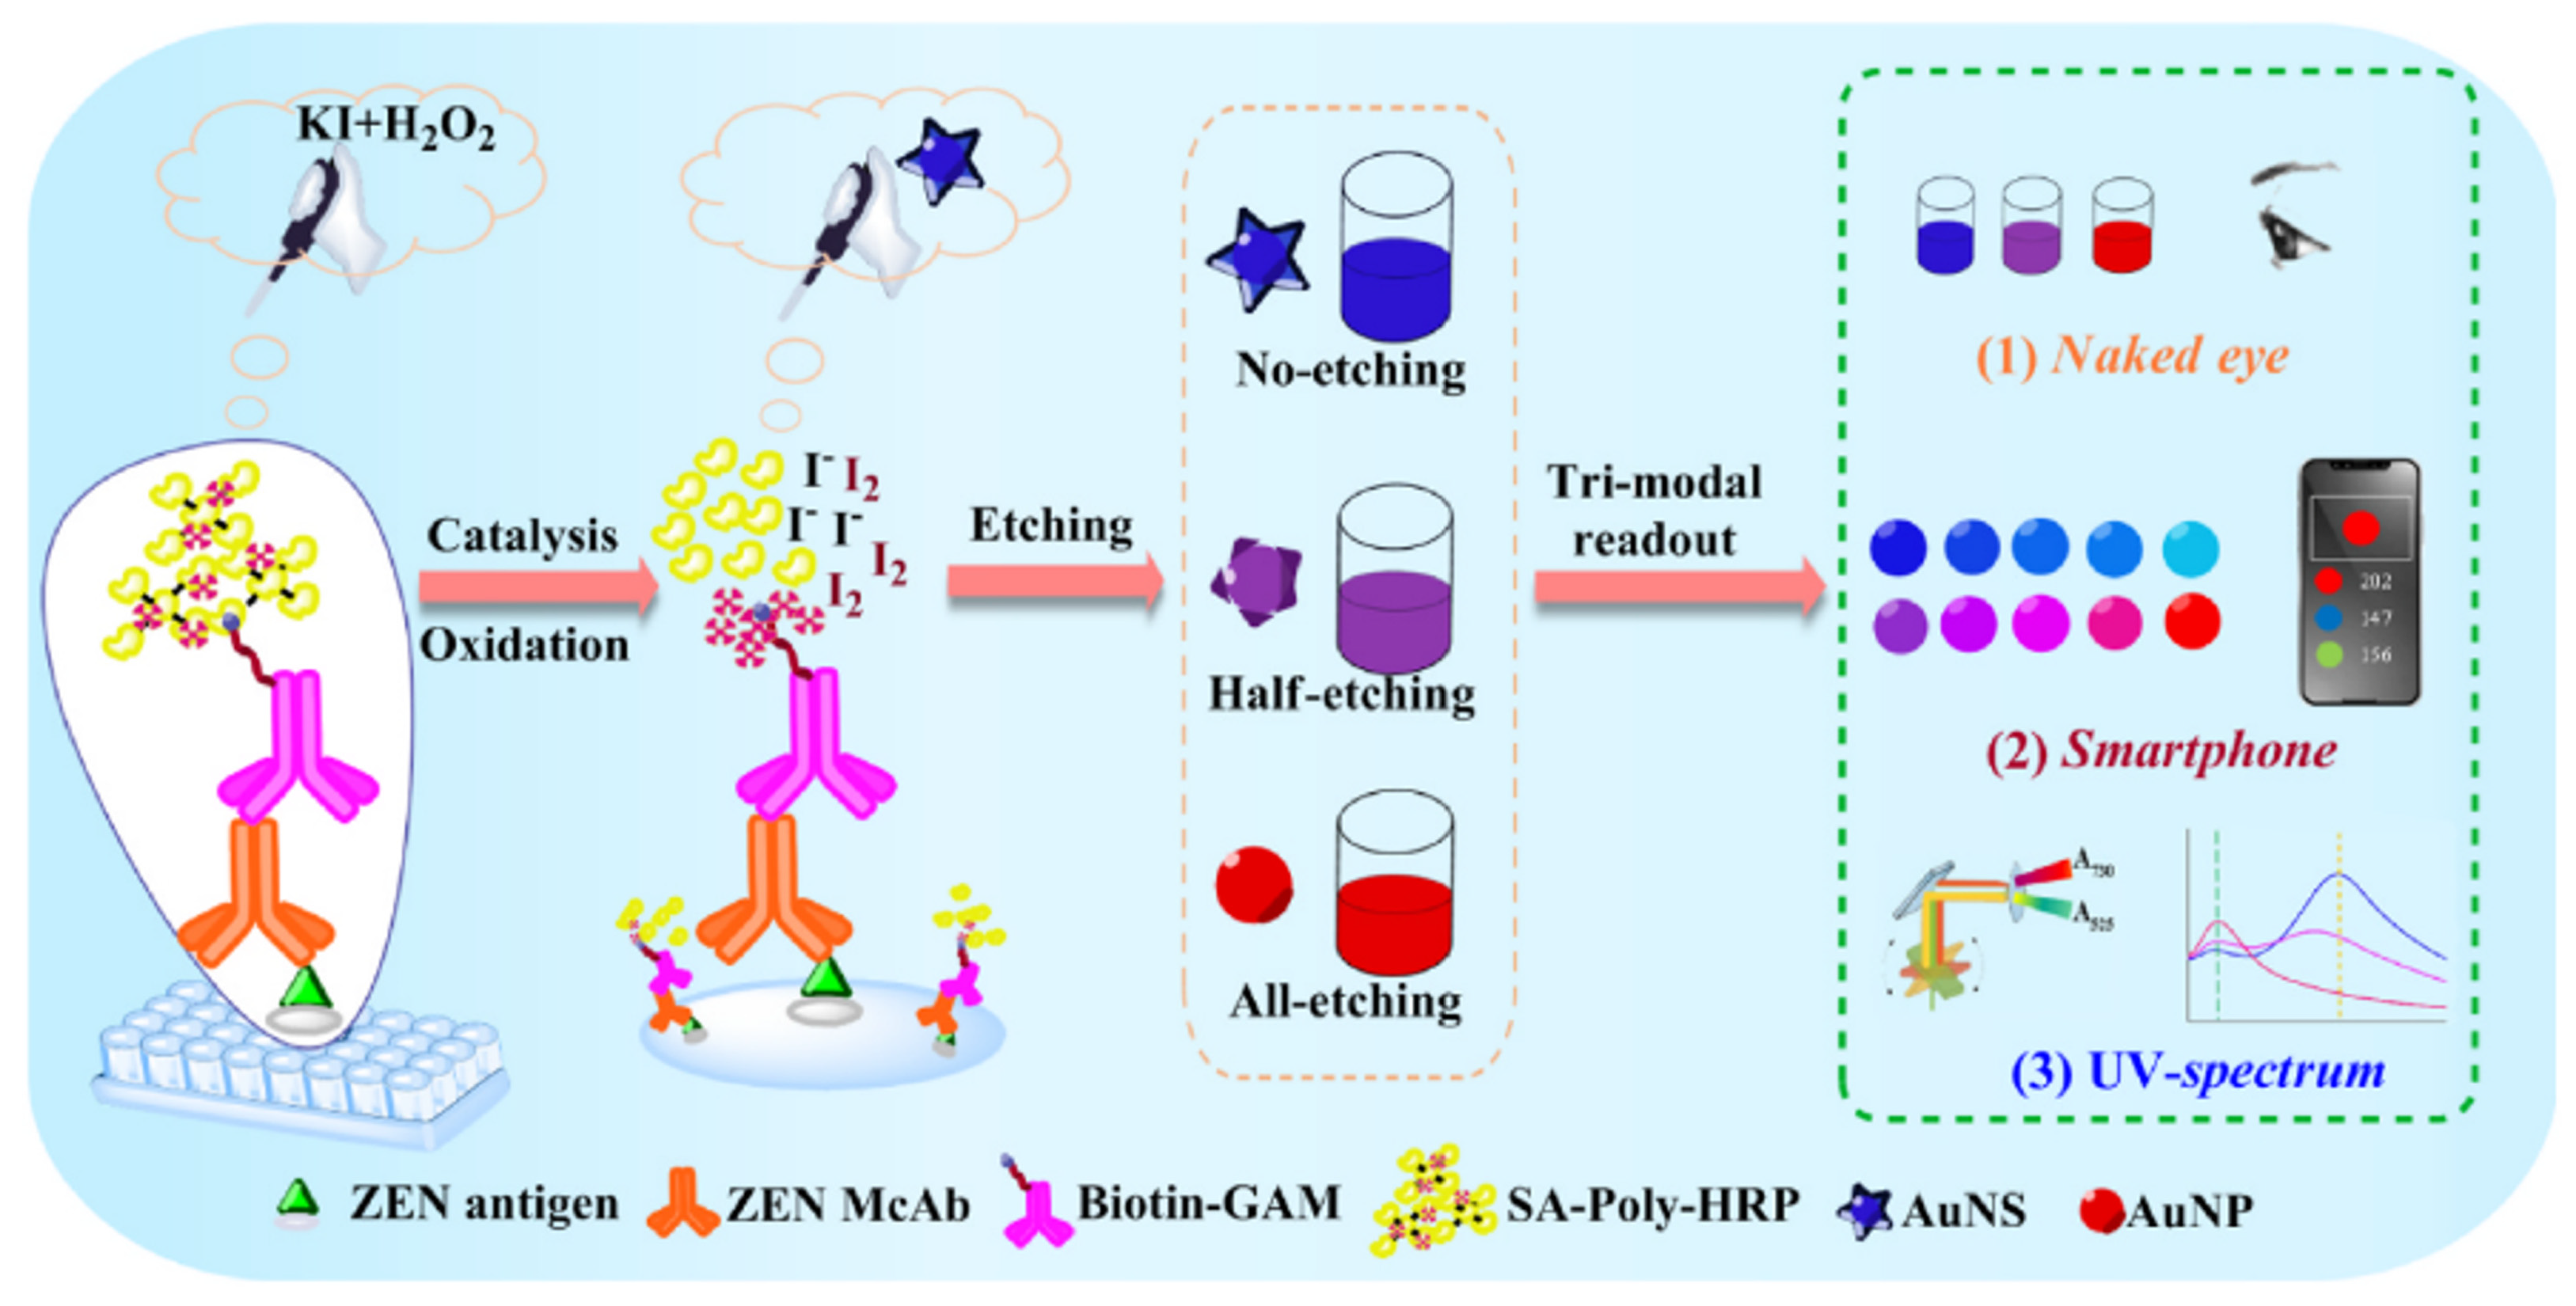
3.1. Colorimetric Sensing

Local surface plasmon resonance coupling between two very close metal nanoparticles will produce a light scattering spectrum that is highly dependent on the distance between the nanoparticles. The aggregation of metal nanoparticles can be initiated by molecular binding or a cascade reaction after molecular recognition, causing the color of the solution to change significantly. As these biosensors can produce a visual response, when priority is given to rapidity and ease of use rather than high sensitivity and accuracy, colorimetric biosensors relying on metal nanoparticles are an appropriate choice. Gold nanoparticles have an extremely high extinction coefficient, with LSPR having greater local electric field enhancement in the range of 5–15 nm [45]. Theoretically, higher surface sensitivity can be obtained, and the colloidal solution of nanoparticles has a bright color which can promote the development of colorimetric sensing approaches yielding results that are visible to the naked eye. Therefore, such approaches are widely used in various fields of biology and medicine. Enzymes can capture hot electron–hole pairs triggered by plasmons and produce photothermal properties. A variety of metabolites can be determined and identified through the use of plasmon-stimulated biosensor array strategies [46]. Xu et al. [47] changed the shape of a gold nanopyramid through enzyme etching, thus realizing colorimetric detection of blood glucose. The color change in the characteristic solution can be detected by the naked eye, as shown in Figure 4, thus realizing the specific detection of glucose and making it possible to easily distinguish between healthy and diabetic patients. Wang et al. [48] constructed an effective three-channel colorimetric sensor array system for protein detection based on the plasmon resonance effect, the catalytic activity of Au nanoparticles (NP), and the etching of a Au nanorod (NR) by 3,3′,5,5′-tetramethylbenzidine2+ (TMB2+) (the catalytic product of TMB in the Au NP-H2O2 reaction). Different concentrations of TMB2+ promote different degrees of Au NR etching, and the local surface plasmon resonance band of Au NR is blue-shifted. This blue shift causes color to be displayed (gray, purple, blue, and pink), which can be clearly distinguished by the naked eye, as shown in Figure 5. Using polymerization behaviors, catalytic activities, and etching level as triple sensing channels for protein identification, pure protein and binary protein mixtures with different concentrations in urine samples can be effectively distinguished, providing another example of the realization of multiple readings. Compared with the traditional process of building a multi-dimensional sensor array, this approach provides a new idea that takes each step of the reaction process as the sensing element, thus simplifying the establishment of the sensing platform to the greatest extent. Mana et al. [49] have sensitively detected the tumor marker neuron specific enolase (NSE) through a label-free direct immunoassay based on a colorimetric plasmon biosensor. The limit of detection (LOD) of NSE was determined to be 270 pM, lower than the clinical threshold for the medical diagnosis of small-cell lung cancer.
Detecting the changes in LSPR of gold nanoparticles is a widely used method to develop colorimetric biosensors. This is usually performed using a large spectrophotometer, which is not suitable for field measurement, or by using the naked eye, which can only detect large spectral changes. Steven et al. [50] have shown that patterns printed on paper can be used as mobile devices to convert and read local surface plasmon resonance changes caused by plasmon nano-sensor aggregation. The sensitivity of the paper sensor was tested by a novel enzyme-free signal generation mechanism of the biosensor, which was based on triggering the aggregation of gold nanoparticles in the presence of neutral avidin. Neutral avidin is a modified version of avidin (a protein from egg white) with reduced positive charge, enabling lower non-specific binding while maintaining strong biotin-binding capability. The competitive immunoassay using this mechanism and the proposed sensor allowed for detection of the model analyte (C-reactive protein) within 1 h, with a detection limit of 3 × 10⁻⁸ g/mL. Pinheiro et al. [51] used non-enzymatic gold nanoparticle-based plasmons and colorimetric transduction to measure three related biomarkers in a paper matrix, without the use of any enzyme or other chromogenic substrates. It was shown that the simple in situ synthesis of gold nanoparticles on a paper substrate can be applied for the sensing of glucose and can be transformed into a paper microfluidic platform through reagent immobilization, further realizing the automation of the process and providing more user-friendly applications (see Figure 6). In glucose sensing, in situ synthesis of AuNPs offers several advantages, such as, enhanced sensor integration: AuNPs are grown directly on the sensor substrate (e.g., electrodes or optical surfaces), ensuring strong adhesion and uniform distribution, which improves signal stability and reproducibility. The high surface-to-volume ratio of in situ AuNPs increases the active sites for glucose oxidation or binding, amplifying the electrochemical or optical response. Also, in situ synthesis allows dynamic nanoparticle formation during sensing, enabling the real-time monitoring of glucose levels in biological fluids. In addition, the utility of drop-casting pre-fabricated plasmon gold nanoprobes with an affinity for target analytes in the measurement of uric acid and cholesterol was also confirmed, where the LOD obtained was equivalent to that obtained with other colorimetric and enzymatic methods proposed in the literature (10−5 M).
Lu et al. [52] proposed and developed a novel three-mode readout plasmon colorimetric immunosensor (PCIS) with small molecules (zearalenone) based on horseradish peroxidase polymer amplification and AuNS etching, as shown in Figure 7. The color change due to local surface plasmon resonance is based on AuNS etching and can be detected through three-mode reading. As this change is visible to the naked eye, the first mode can directly realize the on-site determination of zearalenone pollution and provides a basis for the preliminary evaluation of zearalenone levels. In addition, the smart phone and UV spectral modes allow for portable recognition and high precision, respectively. The three-mode reading approach can meet the requirements of zearalenone detection considering different needs and scenarios, and the LOD under the naked eye, smart phone, and UV spectrum modes are as low as 0.10 ng/mL, 0.07 ng/mL, and 0.04 ng/mL, respectively.

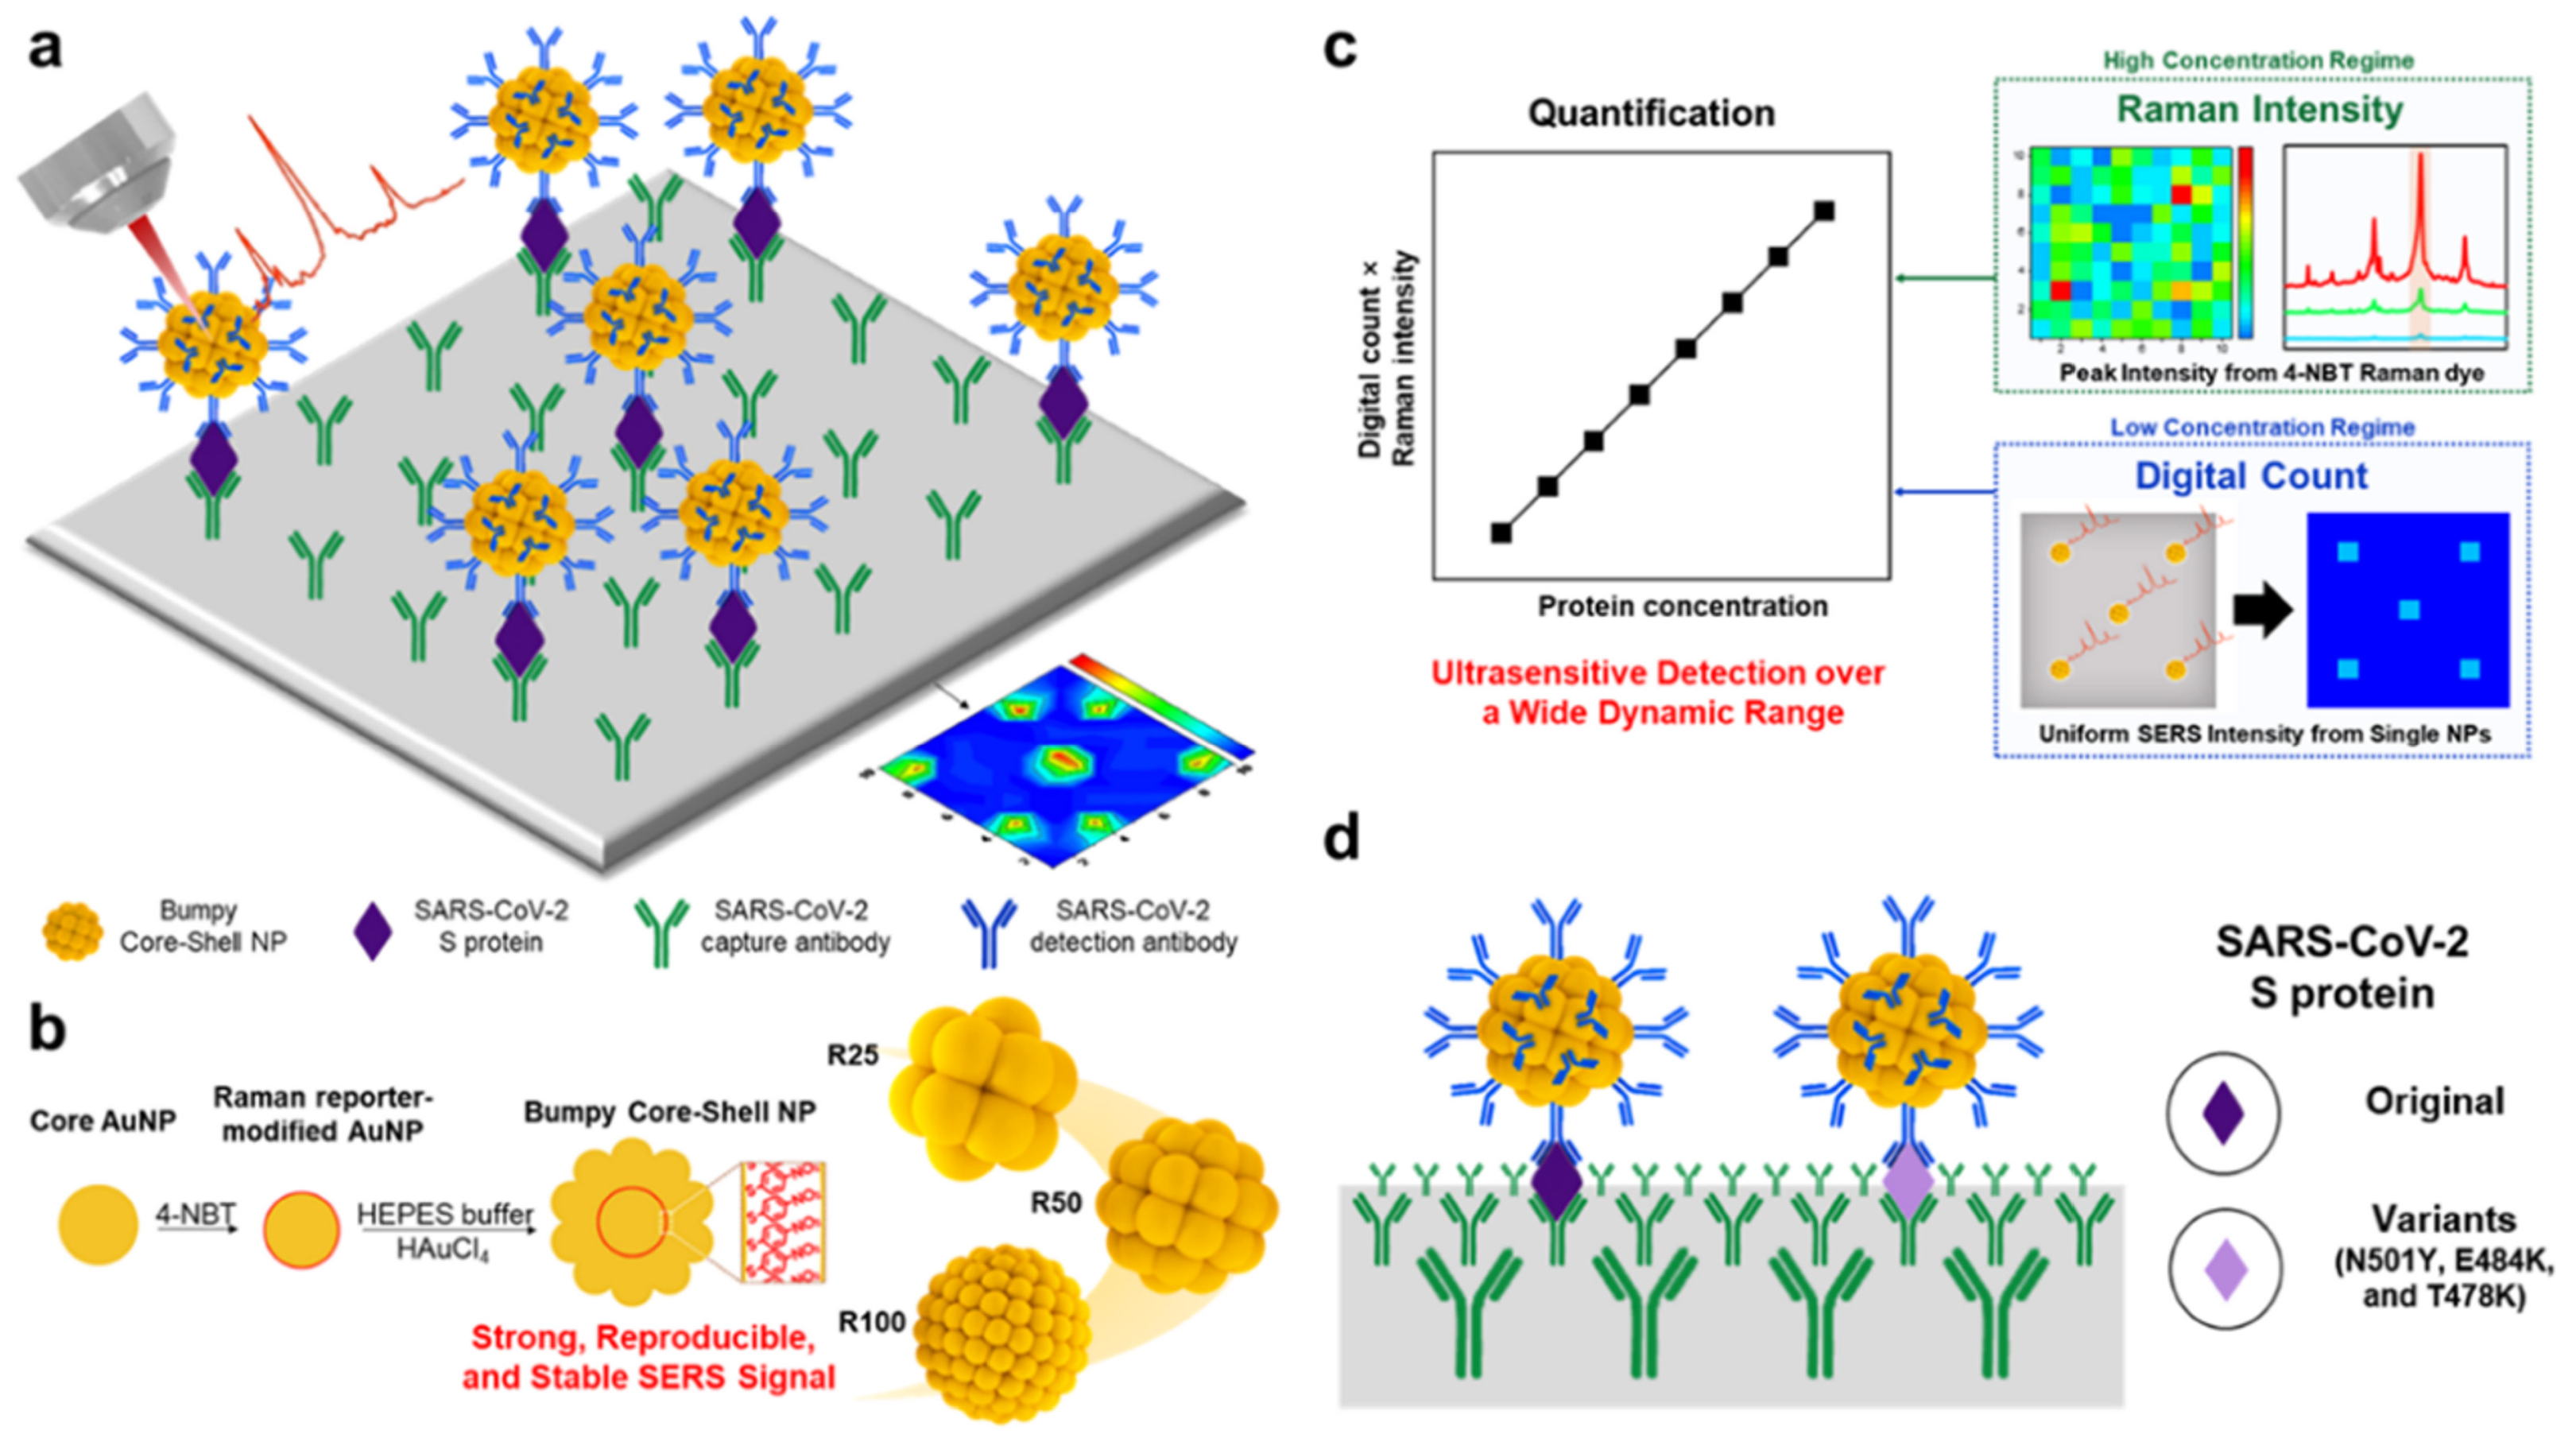
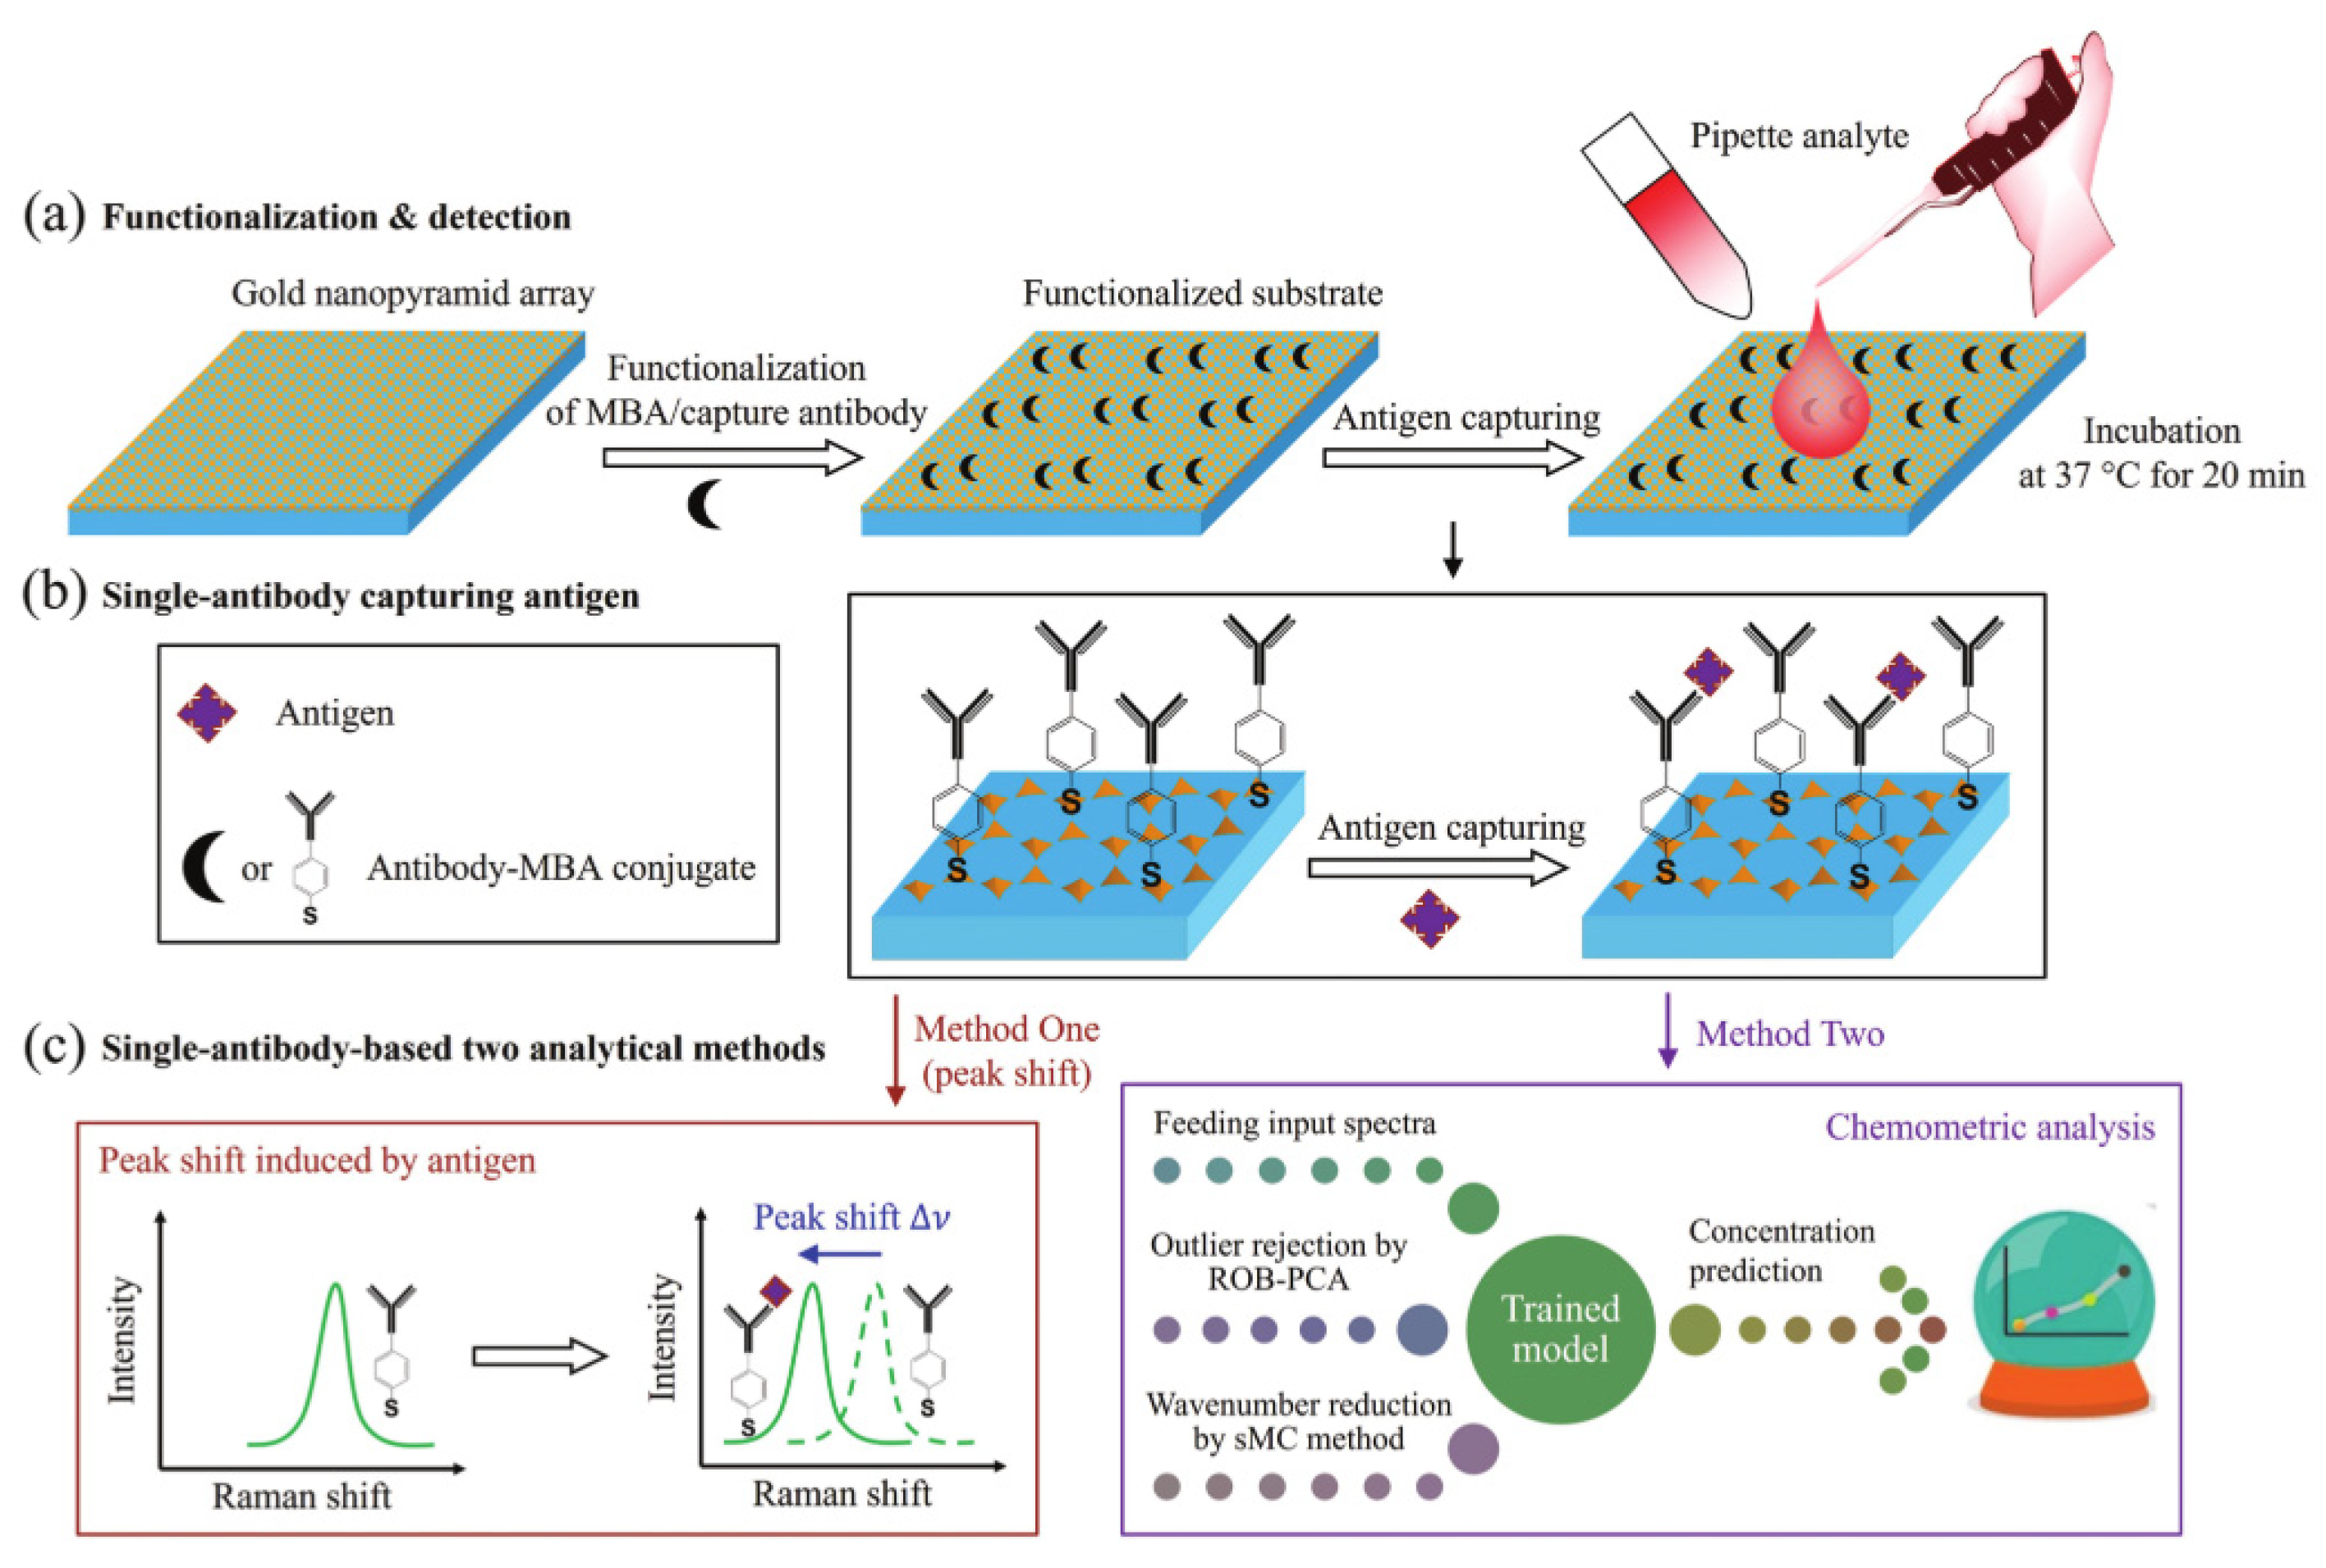
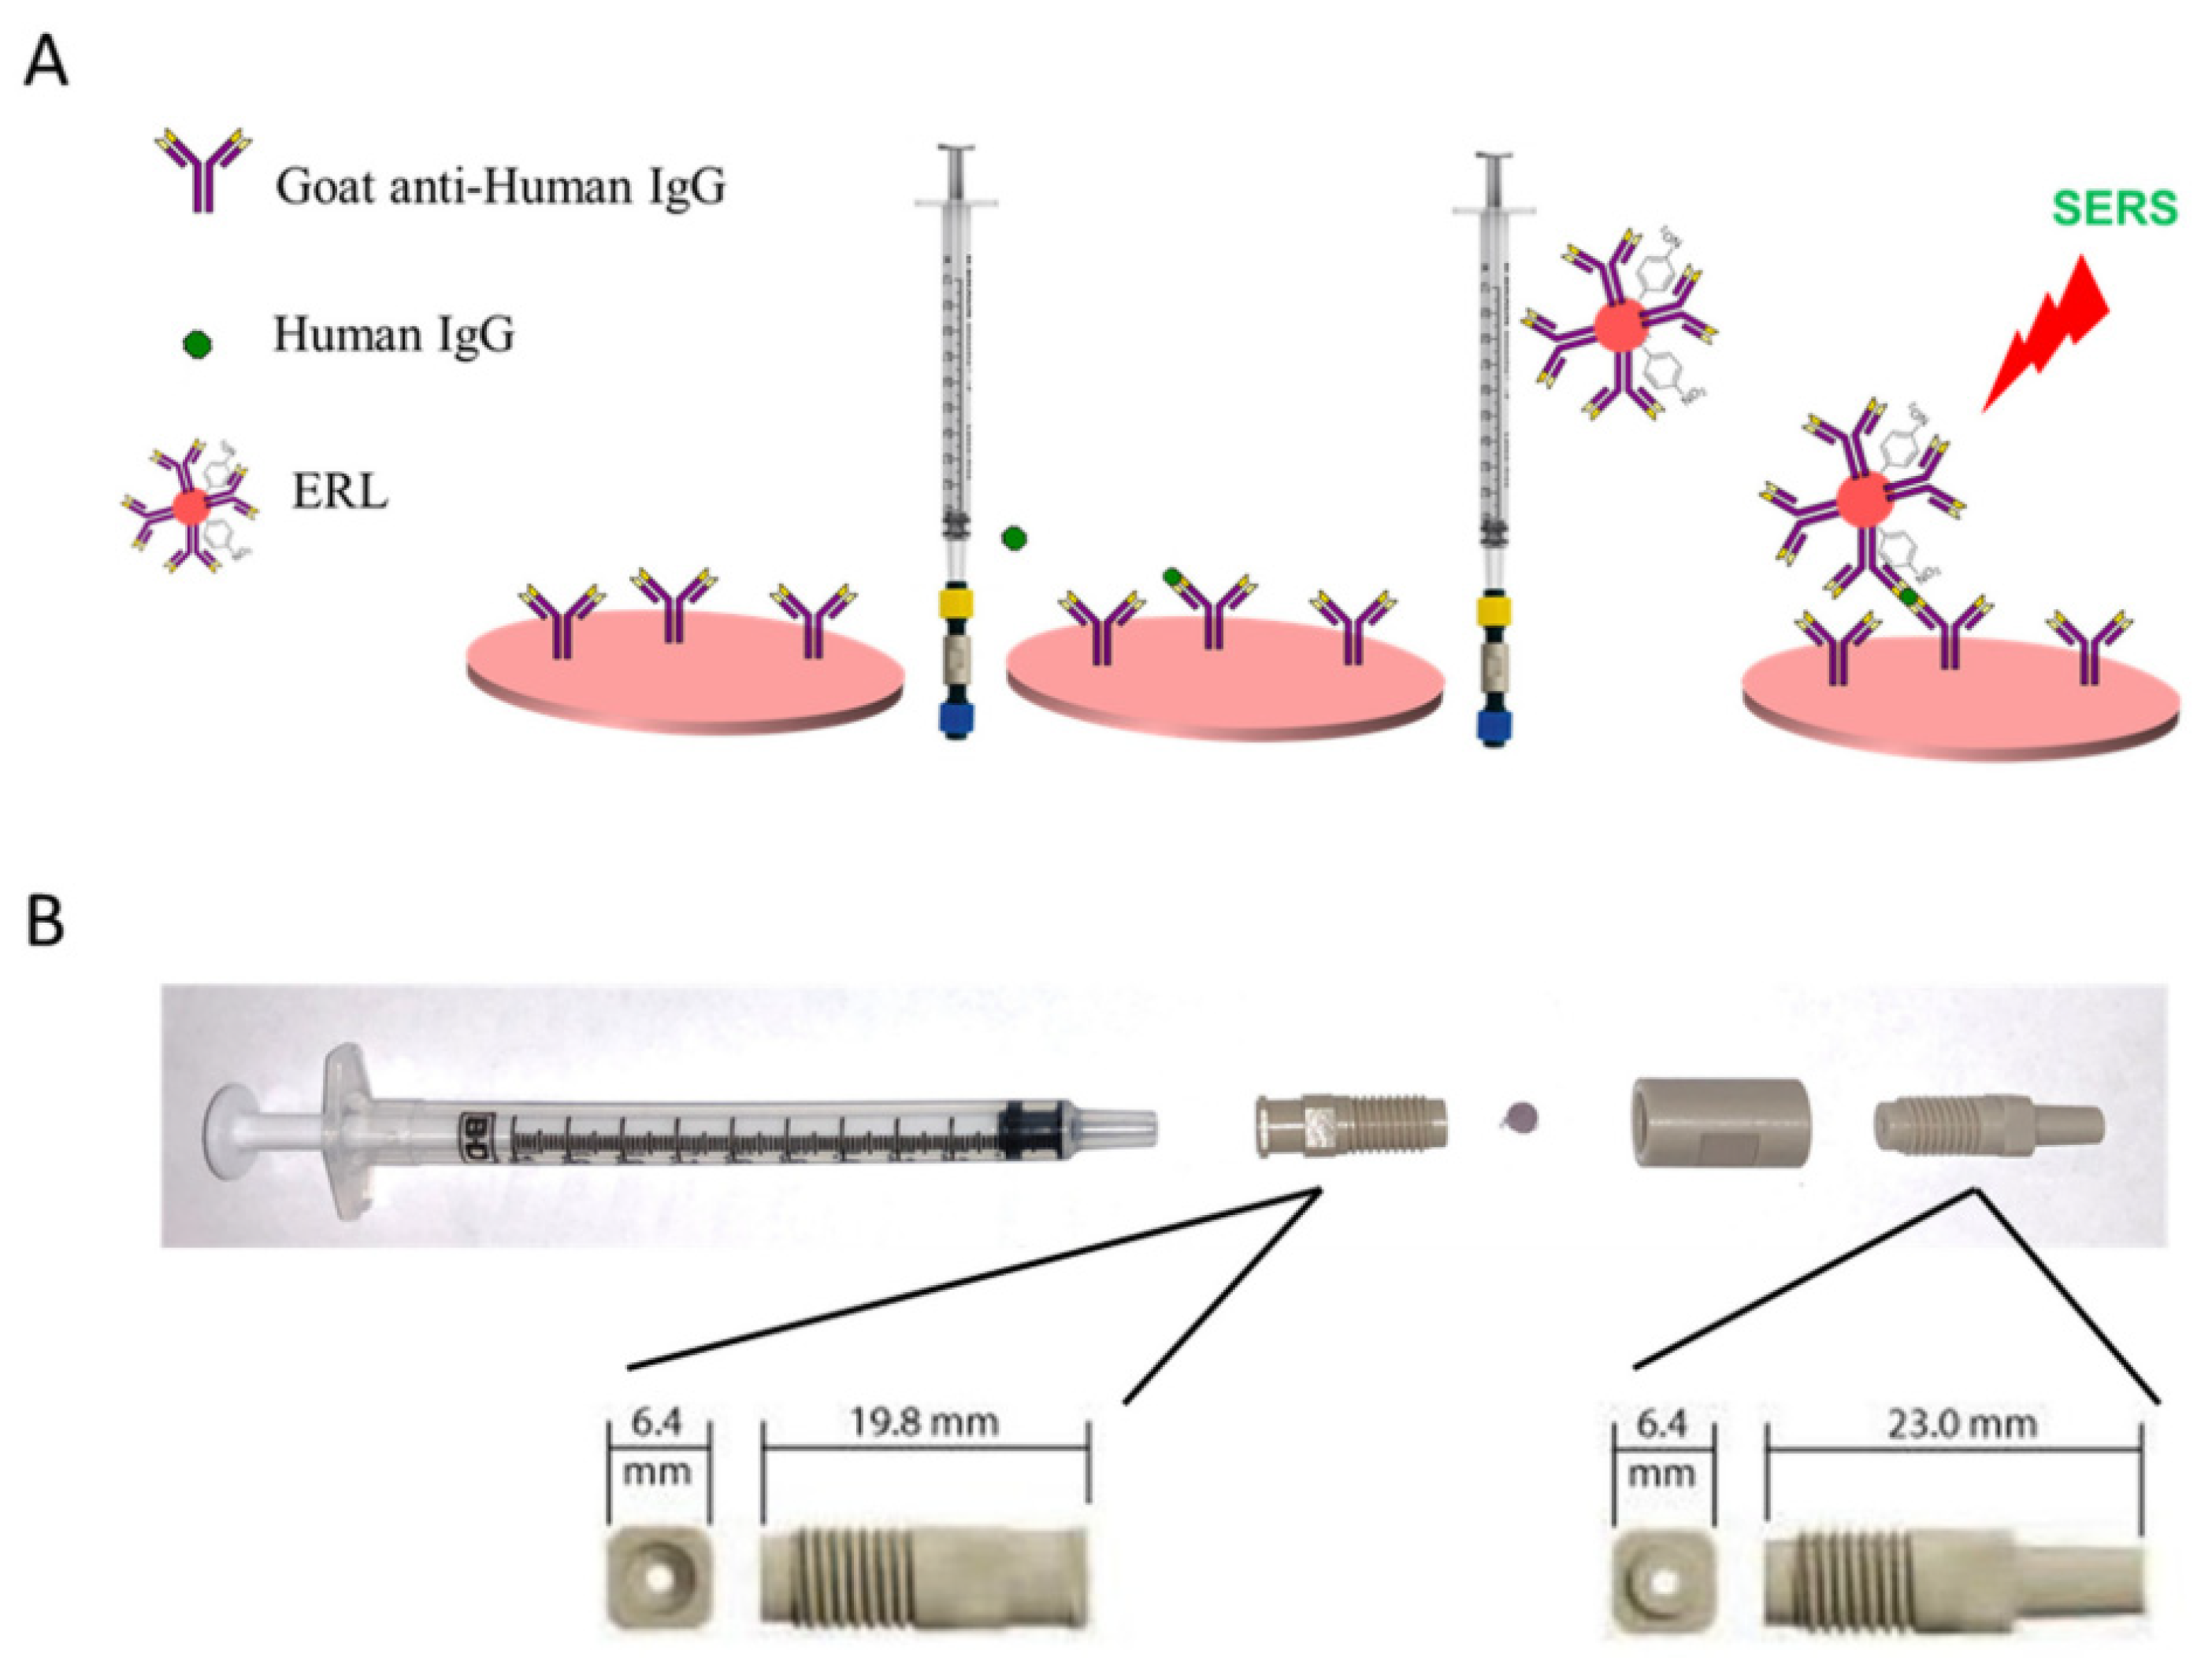
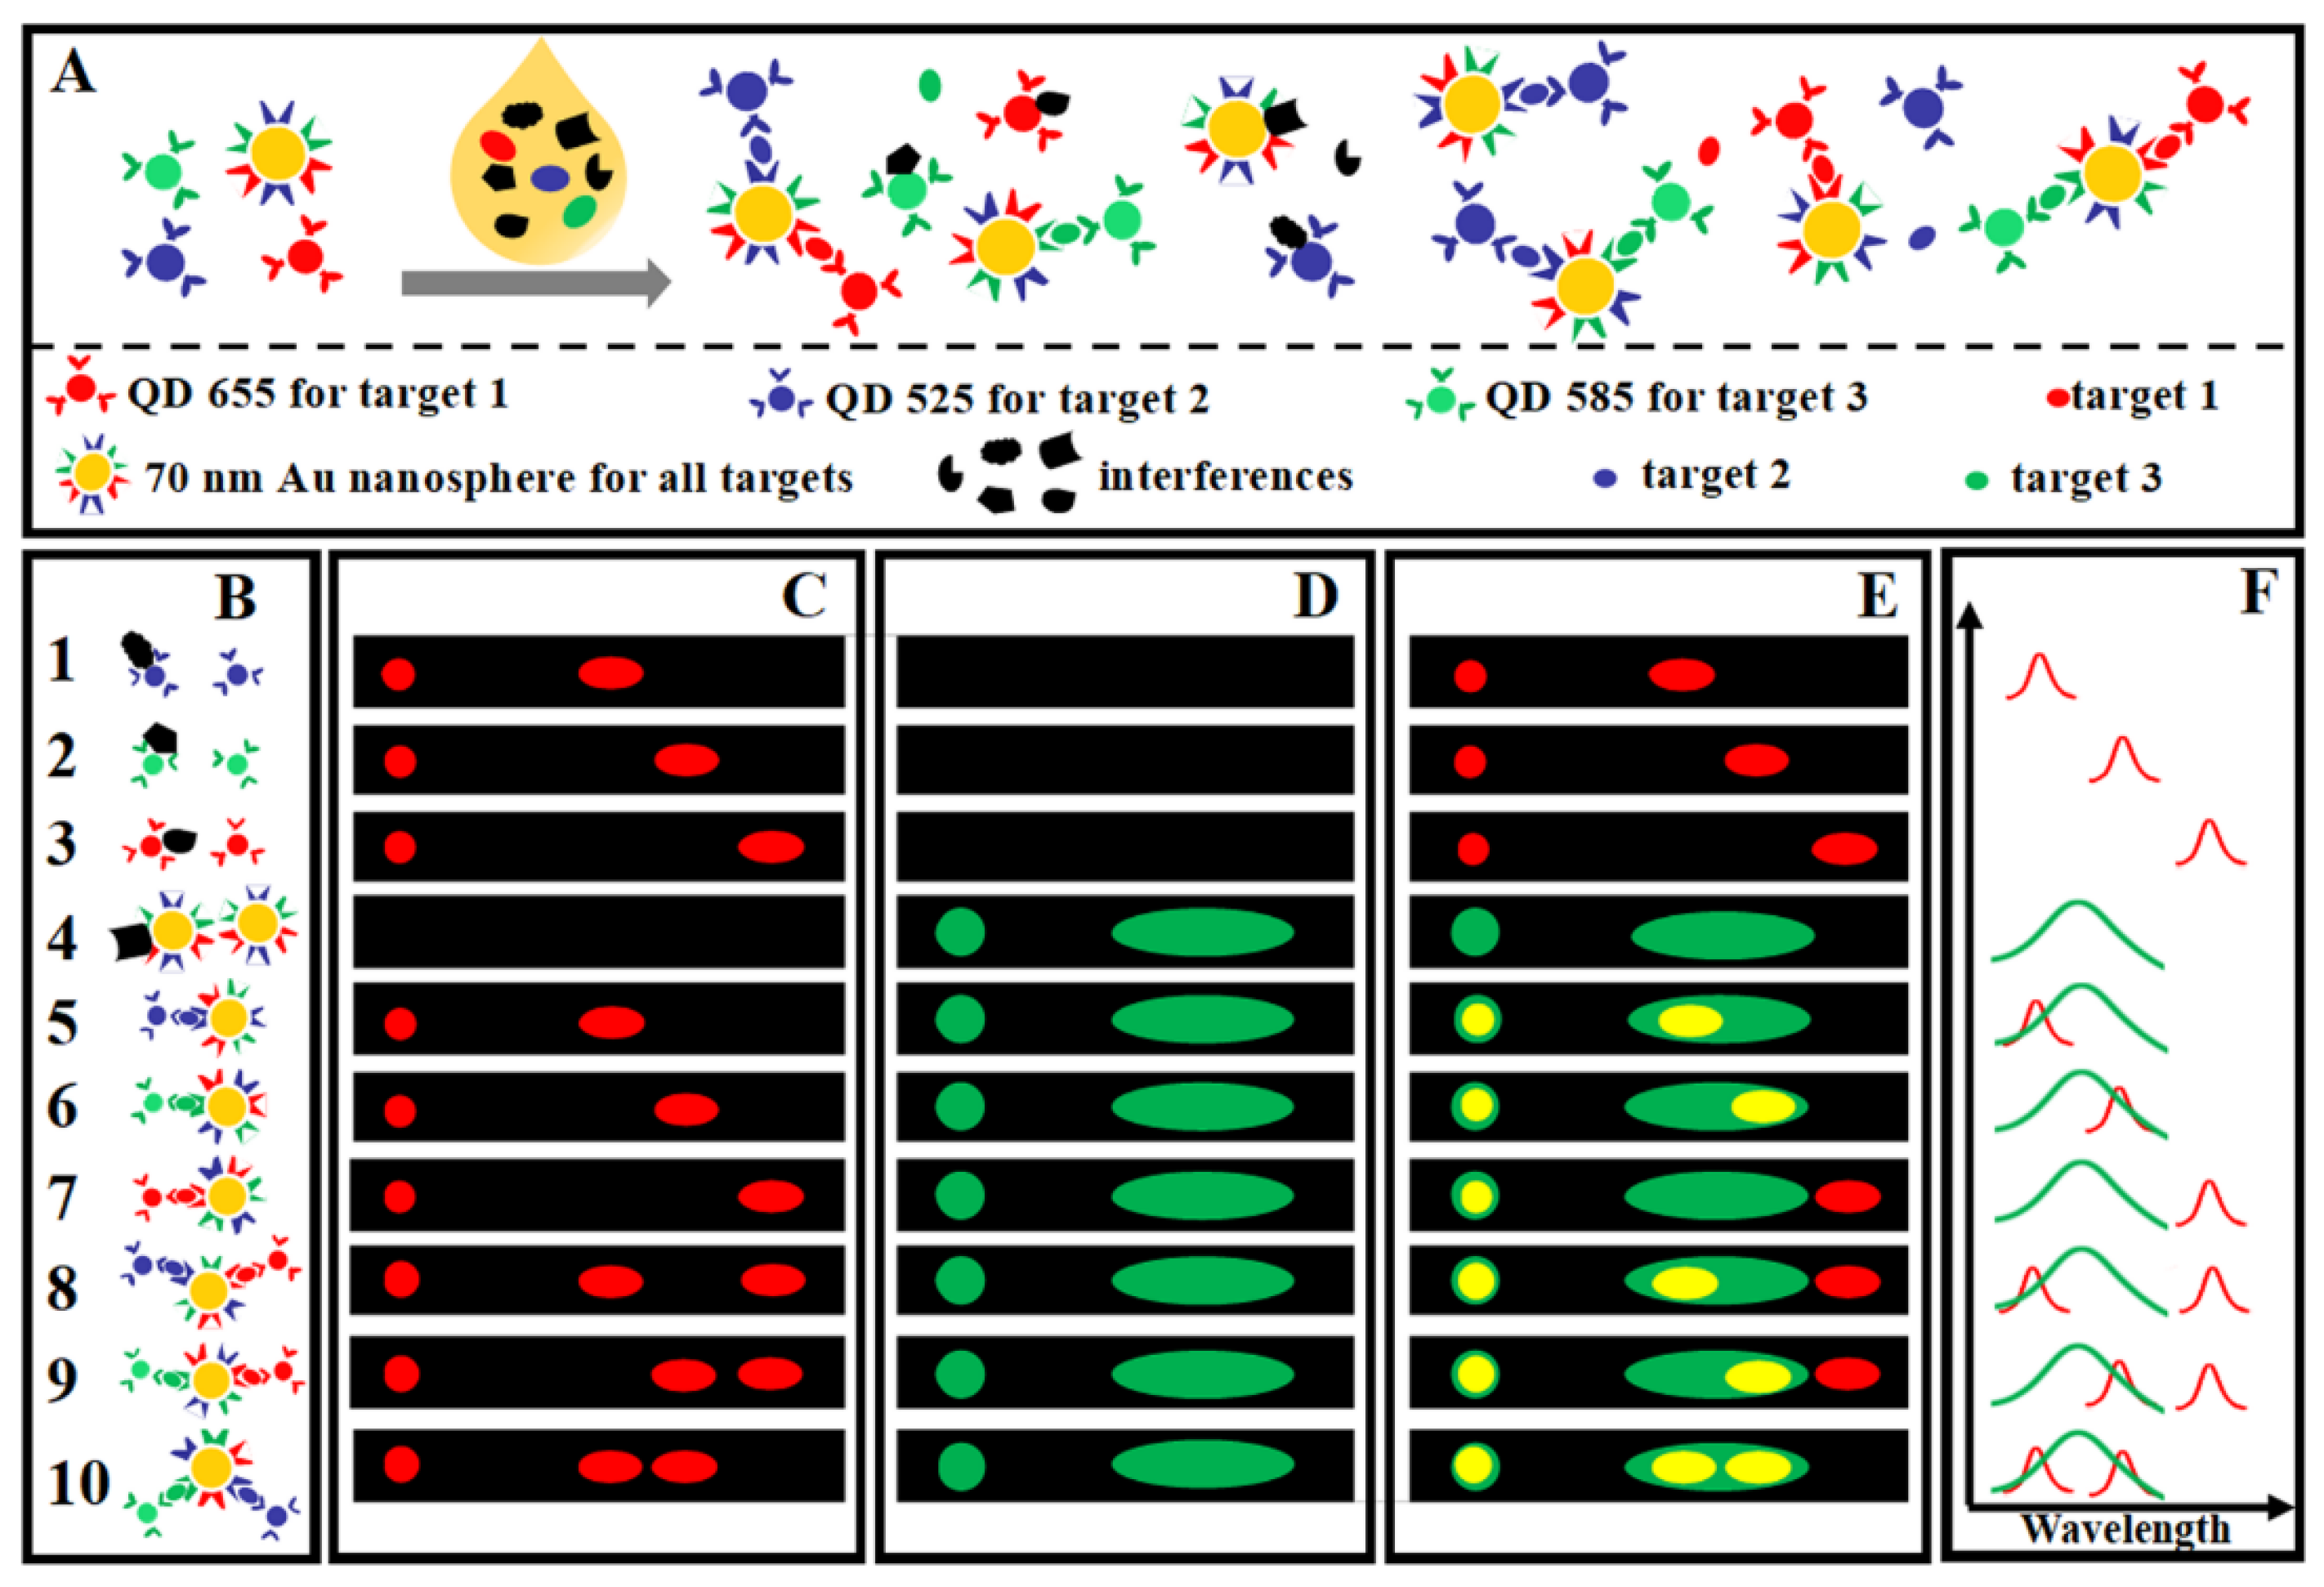
3.2. Surface Enhanced Raman Scattering

The peak position of the Raman spectrum is determined by the vibration frequency of each functional group, which is usually referred to as the fingerprint property of the Raman spectrum. As such, it can directly provide the fingerprint information regarding the molecule to be measured; however, a weak Raman scattering signal restricts its application. SERS helps to overcome this shortcoming, and has rejuvenated the applications of Raman spectra. In 1974, Martin Fleischmann et al. observed the Raman scattering enhancement of pyridine molecules near the rough surface of a Ag film [53]—a technique capable of dramatically amplifying the Raman scattering signals of molecules. The enhancement mechanisms used in SERS primarily include electromagnetic enhancement [15] and chemical enhancement [54,55]. When metallic nanostructures are irradiated with light, the free electrons on their surfaces undergo collective oscillations under the incident light, inducing LSPR. This resonance generates intense localized electromagnetic fields near the metal surface, which amplify the Raman scattering signals of molecules within these fields by several orders of magnitude. Meanwhile, chemical enhancement mechanisms arise from chemical interactions between molecules and the metal surface. When molecules adsorb onto the metal’s surface, processes such as charge transfer and electron cloud coupling between the molecule and metal can modify the molecule’s electronic structure, increasing its Raman scattering cross-section and thereby enhancing the Raman signal. During nanoparticle aggregation or assembly, nanoscale gaps formed between adjacent nanoparticles exhibit further amplified electromagnetic fields, known as “hot spots” [56]. In these regions, the Raman signals can be significantly enhanced, even enabling single molecule-level detection. Hot spots originate from electromagnetic coupling between nanoparticles, which leads to the concentration of fields in localized areas. Signal amplification is achieved by adsorbing or conjugating Raman reporter molecules onto nanoparticle surfaces. When nanoparticle-labeled antibodies or antigens bind to target molecules, the synergistic effect of numerous Raman reporters on the nanoparticle surface produces signals far stronger than those from individual reporters, significantly improving the sensitivity of detection. Nanoparticle surfaces offer abundant active sites for attaching multiple Raman reporters or functional molecules, enabling multiplex detection of diverse targets [44]. SERS-based sensing strategies can be categorized into direct and indirect detection modes. In the direct detection mode, the target antigen or antibody is immobilized directly on a SERS-active substrate modified with nanoparticles. The presence and concentration of the target are then determined by detecting the characteristic Raman signal. This approach is straightforward but offers relatively low sensitivity, making it suitable for high-concentration targets. The indirect detection mode typically employs sandwich immunoassays or competitive assays. In a sandwich assay, the capture antibody is immobilized on a nanoparticle-modified substrate. The sample containing the target antigen is added, allowing for antigen–capture antibody binding. A labeled detection antibody is then introduced, binding to another epitope of the antigen to form an antibody–antigen–labeled antibody sandwich complex. The target antigen concentration is quantified according to the reporter’s signal intensity. In a competitive assay, target antigens compete with labeled antigens to bind to antibodies immobilized on nanoparticles. The change in the Raman signal correlates with the target antigen concentration, making this method ideal for small-molecule antigen detection.
Olga et al. [57] have presented an extended single SERS nanoparticle library, which contains different types of nanoparticles with different optical properties and realized the multiple biomolecule detection of 26 markers. It can be seen that Raman spectroscopy has been successfully applied for the determination of complex samples, with the advantages of providing a fingerprint spectrum, strong anti-interference ability, simple sample preparation, wide measurable spectral range, and no influence of the water [58,59]. Xiong et al. [60] have reported a nanoparticle mirror coupled system (NPOM) plasmon sensor excited by surface plasmons. The uniform gap between nanoparticles and gold film and the arrangement of gap modes relative to the excited electric field led the substrate to possess uniform and strong SERS enhancement. The quantitative detection of alpha fetoprotein (AFP) was carried out, with a detection limit as low as 1.45 FM, while the detection sensitivity was 697 times higher than that under normal excitation without NPOM and 7800 times higher than the detection limit of a commercially available ELISA kit. Nana Lyu et al. [61] used gene coated and antibody-coupled gold nanoparticles (SERS nanotags) to obtain cell phenotypes, which produced characteristic Raman spectra under single-laser excitation, reflecting the existence of targeted surface marker proteins. Four cell surface proteins (EpCAM, EGFR, HER2, and HER3) were analyzed in KRAS mutant (SW480) and WT (SW48) cells. It was found that KRAS WT cells were more sensitive to EGFR treatment than KRAS mutant cells, and the expressions of HER2 and HER3 were significantly decreased, thus confirming the SERS analysis to be an effective alternative method for multiple characterization of cell surface biomarkers using a single-laser excitation system.
The intensity of the SERS signal is highly dependent on the interface interaction between the molecule to be measured and the plasmon nanostructure. Therefore, the maximum number of hotspots and the enhanced interaction between target molecules and effective hotspots are key parameters to determine the sensitivity of biosensors. The Raman scattering intensity can be significantly enhanced through adjusting the distances between nanoparticles or the sharpness of the edges of nanostructures [62], in which the optimal plasma effect was achieved by controlling the distance between the nanoparticles. Nanostructures, including their optical properties and laser excitation wavelengths, need to meet the coherent matching conditions. Anisotropic gold nanoparticles with maximum localized surface plasmon resonance performance in the wavelength range of 600–800 nm include those with nanostar, nanorod, and nanotriangle morphologies; however, it is difficult to achieve uniformly shaped nanostars [63], while nanorods take a long time to develop due to the need for multi-step synthesis [64]. In contrast, the synthesis of gold nanotriangles is relatively easy and fast, and they present a strong local surface plasmon resonance effect at their sharp edges [65]. Kim et al. [66] have used SERS technology to quantitatively detect adiponectin for early detection of gestational diabetes mellitus. They used the self-assembly strategy of mercaptan groups and the on-off strategy in the heat map to ensure the stability of the developed SERS immunoassay platform, showing a wide detection range of 10−15 to 10−6 g/mL, good reliability, and a femtosecond detection limit of 3.0 × 10⁻¹⁶ g/mL. The Raman signal can also be further enhanced through the use of post-processing methods such as denoising and background reduction algorithms [67]. Compared with simple or core nanoparticles, core–shell nanoparticles have lower cytotoxicity, better dispersion, biocompatibility, and stability [68], while providing better near-field enhancement and lower LOD. Shim et al. [69] realized ultrasensitive quantitative detection of the SARS-COV-2 spike protein using a sensing platform based on a concave–convex core–shell SERS nanoprobe and digital SERS analysis based on SNP. As shown in Figure 8, the detection limit in the wide dynamic range of 3.7 × 10⁻¹⁵ M to 3.7 × 10⁻⁸ M was 7.1 × 10⁻¹⁶ M, which is far better than that of the traditional ELISA method for detection of the target protein. Suman Dey et al. [70] used multiple gold nanoparticle cores (mostly Au@SiO2 Core @ shell nanoparticles) for improved SERS and electrocatalytic activity, and detected glucose successfully in 0.003 μA·μM−1·cm−2.
Compared with other methods, SERS-based immunoassays possess unique advantages. Due to the large enhancement of Raman signals caused by the localization and amplification of light excitation (and scattering) via surface plasmon resonance, the SERS system can reach the level of monomolecular sensitivity. Additionally, the Raman band is very narrow (several nanometers), allowing for efficient spectral coding and high-throughput multiple detection. This feature is in sharp contrast to the widely used detection methods (e.g., ELISA). At present, immunoassay design faces problems related to repeated incubation and washing, as well as the need for multiple types of antibodies to meet the requirements of sandwich immunoassays [71]. In response to this problem, Zheng et al. [72] have developed a universal single antibody plasmon immunoassay for the detection of serum biomarkers, and successfully detected TSH in goat serum and free T4 and testosterone in serum matrix, as shown in Figure 9. The theoretical basis of prism determination is that nanomechanical disturbances can be represented by SERS frequency shifts. It can be clearly observed with macromolecules in buffer solution or diluted serum matrix, while no obvious shifts can be observed due to small molecules; however, prism measurement allows hidden spectral changes to be captured based on stoichiometric analysis, enabling the accurate prediction of analyte concentrations. Detection based on single-antibody methods is expected to simplify the design of immune detection approaches—thus reducing their cost and enhancing their performance—through the integration of plasmon-enhanced Raman spectroscopy and chemometrics.
The use of rigid SERS substrates (e.g., glass and silicon) is challenging in practical applications, due to the complexity of protein binding processes. It is still necessary to develop a sensitive, lightweight, environmentally friendly, and easily manufactured SERS substrate. SERS substrates based on porous membranes have the advantages of easy modification, controllable pore size and shape adjustment, flexibility, and a large surface area. Nitrocellulose (NC) and polyvinylidene fluoride (PVDF) membranes are two solid-phase carriers, which have been widely used in the context of qualitative and quantitative immunoassays [73]. Wang et al. [44] used a PVDF membrane as a flexible support for the detection of glutamic acid decarboxylase antibody (GADA) and insulin autoantibody (IAA). Two kinds of silver gold core–shell nanotags embedded with Raman probes and attached with GADA or IAA antibodies were synthesized to capture the target. High sensitivity, high selectivity, and multiple quantitative detection of GADA and IAA were achieved. Both markers had a wide dynamic linear range, from 0.01 ng/mL to 100 ng/mL. Xiao et al. [74] developed a wearable surface-enhanced Raman scattering (SERS) microneedle sensor based on a microfluidic chip. Under the negative pressure generated by finger-pushing, the hollow microneedle array can extract subcutaneous liquid through the microfluidic channel and deliver it to the sensor room for SERS detection, where the detection limit of uric acid molecules was 0.51 µM.
Ariadne et al. [75] developed a sandwich immunoassay based on SERS to detect the SARS-CoV-2 S1–S2 spike protein in saliva. The LOD was 6.3 ng/mL (or 34.9 pM). Compared with traditional data analysis that do not use SERS, these indicators represent an 11-fold improvement. Zhu et al. [76] presented a multi-functional SERS platform, called the super wettable fully hydrophobically lubricated porous SERS substrate. The substrate can generate a three-dimensional liquid “hot spot” matrix with tens of days of ultra-long life by limiting a small amount of liquid in the gap between nanoparticles. The analytes were captured in a uniform liquid “hot spot”, and their biological activity could be well-maintained for a long time in the process of SERS detection. The detection limits for various molecules are as low as femtomolar. The SERS signal was uniform in the substrate and remained stable for more than 30 days.
Many SERS-based sensors have been developed for the detection of biomarkers, including SERS-based lateral flow immunoassay (SERS-LFIA) [77,78], aptamer gold nanoparticles-based analysis, and in situ fingerprinting of phosphorylated proteins or conformational changes in proteins. In particular, SERS-LFIA is a promising diagnostic technology which has been used to detect a variety of biomarkers. Zhang et al. [79] developed a colorimetric and SERS dual-mode magnetic immunosensor for highly sensitive, specific and robust detection of p-tau396,404 (phosphorylation of Tau protein at Ser396 and 404 site) in whole blood samples. The dual-mode immunosensor could detect p-tau at levels as low as 1.5 pg/mL in the bleeding fluid by the naked eye in SERS mode, and p-tau396,404 as low as 24 pg/mL in colorimetric mode. Liu [80] developed a self-calibrated SERS-LFIA biosensor for quantitative analysis of Aβ1-42 biomarkers in biological fluids, in order to achieve the accurate diagnosis of Alzheimer’s disease. The dynamic detection range was 0.1–50 nM and the LOD was 12.1 pM, indicating excellent anti-interference ability. Wang [81] used functionalized gold nanoparticles @ polystyrene microspheres microcavity as a SERS tag to perform visual high-sensitivity analysis of two cardiac biomarkers. The detection limits of cardiac troponin I and N obtained within 15 min were 1 pg/mL and 10 pg/mL, respectively. The results showed that, for the same biomarker, the sensitivity was 10–20 times higher than that of a standard colloidal gold test strip and fluorescent test strip. This novel quantitative LFIA demonstrated potential as a highly sensitive visual sensing method for related clinical and forensic analyses.
However, even the progress in terms of sensitivity and multiple capabilities cannot resolve the inherent limitations of LFIA design, such as the effect of low sample size, false negatives caused by hook and excessive antibodies and/or antigens, low reuse ability, and an average detection time of 5–30 min. To solve the limitations associated with LFIA, researchers have made continuous efforts to develop vertical flow assay (VFA) approaches. Early VFA relied on visual reading for detection, limiting both the LOD and clinical accuracy. SERS detection has been effectively combined with VFA to make full use of the advantages of SERS detection and the VFA format. Clarke [82] first used a commercially available nitrocellulose vertical flow device and functionalized spherical gold nanoparticles as SERS tags, introducing the concept of VFA based on SERS. To improve the sensitivity of determination, core–shell nanostructures were incorporated into VFA, and an LOD of less than 1 pg/mL was achieved [83]. Eunice et al. [84] designed a rapid detection system using a plasmon syringe and SERS, as shown in Figure 10. The VFA uses filter paper embedded with gold nanoparticles to form a plasmon substrate, then fixes the capture antibody (i.e., anti-human IgG) on the prepared plasmon filter paper and inserts it into the vertical flow device. The sample solution passes through the filter paper and selectively captures the target antigen (human IgG) via the immobilized antibody to form an antibody–antigen complex. Next, the functionalized AuNP is used as an external Raman label (ERL) through the filter paper, in order to mark the captured biomarker molecules to form a hierarchical structure. The novel measurement design promotes multiple sections of the sample and solution, marked through the detection area, which can speed up the investigation and maximize the sampling efficiency through investigation of the captured substrate. This sandwich geometry enhances the plasmon coupling and SERS signal, achieves a detection limit of 0.2 ng/mL, and has a total time for the optimal determination of human IgG of less than 5 min.
Many SERS biosensors rely on increasing the number of Raman reporter molecules on the surface of individual nanoparticles, which may lead to nanoparticle aggregation, thereby reducing the stability and sensitivity of detection. Zhang et al. [85] have proposed a class of immune sandwich multi-hotspot SERS biosensors based on molecularly imprinted polymers and nucleoside diphosphate kinase A (NDKA) antibodies, as shown in Figure 11, using a series of gold nanoparticles coated with biocompatible polydopamine molecularly imprinted polymers as substrates, specifically designed to capture NDKA. Due to the specific binding of NDKA to SERS nanotags fixed on the capture substrate and the formation of multiple hotspots, the biosensor detects NDKA through Raman signals. This SERS biosensor not only avoids the aggregation of nanoparticles, but also provides a solution to the obstacles encountered in immune strategies for proteins lacking multiple antibody or aptamer binding sites. The detection of NDKA in serum and mixed protein solution resulted in LODs of 0.25 pg/mL and 10 ng/mL, respectively, confirming the high sensitivity and specificity of the designed SERS biosensor.
Ratio immunosensors can reduce signal instability in SERS detection and improve the reproducibility of analytical methods. Given the high efficiency and universality of the ratio redox cycle method, Zhao et al. [86] introduced a chemical–chemical redox cycle amplification strategy into the SERS sensing field and combined it with a ratio-based SERS immunoassay to improve the sensitivity of cardiac troponin I detection. The linear range was 0.001 to 50.0 ng/mL, with detection limits of 0.33 pg/mL (based on I1077/I822) and 0.31 pg/mL (based on I635/I822).
Wallace et al. [87] combined SERS with supervised machine learning and introduced a simplified SERS nano-biosensor to accurately detect SARS-CoV-2 antigen using supervised machine learning methods. A high precision of 96% to 100% was achieved in antigen detection. This study lays the foundation for future advancements in biosensor technology and opens up new avenues for developing sensitive and efficient diagnostic tools utilizing machine learning.

3.3. SPR Enhanced Fluorescence

Fluorescent molecules located near hot spots also have enhanced absorption and emission characteristics and, so, hot spots can also achieve the significant enhancement of fluorescence emission [88]. Antonio et al. [89] described a plasmon-enhanced fluorescent immunosensor for the detection of plasmodium falciparum lactate dehydrogenase (PfLDH, a marker of malaria) in whole blood. Analyte recognition is achieved via photochemical immobilization (PIT) of targeted antibodies immobilized in tightly packed structures. The top biological receptors of aptamers recognize different surfaces of PfLDH in the sandwich conformation, thus maximally controlling the size and lattice constant of nanoparticles and the distance between the fluorophore and the sensing surface. The detection limit of the device is less than 1 pg/mL (<30 FM) without any sample pre-treatment, and its specificity is very high. Kara et al. [90] fabricated gold nanorods with a length of 35 ± 2 nm and a width of 17 ± 2 nm, and used fluorescent plasmon enhancement to detect the real-time binding of meso-tetra (N-methylpyridyl) porphine (TmPyP4) and G-Quadruplexes (GQs). Licy et al. [91] measured and correlated two spectral signals through collecting Raman scattering and fluorescence spectra at the same time, in order to realize multi-spectral detection and real-time detection of the bond-breaking reaction between xanthene and phenyl. Vien et al. [92] quantitatively measured cardiac troponin I using a sandwich immune response based on fluorescence. Surface plasmon-coupled emission was generated through non-radiative coupling between dye molecules and surface plasmons, which can be excited via the reverse Kretschmann scheme. The surface plasmon-coupled emission fluorescent chip uses a gold (2 nm)–silver (50 nm) bimetallic film, Alexa 488 molecule (combined with detection antibody) as a dye. The results showed that surface plasmon-coupled emission could inhibit photobleaching through enhancing the fluorescence signal (up to 50 times) and greatly improved the sensitivity, which significantly improved the signal-to-noise ratio, with the detection limit reaching as low as 21.2 ag/mL. Fluorescence quenching immunoassays have attracted increasing attention due to their high signal-to-noise ratio. Among them, the polychromatic fluorescence quenching method has great advantages in detecting multiple targets. Lai et al. [93] proposed a seedless co-growth method modulated by polydopamine (PDA) to synthesize a highly branched chrysanthemum-shaped anisotropic plasmon blackbody (APB), in order to achieve efficient ultra-broad-spectrum quenching, and used the APB to establish a sensitive multicolor fluorescence quenching immunochromatographic method. The LODs of chloramphenicol and sulfamethazine in milk were as low as 0.0045 and 0.038 ng/mL, respectively.
Due to intense fluorescence quenching, PCR based on plasmon nanoparticles requires additional post-processing steps, such as centrifugation and gel electrophoresis. This process increases the overall diagnostic time, thereby offsetting the benefits of rapid thermal cycling. Wu et al. [3] have reported a rapid and sensitive in situ based plasmonic photothermal PCR (PPT-PCR) analysis method for endpoint fluorescence detection. Using plasmonic magnetic bifunctional nanoparticles, PPT-PCR involves 30 thermal cycles and fluorescence detection after magnetic separation, allowing the DNA target to be successfully detected within 5.5 min. The detection limit (3.3 copies per μL) is comparable to conventional real-time quantitative PCR, but the detection time of PPT-PCR is shorter by about 5.5 times.
Fluorescence lateral flow assay (LFA) is a tool in POCT systems that has attracted attention due to its speed, simplicity, and convenience. However, the samples and constituent materials may exhibit spontaneous fluorescence in the visible light region, which is a significant obstacle to the development of such approaches. The spontaneous fluorescence of biological samples is almost undetectable in the second near-infrared (NIR-II) range, and the NIR-II light scattered and absorbed by the samples is less than visible light. Therefore, Kuhan Deng et al. [94] have reported a NIR-II QD-LFA platform that uses NIR-II fluorescent Ag2Se quantum dots with an emission wavelength of 1020 nm, packaged in polystyrene beads as a fluorescent probe, which could detect breast cancer tumor markers (CEA and CA153) within 15 min. The detection limits of CEA and CA153 were 0.768 ng/mL and 1.192 U/mL, respectively; in addition, the recovery rate is high (93.7–108.8%) and the relative standard deviation (RSD) is less than 10%.
Plasmon phosphors are a class of super-bright reporter molecules [95]. The combination of nanorods and traditional fluorophores can effectively improve the overall analytical sensitivity. Abraham et al. [96] used plasmon fluorescence LFA to rapidly and quantitatively detect the glycoprotein secreted by Ebola virus (an infection marker), and detected Zaire Ebola virus and Sudan Ebola virus with detection limits as low as 0.446 ng/mL and 0.641 ng/mL, respectively. Anusree et al. [1] used ultra-bright plasmon fluorescence as a “digital nano label”, and the resulting digital plasmon fluorescence-linked immunosorbent assay (digital p-FLISA) detected SARS-CoV-2 nucleocapsid protein in solution and live virus particles, realizing quantitative detection of the target protein at very-low concentration. The detection limit of the digital p-FLISA was 7000 times lower than that of ELISA, and its sensitivity was 5000 times higher than that of a commercial antigen test.

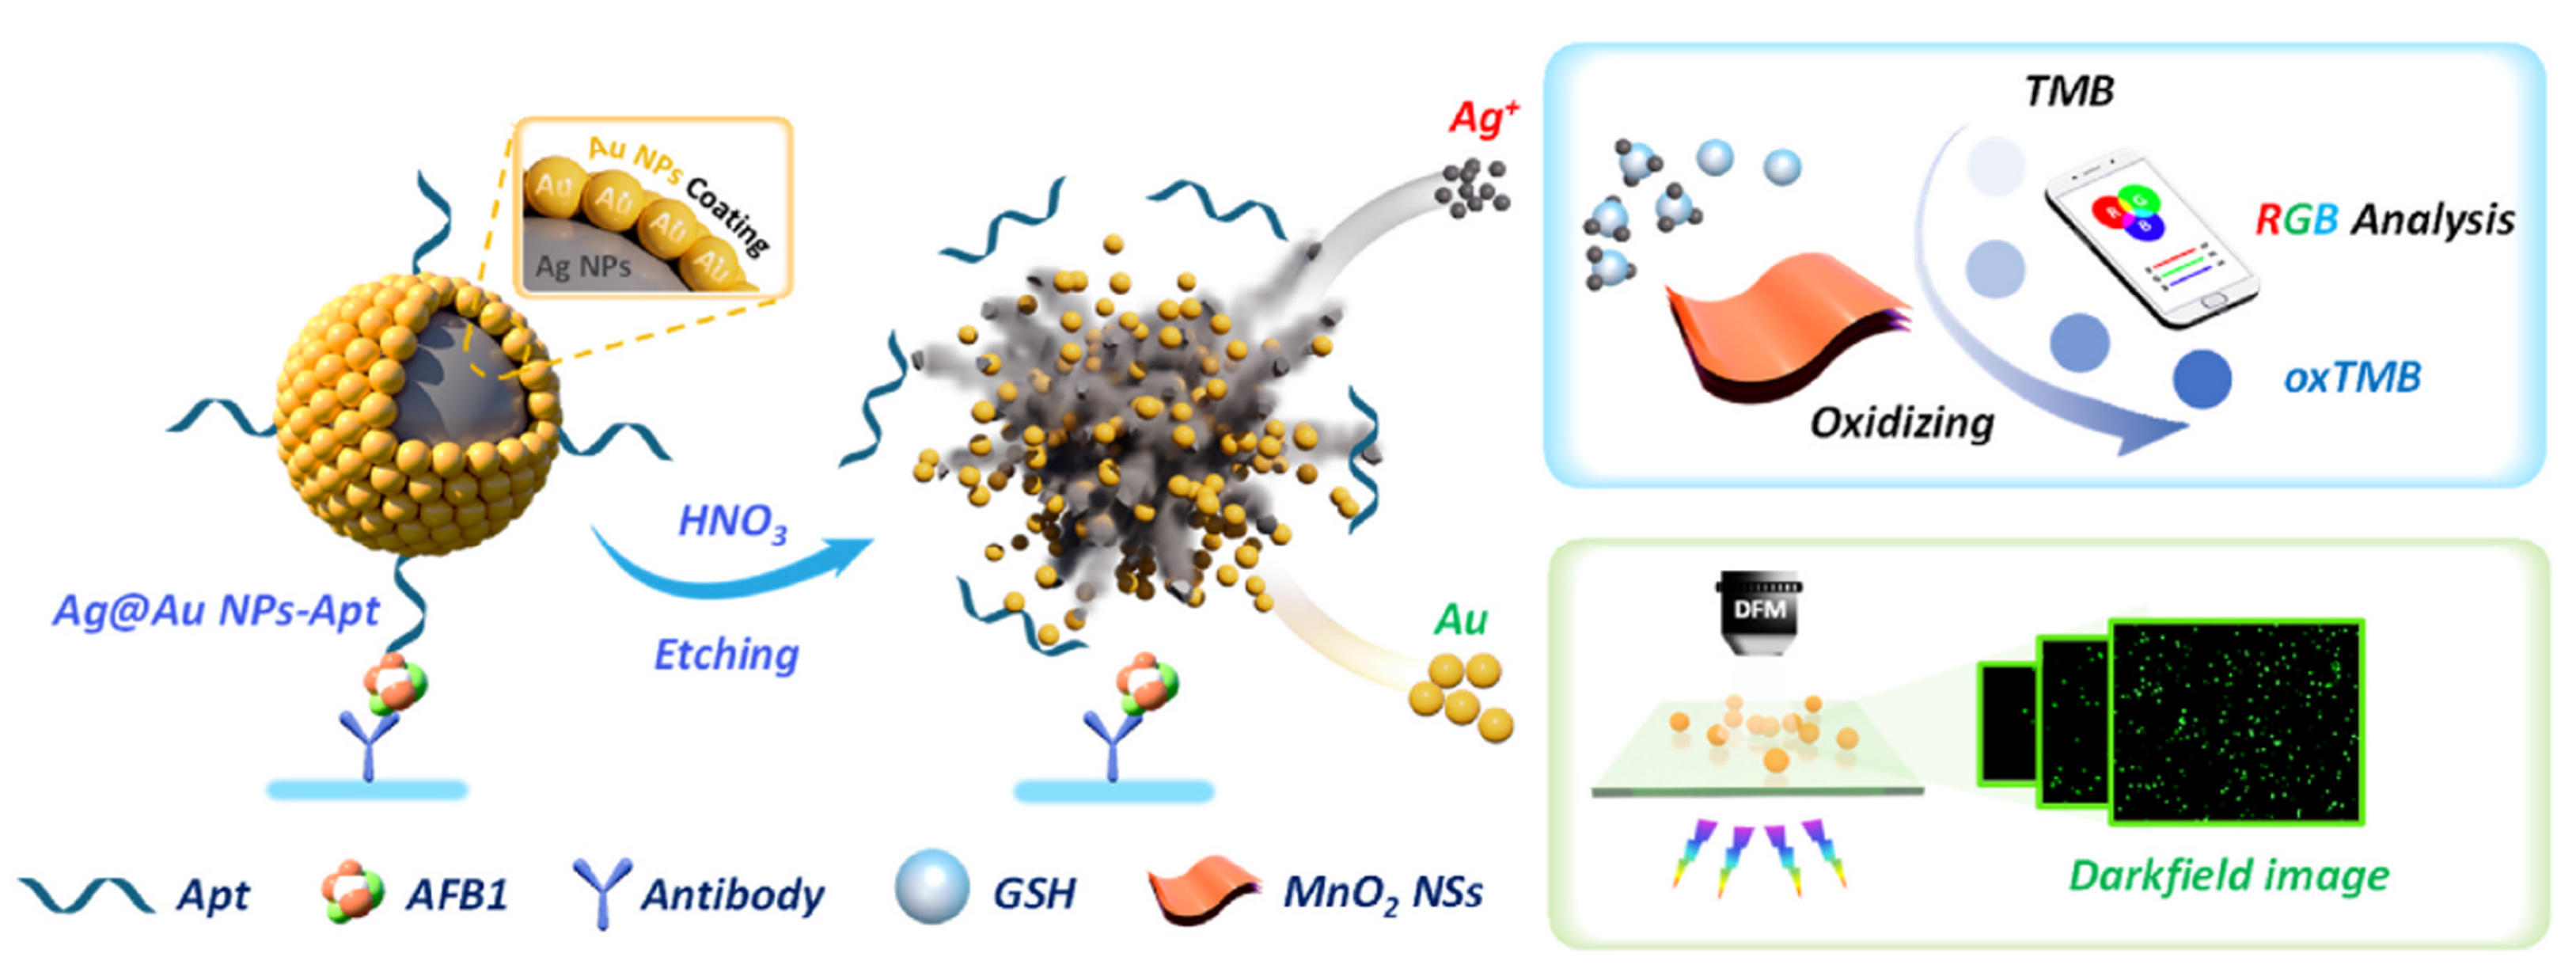
3.4. Dark Field Detection

Under the excitation of visible or near-infrared light, metal nanoparticles exhibit strong light absorption or scattering at some wavelengths due to local surface plasmon resonance. Therefore, nanoparticles show different colors under a light dark-field microscope (DFM) [97]. By functionalizing nanoparticles with specific capture agents, the concentration of biomarkers can be quantified according to the number of NPs [98,99]. However, it is not easy to calculate the number of NPs under a DFM, as the background scattered noise surface from the sample substrate or dust on the substrate can significantly reduce the signal-to-noise ratio. The key to this problem is that the scattering intensity of single metal nanoparticles on typical glass or silicon substrates is not strong enough due to the finite dipole moment of surface plasmon resonance. Therefore, the sensitivity and reproducibility of DFM-based biosensors using NP counting are limited. Xu et al. [99] have reported a novel method for ultrasensitive detection of ochratoxin A (OTA) based on the combination of single nanoparticle recognition and a statistical analysis method based on dark-field microscopy. The OTA aptamer was first hybridized with single stranded DNA (DNA1) to form a recognition probe (DNA1 APT). In the presence of OTA, the aptamer was separated from DNA1 and released from the recognition probe. Then, another single-stranded DNA (DNA2) was hybridized with DNA1, resulting in the aggregation of AuNPs. Therefore, the existence of AuNP aggregates serves as evidence for the existence of OTA, where these AuNP aggregates can be easily identified with monomers under a dark-field microscope. OTA can be quantitatively detected by calculating the aggregation rate (the number of AuNP aggregates and AuNP monomers) through statistical analysis. The detection range for OTA ranged from 0.1 pg/mL to 30 ng/mL, and the detection limit was 0.1 pg/mL. The sensor had similar detection performance to a sensor using a variety of signal amplification programs while presenting the additional advantages of simplicity and efficiency. Qian et al. [100] used a gold nanorod probe under DFM to assist in counting, and prepared an antibody-functionalized silicon chip to capture porcine epidemic diarrhea virus (PEDV) and form a sandwich structure with a gold nanorod probe for imaging under DFM.
Zheng et al. [101] developed a vision method based on spectral angle mapping (SAM) and dark-field microscopy for the rapid detection and quantification of Escherichia coli. First, immunomagnetic nanoparticles (MNPs probe) and gold nanoparticles (AuNPs probe) were prepared to form a sandwich complex, effectively concentrating the target bacteria. Then, the complex was directly dropped on a glass slide and the colony count was performed under hyperspectral dark-field microscopy. The AuNP probe combined with the complex was counted, and the spectral and HSI image data were evaluated, using SAM to distinguish the target pixels from the background. The linear detection range of this method was estimated to be between 6.1 × 101 and 6.1 × 10⁶ CFU/mL in milk samples, while the LOD was 61 CFU/mL. The average recovery rate of microorganisms in milk samples was 106.0%. Zhou et al. [102] constructed a colorimetric ultrasensitive detection of carcinoembryonic antigen (CEA) based on the dimer structure of AuNPs induced by adjacent hybridization. In the presence of antigen, the target protein reacts with the capture probe, triggering the production of immune complexes and leading to the adjacent hybridization of DNA1 and DNA2. This alters the distance between particles and leads to the formation of AuNP dimers, thus presenting different colors under a dark-field microscope (as shown in Figure 12). The detection limit for CEA was 14.25 pg/mL.
High-quality imaging methods are a prerequisite for accurate diagnosis, which largely relies on the reagents used. Reagents with modified structures can achieve various forms of high-intensity and high-sensitivity signals; however, most work in this regard is limited to laboratories. Complex structures often lead to complex production processes and high material costs; in contrast, a wide range of applications, cheap reagents, mature equipment, and simple operations are preferred. Jin et al. [103] performed ultrasensitive detection of tyrosinase (TYR) using a click reaction combined with dark-field microscopy. Cu2+ was reduced by ascorbic acid (AA) to form Cu+. The formed Cu+ can catalyze crosslinking between gold nanoparticles functionalized with azides and alkynes, resulting in a significant red-shift in the scattering spectra. This method showed a good linear detection range of 0.01–0.8 U/L and a low detection limit of 0.003 U/L. Ken et al. [104] synthesized AuNPs using reduced bovine serum albumin (rBSA) as a reducing agent. rBSA binds to AuNP through Au-S interactions, forming rBSA-functionalized AuNPs. The rBSA portion on the surface of rBSA-functionalized AuNPs interacts with anti-BSA antibodies to induce aggregation of the AuNPs, enabling the successful detection of anti-BSA concentrations as low as 20 nM under DFM. Fan et al. [105] used 3,3′-diaminobenzidine (DAB)—a conventional color indicator for immunohistochemistry—as a novel high-sensitivity scattering reagent that can provide multi-dimensional image signals that vary with the over-expression rate of tumor markers. Based on the scattering characteristics of DAB aggregates, an efficient and robust artificial intelligence-assisted immunohistochemistry method based on dark-field imaging was established. Compared with traditional manually operated immunohistochemistry methods, the imaging quality and interpretation efficiency were improved. This method successfully detected HER2-overexpressing breast tumors with a sensitivity of 95.2% and specificity of 100.0%; meanwhile, it was also shown to be applicable to non-small cell lung tumors and malignant lymphomas.
As shown in Figure 13, Liu et al. [106] simultaneously counted the immune complexes of core–satellite structures using dark-field and fluorescence microscopy, and selected tumor biomarkers such as carcinoembryonic antigen (CEA), alpha fetoprotein (AFP), and prostate-specific antigen (PSA) as model targets. AuNPs with a diameter of 70 nm were coated with three target detection antibodies. Then, immune complexes containing one AuNP and one or more QDs were formed, while free and non-specific binding probes had one AuNP or one QD. When observed using a transmission grating-based spectral microscope, the immune complexes have overlapping scattering and fluorescence spectral images, which can be accurately identified and quantified. The biomarkers within the immune complex are identified based on the fluorescence first-order stripes of quantum dots. The model biomarkers were quantified in a buffer solution and 12.6% blank plasma for validation. The detection limits of CEA, PSA, and AFP in a buffer solution were on the order of several tens of moles, close to the detection limit in blank plasma. Zhang et al. [107] designed a dual-mode strategy for detecting MAO-B using dark-field light scattering imaging and colorimetric methods. In colorimetric analysis, there is a linear relationship between the blue-shift in the UV absorption peak and the concentration of MAO-B in the range of 0.01 to 1.0 ug/mL. In dark-field scattering analysis, the peak shift in localized surface plasmon resonance was shown to be linearly correlated with the MAO-B concentration in the range of 0.5 to 20.0 ng/mL.
Zhao et al. [108] integrated smartphone analysis and DFM observations to detect aflatoxin B1 (AFB1) using core–shell structured Ag@Au NPs. AFB1 aptamers were assembled in a sandwich assay format with Ag@Au NPs, then anchored on a 96-well plate and disintegrated with nitric acid. The Ag core was etched, releasing Ag+, which acts as a colorimetric signal regulator. Smartphones were then used to analyze the color signals based on red, green, and blue value analyses. The collapsed gold shell releases individual gold nanoparticles, which act as dark-field scattering nanoprobes and generate high-intensity green dark-field scattering signals under DFM observation, as shown in Figure 14. The detection limit of AFB1 was shown to be 3.67 fg/mL, which is 199, 8174, and 2180 times lower than that for the colorimetric signal, commercial enzyme-linked immunosorbent assay kit, and high-performance liquid chromatography, respectively.

3.5. Other Plasmonic Sensors

At present, optical sensors mainly rely on single-channel signal readouts, and are generally limited by various drawbacks, including the poor anti-interference ability of colorimetric methods, the relatively narrow detection range of fluorescent sensors, and the lack of uniformity of SERS substrates. In contrast, dual-signal optical sensors have higher accuracy, and the introduction of reference signals is beneficial for reducing the differences caused by instruments and measurement environments. More importantly, using modal optical sensors with different types of signals, such as different chiral light, is conducive to improving sensitivity and accuracy, avoiding interference from other substances and showing promising application prospects. Various detection methods based on dual-mode optical signals have been reported, such as ratio sensors for chirality and fluorescence, chirality and SERS, fluorescence and SERS [109,110], and so on. Dual-mode sensing systems based on SERS and fluorescence combine the excellent sensitivity of fluorescence sensors with the high selectivity of SERS sensors. Kim et al. [111] have developed a colorimetric and fluorescent dual-mode serological LFIA sensor that integrates metal-enhanced fluorescence (MEF). In order to achieve strong fluorescence signal amplification, the fluorescent group Cy3 is fixed on gold nanoparticles (AuNPs) through size-controllable spacing polyethylene glycol (PEG) to maintain the optimal distance for inducing MEF. The sensor can detect target IgG at a concentration as low as 1 ng/mL within 8 min. Applying MEF to dual-mode serological LFIA sensors resulted in a 1000-fold increase in sensitivity, when compared to colorimetric LFIA.
AuNPs can be used to improve the performance of propagating surface plasmon resonance (PSPR) refractive index sensors. Wang et al. [112] studied the effect of resonant coupling between propagating surface plasmon polaritons and local surface plasmon polaritons in the near-infrared region on the sensitivity of biosensors, as shown in Figure 15. They analyzed the biosensing sensitivity of gold film (GF) and GF AuNPs through detecting the specific binding of carcinoembryonic antigen (CEA) and anti-CEA in the near-infrared region. Compared with PSPR, the penetration depth of the resonant coupling mode in numerical simulation was reduced by 28 times, while the surface electric field strength was increased by 4.6 times. The reduction in penetration depth in resonant coupling mode comes at the cost of sacrificing body sensitivity. The higher the surface electric field strength, the higher the sensitivity to refractive index changes near the nanometer scale. The GF AuNPs were shown to have a 7-fold improvement in CEA immunoassay and, thus, serve as better biosensors.
Shweta et al. [113] introduced the design and simulation of all-optical sensors for detecting cancer cells. The spiral photonic crystal fiber structure is simulated via finite element method (FEM) with surface plasmon resonance for different cancer cells. Based on helical photonic crystal fiber, it shows a promising linear sensing response to support the practical feasibility of the device, which can effectively detect cancers.
Giles Allison et al. [114] proposed an alternative optoelectronic method, in which plasmonic sensors are integrated into photovoltaic cells. The incident light generates an electronic signal that is sensitive to the refractive index of the solution through interaction with plasmons. Due to the coupling between plasmon modes and Fabry–Perot modes in the absorption layer of photovoltaic cells, the photocurrent is enhanced. This method was used to detect refractive index and SARS-CoV-2 nucleocapsid protein antigen–antibody interaction, as shown in Figure 16.
SPR sensors have been used for the real-time detection and quantification of a wide range of analytes, including biomolecules, chemicals, and gases. John et al. [115] explored fiber optic sensors based on D-shaped SPR to optimize copper, gold, and silver thin films with widths and thicknesses of 10 µm and 45 nm to improve the sensor performance. Metal films with a width of 10 µm were shown to achieve the best balance between the sensitivity and dynamic range of the sensor. Hu et al. [116] proposed a polarization-independent terahertz SPR biosensor based on an angle ring element structure with high sensitivity and stability in terms of detecting polarization changes in incident terahertz light. The spatial longitudinal electric field based on the SPR biosensor is nonlinear and sensitive to the dielectric constant of the sample. Theoretically, it was proven that a specific nonlinear response curve with a certain saturation velocity and amplitude can be formed to identify different samples. The application of biosensors for identifying Panax and Paeonia resulted in 95.8% and 94.4% recognition, while the standard deviations were less than 0.347% and 0.403%, respectively.
In immunological biological detection based on plasmon resonance, sensitive, quantitative, and visual molecular detection can be achieved through signal amplification and enhancement. Liu et al. [117] studied a hybrid structure composed of a hemispherical dimer array and a gold film, which achieved resonance mode coupling of surface lattice resonance and surface plasmon polarization, thus enabling stronger electric field enhancement in the dimer region. This hybrid structure can serve as a platform for ultrasensitive biosensing. Geng et al. [118] proposed a novel biosensing method based on photonic materials, which utilizes near-field radiation enhancement to detect cancer biomarkers with high sensitivity. The combination of near-field interactions and wavelength-selective metamaterials enables the detection of biomarkers at different concentrations. Combining photon metamaterial technology with plasmons may further enhance the sensitivity of biosensors.

4. Summary and Prospect

This review summarized the basic principles of surface plasmon resonance and immunological biological detection, emphasizing the role of local electromagnetic field enhancement brought by surface plasmon resonance in improving the sensitivity of detection. Such sensitivity is crucial in the context of biological detection. The ability to achieve trace, accurate, and specific biomarker detection is crucial for early diagnosis and the timely treatment of diseases. While ELISA and other detection methods have been widely used, they cannot achieve hypersensitive measurement. Although sensitive quantitative detection can be achieved based on advanced instruments, their cost is relatively high, which is not conducive to large-scale popularization. However, sensitive, quantitative, and visual molecular detection can be achieved through signal amplification and enhancement in immunological biological detection based on the utilization of plasmon resonance.
This review introduced four types of biosensors based on surface plasmon resonance, including colorimetric sensing, surface enhanced Raman scattering, plasmon fluorescence, and dark-field detection. Table 1 compares various SPR-based biosensing methods, providing a clear side-by-side comparison of the technologies. However, the transition of these novel technologies from laboratory research to societal benefits still faces challenges relating to technical standardization, cost reduction, and practical application scenarios. Potential solutions include adopting integrated designs that incorporate technologies such as ELISA workstations, microarray spotters, and microfluidics into biosensor manufacturing and detection workflows, in order to achieve full-process automation and standardization, thereby accelerating timelines. Leveraging nanomaterial self-assembly or 3D printing can reduce the complexity of fabrication processes, while cost-effective signal amplification materials such as fluorescent microspheres or magnetic beads enable scalable production. Prioritizing high-impact applications—such as early screening for cancers and Alzheimer’s disease, infectious disease surveillance, and large-scale clinical validation of biomarkers—will align the development of these technologies with critical healthcare needs. The further miniaturization and integration of devices could lead to portable detectors for home-based self-testing, coupled with AI-driven analysis to generate real-time health reports. This is expected to pave the way for wearable device-enabled dynamic monitoring of chronic diseases, real-time environmental pollutant detection, and ultrasensitive diagnostics for rare conditions, ultimately bridging advanced technologies with real-world societal impacts.
The future advancement of this technology will rely not only on linear innovations within a single discipline, but also on the deep integration of materials science, nanoscience, data science, and clinical diagnostics. Emerging two-dimensional materials and nanomaterials, such as carbon nanomaterials, transition metal dichalcogenides, metal–organic frameworks, MXenes, quantum dots of various shapes, and core–shell structures, can serve as novel substrates to enhance localized electromagnetic fields. Their high specific surface areas and chemical stability help to optimize the efficiency of molecular adsorption, further improving the sensitivity and selectivity of detection. In addition, it is worth mentioning that the full width at half maximum of the emission peak of quantum dot materials is usually very narrow. Through surface modification of the relevant materials, it is also possible to achieve high-sensitivity multi-channel joint detection. Additionally, research into flexible and corrosion-resistant substrate materials will enhance the stability of biochips in complex environments, driving the practical application of sensors in wearable devices and extreme conditions. In terms of nanotechnology, designing specific morphologies via electron beam lithography or nanoimprinting, coupled with resonance wavelength matching to target molecular characteristics, could enable single molecule-level detection. Integrating these technologies with microfluidic chips is expected to allow for the automation of sample processing and detection. Colloidal self-assembly of nanoparticles and 3D printing technologies, complementing traditional lithography, will accelerate the commercialization of plasmonic biosensors through cost-effective mass-production. For intelligent data analysis and system optimization, deep learning algorithms can filter noise, perform particle counting, and identify specific binding events. Automated spectral analysis of Raman or electrochemical signals can facilitate multi-channel detection. Machine learning-driven simulations can predict interactions between nanostructures and electromagnetic fields, guiding the design of microstructures, accelerating technological iteration, and reducing the costs associated with experimental trial-and-error.
The immunological biochip technologies based on surface plasmon resonance introduced in this review have broad application prospects in biomedical research. They can be used not only in fields such as gene expression analysis, disease diagnosis, drug screening, and efficacy evaluation, but also for the detection of microbial infections (e.g., viruses and bacteria), as well as in the monitoring of environmental pollution and food safety. At present, research in this area is still in its infancy, and this review only provides a brief overview with the aim of stimulating further exploration. With the deepening of research, we can expect more new methods to be implemented for immunological biochips based on surface plasmon resonance, providing more reliable and efficient tools for biological research and clinical diagnosis.

Author Contributions

Conceptualization, M.W. and W.Z.; formal analysis, Y.H.; investigation, M.W.; resources, X.H.; data curation, M.W.; writing—original draft preparation, M.W.; writing—review and editing, Y.H.; visualization, Y.H.; supervision, T.Z.; project administration, W.Z.; funding acquisition, Y.H. and X.H.; All authors have read and agreed to the published version of the manuscript.

Funding

This research was funded by the Scientific and Technological Research Project of Henan Province (Project No. 242102230156) and High-level Talent Research Start-up Project Funding of Henan Academy of Sciences (Project No. 231720005 and 231820045).

Institutional Review Board Statement

Not applicable.

Informed Consent Statement

Not applicable.

Data Availability Statement

The data presented in this study are available on request from the corresponding authors.

Acknowledgments

Thanks to the anonymous reviewers for valuable suggestions for improving the manuscript quality.

Conflicts of Interest

The authors declare no conflicts of interest.

Abbreviations

The following abbreviations are used in this manuscript:
ELISAEnzyme-linked immunosorbent assay
SPRSurface plasmon resonance
SPPsSurface plasmon polariton
LSPLocal surface plasmon
SPRSurface plasmon resonance
LSPRLocal surface plasmon resonance
POCTPoint of care testing
SERSSurface enhanced Raman scattering
DFMDark-Field Microscopy
NPNanoparticle
NRNanorod
NDKANucleoside diphosphate kinase A
LFALateral flow assay
PSPRPropagating surface plasmon resonance
GFGold film

References

  1. Seth, A.; Liu, Y.; Gupta, R.; Wang, Z.; Mittal, E.; Kolla, S.; Rathi, P.; Gupta, P.; Parikh, B.A.; Genin, G.M.; et al. Plasmon-Enhanced Digital Fluoroimmunoassay for Subfemtomolar Detection of Protein Biomarkers. Nano Lett. 2024, 24, 229–237. [Google Scholar] [CrossRef]
  2. Salehnezhad, Z.; Soroosh, M.; Mondal, H. A Highly Sensitive Plasmonic Graphene-Based Structure for Deoxyribonucleic Acid Detection. Photonics 2024, 11, 549. [Google Scholar] [CrossRef]
  3. Wu, J.; Jiang, K.; Mi, H.; Qiu, Y.; Son, J.; Park, H.J.; Nam, J.-M.; Lee, J.-H. A rapid and sensitive fluorescence biosensor based on plasmonic PCR. Nanoscale 2021, 13, 7348–7354. [Google Scholar] [CrossRef] [PubMed]
  4. He, S.; Xiong, M.; Li, L.; Yan, Y.; Li, J.; Feng, Z.; Li, Y.; Zhao, J.; Dong, Y.; Li, X.; et al. One-Step Purification of IgE Epitope-Specific Antibody Using Immunomagnetic Beads and Highly Sensitive Detection of Bovine β-Lactoglobulin for the Prediction of Milk Allergenicity in Foods. J. Agric. Food Chem. 2023, 71, 14068–14078. [Google Scholar] [CrossRef]
  5. Tran, N.H.T.; Trinh, K.T.L.; Lee, J.H.; Yoon, W.J.; Ju, H. Reproducible Enhancement of Fluorescence by Bimetal Mediated Surface Plasmon Coupled Emission for Highly Sensitive Quantitative Diagnosis of Double-Stranded DNA. Small 2018, 14, e1801385. [Google Scholar] [CrossRef] [PubMed]
  6. Yousefi, H.; Ali, M.M.; Su, H.M.; Filipe, C.D.M.; Didar, T.F. Sentinel Wraps: Real-Time Monitoring of Food Contamination by Printing DNAzyme Probes on Food Packaging. ACS Nano 2018, 12, 3287–3294. [Google Scholar] [CrossRef]
  7. Xiong, Y.; Fu, T.; Zhang, D.; Zhang, S.; Xu, H. Superradiative plasmonic nanoantenna biosensors enable sensitive immunoassay using the naked eye. Nanoscale 2021, 13, 2429–2435. [Google Scholar] [CrossRef]
  8. Min, J.; Sempionatto, J.R.; Teymourian, H.; Wang, J.; Gao, W. Wearable electrochemical biosensors in North America. Biosens. Bioelectron. 2021, 172, 112750. [Google Scholar] [CrossRef]
  9. Gupta, R.; Raza, N.; Bhardwaj, S.K.; Vikrant, K.; Kim, K.H.; Bhardwaj, N. Advances in nanomaterial-based electrochemical biosensors for the detection of microbial toxins, pathogenic bacteria in food matrices. J. Hazard. Mater. 2021, 401, 123379. [Google Scholar] [CrossRef]
  10. Yan, R.; Wang, T.; Yue, X.; Wang, H.; Zhang, Y.-H.; Xu, P.; Wang, L.; Wang, Y.; Zhang, J. Highly sensitive plasmonic nanorod hyperbolic metamaterial biosensor. Photonics Res. 2022, 10, 84. [Google Scholar] [CrossRef]
  11. Arcadio, F.; Zeni, L.; Montemurro, D.; Eramo, C.; Di Ronza, S.; Perri, C.; D’Agostino, G.; Chiaretti, G.; Porto, G.; Cennamo, N. Biochemical sensing exploiting plasmonic sensors based on gold nanogratings and polymer optical fibers. Photonics Res. 2021, 9, 1397. [Google Scholar] [CrossRef]
  12. Gramotnev, D.K.; Bozhevolnyi, S.I. Plasmonics beyond the diffraction limit. Nat. Photonics 2010, 4, 83–91. [Google Scholar] [CrossRef]
  13. Ozbay, E. Plasmonics: Merging Photonics and Electronics at Nanoscale Dimensions. Science 2006, 311, 189–193. [Google Scholar] [CrossRef] [PubMed]
  14. Nowicka, P.; Brzeska, S.; Makowski, M. Exploring the interactions of biologically active compounds (including drugs) with biomolecules: Utilizing Surface Plasmon Resonance and SwitchSense techniques. TrAC Trends Anal. Chem. 2024, 176, 117764. [Google Scholar] [CrossRef]
  15. Jeanmaire, D.L.; Van Duyne, R.P. Surface raman spectroelectrochemistry: Part I. Heterocyclic, aromatic, and aliphatic amines adsorbed on the anodized silver electrode. J. Electroanal. Chem. Interfacial Electrochem. 1977, 84, 1–20. [Google Scholar] [CrossRef]
  16. Albrecht, M.G.; Creighton, J.A. Anomalously intense Raman spectra of pyridine at a silver electrode. J. Am. Chem. Soc. 1977, 99, 5215–5217. [Google Scholar] [CrossRef]
  17. Khodaie, A.; Heidarzadeh, H. Design and analysis of a multi-modal refractive index plasmonic biosensor based on split ring resonator for detection of the various cancer cells. Opt. Quantum Electron. 2024, 56, 1439. [Google Scholar] [CrossRef]
  18. Wang, Z.; Liu, L.; Li, P.; Nie, A.; Zhai, K.; Xiang, J.; Mu, C.; Wen, F.; Wang, B.; Xue, T.; et al. Ferroelectric Bi2O2Te-Based Plasmonic Biosensor for Ultrasensitive Biomolecular Detection. Small 2024, 20, 2312175. [Google Scholar] [CrossRef]
  19. Jin, C.; Wu, Z.; Molinski, J.H.; Zhou, J.; Ren, Y.; Zhang, J.X.J. Plasmonic nanosensors for point-of-care biomarker detection. Mater. Today Bio 2022, 14, 100263. [Google Scholar] [CrossRef]
  20. Sönnichsen, C.; Franzl, T.; Wilk, T.; von Plessen, G.; Feldmann, J.; Wilson, O.; Mulvaney, P. Drastic reduction of plasmon damping in gold nanorods. Phys. Rev. Lett. 2002, 88, 077402. [Google Scholar] [CrossRef]
  21. Ropers, C.; Neacsu, C.C.; Elsaesser, T.; Albrecht, M.; Raschke, M.B.; Lienau, C. Grating-coupling of surface plasmons onto metallic tips: A nanoconfined light source. Nano Lett. 2007, 7, 2784–2788. [Google Scholar] [CrossRef] [PubMed]
  22. Zhao, Z.; Kravtsov, V.; Wang, Z.; Zhou, Z.; Dou, L.; Huang, D.; Wang, Z.; Cheng, X.; Raschke, M.B.; Jiang, T. Applications of ultrafast nano-spectroscopy and nano-imaging with tip-based microscopy. eLight 2025, 5, 1. [Google Scholar] [CrossRef]
  23. Jiang, W.; Hu, H.; Deng, Q.; Zhang, S.; Xu, H. Temperature-dependent dark-field scattering of single plasmonic nanocavity. Nanophotonics 2020, 9, 3347–3356. [Google Scholar] [CrossRef]
  24. Novo, C.; Gomez, D.; Perez-Juste, J.; Zhang, Z.; Petrova, H.; Reismann, M.; Mulvaney, P.; Hartland, G.V. Contributions from radiation damping and surface scattering to the linewidth of the longitudinal plasmon band of gold nanorods: A single particle study. Phys. Chem. Chem. Phys. 2006, 8, 3540–3546. [Google Scholar] [CrossRef]
  25. Ramasamy, M.; Ha, J.W. Single-Particle Spectroelectrochemistry: Revealing the Electrochemical Tuning Mechanism of Chemical Interface Damping in 1,2-Benzenedithiol-Adsorbed Single Gold Nanorods. Anal. Chem. 2024, 96, 18043–18051. [Google Scholar] [CrossRef]
  26. Lee, S.Y.; Tsalu, P.V.; Kim, G.W.; Seo, M.J.; Hong, J.W.; Ha, J.W. Tuning Chemical Interface Damping: Interfacial Electronic Effects of Adsorbate Molecules and Sharp Tips of Single Gold Bipyramids. Nano Lett. 2019, 19, 2568–2574. [Google Scholar] [CrossRef] [PubMed]
  27. Foerster, B.; Spata, V.A.; Carter, E.A.; Sönnichsen, C.; Link, S. Plasmon damping depends on the chemical nature of the nanoparticle interface. Sci. Adv. 2019, 5, eaav0704. [Google Scholar] [CrossRef] [PubMed]
  28. Liu, M.; Pelton, M.; Guyot-Sionnest, P. Reduced damping of surface plasmons at low temperatures. Phys. Rev. B Condens. Matter Mater. Phys. 2009, 79, 035418. [Google Scholar] [CrossRef]
  29. Yeshchenko, O.A.; Bondarchuk, I.S.; Losytskyy, M.Y.; Alexeenko, A.A. Temperature Dependence of Photoluminescence from Silver Nanoparticles. Plasmonics 2014, 9, 93–101. [Google Scholar] [CrossRef]
  30. Konrad, A.; Wackenhut, F.; Hussels, M.; Meixner, A.J.; Brecht, M. Temperature Dependent Luminescence and Dephasing of Gold Nanorods. J. Phys. Chem. C 2013, 117, 21476–21482. [Google Scholar] [CrossRef]
  31. Arbouet, A.; Voisin, C.; Christofilos, D.; Langot, P.; Fatti, N.D.; Vallée, F.; Lermé, J.; Celep, G.; Cottancin, E.; Gaudry, M.; et al. Electron-phonon scattering in metal clusters. Phys. Rev. Lett. 2003, 90, 177401. [Google Scholar] [CrossRef]
  32. Voisin, C.; Christofilos, D.; Loukakos, P.; Del Fatti, N.; Vallée, F.; Lermé, J.; Gaudry, M.; Cottancin, E.; Pellarin, M.; Broyer, M. Ultrafast electron-electron scattering and energy exchanges in noble-metal nanoparticles. Phys. Rev. B 2004, 69, 195416. [Google Scholar] [CrossRef]
  33. Kretschmann, E.; Raether, H. Notizen: Radiative Decay of Non Radiative Surface Plasmons Excited by Light. Z. Naturforschung A 1968, 23, 2135–2136. [Google Scholar] [CrossRef]
  34. Otto, A. Excitation of nonradiative surface plasma waves in silver by the method of frustrated total reflection. Z. Phys. 1968, 216, 398–410. [Google Scholar] [CrossRef]
  35. Wark, A.W.; Lee, H.J.; Corn, R.M. Long-range surface plasmon resonance imaging for bioaffinity sensors. Anal. Chem. 2005, 77, 3904–3907. [Google Scholar] [CrossRef] [PubMed]
  36. Lee, K.S.; El-Sayed, M.A. Gold and silver nanoparticles in sensing and imaging: Sensitivity of plasmon response to size, shape, and metal composition. J. Phys. Chem. B 2006, 110, 19220–19225. [Google Scholar] [CrossRef] [PubMed]
  37. Ma, H.; Liu, T.; Jiang, J.; Liu, K.; Wang, S.; Zhang, Z.; Jing, J. Progress in Sensitivity Enhancement for Optical Fibre Surface Plasmon Resonance Sensing. Chin. J. Lasers 2021, 48, 1906002. [Google Scholar] [CrossRef]
  38. Liedberg, B.; Nylander, C.; Lunström, I. Surface plasmon resonance for gas detection and biosensing. Sens. Actuators 1983, 4, 299–304. [Google Scholar] [CrossRef]
  39. Mukhtar, W.M.; Halim, R.M.; Hassan, H.P. Optimization of SPR signals: Monitoring the physical structures and refractive indices of prisms. EPJ Web Conf. 2017, 162, 01001. [Google Scholar] [CrossRef]
  40. Ekimov, A.I.; Efros, A.L.; Onushchenko, A.A. Quantum size effect in semiconductor microcrystals. Solid State Commun. 1985, 56, 921–924. [Google Scholar] [CrossRef]
  41. Gleiter, H. Nanocrystalline Material. Prog. Mater. Sci. 1989, 33, 223–315. [Google Scholar] [CrossRef]
  42. Brus, L.E. Electron—Electron and electron-hole interactions in small semiconductor crystallites: The size dependence of the lowest excited electronic state. J. Chem. Phys. 1984, 80, 4403–4409. [Google Scholar] [CrossRef]
  43. Ashley, J.; D’Aurelio, R.; Piekarska, M.; Temblay, J.; Pleasants, M.; Trinh, L.; Rodgers, T.L.; Tothill, I.E. Development of a β-Lactoglobulin Sensor Based on SPR for Milk Allergens Detection. Biosensors 2018, 8, 32. [Google Scholar] [CrossRef]
  44. Wang, J.; Liu, S.; Meng, Z.; Han, X.X.; Cai, L.; Xu, B.; Liu, R.; Song, L.; He, C.; Cheng, Z.; et al. Flexible SERS Biosensor Based on Core-Shell Nanotags for Sensitive and Multiple Detection of T1DM Biomarkers. Anal. Chem. 2023, 95, 14203–14208. [Google Scholar] [CrossRef]
  45. Jia, P.; Kong, D.; Ebendorff-Heidepriem, H. Flexible Plasmonic Tapes with Nanohole and Nanoparticle Arrays for Refractometric and Strain Sensing. ACS Appl. Nano Mater. 2020, 3, 8242–8246. [Google Scholar] [CrossRef]
  46. Tian, L.; Cao, M.; Cheng, H.; Wang, Y.; He, C.; Shi, X.; Li, T.; Li, Z. Plasmon-Stimulated Colorimetry Biosensor Array for the Identification of Multiple Metabolites. ACS Appl. Mater. Interfaces 2024, 16, 6849–6858. [Google Scholar] [CrossRef] [PubMed]
  47. Xu, S.; Jiang, L.; Liu, Y.; Liu, P.; Wang, W.; Luo, X. A morphology-based ultrasensitive multicolor colorimetric assay for detection of blood glucose by enzymatic etching of plasmonic gold nanobipyramids. Anal. Chim. Acta 2019, 1071, 53–58. [Google Scholar] [CrossRef]
  48. Wang, F.; Na, N.; Ouyang, J. A catalytic—Regulated gold nanorods etching process as a receptor with multiple readouts for protein detection. Sens. Actuators B Chem. 2020, 318, 128215. [Google Scholar] [CrossRef]
  49. Toma, M.; Namihara, S.; Kajikawa, K. Direct detection of neuron-specific enolase using a spectrometer-free colorimetric plasmonic biosensor. Anal. Methods 2023, 15, 2755–2760. [Google Scholar] [CrossRef]
  50. Russell, S.M.; de la Rica, R. Paper transducers to detect plasmon variations in colorimetric nanoparticle biosensors. Sens. Actuators B Chem. 2018, 270, 327–332. [Google Scholar] [CrossRef]
  51. Pinheiro, T.; Marques, A.C.; Carvalho, P.; Martins, R.; Fortunato, E. Paper Microfluidics and Tailored Gold Nanoparticles for Nonenzymatic, Colorimetric Multiplex Biomarker Detection. ACS Appl. Mater. Interfaces 2021, 13, 3576–3590. [Google Scholar] [CrossRef]
  52. Lu, W.; Tian, Y.; Teng, W.; Qiu, X.; Li, M. Plasmonic colorimetric immunosensor based on Poly-HRP and AuNS etching for tri-modal readout of small molecule. Talanta 2023, 265, 124883. [Google Scholar] [CrossRef]
  53. Fleischmann, M.; Hendra, P.J.; McQuillan, A.J. Raman spectra of pyridine adsorbed at a silver electrode. Chem. Phys. Lett. 1974, 26, 163–166. [Google Scholar] [CrossRef]
  54. Moskovits, M. Surface-enhanced spectroscopy. Rev. Mod. Phys. 1985, 57, 783–826. [Google Scholar]
  55. Otto, A. Surface-Enhanced Raman Scattering: “Classical” and “Chemical” Origins. In Light Scattering in Solids IV: Electronics Scattering, Spin Effects, SERS, and Morphic Effects; Springer: Berlin/Heidelberg, Germany, 1984; p. 289. [Google Scholar] [CrossRef]
  56. Schatz, G.C.; Van Duyne, R.P. Electromagnetic Mechanism of Surface-Enhanced Spectroscopy. In Handbook of Vibrational Spectroscopy; John Wiley & Sons Ltd.: Hoboken, NJ, USA, 2001. [Google Scholar]
  57. Eremina, O.E.; Czaja, A.T.; Fernando, A.; Aron, A.; Eremin, D.B.; Zavaleta, C. Expanding the Multiplexing Capabilities of Raman Imaging to Reveal Highly Specific Molecular Expression and Enable Spatial Profiling. ACS Nano 2022, 16, 10341–10353. [Google Scholar] [CrossRef]
  58. Almehmadi, L.M.; Curley, S.M.; Tokranova, N.A.; Tenenbaum, S.A.; Lednev, I.K. Surface Enhanced Raman Spectroscopy for Single Molecule Protein Detection. Sci. Rep. 2019, 9, 12356. [Google Scholar] [CrossRef] [PubMed]
  59. Wang, H.-N.; Register, J.K.; Fales, A.M.; Gandra, N.; Cho, E.H.; Boico, A.; Palmer, G.M.; Klitzman, B.; Vo-Dinh, T. Surface-enhanced Raman scattering nanosensors for in vivo detection of nucleic acid targets in a large animal model. Nano Res. 2018, 11, 4005–4016. [Google Scholar] [CrossRef]
  60. Xiong, Y.; Hu, H.; Zhang, T.; Xu, Y.; Gao, F.; Chen, W.; Zheng, G.; Zhang, S.; Xu, H. Quantitative and sensitive detection of alpha fetoprotein in serum by a plasmonic sensor. Nanophotonics 2022, 11, 4821–4829. [Google Scholar] [CrossRef]
  61. Lyu, N.; Pedersen, B.; Shklovskaya, E.; Rizos, H.; Molloy, M.P.; Wang, Y. SERS characterization of colorectal cancer cell surface markers upon anti-EGFR treatment. Exploration 2022, 2, 20210176. [Google Scholar] [CrossRef]
  62. Guo, H.; Qian, K.; Cai, A.; Tang, J.; Liu, J. Ordered gold nanoparticle arrays on the tip of silver wrinkled structures for single molecule detection. Sens. Actuators B Chem. 2019, 300, 126846. [Google Scholar] [CrossRef]
  63. Chandra, K.; Kumar, V.; Werner, S.E.; Odom, T.W. Separation of Stabilized MOPS Gold Nanostars by Density Gradient Centrifugation. ACS Omega 2017, 2, 4878–4884. [Google Scholar] [CrossRef]
  64. Kim, S.; Joo, J.-H.; Kim, W.; Bang, A.; Choi, H.W.; Moon, S.W.; Choi, S. A facile, portable surface-enhanced Raman spectroscopy sensing platform for on-site chemometrics of toxic chemicals. Sens. Actuators B Chem. 2021, 343, 130102. [Google Scholar] [CrossRef]
  65. Kim, J.; Song, X.; Ji, F.; Luo, B.; Ice, N.F.; Liu, Q.; Zhang, Q.; Chen, Q. Polymorphic Assembly from Beveled Gold Triangular Nanoprisms. Nano Lett. 2017, 17, 3270–3275. [Google Scholar] [CrossRef] [PubMed]
  66. Kim, W.; Bang, A.; Kim, S.; Lee, G.-J.; Kim, Y.-H.; Choi, S. Adiponectin-targeted SERS immunoassay biosensing platform for early detection of gestational diabetes mellitus. Biosens. Bioelectron. 2022, 213, 114488. [Google Scholar] [CrossRef]
  67. Zong, C.; Premasiri, R.; Lin, H.; Huang, Y.; Zhang, C.; Yang, C.; Ren, B.; Ziegler, L.D.; Cheng, J.X. Plasmon-enhanced stimulated Raman scattering microscopy with single-molecule detection sensitivity. Nat. Commun. 2019, 10, 5318. [Google Scholar] [CrossRef]
  68. Liu, X.; Yang, X.; Li, K.; Liu, H.; Xiao, R.; Wang, W.; Wang, C.; Wang, S. Fe3O4@Au SERS tags-based lateral flow assay for simultaneous detection of serum amyloid A and C-reactive protein in unprocessed blood sample. Sens. Actuators B Chem. 2020, 320, 128350. [Google Scholar] [CrossRef]
  69. Shim, J.-E.; Kim, Y.J.; Choe, J.-H.; Lee, T.G.; You, E.-A. Single-Nanoparticle-Based Digital SERS Sensing Platform for the Accurate Quantitative Detection of SARS-CoV-2. ACS Appl. Mater. Interfaces 2022, 14, 38459–38470. [Google Scholar] [CrossRef] [PubMed]
  70. Dey, S.; Mishra, S.M.; Roy, A.; Roy, A.; Senapati, D.; Satpati, B. Multiple Gold Nanoparticle Cores within a Single SiO2 Shell for Preservable Solid-State Surface-Enhanced Raman Scattering and Catalytic Sensing. ACS Appl. Nano Mater. 2023, 6, 15606–15619. [Google Scholar] [CrossRef]
  71. Ge, S.; Wang, M.; Zhu, S.; Wu, H.; Li, J.; Liu, D.; Huang, Q.; Li, S.; Sun, X. Hypersensitive detection of CYFRA21-1 by SERS dual antibody sandwich method. Sens. Actuators Rep. 2024, 7, 100198. [Google Scholar] [CrossRef]
  72. Zheng, P.; Raj, P.; Wu, L.; Szabo, M.; Hanson, W.A.; Mizutani, T.; Barman, I. Leveraging Nanomechanical Perturbations in Raman Spectro-Immunoassays to Design a Versatile Serum Biomarker Detection Platform. Small 2022, 18, 2204541. [Google Scholar] [CrossRef]
  73. Xiang, Y.; Zheng, Y.; Liu, S.; Liu, G.; Li, Z.; Dong, W. Comparison of the sensitivity of Western blotting between PVDF and NC membranes. Sci. Rep. 2021, 11, 12022. [Google Scholar] [CrossRef]
  74. Xiao, J.; Zhang, S.; Liu, Q.; Xu, T.; Zhang, X. Microfluidic-based plasmonic microneedle biosensor for uric acid ultrasensitive monitoring. Sens. Actuators B Chem. 2024, 398, 134685. [Google Scholar] [CrossRef]
  75. Tuckmantel Bido, A.; Brolo, A.G. Digital SERS Protocol Using Au Nanoparticle-Based Extrinsic Raman Labels for the Determination of SARS-CoV-2 Spike Protein in Saliva Samples. ACS Appl. Nano Mater. 2023, 6, 15426–15436. [Google Scholar] [CrossRef]
  76. Zhu, K.; Zhou, T.; Chen, P.; Zong, S.; Wu, L.; Cui, Y.; Wang, Z. Long-lived SERS Matrix for Real-Time Biochemical Detection Using “Frozen” Transition State. ACS Sens. 2023, 8, 3360–3369. [Google Scholar] [CrossRef]
  77. Atta, S.; Zhao, Y.; Li, J.Q.; Vo-Dinh, T. Dual-Modal Colorimetric and Surface-Enhanced Raman Scattering (SERS)-Based Lateral Flow Immunoassay for Ultrasensitive Detection of SARS-CoV-2 Using a Plasmonic Gold Nanocrown. Anal. Chem. 2024, 96, 4783–4790. [Google Scholar] [CrossRef]
  78. Jiao, S.; Chen, X.; He, Z.; Wu, L.; Xie, X.; Sun, Z.; Zhang, S.; Cao, H.; Hammock, B.D.; Liu, X. Colorimetric and surface-enhanced Raman scattering dual-mode lateral flow immunosensor using phage-displayed shark nanobody for the detection of crustacean allergen tropomyosin. J. Hazard. Mater. 2024, 468, 133821. [Google Scholar] [CrossRef] [PubMed]
  79. Zhang, L.; Cao, K.; Su, Y.; Hu, S.; Liang, X.; Luo, Q.; Luo, H. Colorimetric and surface-enhanced Raman scattering dual-mode magnetic immunosensor for ultrasensitive detection of blood phosphorylated tau in Alzheimer’s disease. Biosens. Bioelectron. 2023, 222, 114935. [Google Scholar] [CrossRef]
  80. Liu, X.; Su, X.; Chen, M.; Xie, Y.; Li, M. Self-calibrating surface-enhanced Raman scattering-lateral flow immunoassay for determination of amyloid-β biomarker of Alzheimer’s disease. Biosens. Bioelectron. 2024, 245, 115840. [Google Scholar] [CrossRef]
  81. Wang, L.; Sun, J.; Wang, X.; Lei, M.; Shi, Z.; Liu, L.; Xu, C. Visual and quantitative lateral flow immunoassay based on Au@PS SERS tags for multiplex cardiac biomarkers. Talanta 2024, 274, 126040. [Google Scholar] [CrossRef]
  82. Clarke, O.J.R.; Goodall, B.L.; Hui, H.P.; Vats, N.; Brosseau, C.L. Development of a SERS-Based Rapid Vertical Flow Assay for Point-of-Care Diagnostics. Anal. Chem. 2017, 89, 1405–1410. [Google Scholar] [CrossRef]
  83. Chen, R.; Liu, B.; Ni, H.; Chang, N.; Luan, C.; Ge, Q.; Dong, J.; Zhao, X. Vertical flow assays based on core–shell SERS nanotags for multiplex prostate cancer biomarker detection. Analyst 2019, 144, 4051–4059. [Google Scholar] [CrossRef] [PubMed]
  84. Ebbah, E.; Amissah, A.; Kim, J.-H.; Driskell, J.D. SERS-based immunoassay on a plasmonic syringe filter for improved sampling and labeling efficiency of biomarkers. Analyst 2024, 149, 221–230. [Google Scholar] [CrossRef]
  85. Zhang, X.; Gan, T.; Xu, Z.; Zhang, H.; Wang, D.; Zhao, X.; Huang, Y.; Liu, Q.; Fu, B.; Dai, Z.; et al. Immune-like sandwich multiple hotspots SERS biosensor for ultrasensitive detection of NDKA biomarker in serum. Talanta 2024, 271, 125630. [Google Scholar] [CrossRef] [PubMed]
  86. Zhao, L.; Hu, Y.; Li, G.; Zou, S.; Ling, L. Chemical–Chemical Redox Cycle Signal Amplification Strategy Combined with Dual Ratiometric Immunoassay for Surface-Enhanced Raman Spectroscopic Detection of Cardiac Troponin I. Anal. Chem. 2023, 95, 16677–16682. [Google Scholar] [CrossRef]
  87. Pazin, W.M.; Furini, L.N.; Braz, D.C.; Popolin-Neto, M.; Fernandes, J.D.; Leopoldo Constantino, C.J.; Oliveira, O.N., Jr. Explainable Machine Learning to Unveil Detection Mechanisms with Au Nanoisland-Based Surface-Enhanced Raman Scattering for SARS-CoV-2 Antigen Detection. ACS Appl. Nano Mater. 2024, 7, 2335–2342. [Google Scholar] [CrossRef]
  88. Semeniak, D.; Cruz, D.F.; Chilkoti, A.; Mikkelsen, M.H. Plasmonic Fluorescence Enhancement in Diagnostics for Clinical Tests at Point-of-Care: A Review of Recent Technologies. Adv. Mater. 2023, 35, e2107986. [Google Scholar] [CrossRef]
  89. Minopoli, A.; Della Ventura, B.; Lenyk, B.; Gentile, F.; Tanner, J.A.; Offenhäusser, A.; Mayer, D.; Velotta, R. Ultrasensitive antibody-aptamer plasmonic biosensor for malaria biomarker detection in whole blood. Nat. Commun. 2020, 11, 6134. [Google Scholar] [CrossRef]
  90. Kar, A.; Praneeth, N.V.S.; Khatua, S.; Datta, B. Use of Single-Molecule Plasmon-Enhanced Fluorescence to Investigate Ligand Binding to G-Quadruplex DNA. J. Phys. Chem. Lett. 2023, 14, 6321–6327. [Google Scholar] [CrossRef] [PubMed]
  91. Li, C.Y.; Duan, S.; Yi, J.; Wang, C.; Radjenovic, P.M.; Tian, Z.Q.; Li, J.F. Real-time detection of single-molecule reaction by plasmon-enhanced spectroscopy. Sci. Adv. 2020, 6, eaba6012. [Google Scholar] [CrossRef]
  92. Tran, V.T.; Ju, H. Fluorescence Based on Surface Plasmon Coupled Emission for Ultrahigh Sensitivity Immunoassay of Cardiac Troponin I. Biomedicines 2021, 9, 448. [Google Scholar] [CrossRef]
  93. Lai, X.; Zhang, G.; Zhang, G.; Su, L.; Liu, C.; He, W.; Ang, E.H.; Lai, W.; Deng, S. Polydopamine-modulated anisotropic co-growth plasmonic blackbody for efficient ultra-broad-spectrum quenching to establish multicolor fluorescent immunoassay. Chem. Eng. J. 2024, 495, 153083. [Google Scholar] [CrossRef]
  94. Deng, K.; Yu, Z.L.; Hu, X.; Liu, J.; Hong, X.; Zi, G.G.L.; Zhang, Z.; Tian, Z.Q. NIR-II fluorescent Ag(2)Se polystyrene beads in a lateral flow immunoassay to detect biomarkers for breast cancer. Mikrochim. Acta 2023, 190, 462. [Google Scholar] [CrossRef]
  95. Amrhein, K.; Taylor, M.L.; Wilson, R.; Gallops, C.E.; Annamer, A.; Vinduska, V.; Kwizera, E.A.; Zhang, H.; Wang, Y.; Hoang, T.B.; et al. Dual Imaging Single Vesicle Surface Protein Profiling and Early Cancer Detection. ACS Appl. Mater. Interfaces 2023, 15, 2679–2692. [Google Scholar] [CrossRef] [PubMed]
  96. Qavi, A.J.; Jiang, Q.; Aman, M.J.; Vu, H.; Zetlin, L.; Dye, J.M.; Froude, J.W.; Leung, D.W.; Holtsberg, F.; Crick, S.L.; et al. A Flexible, Quantitative Plasmonic-Fluor Lateral Flow Assay for the Rapid Detection of Orthoebolavirus zairense and Orthoebolavirus sudanense. ACS Infect. Dis. 2024, 10, 57–63. [Google Scholar] [CrossRef] [PubMed]
  97. Mock, J.; Barbic, M.; Smith, D.; Schultz, D.; Schultz, S.J.J.J.; Mock, M.; Barbic, D.R.; Smith, D.A.; Schultz, S. Schultz: Shape effects in plasmon resonance of individual colloidal silver nanoparticles. J. Chem. Phys. 2002, 116, 6755–6759. [Google Scholar] [CrossRef]
  98. Wu, X.; Li, T.; Tao, G.; Lin, R.; Pei, X.; Liu, F.; Li, N. A universal and enzyme-free immunoassay platform for biomarker detection based on gold nanoparticle enumeration with a dark-field microscope. Analyst 2017, 142, 4201–4205. [Google Scholar] [CrossRef]
  99. Xu, S.; Guo, L.; Chen, L.; Luo, F.; Qiu, B.; Lin, Z. Dark field microscope-based single nanoparticle identification coupled with statistical analysis for ultrasensitive biotoxin detection in complex sample matrix. Microchim. Acta 2020, 187, 413. [Google Scholar] [CrossRef]
  100. Qian, X.; Shen, Y.; Yuan, J.; Yang, C.-T.; Zhou, X. Visual and Ultrasensitive Detection of a Coronavirus Using a Gold Nanorod Probe under Dark Field. Biosensors 2022, 12, 1146. [Google Scholar] [CrossRef] [PubMed]
  101. Zheng, L.; Wen, Y.; Ren, W.; Duan, H.; Lin, J.; Irudayaraj, J. Hyperspectral dark-field microscopy for pathogen detection based on spectral angle mapping. Sens. Actuators B Chem. 2022, 367, 132042. [Google Scholar] [CrossRef]
  102. Zhou, H.; Yu, Q.; Wang, H.; Zhu, W.; Liu, J.; Wang, Z. A general scattering proximity immunoassay with the formation of dimer of gold nanoparticle. Talanta 2021, 233, 122515. [Google Scholar] [CrossRef]
  103. Jin, Z.-Y.; He, C.-H.; Xi, C.-Y.; Wang, Y.; Abdalla, E.; Chen, B.-B.; Li, D.-W. Ultrasensitive detection of tyrosinase with click reaction-combined dark-field imaging platform. Talanta 2024, 273, 125931. [Google Scholar] [CrossRef]
  104. Yoshimura, K.; Patmawati; Maeda, M.; Kamiya, N.; Zako, T. Protein-Functionalized Gold Nanoparticles for Antibody Detection Using the Darkfield Microscopic Observation of Nanoparticle Aggregation. Anal. Sci. 2021, 37, 507–511. [Google Scholar] [CrossRef] [PubMed]
  105. Fan, L.; Huang, T.; Lou, D.; Peng, Z.; He, Y.; Zhang, X.; Gu, N.; Zhang, Y. Artificial Intelligence-Aided Multiple Tumor Detection Method Based on Immunohistochemistry-Enhanced Dark-Field Imaging. Anal. Chem. 2022, 94, 1037–1045. [Google Scholar] [CrossRef]
  106. Liu, X.; Lin, X.; Pan, X.; Gai, H. Multiplexed Homogeneous Immunoassay Based on Counting Single Immunocomplexes together with Dark-Field and Fluorescence Microscopy. Anal. Chem. 2022, 94, 5830–5837. [Google Scholar] [CrossRef] [PubMed]
  107. Zhang, D.; Jiang, N.; Li, P.; Zhang, Y.; Sun, S.; Mao, J.; Liu, S.; Wei, W. Detection of monoamine oxidase B using dark-field light scattering imaging and colorimetry. Chem. Commun. 2022, 58, 12329–12332. [Google Scholar] [CrossRef]
  108. Zhao, Q.; Xie, X.; Chen, L.; Wu, J.; Jiang, Z.; Shi, X. Smartphone analysis and dark-field microscopy observation for aflatoxin B1 detection based on the disintegration of core-shell Ag@Au nanoparticles. Food Biosci. 2024, 60, 104406. [Google Scholar] [CrossRef]
  109. Zhao, Y.; Shi, L.; Miao, H.; Jing, X. “Add on” Dual-Modal Optical Immunoassay by Plasmonic Metal NP-Semiconductor Composites. Anal. Chem. 2021, 93, 3250–3257. [Google Scholar] [CrossRef]
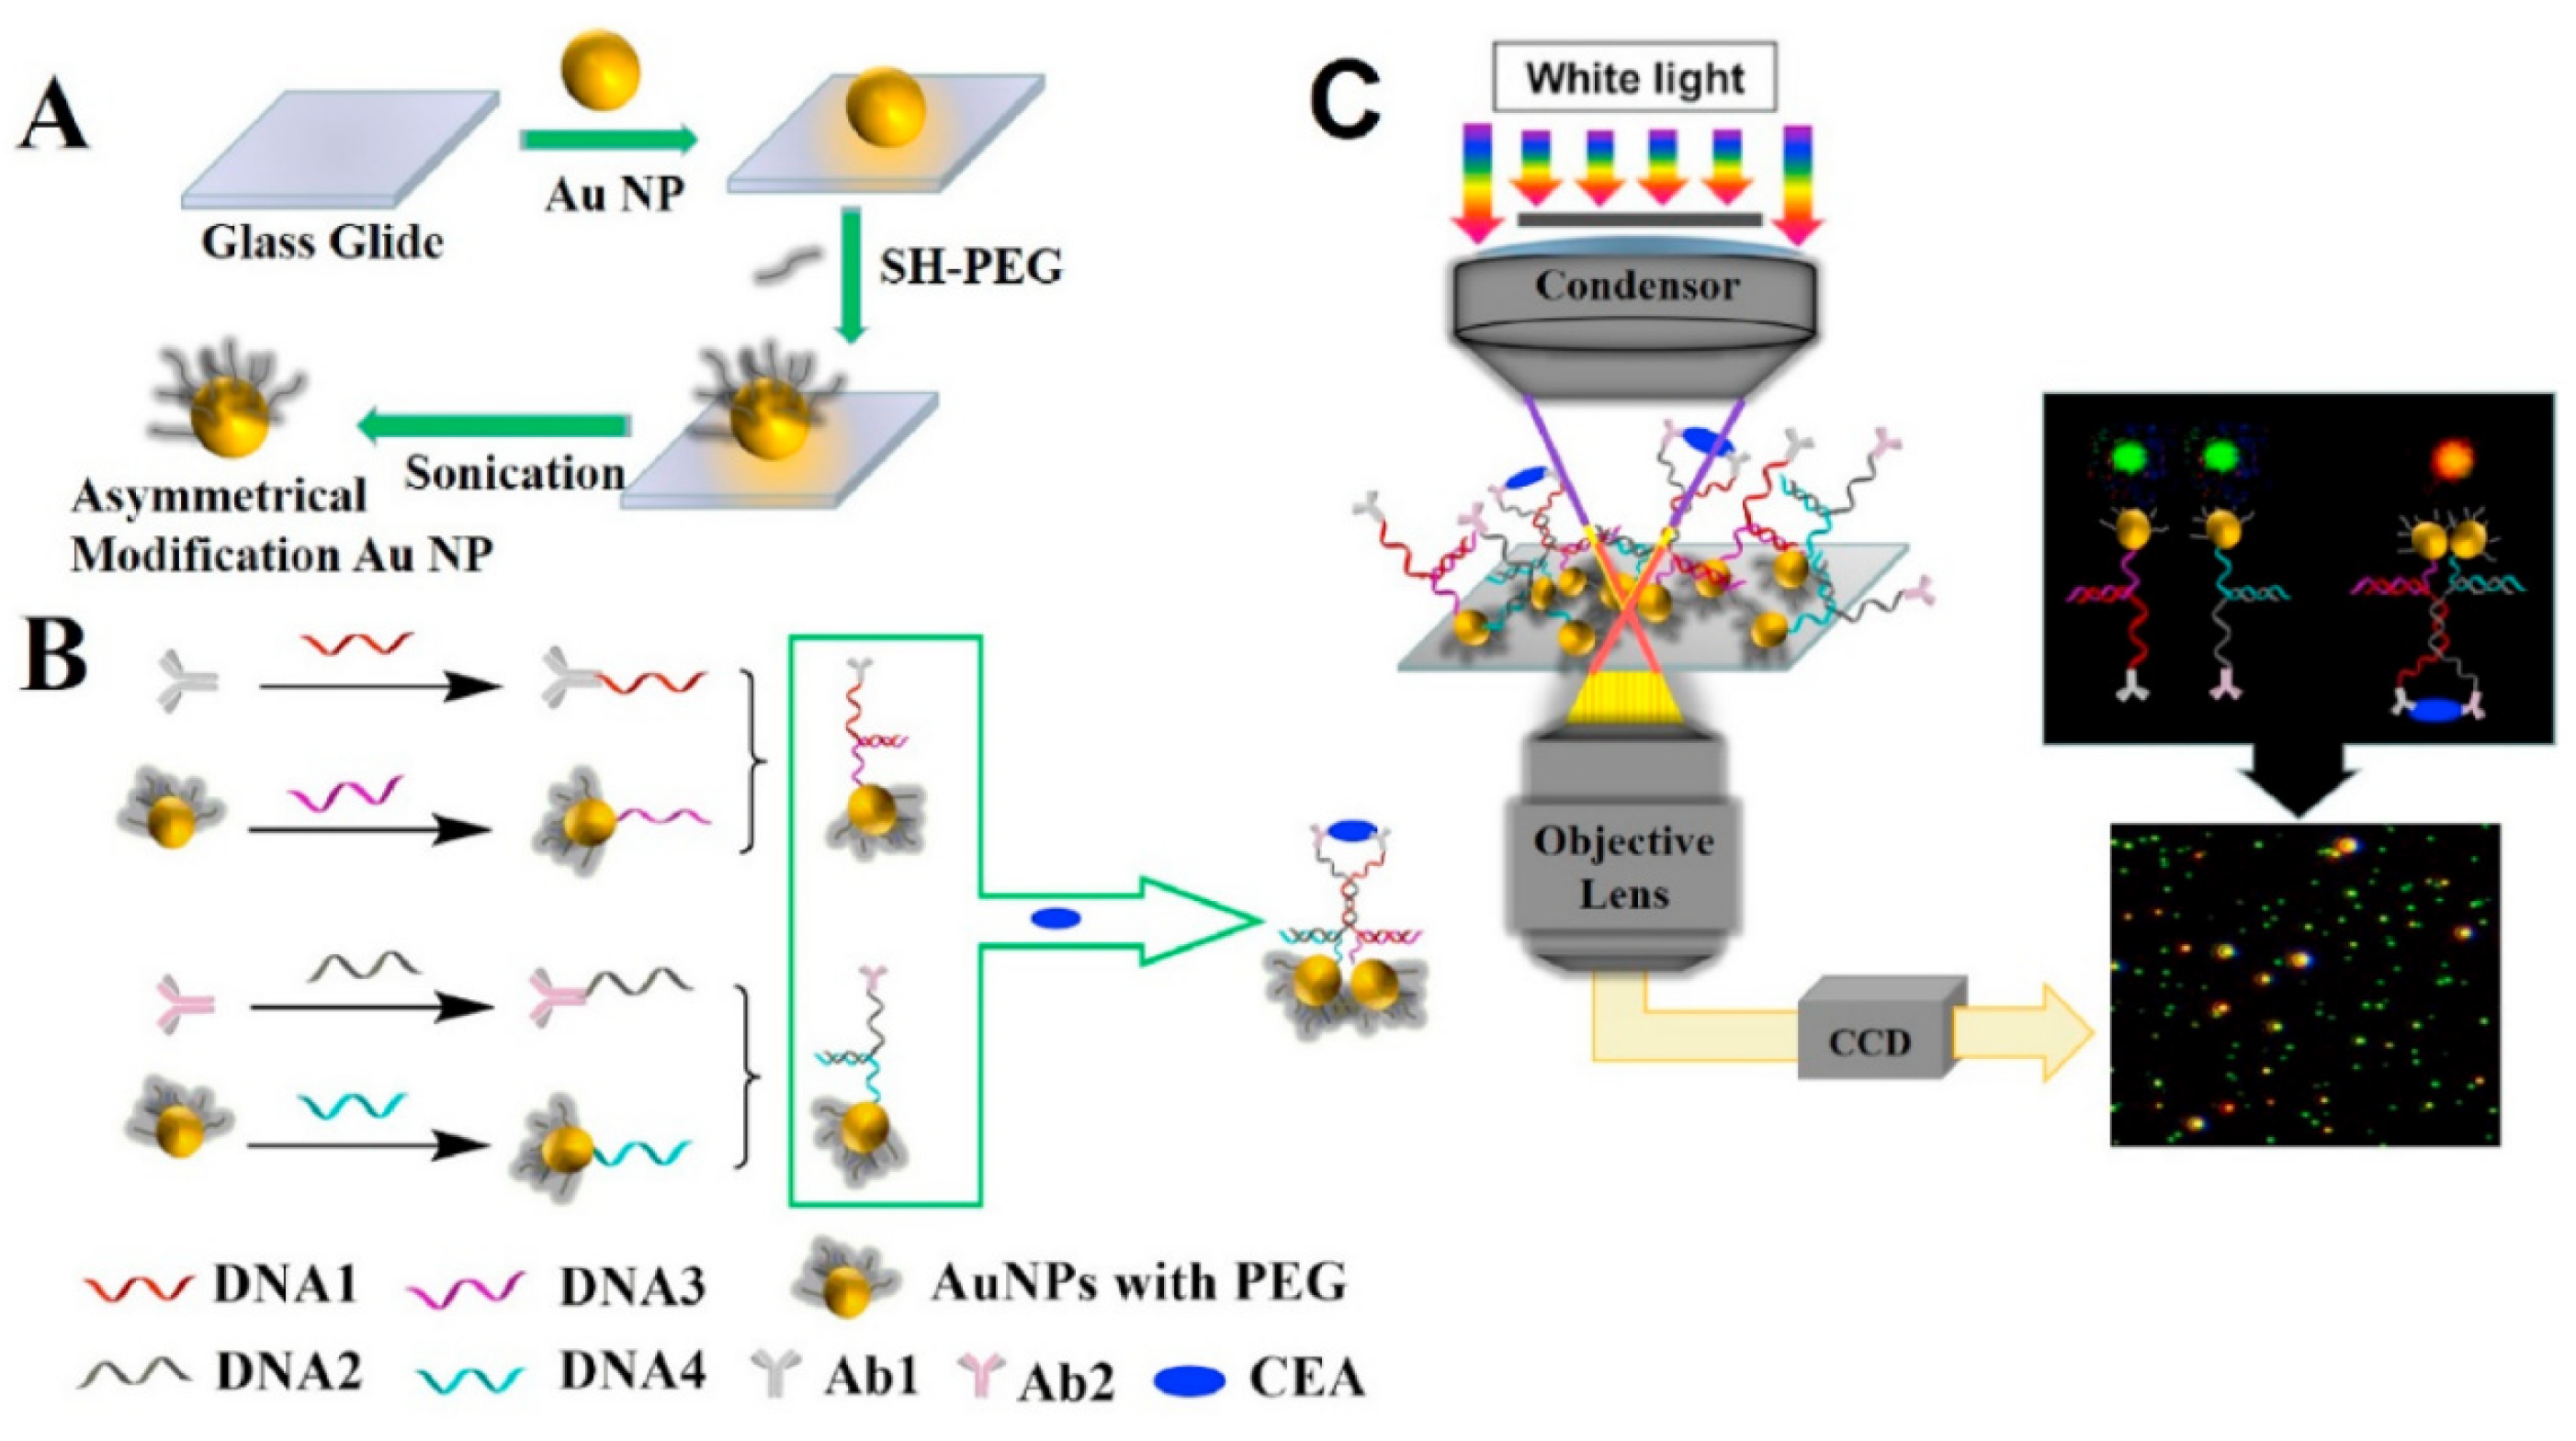
  110. Yang, Y.; Zhu, J.; Weng, G.-J.; Li, J.-J.; Zhao, J.-W. Gold nanoring core-shell satellites with abundant built-in hotspots and great analyte penetration: An immunoassay platform for the SERS/fluorescence-based detection of carcinoembryonic antigen. Chem. Eng. J. 2021, 409, 128173. [Google Scholar] [CrossRef]
  111. Kim, S.K.; Lee, J.U.; Jeon, M.J.; Kim, S.-K.; Hwang, S.-H.; Hong, M.E.; Sim, S.J. Bio-conjugated nanoarchitectonics with dual-labeled nanoparticles for a colorimetric and fluorescent dual-mode serological lateral flow immunoassay sensor in detection of SARS-CoV-2 in clinical samples. RSC Adv. 2023, 13, 27225–27232. [Google Scholar] [CrossRef]
  112. Wang, H.; Wang, T.; Zhong, S.; Zhang, J.; Yan, R.; Xu, P.; Zhang, Y.-h.; Yue, X.; Wang, L.; Wang, Y.; et al. Sensitivity investigation of a biosensor with resonant coupling of propagating surface plasmons to localized surface plasmons in the near infrared region. Nanoscale 2023, 15, 10826–10833. [Google Scholar] [CrossRef]
  113. Mittal, S.; Saharia, A.; Ismail, Y.; Petruccione, F.; Bourdine, A.V.; Morozov, O.G.; Demidov, V.V.; Yin, J.; Singh, G.; Tiwari, M. Spiral Shaped Photonic Crystal Fiber-Based Surface Plasmon Resonance Biosensor for Cancer Cell Detection. Photonics 2023, 10, 230. [Google Scholar] [CrossRef]
  114. Allison, G.; Sana, A.K.; Ogawa, Y.; Kato, H.; Ueno, K.; Misawa, H.; Hayashi, K.; Suzuki, H. A Fabry-Pérot cavity coupled surface plasmon photodiode for electrical biomolecular sensing. Nat. Commun. 2021, 12, 6483. [Google Scholar] [CrossRef] [PubMed]
  115. Ehiabhili, J.; Prabhu, R.; Kannan, S. Highly Sensitive D-SPR Sensors with Optimized Metallic Thin Films for Bio-Analyte Detection. Photonics 2024, 11, 764. [Google Scholar] [CrossRef]
  116. Hu, S.; Sun, C.; Wu, X.; Peng, Y. Polarization-Independent Terahertz Surface Plasmon Resonance Biosensor for Species Identification of Panax and Paeonia. Photonics 2023, 10, 250. [Google Scholar] [CrossRef]
  117. Clabassi, E.; Balestra, G.; Siciliano, G.; Polimeno, L.; Tarantini, I.; Primiceri, E.; Tobaldi, D.M.; Cuscunà, M.; Quaranta, F.; Passaseo, A.; et al. Hybrid Plasmonic Symmetry-Protected Bound state in the Continuum Entering the Zeptomolar Biodetection Range. Small 2025, 21, e2411827. [Google Scholar] [CrossRef]
  118. Geng, S.; Zhang, X.; Liang, H.; Zheng, Y. Photonic-Metamaterial-Based, Near-Field-Enhanced Biosensing Approach for Early Detection of Lung and Ovarian Cancer. Photonics 2024, 11, 1020. [Google Scholar] [CrossRef]
Figure 1. The mechanism of (A) a surface plasmon polariton and (B) a localized surface plasmon. Reprinted from [19]. © The Author(s) 2022. Creative Commons Attribution 4.0 International License.
Photonics 12 00294 g001
Figure 2. Schematic diagrams of prism-coupling SPR sensor structures. (a) Otto configuration; (b) Kretschmann configuration. Reprinted with permission from [37]. © 2021 Chinese Laser Press.
Photonics 12 00294 g002
Figure 3. SPR setup using half cylindrical prism as light coupler. Reprinted from [39]. © The Author(s) 2017. Creative Commons Attribution 4.0 International License.
Photonics 12 00294 g003
Figure 4. Schematic illustration (left) and selectivity (right) of the Au NBPs etching based multicolor colorimetric assay. Reprinted with permission from [47]. © 2019 Elsevier.
Photonics 12 00294 g004
Figure 5. Schematic illustration of the multicolor sensor array. Reprinted with permission from [48]. © 2020 Elsevier.
Photonics 12 00294 g005
Figure 6. Multiplex device architecture and assembly. (A) Dimensions of wax pattern features in each device component (B) Device assembly into the acrylic and springs support. (C) Flow assay to determine the minimum sample volume required. Reprinted with permission from [51]. © 2021 American Chemical Society.
Photonics 12 00294 g006
Figure 7. PCIS for tri-modal readout. Reprinted with permission from [52]. © 2023 Elsevier.
Photonics 12 00294 g007
Figure 8. (a) Schematic illustration of the biosensing platform. (b) Synthesis of a tailorable bumpy core−shell nanoprobe. (c) SNP-based digital SERS analysis combining the Raman intensity with the digital count. (d) Bumpy core−shell SERS nanoprobe-based detection. Reprinted with permission from [69]. © 2022 American Chemical Society.
Photonics 12 00294 g008
Figure 9. Principle of the prism assay. (a) Functionalization of the gold nanopyramid array plasmonic substrate and subsequent analyte detection. (b) Schematic symbols (left) and antigen capturing process. (c) The captured antigens in (b) transduce a spectral signal that can be analyzed by the shift in the peak. Reprinted with permission from [72]. © 2023 Wiley.
Photonics 12 00294 g009
Figure 10. (A) SERS-based VFA and (B) photograph of syringe filter apparatus. Reprinted with permission from [84]. © 2024 Royal Society of Chemistry.
Photonics 12 00294 g010
Figure 11. Working principle of the immune-like sandwich multiple hotspots SERS biosensor. (a) Schematic of the preparation of SERS nanotags, (b) Schematic of the preparation of molecularly imprinted capture substrates, and the SERS biosensor used for the determination of NDKA protein. Reprinted with permission from [85]. © 2024 Elsevier.
Photonics 12 00294 g011
Figure 12. (A) The preparation process of asymmetry Au NPs; (B)the process of proximity binding immunoassay-induced formation of gold nanoparticles dimers; (C) illustration of the proximity immunoassay based on the oriented assembly of Au NPs dimers and a dark-field microscope. Reprinted with permission from [102]. © 2021 Elsevier.
Photonics 12 00294 g012
Figure 13. Schematic of the proposed principle of the multiplexed immunoassay: (A) triple, homogeneous immune response; (B) possible probes in the immune reaction; (C) corresponding fluorescent spectral patterns colored in red; (D) corresponding scattering spectral patterns colored in green; (E) corresponding merged images (C,D) pictures; and (F) corresponding converted spectra from the panel (E). Reprinted with permission from [106]. © 2022 American Chemical Society.
Photonics 12 00294 g013
Figure 14. Smartphone analysis and DFM observation for AFB1 detection based on the disintegration of core–shell Ag@Au NPs. Reprinted with permission from [108]. © 2024 Elsevier.
Photonics 12 00294 g014
Figure 15. Fabrication (a), functionalization (b), and biosensing schematic (c) of the GF-AuNPs sensor. Reprinted with permission from [112]. © 2023 Royal Society of Chemistry.
Photonics 12 00294 g015
Figure 16. Surface plasmon detection and Fabry–Pérot enhancement. Reprinted with permission from [114]. © The Author(s) 2021. Creative Commons Attribution 4.0 International License.
Photonics 12 00294 g016
Table 1. Comparison of sensitivity and dynamic range in surface plasmon resonance-based biomolecular detection.
MethodAnalyteSensitivityDetection RangeReferences
Colorimetric sensingHorseradish peroxidase0.02 mM0.05–90 μM[34]
C reactive protein3 × 10−8 g/mL10−8–10−5 g/mL[37]
Zeralenone0.10 ng/mL0.10–2.0 ng/mL[39]
Glucose, uric acid, cholesterol1.25 Mm, 71 μM, 81 μM1.25–20 mM, 0–1 mM, 0–325 μM[38]
Surface enhanced Raman scatteringAdiponectin3.0 × 10−16 g/mL10−15–10−6 g/mL[53]
SARS-CoV-2 spike protein7.1 × 10 −16 M3.7 × 10−15–3.7 × 10⁻⁸ M[56]
Starch like protein-β1-4212.1 pM0.1–50 nM[68]
Cardiac troponin I0.33 pg/mL0.001–50.0 ng/mL[44]
Plasmon fluorescenceChloramphenicol, sulfamethoxazole0.0045 ng/mL, 0.038 ng/mL0.005–500 ng/mL, 0.0005–50 ng/mL[80]
Cardiac troponin I21.2 ag mL−10–0.5 pg/mL[79]
DNA target3.3 copies/μL10−1–10−6 copies/uL[3]
IL-6283 ag/mL0.81 ag/mL–5000 pg/mL[1]
Dark-field detectionE. coli61 CFU/mL6.1 × 101–6.1 × 10⁶ CFU/mL[88]
Tyrosinase0.003 U/L0.01–0.8 U/L[90]
Monoamine oxidase0.4 ng/mL0.5–20.0 ng/mL[94]
Aflatoxin B13.67 fg/mL10−12–10−8 g/mL[95]
Disclaimer/Publisher’s Note: The statements, opinions and data contained in all publications are solely those of the individual author(s) and contributor(s) and not of MDPI and/or the editor(s). MDPI and/or the editor(s) disclaim responsibility for any injury to people or property resulting from any ideas, methods, instructions or products referred to in the content.

