1. Introduction
Surface plasmon resonance (SPR) is an optical phenomenon based on the excitation of surface plasmons, which significantly enhances light–matter interactions and is widely utilized in high-sensitivity sensing applications [
1]. SPR occurs at the interface between a metal and a dielectric material, where the interaction between evanescent waves and surface plasmon waves takes place. When light of a specific wavelength is incident on the surface, a portion is reflected, while another portion generates an evanescent wave. If the penetration depth of this evanescent wave exceeds the thickness of the metal film, SPR is induced. Under phase-matching conditions, the evanescent wave and surface plasmon wave resonate synchronously, resulting in a sharp dip in the reflected light intensity. This sensitivity to environmental changes enables the detection of refractive index variations through shifts in the resonance peak, facilitating precise environmental and biochemical analysis [
2].
SPR sensors operate by analyzing the interaction between surface plasmon waves and surrounding biomolecules. Variations in solution concentration induce shifts in the SPR resonance dip, altering either the resonance angle or wavelength. By monitoring these changes, accurate measurements of the refractive index can be achieved. SPR biosensors offer several advantages, including label-free detection, rapid response times, and high sensitivity [
3], making them highly suitable for applications in chemical sensing, biosensing, and environmental monitoring [
4,
5,
6]. However, the sensitivity of conventional SPR sensors is often constrained by the limitations of single-layer metal films and intrinsic Ohmic losses, which hinder their performance in ultra-trace detection scenarios.
The Bloch surface wave (BSW) represents an alternative surface wave phenomenon that shares fundamental similarities with SPR but operates through photonic bandgap engineering in dielectric multilayer structures. Compared to SPR, the BSW exhibits lower optical losses and stronger electromagnetic field confinement, theoretically enabling sharper resonance peaks and significantly enhanced figures of merit (
FOMs) [
7,
8,
9]. A notable advancement was demonstrated by Tang et al., who proposed a BSW sensor based on a hollow fiber (HF) internally coated with one-dimensional photonic crystal (1DPC) composed of alternating TiO
2/SiO
2 bilayers. This work marked the first implementation of 1DPC in HF-based sensing platforms, achieving an exceptional
FOM exceeding 1100 RIU
−1 [
9]. Despite these superior performance metrics, BSW sensors face critical challenges including intricate fabrication processes and constrained dynamic ranges, primarily due to the stringent structural periodicity requirements for maintaining photonic bandgap integrity.
To address the limitations of conventional SPR sensors while maintaining a balance between practicality and performance, researchers have pursued two primary strategies: fiber microstructure sensitization and material modification sensitization [
10]. Fiber microstructure sensitization involves the design of specific geometric configurations to enhance light–matter interactions. For example, Wang et al. developed a U-shaped fiber SPR sensor with a sensitivity of 3687 nm/RIU [
11], while Dogan et al. achieved a remarkable sensitivity of 11,775 nm/RIU using a D-shaped fiber with a multilayer metal-grating structure [
12]. Using novel fiber types like photonic crystal or microstructured fibers as substrates can further enhance SPR sensor sensitivity [
13,
14,
15].
Material modification sensitization involves introducing various materials onto the surface of the sensing metal film to enhance sensor sensitivity by adjusting the dielectric constant or improving the surface plasmon polarization effect [
16]. In 2023, Yin et al. introduced a modified indium selenide (InSe) metal film to the surface of a fiber SPR sensor, increasing its sensitivity to 4655.76 nm/RIU [
17]. The following year, Ji et al. utilized polydimethylsiloxane (PDMS) to fill the side-polished hollow fiber, combined with a gold film and an overlaid Ge
2Sb
2Te
5 (GST) auxiliary layer, achieving a sensitivity of 10,758 nm/RIU, a 622.6% improvement over traditional side-polished SPR sensors [
18]. Furthermore, two-dimensional materials such as graphene play a crucial role in enhancing the sensitivity of fiber SPR sensors [
19]. According to research by Wei et al., the sensitivity of plastic optical fiber SPR sensors more than doubled after modifying the gold film surface with graphene, while repeatability and response time were also significantly optimized [
20].
These studies present a diverse array of strategies for enhancing the sensitivity of SPR sensors. As a highly sensitive and extensively utilized sensor architecture, the gold-film-based fiber SPR sensor [
21] demonstrates relatively superior performance; however, it still falls short of meeting the escalating demands in critical fields such as biomedical detection. Consequently, further advancements in sensitivity are imperative. In this context, we adopt the gold-film-based fiber SPR sensor as the foundational platform and aim to optimize its performance to address more stringent application requirements. The technical parameters of conventional gold-film-based fiber SPR sensors are summarized in
Table 1.
TRIZ (Theory of Inventive Problem Solving) is a systematic innovation methodology developed by Soviet inventor Genrich Altshuller and others through the analysis of patents and case studies. It integrates not only a collection of innovative technical theories but also a range of practical tools designed to address diverse engineering and technological challenges. In practical applications, solving problems using TRIZ requires following three steps: problem identification, problem solving, and concept validation. As a problem-solving-based innovation method, TRIZ provides effective solutions to problems across various fields. For example, in traditional engineering practice problem-solving, TRIZ has been applied in the mining engineering field. Yao et al. utilized TRIZ to optimize tunnel support design, proposing an innovative fully enclosed shell support technology [
22]. In the field of sensor sensitization, Zhu designed a novel multimode–single-mode–multimode fiber sensor based on the structure of gold (Au)–molybdenum disulfide (MoS
2)–gold nanoparticles by using TRIZ [
23]. The aforementioned innovative practices provide both a practical reference and theoretical guidance for applying TRIZ to address the sensitivity issues of SPR sensors.
Based on an in-depth analysis of the existing sensitization principles of SPR sensors, this study focuses on gold-film-based fiber SPR sensors as the current system for problem identification. After identifying the key issues, TRIZ is applied to conduct a comprehensive innovative analysis of the sensitization pathways. The analysis adopts a multidimensional perspective, transitioning from the overall to the specific, from the surface to the deeper layers, and from the macro to the micro, to explore the innovative potential of each pathway. The innovative design aims to optimize the performance of the current system, emphasizing stability, high repeatability, and ease of fabrication, while significantly enhancing sensor performance to address the technical challenge of insufficient sensitivity for detection requirements.
3. Results
By applying TRIZ, key issues that are not immediately apparent are identified through functional analysis, causal analysis, and Nine-Window analysis. During the problem-solving phase, tools such as Technical Contradiction, Physical Contradiction, the Smart Little Man method, and substance–field analysis are utilized to address both the primary challenges and the secondary issues that emerge throughout the process, ultimately achieving the desired objectives.
3.1. Technical Contradiction
When an improvement in one engineering parameter of a system results in the deterioration of another engineering parameter, this conflict between different parameters within the same system is termed a Technical Contradiction [
27]. In practice, the deteriorated parameter and the parameter requiring improvement are generalized into universal engineering parameters. The Contradiction matrix is then consulted to select the appropriate inventive principle, which provides guidance for identifying the most suitable solution to resolve the Contradiction.
In addressing the issue of short incident light wavelength identified in the causal analysis, we attempt to explore this using Technical Contradiction, as illustrated in
Table 2. This Contradiction necessitates an effective solution in subsequent designs to balance the relationship between fiber sensitivity and incident light wavelength.
Based on the above analysis, the improved parameter is the evanescent wave penetration depth, which, according to the Contradiction matrix, is generalized as energy loss. The corresponding deteriorated parameter is the matching degree with the plasmon frequency of the gold film, which fundamentally affects the sensor’s sensitivity, i.e., the reliability of the sensor’s detection function. Therefore, it is generalized as reliability. By consulting the 40 inventive principles, we select Principle 35: Change in Physical or Chemical Parameters to resolve this Contradiction, resulting in Solution 1: the use of transparent ITO thin films. ITO, as a transparent oxide material capable of exciting SPR effects, can generate evanescent waves in the near-infrared wavelength range. By attaching it to the gold film, it effectively modifies the optical transparency and plasmon frequency of the metal film [
28]. Furthermore, to ensure that the reflection depth of the resonance spectrum remains unaffected and to maintain the SPR effect, the total thickness of the film must remain constant. Therefore, by introducing ITO thin films, it is necessary to reduce the thickness of the gold film to allow more incident light to penetrate the gold layer, thereby interacting with the ITO film. The synergistic effect of introducing the ITO film and optimizing the gold film thickness reduces reflection and scattering within the sensor, thereby increasing the depth of the evanescent field, enhancing the sensor’s sensitivity, and expanding the detection range.
3.2. Physical Contradiction
A Physical Contradiction refers to a situation where conflicting yet reasonable requirements are imposed on the same object or sub-system in the process of achieving a specific function. It typically involves two scenarios: (1) the reduction in a harmful function within a sub-system leads to the reduction in a useful function, and (2) the enhancement of a useful function within a sub-system results in the strengthening of a harmful function [
24].
For the key issue of a low refractive index at the effective fiber core, a Physical Contradiction exists: on one hand, a higher refractive index is required for the fiber to expand the sensing range; on the other hand, a lower refractive index is needed for the cladding to ensure total internal reflection. This Physical Contradiction is summarized in
Table 3, as shown below:
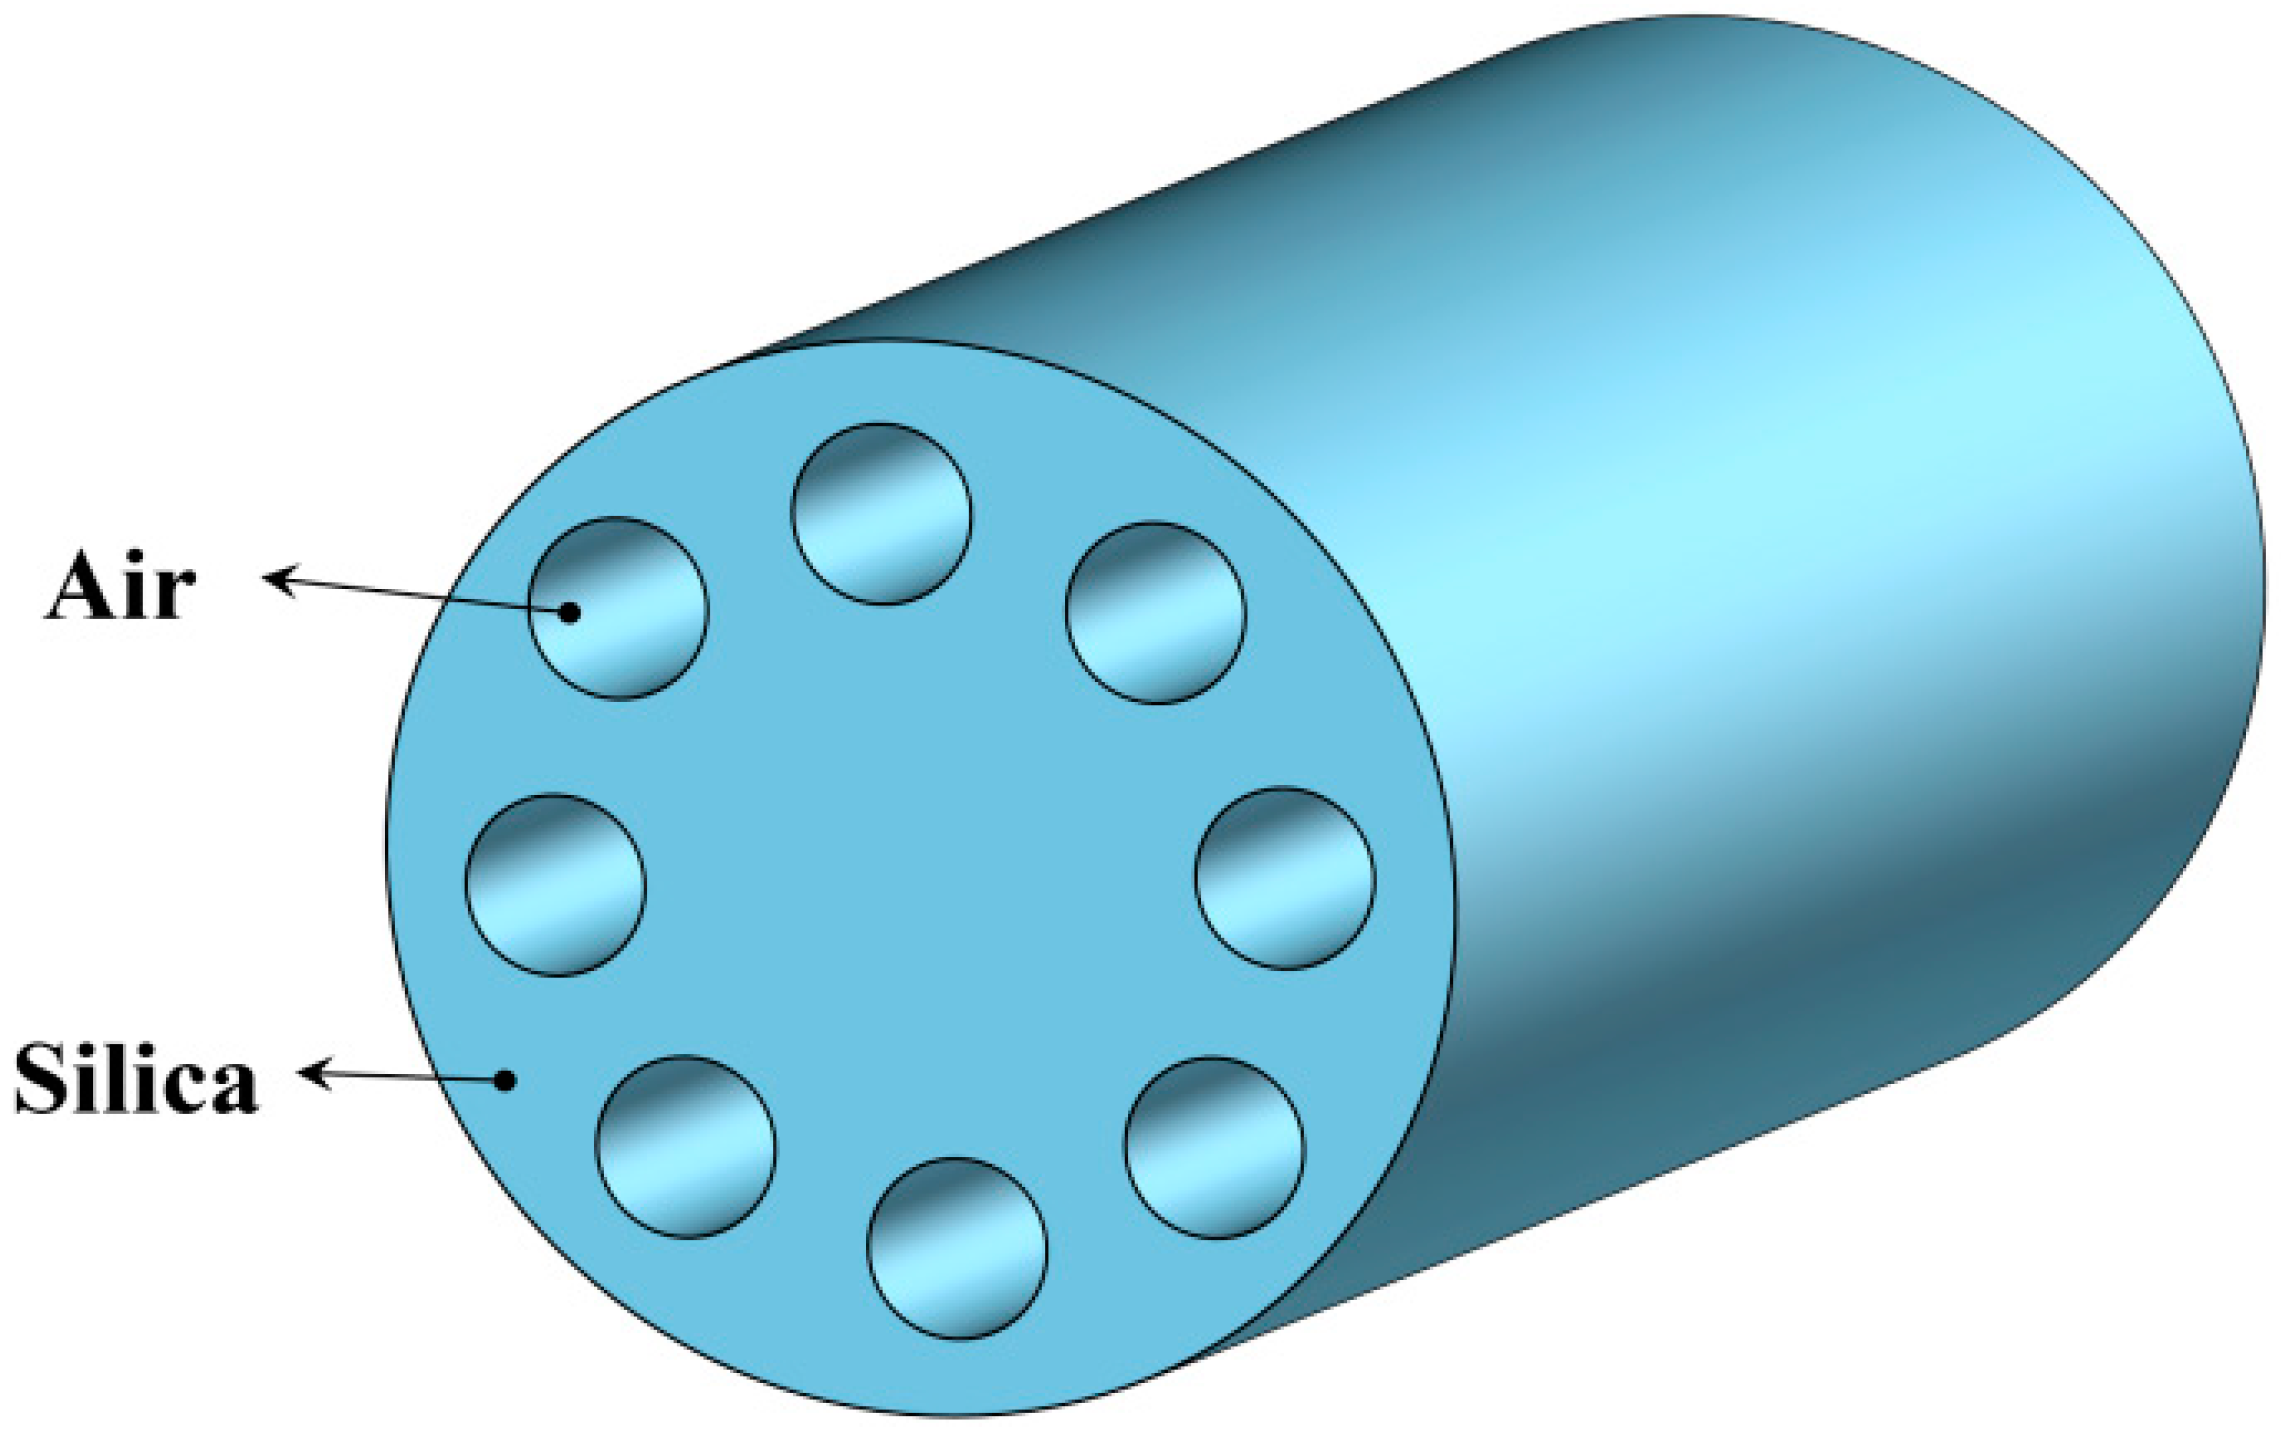
According to TRIZ, there are five primary methods for resolving Physical Contradictions: time separation, space separation, relation separation, direction separation, and system hierarchy separation. To address the aforementioned issue, the strategy of relation separation is adopted, enabling distinct characteristics to be assigned to the various components of the engineering system, thereby effectively resolving the Contradiction. Based on Inventive Principle 31, Porous Materials, Solution 2 is proposed: the use of photonic crystal fiber (PCF) consisting of a solid core and eight surrounding air-hole claddings, as illustrated in
Figure 5.
For the optical fiber, the solid core exhibits a higher refractive index, significantly enhancing the detection range of environmental refractive indices and increasing the wavelength sensitivity of the x and y fundamental modes, thereby extending the sensing range. As for the cladding, the outer porous layer effectively reduces the average refractive index of the fiber cladding, ensuring the satisfaction of total internal reflection conditions. This allows light to continuously reflect within the fiber and propagate along the axis, minimizing light loss that would otherwise leak from the cladding to the external environment, thus further improving the sensor’s signal strength and stability.
However, when using PCF with a symmetric air-hole structure, the effective mode field area is relatively small, which limits the sensor’s detection range and fails to meet the requirements for the sufficient detection of small-molecular-weight analytes. Therefore, further analysis will be conducted.
3.3. The Smart Little Man Method
The Smart Little Man method in TRIZ is an innovative tool designed to break traditional thinking patterns. When certain components in a system fail to effectively perform their intended functions and exhibit contradictory interactions, the system’s operation and interdependencies can be represented through multiple dynamic models of functional components. This approach facilitates the reconfiguration and redesign of the system and its structure, enabling a fresh perspective on the problem, uncovering potential solutions, and ultimately achieving the desired functionality.
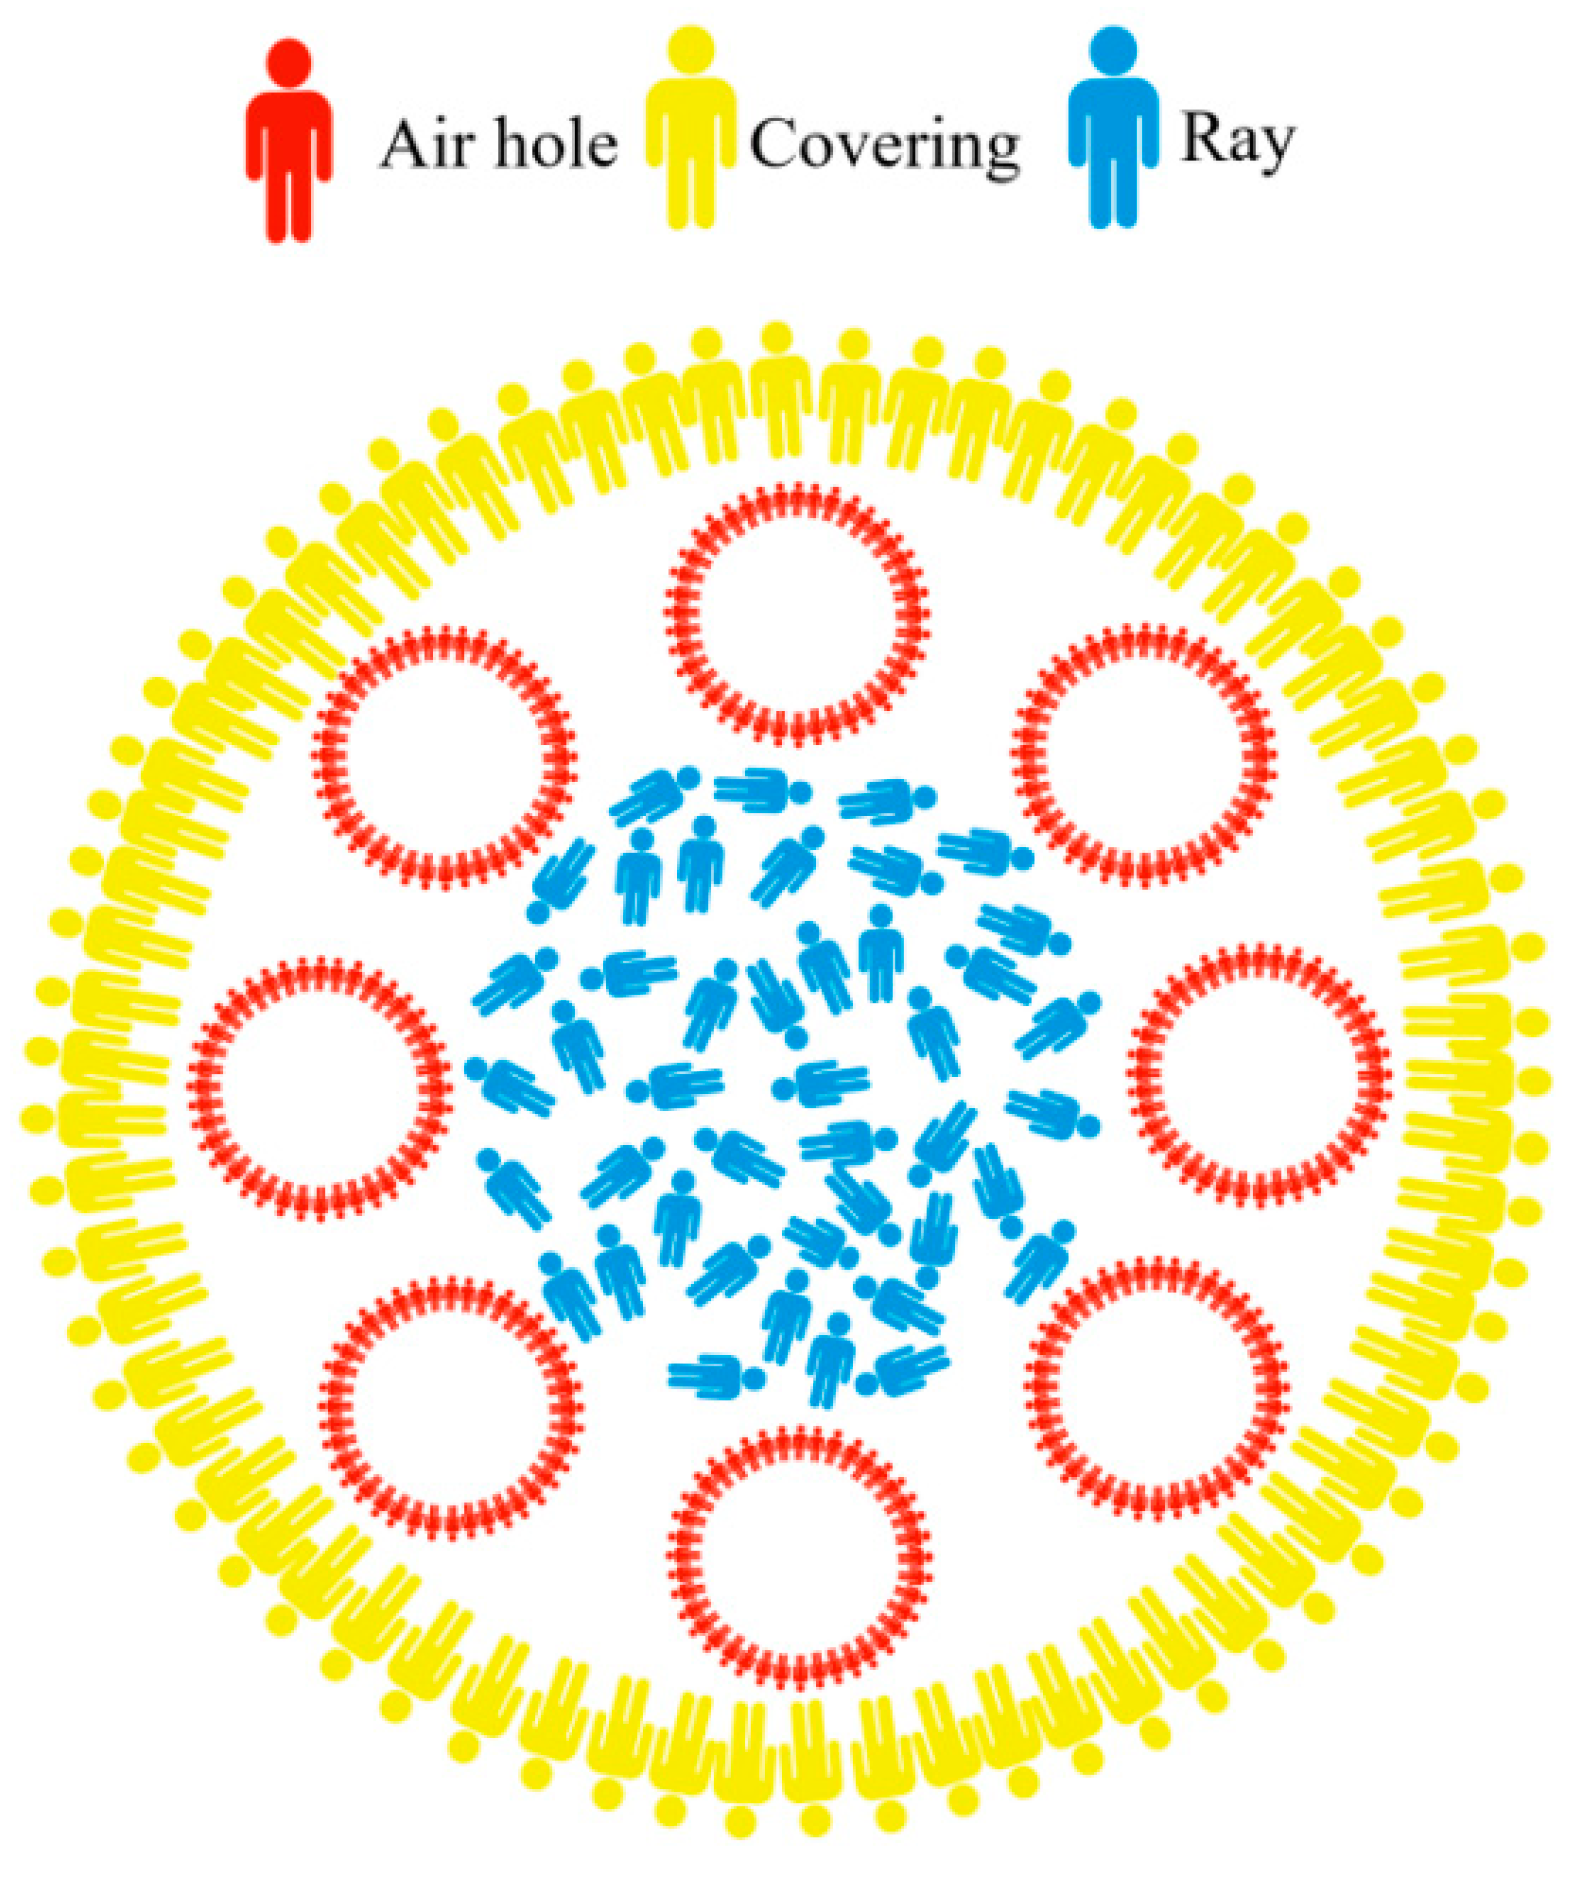
To address the secondary issue of the limited detection range of the sensor, we approach the problem from a macro- to micro-perspective, hypothesizing three types of “little men”: the red little man represents the air holes inside the photonic crystal fiber, the yellow little man represents the cladding, and the blue little man represents the mode field.
In the initial state, the pores form eight regularly symmetrical circular patterns, causing light to be confined within the fiber and unable to effectively escape. This results in a smaller mode field area and insufficient birefringence, thereby increasing the nonlinear effects of the sensor, as illustrated in
Figure 6.
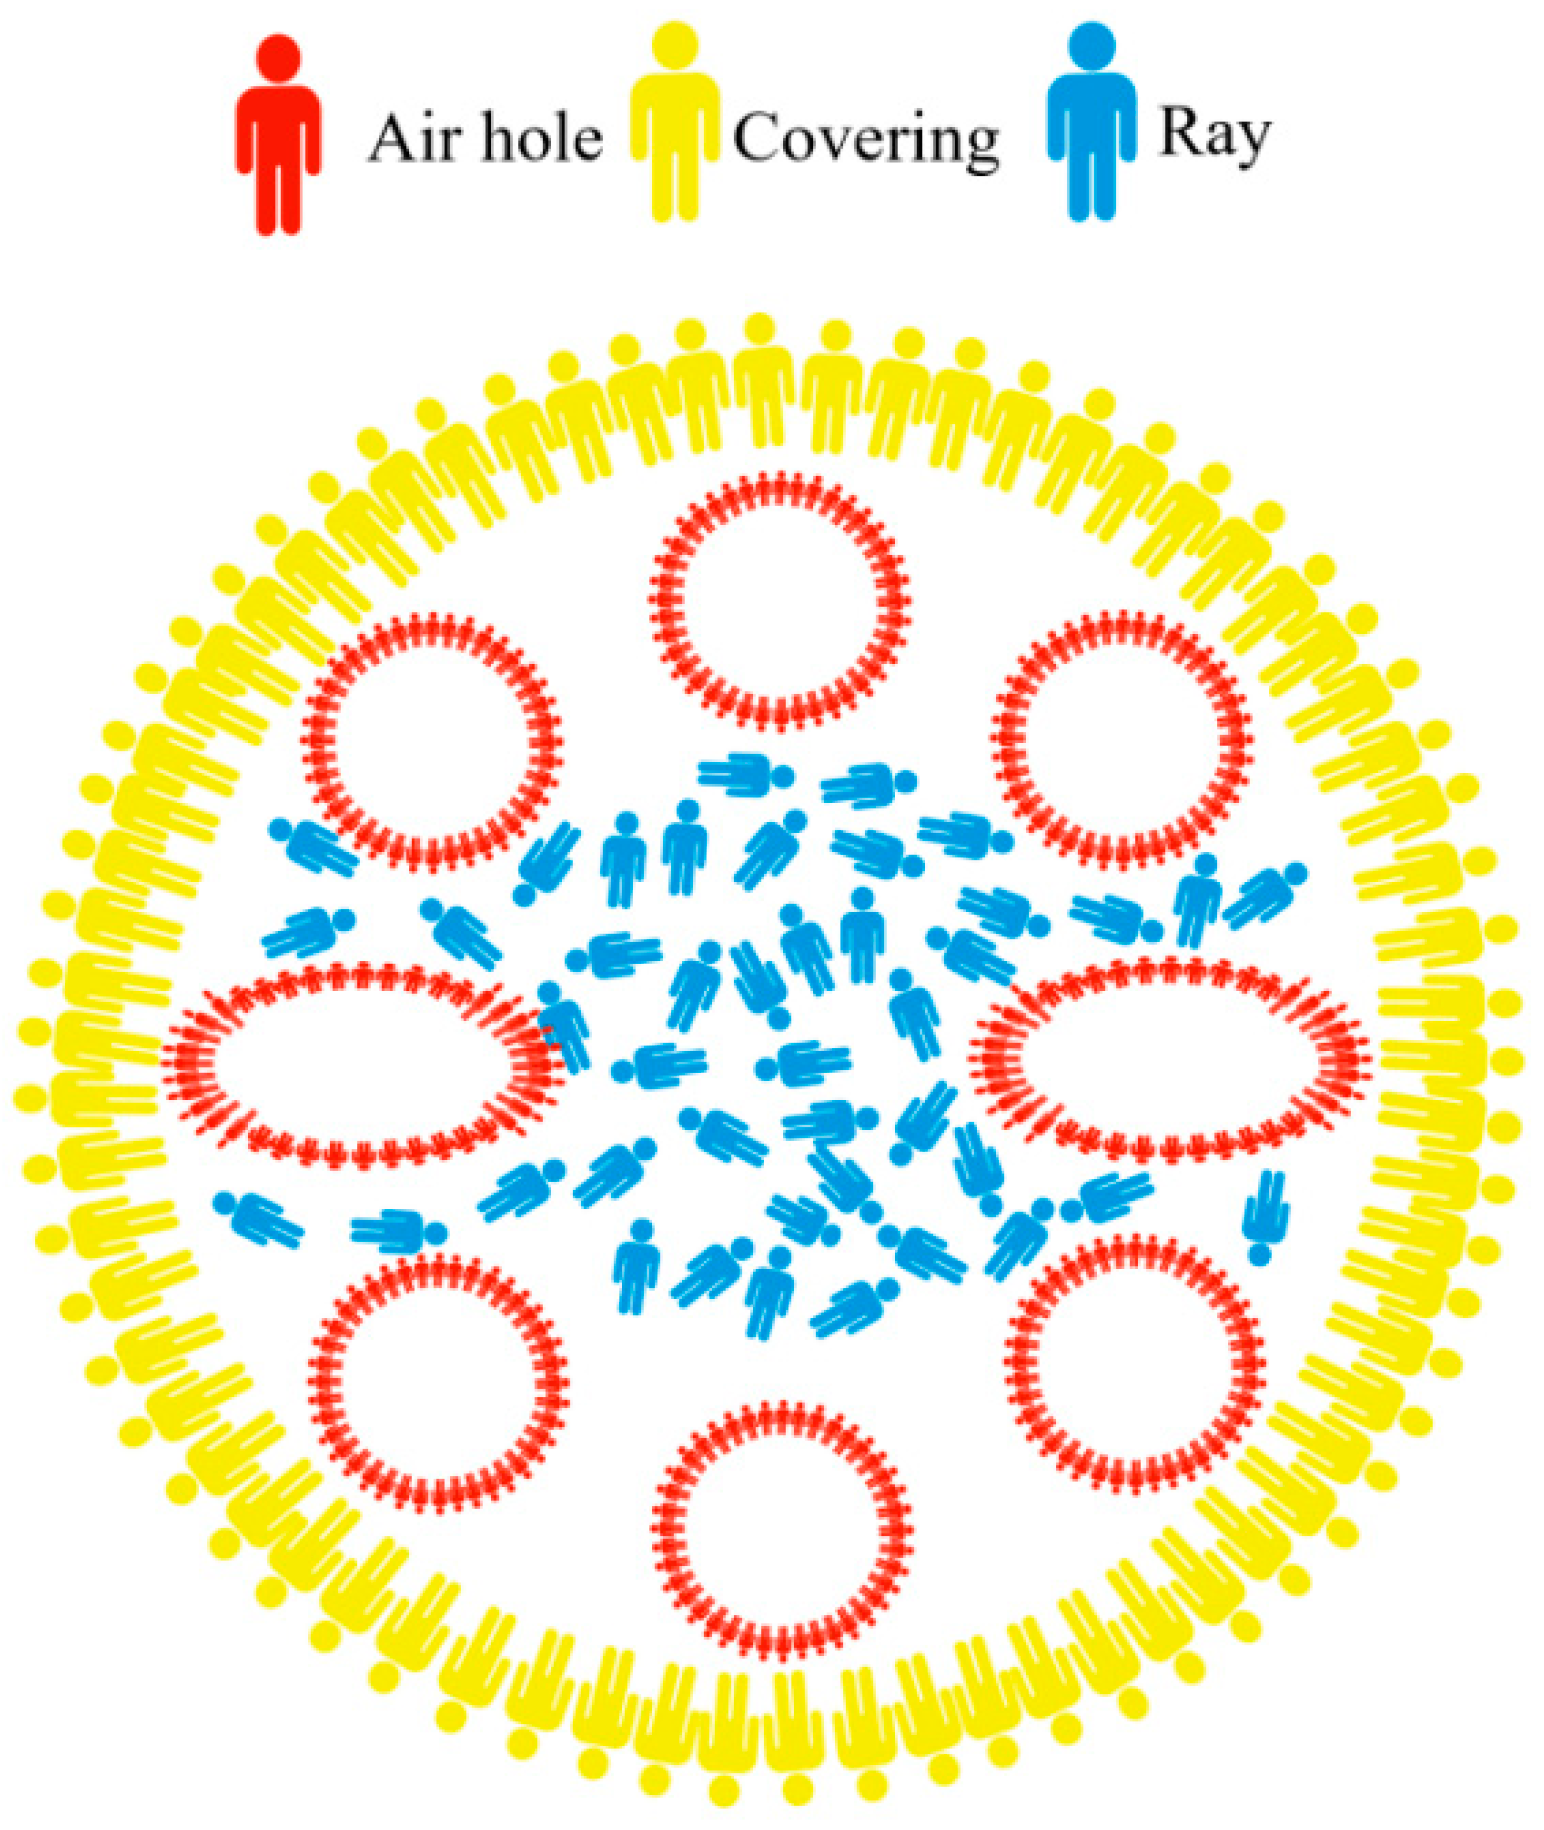
Therefore, we attempt to adjust the structure of the air holes at the microscopic level by changing the two circular air holes along the
x-axis to elliptical air holes. This longitudinal compression of the mode field enables the blue little man (mode field) to expand in the
x-direction, thereby enhancing the effective mode field area, as illustrated in
Figure 7.
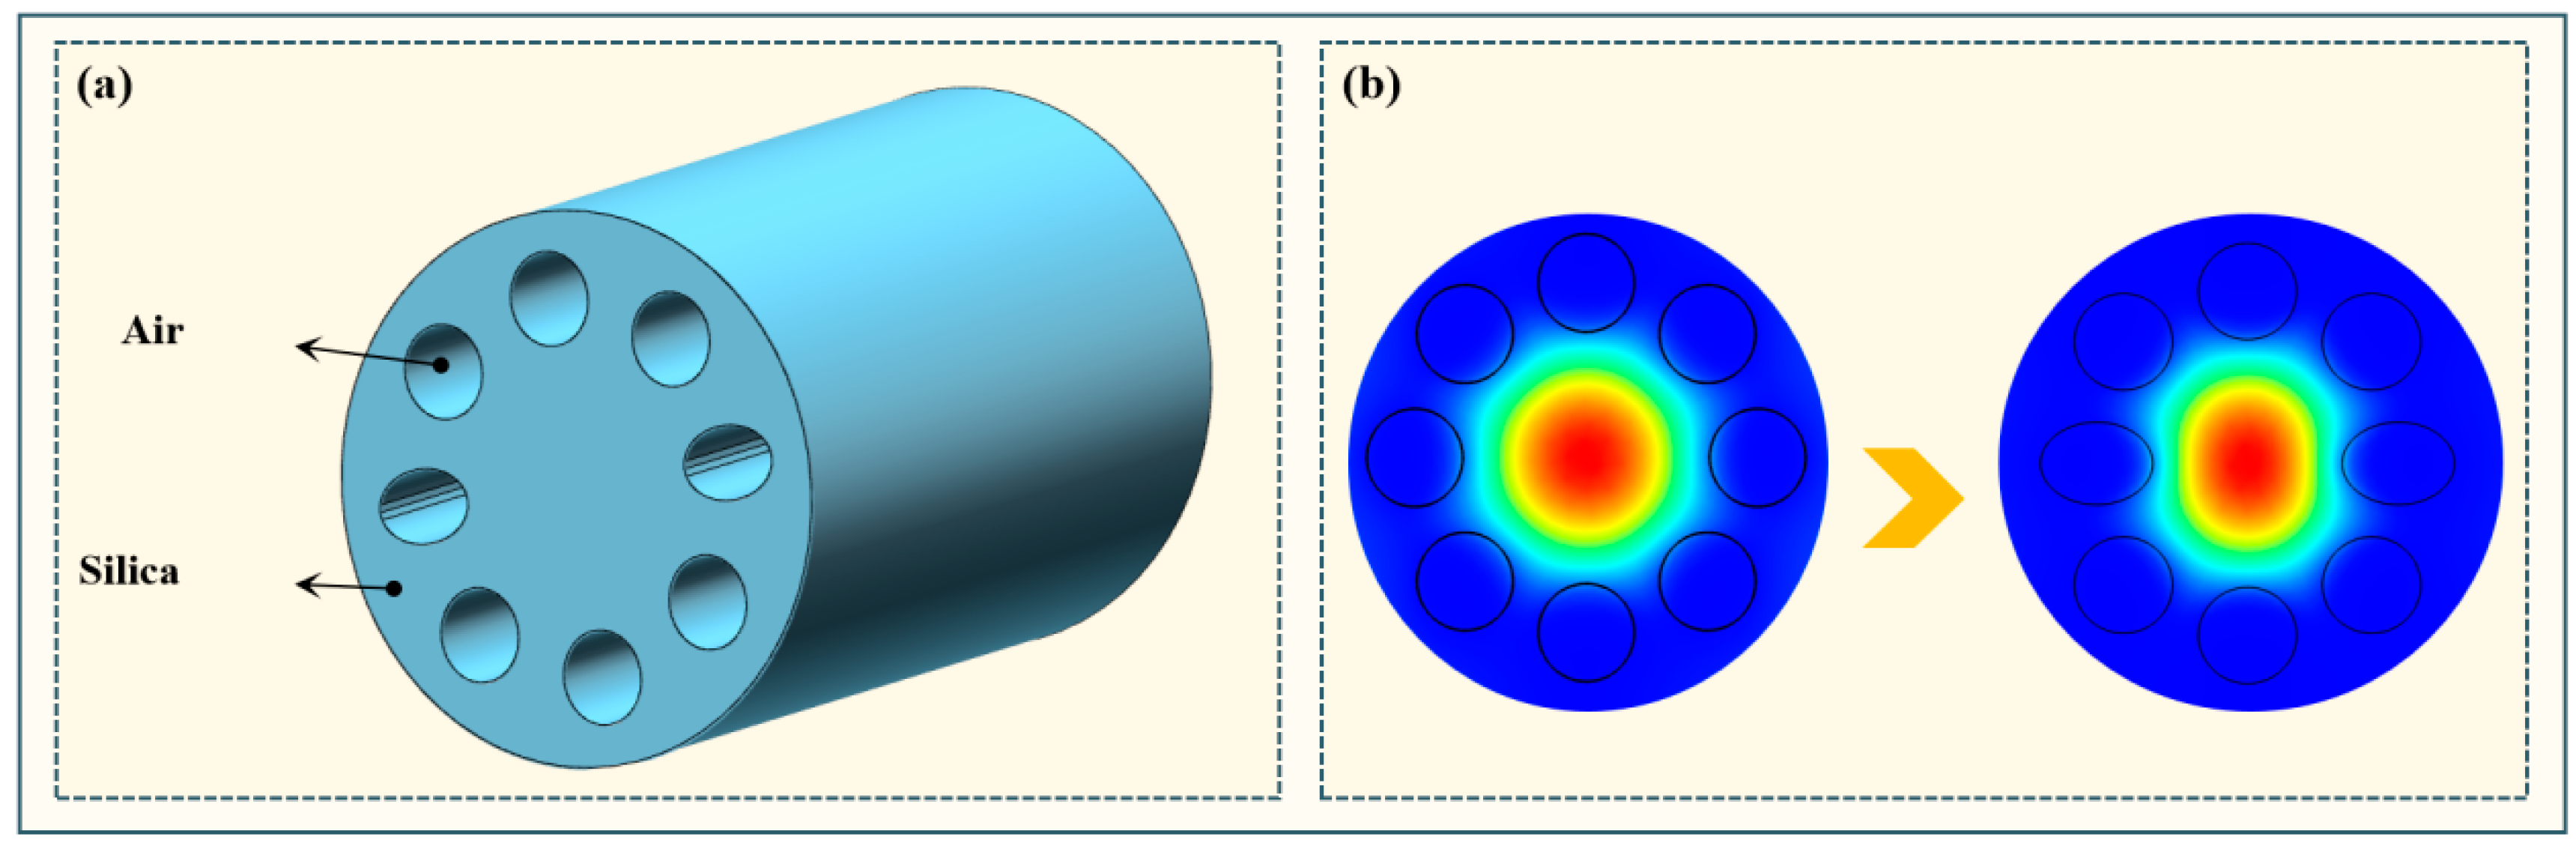
Based on this, Solution 3 is proposed: the design of an asymmetric photonic crystal fiber structure with elliptical pores, as illustrated in
Figure 8a. By incorporating elliptical pores along the
x-axis, the mode field is compressed longitudinally, allowing light to be more effectively confined within the core, thereby reducing its propagation capacity. Furthermore, the optical energy along the
x-axis more easily leaks into the cladding, resulting in an increased effective mode field area. This helps mitigate the impact of nonlinear effects, preserves the polarization characteristics, and enhances the birefringence, as shown in
Figure 8b.
3.4. Object–Field Analysis
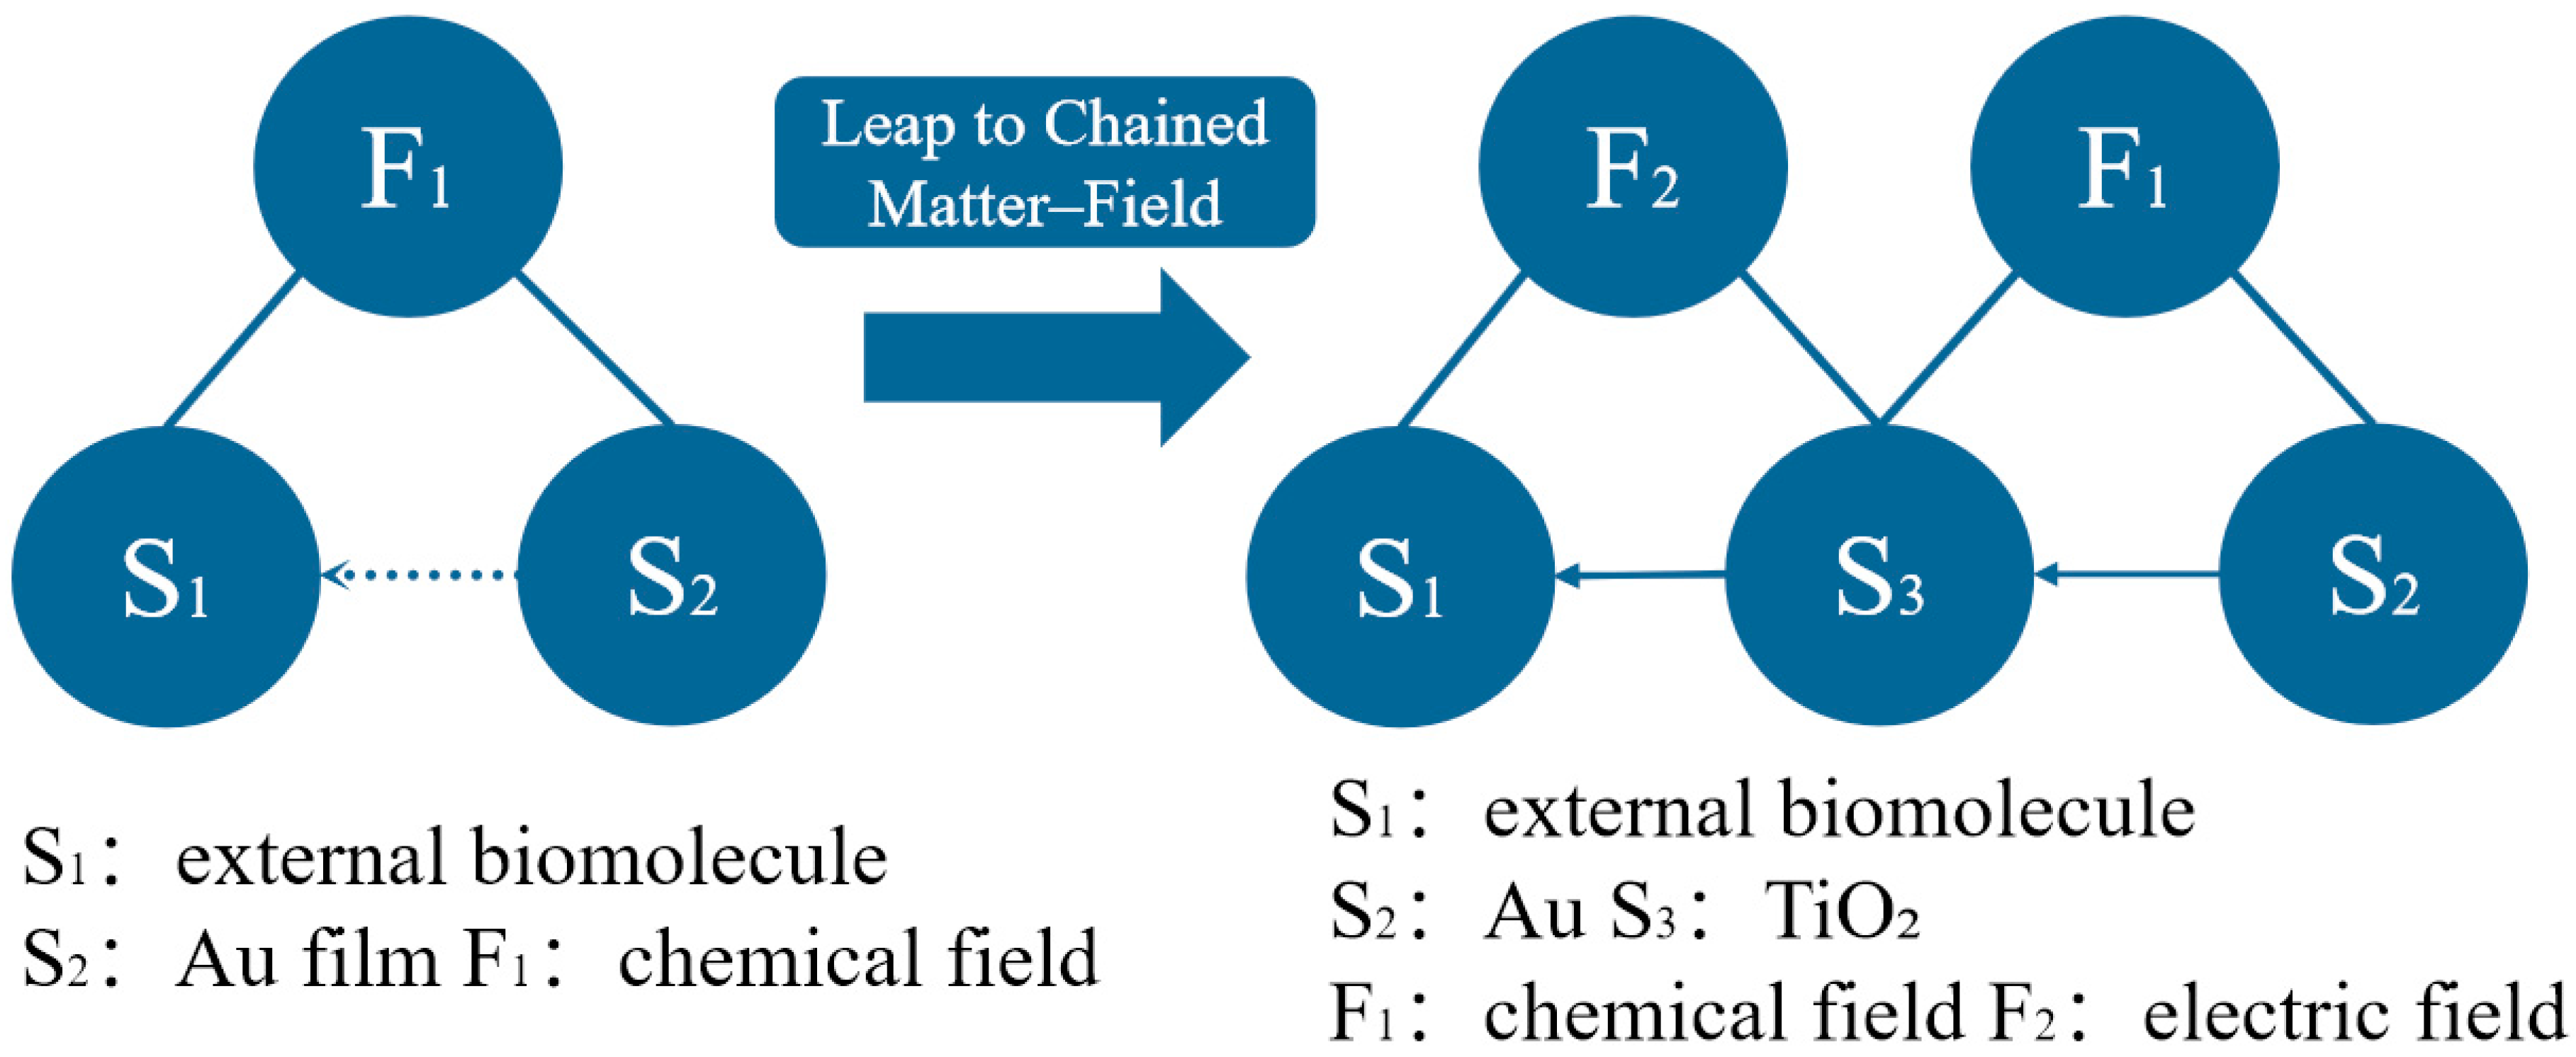
To resolve the critical issue of weak interaction between the gold film and external molecules, we utilize substance–field (su–field) analysis, categorizing it as an incomplete su–field model. The goal of su–field analysis is to deeply identify the interactions between substances and fields within the system, uncover potential issues, and provide 76 standard solutions for addressing these problems, thereby effectively promoting technological improvement and innovation [
29]. In su–field analysis, “S” represents the substance, and “F” represents the field.
Based on the relevant standard solution types, we determined that the second standard solution can be applied to improve this su–field model. Through research, we found that introducing TiO
2 films can significantly enhance the binding strength between the gold film and external molecules [
30]. Based on TRIZ standard solution S2.1.1 [
31], we transform the single su–field model into a chained su–field model. By introducing substance S3 (TiO
2), the chemical field F1 generated by S2 (gold film) acts on S3 (TiO
2), and the electric field F2 produced by S3 (TiO
2) is applied to S1 (external molecules). This process significantly enhances the sensor’s binding capability with external molecules, thereby improving the sensor’s sensitivity. The specific process is illustrated in
Figure 9.
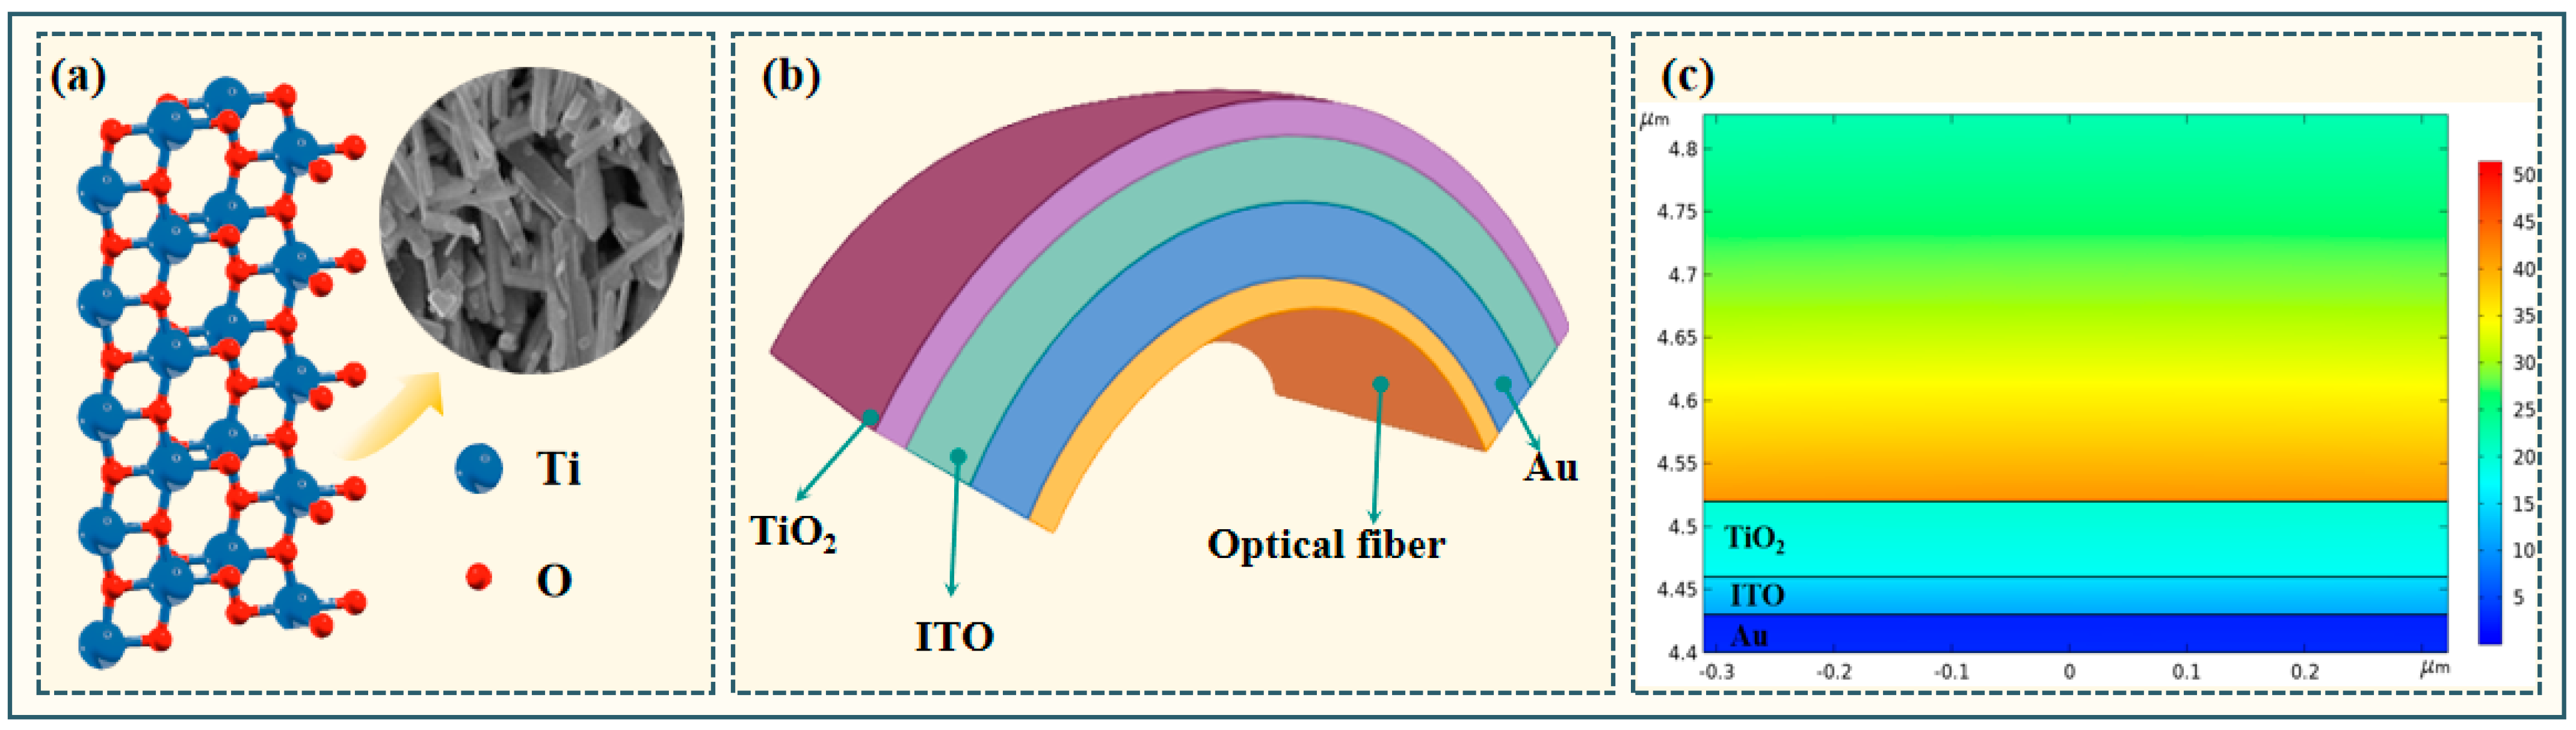
Based on this, Solution Four is proposed: using TiO
2 with bio-molecular immobilization properties as the thin film material, placing it as the outermost layer of the sensor, and thus constructing an efficient SPR sensor, as illustrated in
Figure 10b. Due to its porous network structure, TiO
2 exhibits excellent biocompatibility. The pore size generates physical adsorption forces on the target biological molecules, demonstrating strong affinity for biological molecules, which resolves the issue of weak bonding between the gold film and external molecules, as shown in
Figure 10a. Moreover, compared to other common metallic materials, titanium dioxide has a higher refractive index, enabling more effective excitation of surface plasmon waves [
32]. As a result, positioning it on the outer surface of the ITO and gold films can substantially enhance the SPR effect. Simulation analysis reveals that there is a charge transfer phenomenon between Au and TiO
2, and the composite material formed between them exhibits a higher dielectric constant, showing great potential for applications in optical fiber sensors. The simulation outcomes, comparing the electric field intensities of the gold and titanium dioxide thin films, are presented in
Figure 10c.
4. Discussion
Building on the four optimization strategies outlined above, they were sequentially implemented in the initial system, culminating in the development of an enhanced fiber-optic SPR sensor, as detailed in
Table 4.
The improved sensor structure is illustrated in
Figure 11a. The PCF sensor structure consists of three layers applied to its outer surface: TiO
2, ITO, and Au films, arranged from the outermost to the innermost layer. The design features eight air holes, with the axial air holes shaped as ellipses and the remaining air holes being circular. Simulation optimization indicated that the sensor achieved optimal sensitivity when the thicknesses of the TiO
2 film, ITO film, and gold film were set to 30 nm. The final structural parameters are presented in
Figure 11b, and the
Figure 11c shows the mesh diagram of the designed optical fiber sensor.
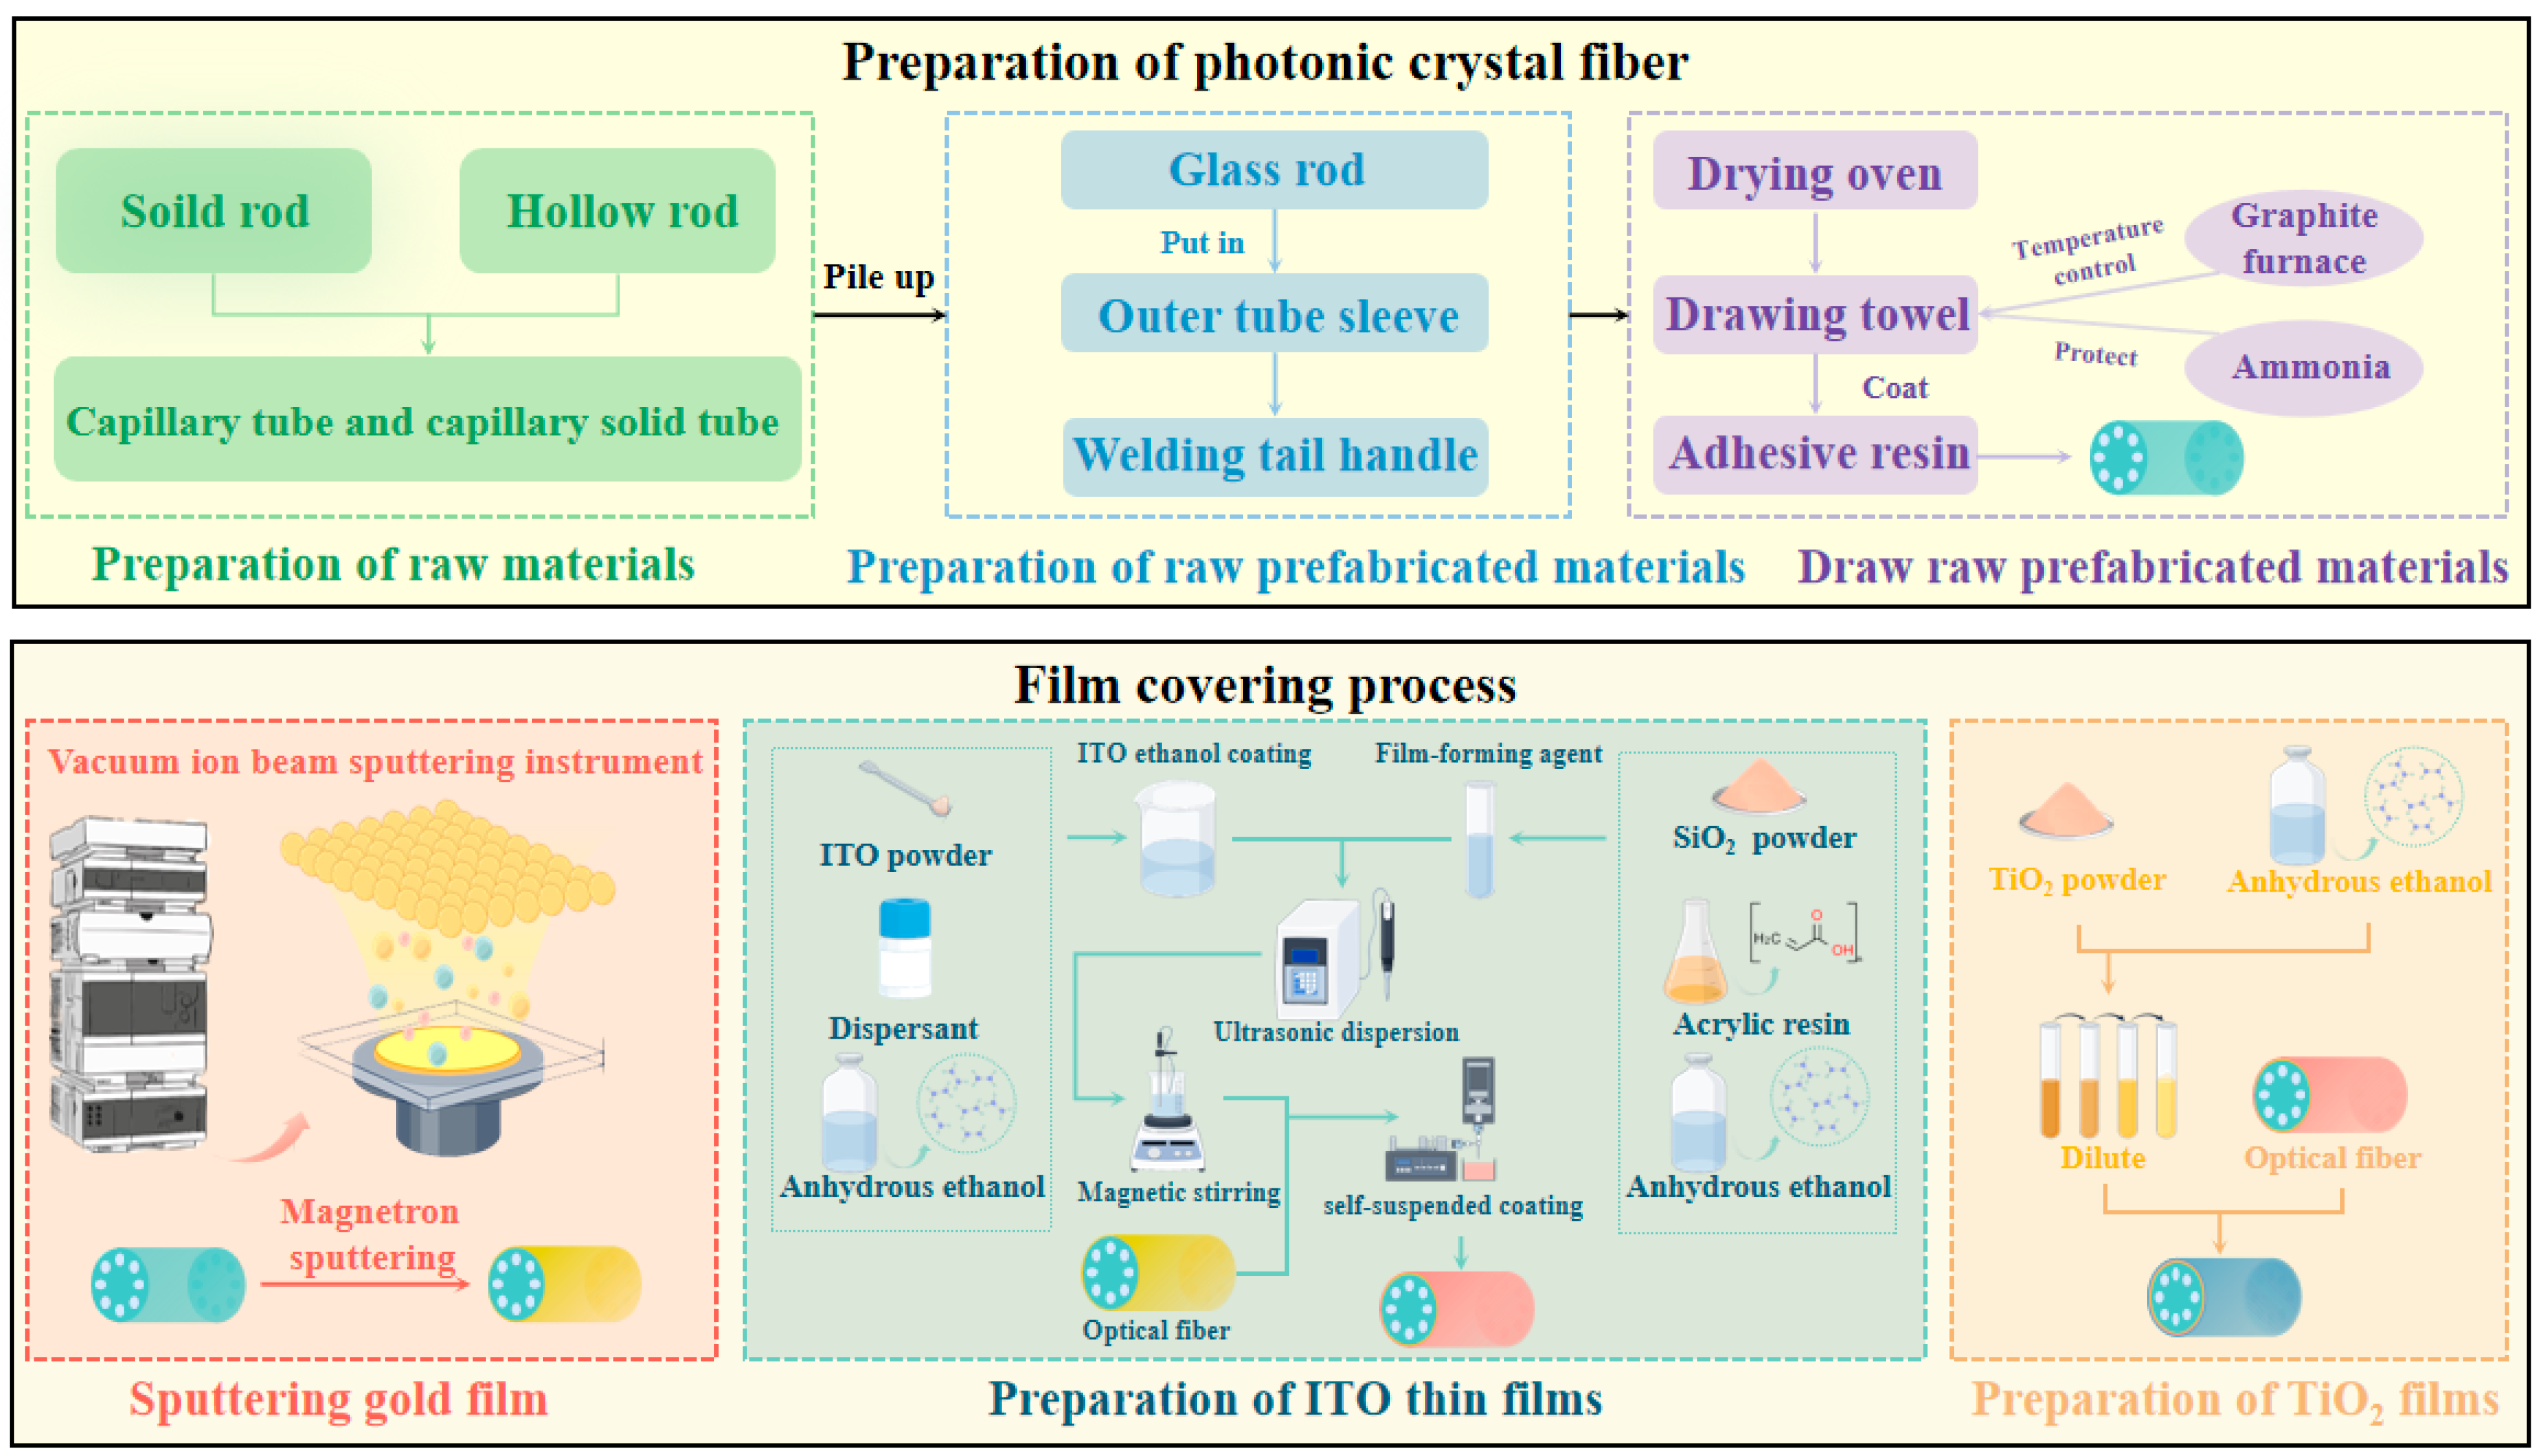
The experimental procedure commenced with the fabrication of a PCF featuring an eight-hole microstructure. High-purity quartz solid rods (20 mm diameter, 600 mm length) and borosilicate glass capillary tubes (model NC-110; 20 mm outer diameter, 16 mm inner diameter, 600 mm length) were employed as the primary materials. Prior to processing, all components underwent ultrasonic cleaning in acetone and ethanol to eliminate organic contaminants. Capillary tubes and auxiliary rods were subsequently drawn from the cleaned solid and hollow rods under controlled thermal conditions.
The preform was constructed using a bundling-and-stacking technique, wherein a central glass rod served as the core, surrounded by six capillary tubes and two solid rods arranged in a hexagonal configuration. The assembly was secured with high-temperature-resistant rubber tape to ensure structural integrity. The bundled structure was fused at one end using an oxyhydrogen flame and then subjected to a drying process in an oven to remove residual moisture. The preform was subsequently drawn into a PCF within a graphite furnace maintained at temperatures ranging from 1800 °C to 1850 °C, yielding a final fiber diameter of 15.2 μm.
For surface functionalization, a 30 nm gold film was deposited onto the fiber using a vacuum ion beam sputtering system. This gold layer served as the plasmonic interface, enhancing the optical performance of the SPR sensor by facilitating surface plasmon resonance. Following gold deposition, a 30 nm ITO film was applied. ITO powder (In2O3:SnO2 = 90:10 wt%) was dissolved in ethanol, mixed with a dispersant, and subjected to sonication to achieve a homogeneous suspension. The pH of the solution was adjusted to 3–4 using 0.1 M HNO3 to optimize colloidal stability. A film-forming agent was prepared by modifying silica with tetraethyl orthosilicate in ethanol. The ITO slurry was applied to the gold film via spin-coating at 3000 rpm for 60 s, followed by sequential drying at 80 °C for 2 h and curing at 150 °C for 1 h to complete the sensor fabrication process.
Finally, a TiO
2 film was prepared by dissolving TiO
2 powder in ethanol to create a 1% solution. This solution was applied to the fiber surface, completing the TiO
2 film preparation. The overall process is summarized in
Figure 12.
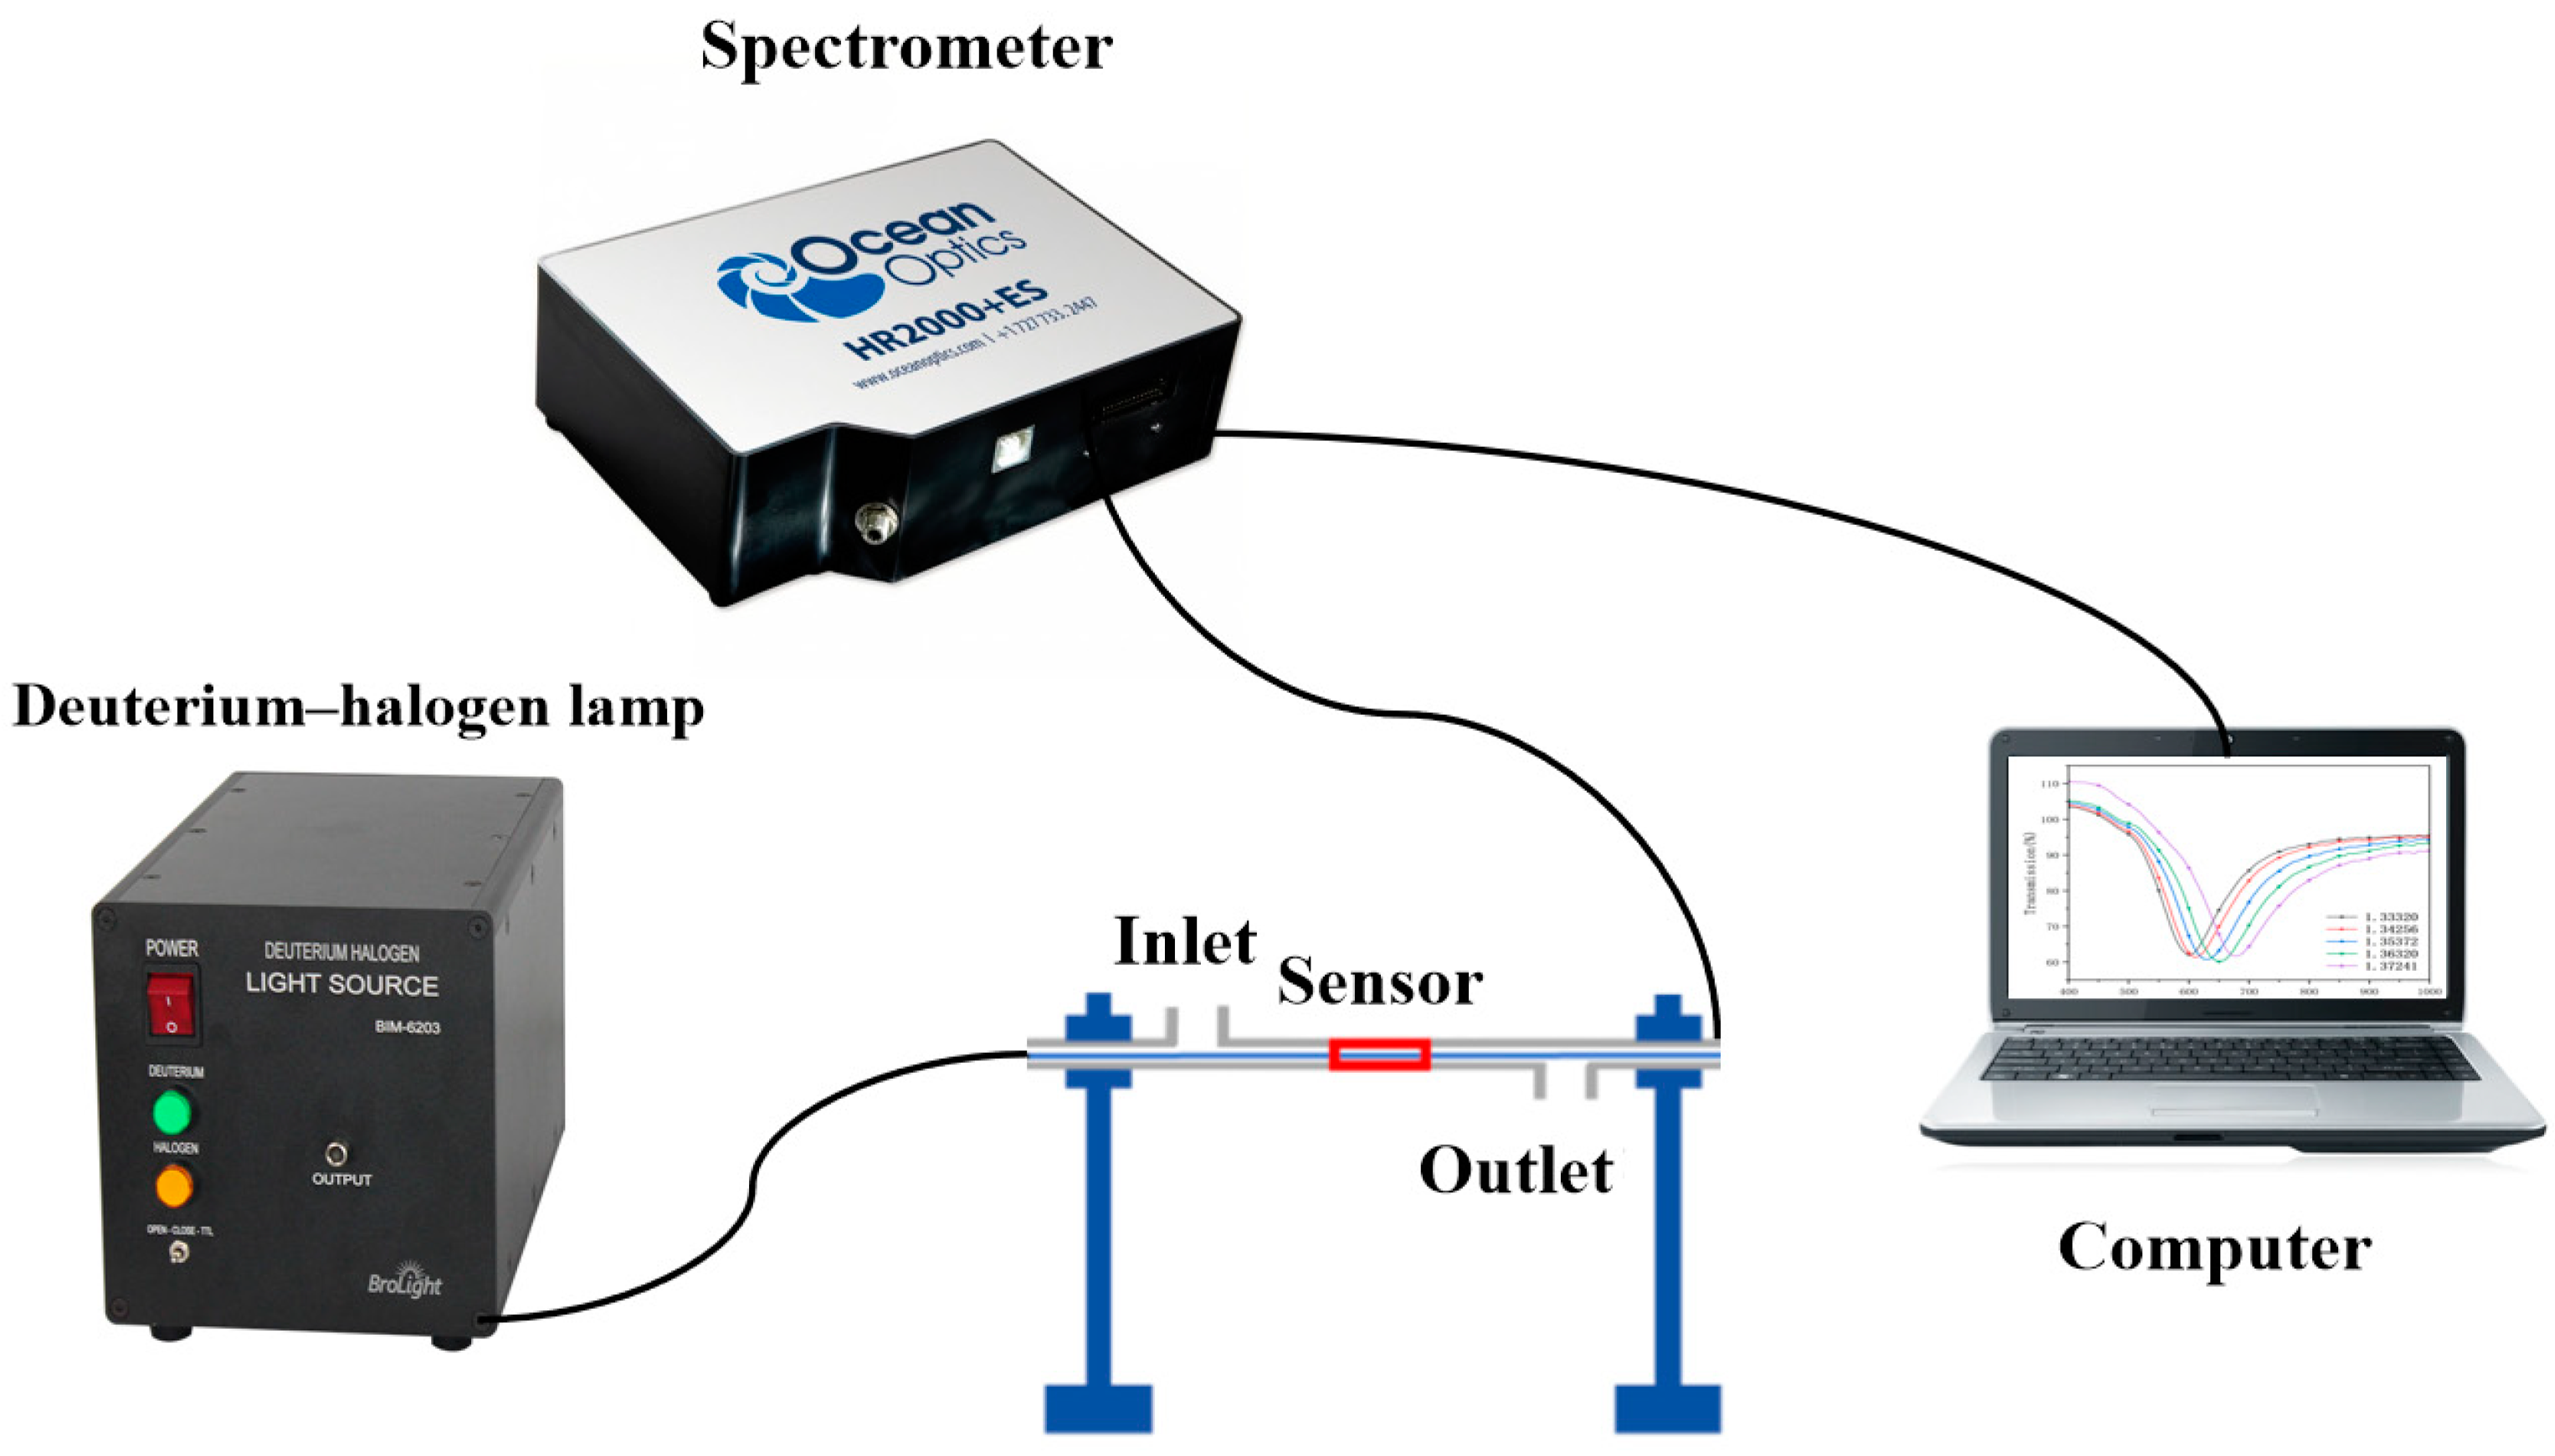
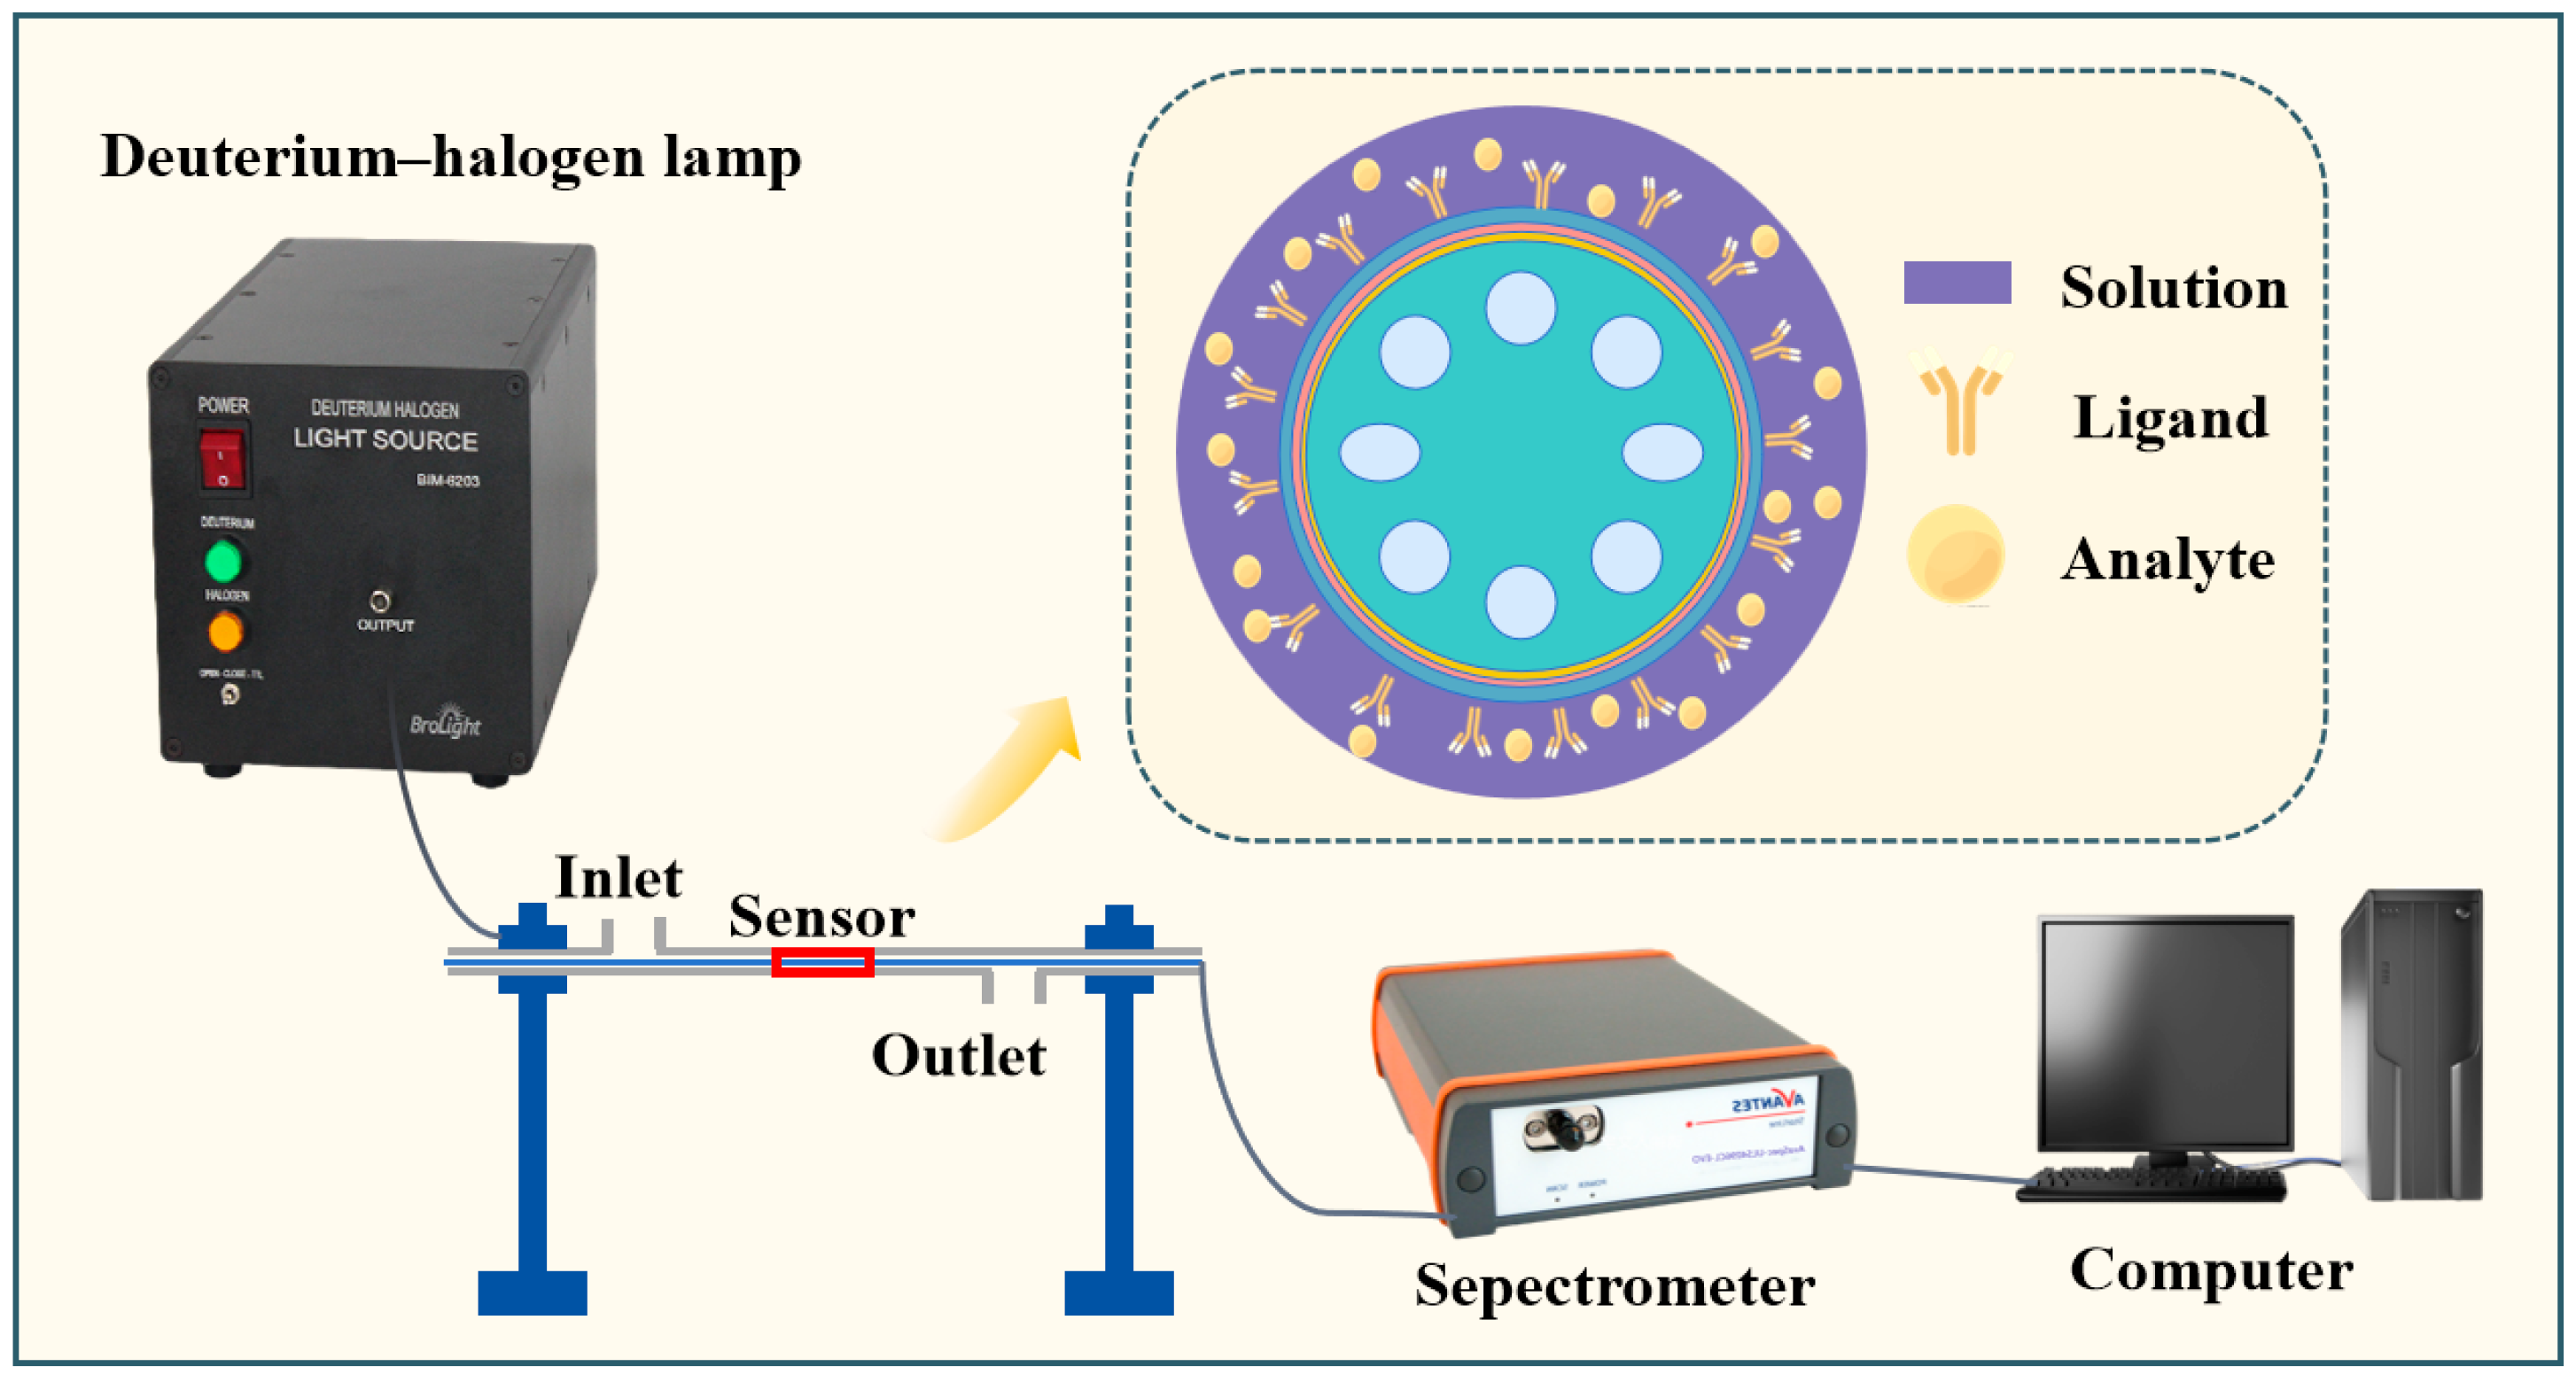
Following sensor fabrication, immediate refractive index characterization was conducted through systematic sensing experiments. During the experimental preparation phase, a NaCl solution with different concentrations, which spanned a range of the refractive index from 1.33 to 1.37, was prepared, and the refractive index of these solutions was precisely measured using an Abbe refractometer (Model AR4, Atago Co., Ltd., Tokyo, Japan). The optical configuration employed an FPBEN-IL1 broadband source (Auxilight Precision Instruments, Shanghai, China) covering 350–4000 nm spectral range, coupled with an MAYA 2000 Pro spectrometer(Ocean Optics, Weihai, China) for spectral acquisition.
Figure 13 illustrates the experimental configuration schematic.
In the experiment, the sensor was connected to a broadband light source and a spectrometer and then placed in a V-shaped glass container. Initially, distilled water was introduced, and the baseline resonance spectrum was recorded. Subsequently, sodium chloride solutions with varying concentrations were incrementally added, and the corresponding resonance spectrum variations were monitored and documented. After each measurement, the container was thoroughly rinsed with distilled water to eliminate residual traces of the previous solution, ensuring measurement accuracy. All experiments were conducted under controlled room-temperature conditions, and the acquired data were processed to calculate the sensor’s refractive index sensitivity.
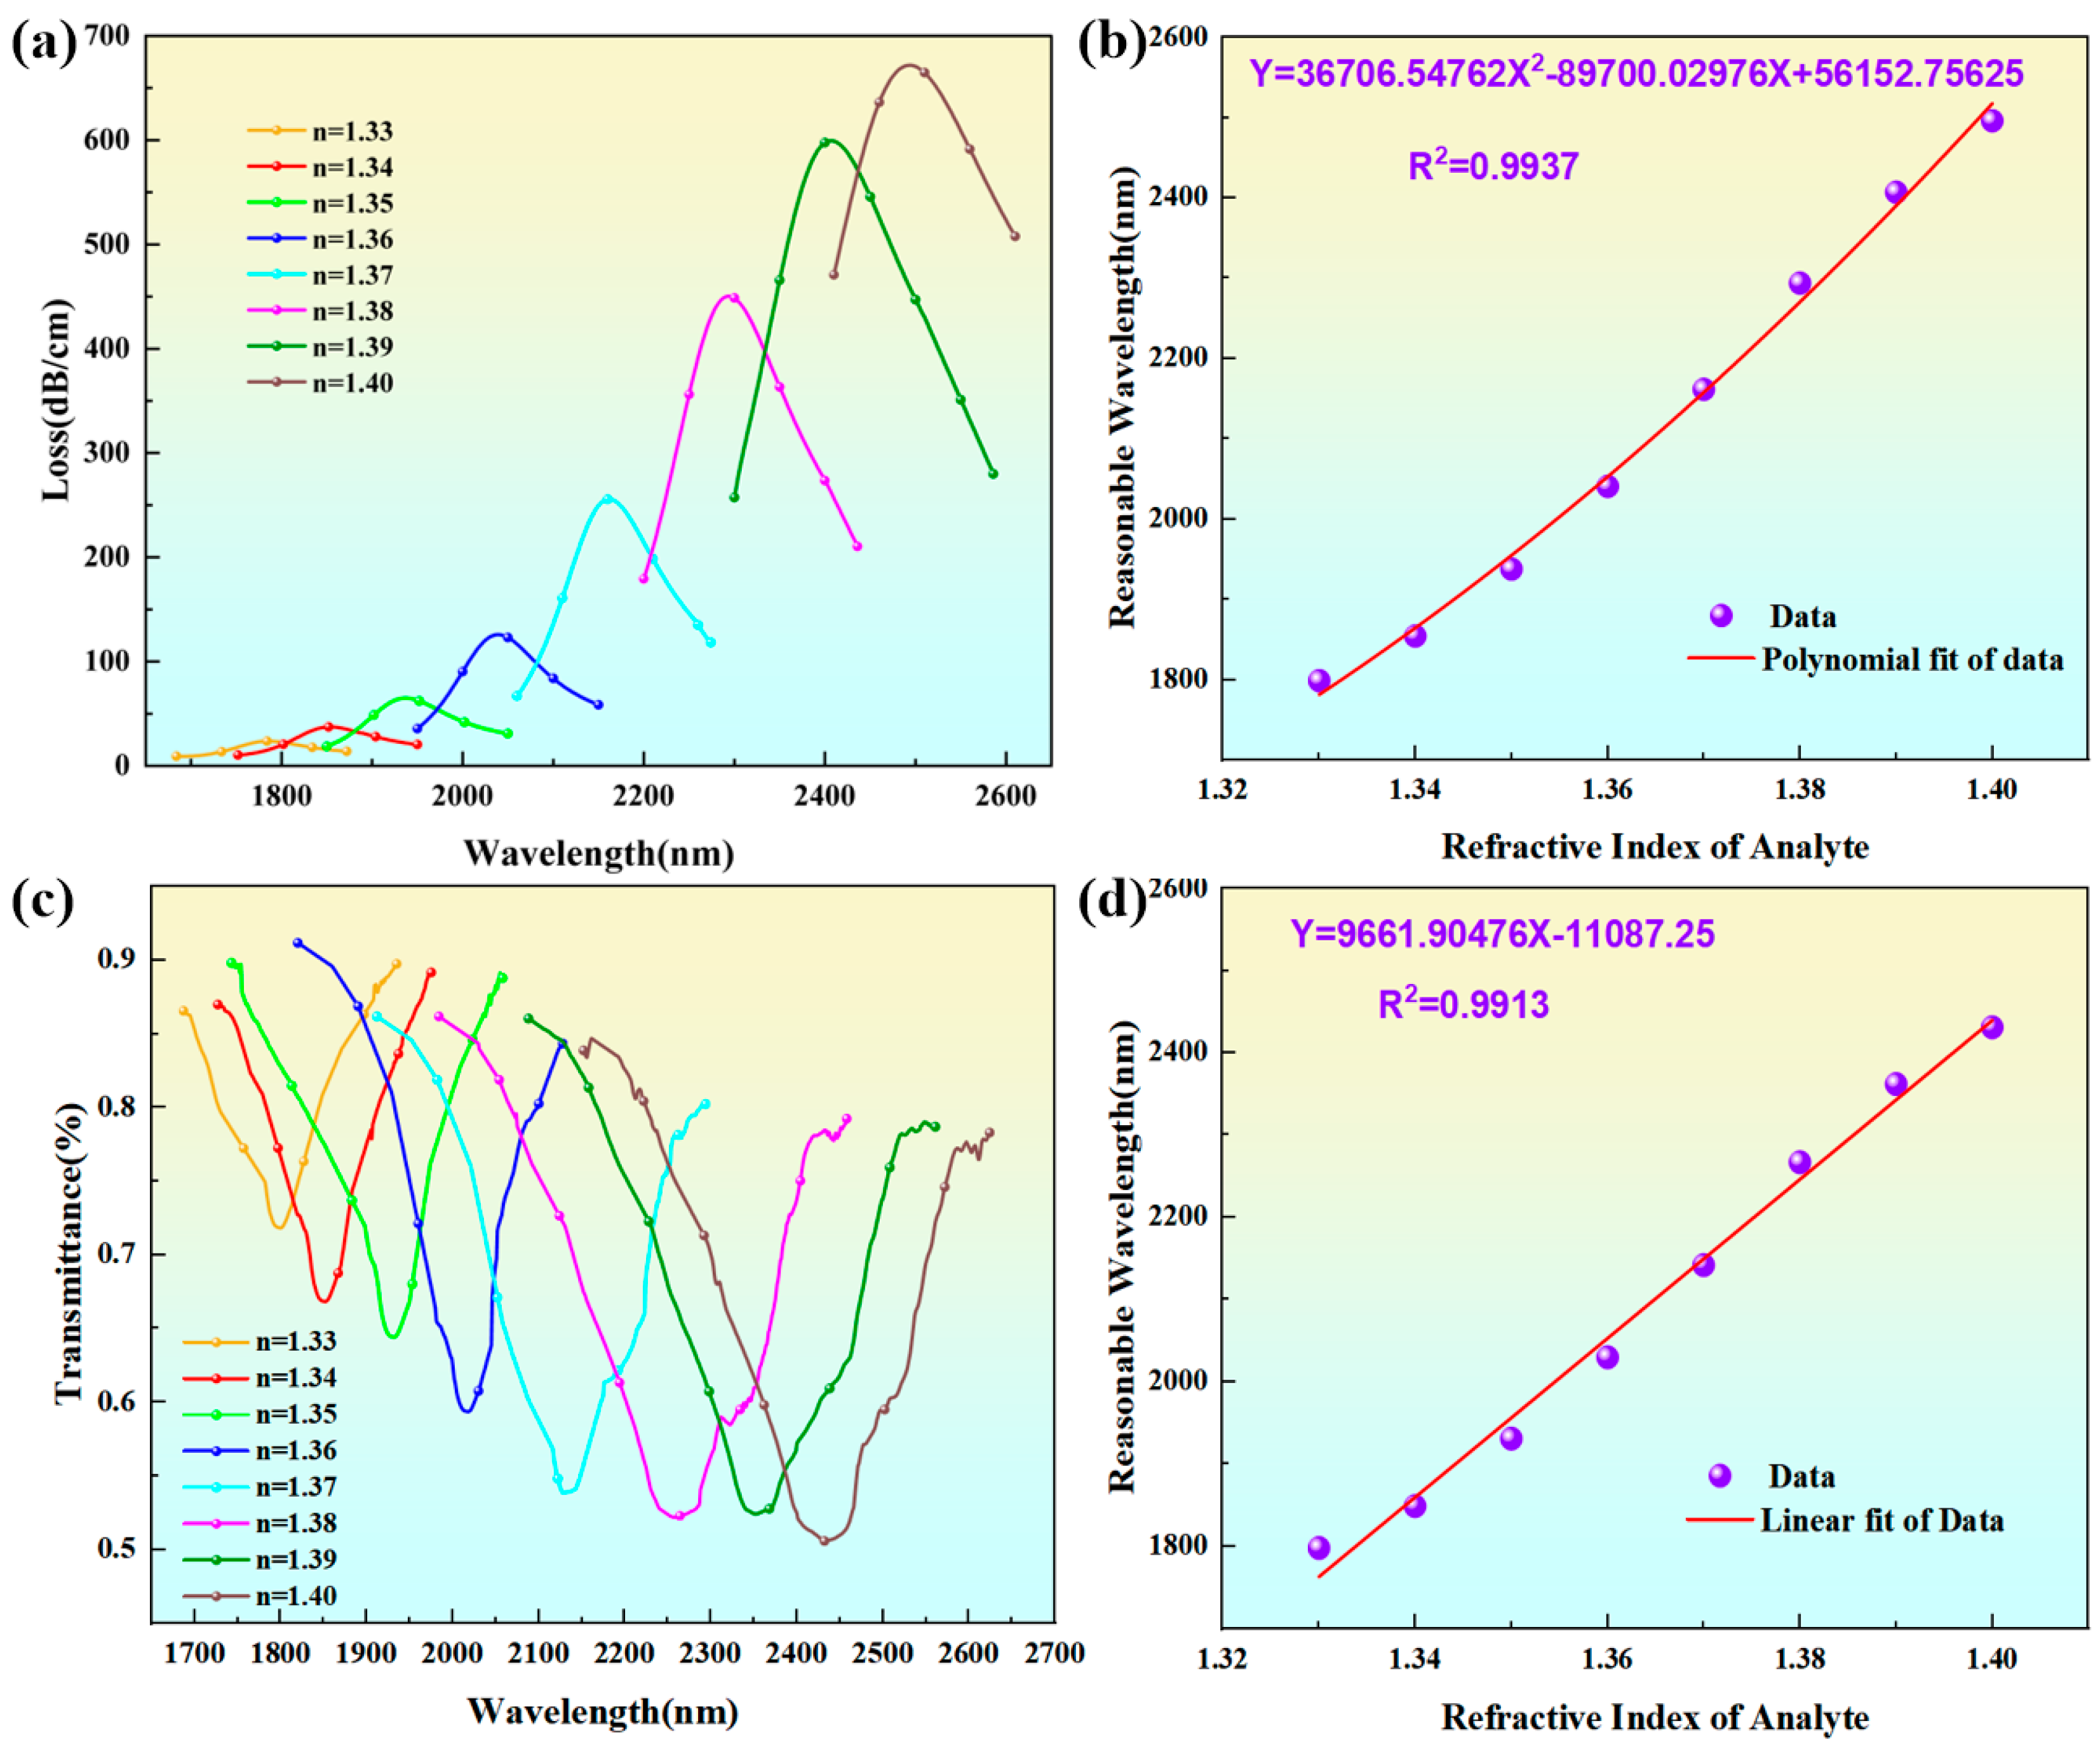
The experiment systematically tested solution concentrations at 0.01 RIU intervals.
Figure 14a illustrates the simulated fiber core loss curves for different refractive indices, revealing characteristic wavelength-dependent attenuation profiles.
Figure 14b presents a polynomial fit between the solution concentration and resonance wavelength, demonstrating excellent sensing performance with a high correlation coefficient (R
2 = 0.9937).
Figure 14c displays the experimentally measured refractive index curves for different concentrations. As the refractive index increases from 1.33061 to 1.40008, the loss curve peak exhibits a redshift toward longer wavelengths, accompanied by a reduction in resonance depth. This behavior indicates enhanced coupling between the fiber core mode and surface plasmon modes, consistent with theoretical expectations.,
Figure 14d shows a linear fit of the refractive index data, yielding a high R
2 value of 0.9913. This strong linear correlation confirms minimal measurement error and validates the sensor’s reliability. The sensitivity was calculated using the following formula:
where
represents the resonance wavelength shift and
denotes the refractive index change. The
FOM, which reflects the sensor’s detection precision, was determined using
where
FWHM is the full width at the half-maximum of the resonance peak.
Theoretical calculations and experimental measurements demonstrated a significant positive correlation between wavelength redshift magnitude and sensor sensitivity under fixed-solution-concentration gradients. Within the detection range of 1.33061 to 1.40008 RIU, the sensor achieved an average sensitivity of 9961.90 nm/RIU, reaching a maximum sensitivity of 12,503.56 nm/RIU at n = 1.36 with an FOM of 28.65 RIU−1. Furthermore, the sensor exhibited a low detection limit (LOD) of 3 × 10⁻⁵ RIU in higher-concentration regimes, underscoring its high-precision detection capability under such conditions. However, the spectral bandwidth broadening of the light source at extended wavelengths introduced increased susceptibility to external perturbations, manifesting as reduced signal stability and elevated noise levels. Furthermore, long-wavelength optical propagation could induce nonlinear effects that further degraded sensitivity and FOM performance.
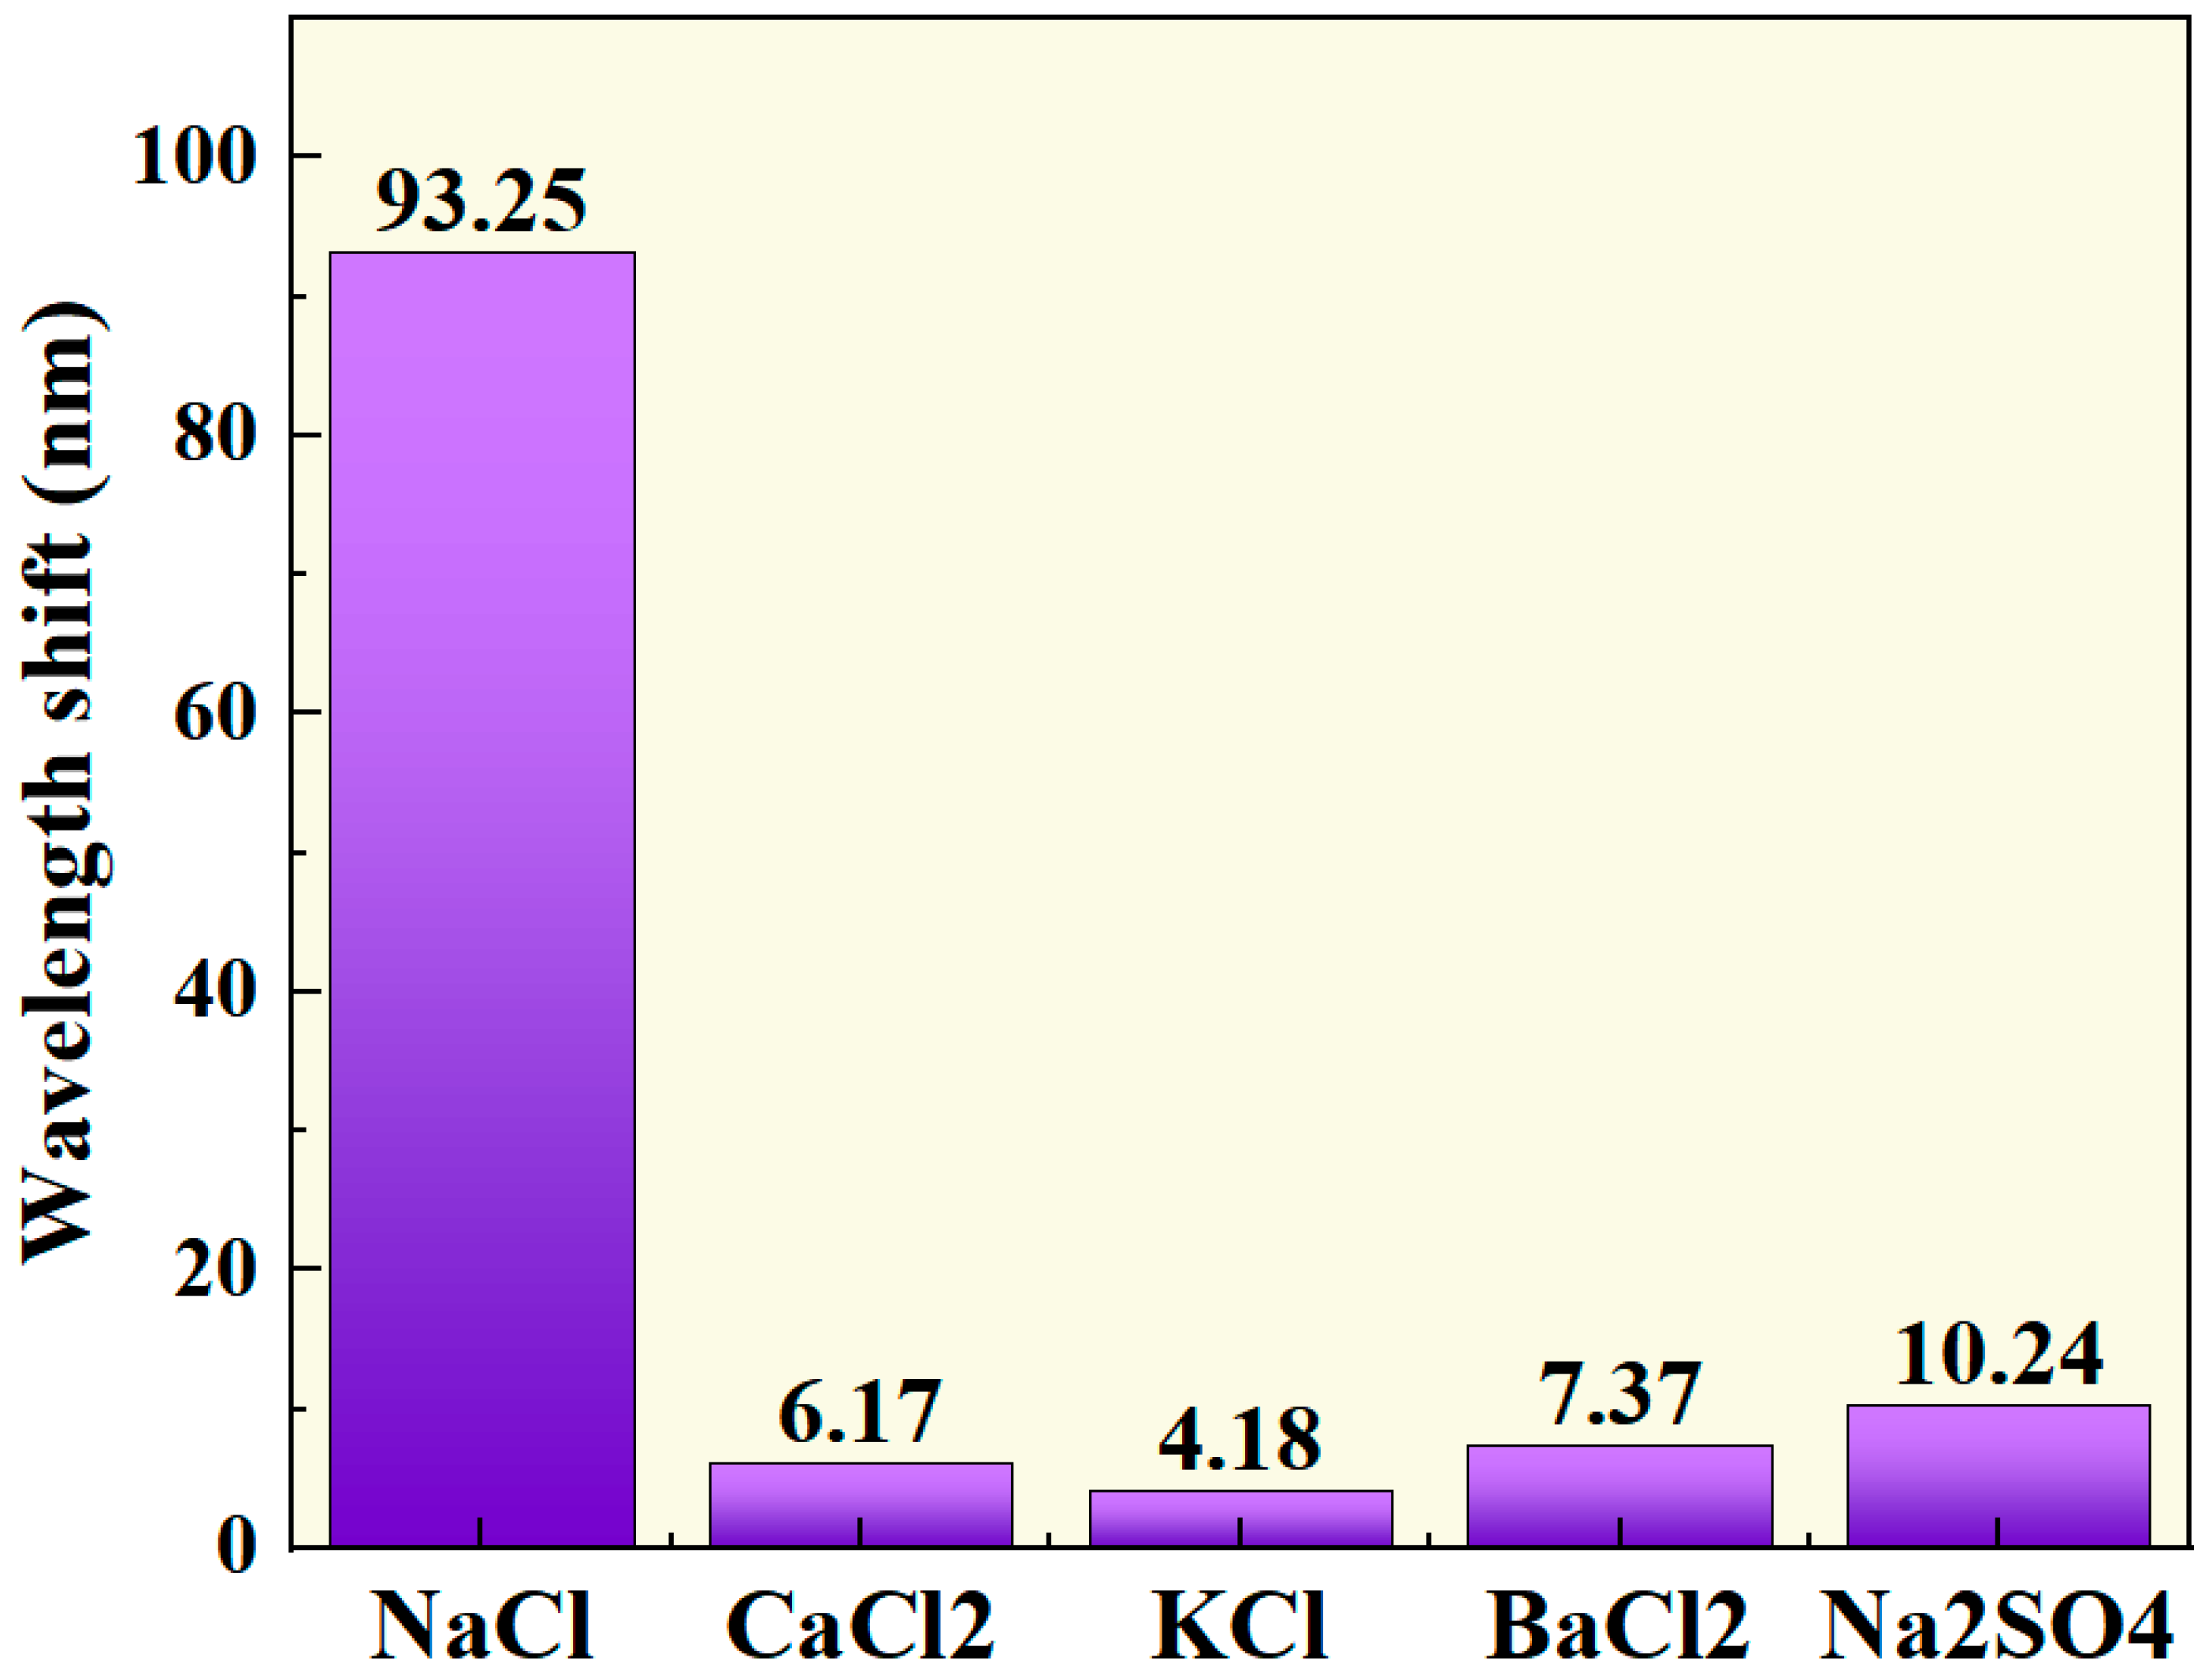
Selectivity stands as a pivotal performance metric for evaluating sensor functionality. The developed sensor employed an immobilized sodium ion-selective membrane probe, enabling specific recognition of NaCl solutions. To validate its selective advantage, four chloride salts with shared anionic characteristics (KCl, CaCl
2, BaCl
2, Na
2SO
4) were selected as interferents for comparative testing. Utilizing a standardized SPR detection protocol,
Figure 15 demonstrates that only NaCl solutions elicited a significant resonance wavelength shift, while no discernible response was observed for other interferents. This comparative experiment conclusively verified the sensor’s high specificity for NaCl concentration detection.
Furthermore, experimental results demonstrate that divalent cations (e.g., Ca2+, Ba2+) exhibited higher wavelength sensitivity compared to monovalent cations (e.g., K+) due to their enhanced charge density, which induced stronger local electric field perturbations. Notably, although Ba2+ has a larger ionic radius than Ca2+, its smaller hydrated radius allowed closer proximity to the sensor surface, thereby enhancing plasmonic coupling effects and resulting in a more pronounced wavelength shift.
The weak response to Na2SO4 solutions can be attributed to the surface chemistry of TiO2. Specifically, the strong coordination between SO42− and oxygen vacancies on the TiO2 surface formed stable surface complexes, which occupied active sites and inhibited the migration and permeability of Na+ ions. This suppression mechanism significantly reduced the sensor’s response to Na2SO4 solutions.
Comparative analysis with prior studies (
Table 5) reveals substantial performance advancements: the proposed sensor exhibited a 456% enhancement in the average sensitivity (≈9661 nm/RIU) and 43.36% improvement in the
FOM (28.65 RIU
−1) compared to conventional gold-film-based fiber SPR sensors. Although minor fabrication-induced optical losses and coating duration effects resulted in experimental sensitivity values marginally lower than simulated predictions, this minimal discrepancy experimentally validated the design rationality and operational reliability.
Experimental validation showed that the proposed optical fiber SPR sensor exhibited high sensitivity and quality factors. It holds great potential for applications in biosensing, high-concentration biomass detection, and critical areas such as medical diagnostics, environmental monitoring, and food safety. With ongoing research and technological advancements, this sensor is expected to succeed in practical applications and see widespread adoption.
5. Conclusions
This study introduces a functional model for fiber-optic SPR sensors employing gold films, developed through the systematic application of TRIZ. A comprehensive Nine-Window analysis was conducted to identify critical challenges and potential avenues for improvement. Advanced TRIZ techniques, including the resolution of Physical and Technical Contradictions, the Smart Little Man method, and object–field analysis, were employed to derive targeted solutions. These methodological innovations effectively addressed the inherent limitations of conventional photonic crystal fiber SPR sensors, particularly in terms of sensitivity and quality factors.
Experimental results demonstrated that the newly designed sensor, incorporating optimized gold, ITO, and TiO2 films, exhibited exceptional sensitivity and operational stability. The enhanced performance underscores its significant potential for high-concentration detection applications. The integration of TRIZ with experimental research substantially improved sensor performance metrics and provides novel strategic approaches for advancing sensor technologies. This research establishes a robust theoretical and experimental foundation for future innovations in SPR sensor development, contributing to the field of optical sensing technology.
However, it should be noted that the current FWHM and FOM remain constrained by intrinsic plasmon damping effects, showing notable disparity compared with recent BSW sensors. Future research directions should focus on the following:
- (1)
Hybrid BSW-SPR mode engineering through photonic crystal bandgap optimization to compress resonance linewidth [
7];
- (2)
The development of 2D material/metasurface hybrid architectures leveraging exciton–plasmon coupling for enhanced field localization [
37,
38];
- (3)
Machine learning-assisted multiparameter optimization to transcend empirical trial-and-error limitations [
39].
These advancements are anticipated to push sensor performance toward ultra-high sensitivity and sub-milliRIU resolution, laying technical foundations for cutting-edge applications such as single-molecule detection.


