Article

φ-OTDR Based on Dual-Band Nonlinear Frequency Modulation Probe

by
Jing Zhang
1,2,
Tuanwei Xu
1,3,*,
Kai Cao
1,3,
Yuhang Shu
1,2,
Dimin Deng
1 and
Fang Li
1,3
1
State Key Laboratories of Transducer Technology, Institute of Semiconductors, Chinese Academy of Sciences, Beijing 100083, China
2
School of Electronic, Electrical and Communication Engineering, University of Chinese Academy of Sciences, Beijing 100049, China
3
College of Materials Science and Opto-Electronic Technology, University of Chinese Academy of Sciences, Beijing 100049, China
*
Author to whom correspondence should be addressed.
Photonics 2025, 12(3), 183; https://doi.org/10.3390/photonics12030183
Submission received: 15 January 2025 / Revised: 11 February 2025 / Accepted: 21 February 2025 / Published: 22 February 2025

Abstract

:
Pulse compression enhances the signal-to-noise ratio (SNR) in distributed fiber optic acoustic sensing (DAS) by increasing pulse energy through cross-correlation, while maintaining spatial resolution. In DAS systems, linear frequency modulation (LFM) pulses are commonly used; however, their limited sidelobe suppression (SLR) results in increased noise, limiting improvements in SNR and fading noise mitigation. To overcome these limitations, we propose an adaptable NLFM pulse design methodology that optimizes SLR based on specific application requirements. This approach significantly enhances pulse energy injection while reducing system noise, thereby improving overall sensing performance. Additionally, dual-carrier frequency-division multiplexing is employed to maximize energy utilization and mitigate fading effects. The experimental results demonstrate that, compared to the LFM-based detection pulse system, the optimized NLFM pulse improves the SNR by 10 dB. Under identical conditions, the NLFM system also enhances its performance in suppressing fading noise. Furthermore, the use of dual carriers effectively reduces the hardware resource consumption of the sensing system, highlighting the great potential of NLFM pulses in the field of fiber optic sensing.

1. Introduction

Distributed acoustic sensing (DAS) is an advanced monitoring technology that seamlessly combines “transmission” and “sensing”. Compared to traditional electronic sensors, DAS offers distinct advantages, including immunity to electromagnetic interference, high sensitivity, and the capacity to reuse tens of thousands of information channels. These features make it widely applicable in areas such as oil pipeline monitoring, border security, marine physical exploration, and aerospace engineering [1,2,3]. For these applications, achieving a high performance and robust DAS system requires a careful balance between sensing distance and critical parameters, such as SNR. Such optimization is essential to meet the stringent demands of diverse and challenging operational environments.
Traditional phase-sensitive optical time-domain reflectometry (φ-OTDR) systems face an inherent trade-off between sensing distance and spatial resolution. To overcome the inherent trade-off between spatial resolution and sensing distance, Chen et al. developed a TGD-OFDR system utilizing chirped pulse signals in the DAS system [4] in 2017, effectively addressing these limitations. In systems with chirped pulse detect signal, employing the matched filtering technique is an effective method to enhance the SNR. To further enhance the performance of the DAS system, efficiently suppressing fading noise has long been a critical issue. At fading points, the Rayleigh backscattering signal is completely submerged in noise, preventing the demodulation and recovery of disturbance information. As a result, these “bad zones” become unusable for sensing, ultimately reducing the system’s SNR.
In recent years, researchers have extensively explored various strategies for chirped-pulse phase sensitive time-domain reflectometry(CP-φ-OTDR), such as modifying the detection pulse forms [5,6], hardware selection [7,8], and sensing structures [9], in an effort to mitigate fading noise. However, these approaches often require more complex optical configurations, thereby increasing system costs, and the use of specialty optical fibers as sensing fibers is impractical for long-distance sensing applications. Therefore, optimizing the parameters of the sensing system in the digital domain (e.g., refining the pulse compression parameters) offers a novel and practical solution with significant potential for improving system performance [10].
Inspired by radar signal processing algorithms, linear frequency modulation (LFM) signals have been widely applied in CP-OTDR to achieve simultaneous improvements in spatial resolution and sensing distance. For LFM signals, achieving a higher SLR is essential to obtain greater effective detection pulse energy after pulse compression. A higher SLR contributes to improved SNR, which is essential for extending the sensing range and ensuring more accurate and reliable measurements. Typically, weighting methods are employed to suppress sidelobes; however, this approach can cause spectral splitting, leading to a loss of effective pulse energy [11,12]. Such energy loss negatively impacts the improvement of the signal-to-noise ratio and limits the further extension of sensing distance. In this context, the selection of the detection pulse waveform in chirped pulse compression systems is of critical importance. However, such methods can lead to a reduction in the effective detection energy of the pulse-compressed signal. In 2018, Zhang et al. proposed the use of a nonlinear frequency-modulated (NLFM) signal with a broad pulse width, which enabled a detection range of 80 km and a spatial resolution of 2.7 m [13]. This demonstrates that NLFM signals offer superior matched-filtering performance compared to LFM signals, suggesting that optimizing the signal form can significantly improve the performance of advanced sensing systems. However, previous work did not further optimize the NLFM signal based on its unique characteristics to fully realize its potential for enhanced performance.
This paper introduces a CP-φ-OTDR technique based on frequency division multiplexing for NLFM pulses. By optimizing the design of the NLFM signal, this approach effectively suppresses crosstalk noise and enhances the energy of the detection pulses. In addition, multi-channel weighted averaging techniques are employed to effectively suppress fading noise. Furthermore, for the dual carriers of the detection pulse, interference noise suppression is optimized using a vector rotation superposition method, thereby improving the SNR of the sensing system. The experimental results show that the optimized nonlinear frequency modulation pulse achieved a bottom noise level about 10 dB lower than the LFM signal after matched filtering. Furthermore, the system utilizing dual-carrier multiplexed NLFM probe pulses demonstrated superior suppression of fading noise compared to the system employing LFM probe pulses.

2. Experimental Principle Analysis

2.1. Principle of Matched Filtering

Matching filtering maximizes the SNR, thereby enhancing the detection capability of the signal. Specifically, in a DAS system, disturbances are detected by monitoring phase changes in the backscattered Rayleigh scattering (RBS) signal. However, in long-distance sensing systems, weak signals at the fiber’s end are often overwhelmed by noise. Matching filtering amplifies these weak signals, improving the visibility of weak signals. The shape of the generated pulse is illustrated in Figure 1.
Through cross-correlation, the received signal is compared with a known reference signal. Then, matching filtering enhances the target signal and suppresses noise, which can be expressed as
y c o m p r e s s e d t = s t s t = s t h t
where ⨂ represents the convolution operator, s t is the time-domain expression of the input detection pulse signal, h t represents the matched filter, and y c o m p r e s s e d t represents the time-domain expression of the matched filtered signal. The matched filtered signal in the frequency domain can be expressed as
Y c o m p r e s s e d Ω = S Ω H Ω
where S Ω represents the input detection pulse signal in the frequency domain, and H Ω represents the matched filter in the frequency domain.
Considering the maximum SNR at a specific time T m , the power of the output signal at that time is expressed as
y c o m p r e s s e d T m 2 = 1 2 π + S Ω H Ω e j Ω T m d Ω
At the same time, the power spectral density of the noise is expressed as σ w 2 . Then, the output noise power of the receiver is expressed as σ w 2 H Ω 2 , and the total noise power is expressed as
N p = σ w 2 2 π + H Ω 2 d Ω
To determine the H Ω that maximizes the SNR, one can employ the Schwarz inequality. The SNR at the time T m is expressed as
S N R = y c o m p r e s s e d T m n p 1 2 π + S Ω H Ω d Ω 2 σ w 2 2 π + H Ω 2 d Ω
  • Certain specific conditions are satisfied, which can be expressed as
H Ω = α S Ω e j Ω T m
h t = α s T m t
where α represents a constant. The maximum SNR is represented as
S N R max = 1 2 π σ w 2 + S Ω 2 d Ω = E σ w 2
where E is employed as the signal pulse energy.
Compared to other filtering methods, matching filtering achieves the maximum possible SNR, significantly enhancing the system’s detection sensitivity. From the principle of matched filtering, selecting appropriate signal forms as detection pulses in the sensing system, it is possible to achieve a higher SLR after pulse compression. This allows for the effective detection of higher pulse energy, thereby improving system performance. This is particularly crucial for long-distance sensing, where matching filtering plays a vital role in improving system performance.

2.2. Generation and Optimization of Nonlinear Frequency-Modulated (NLFM) Signal

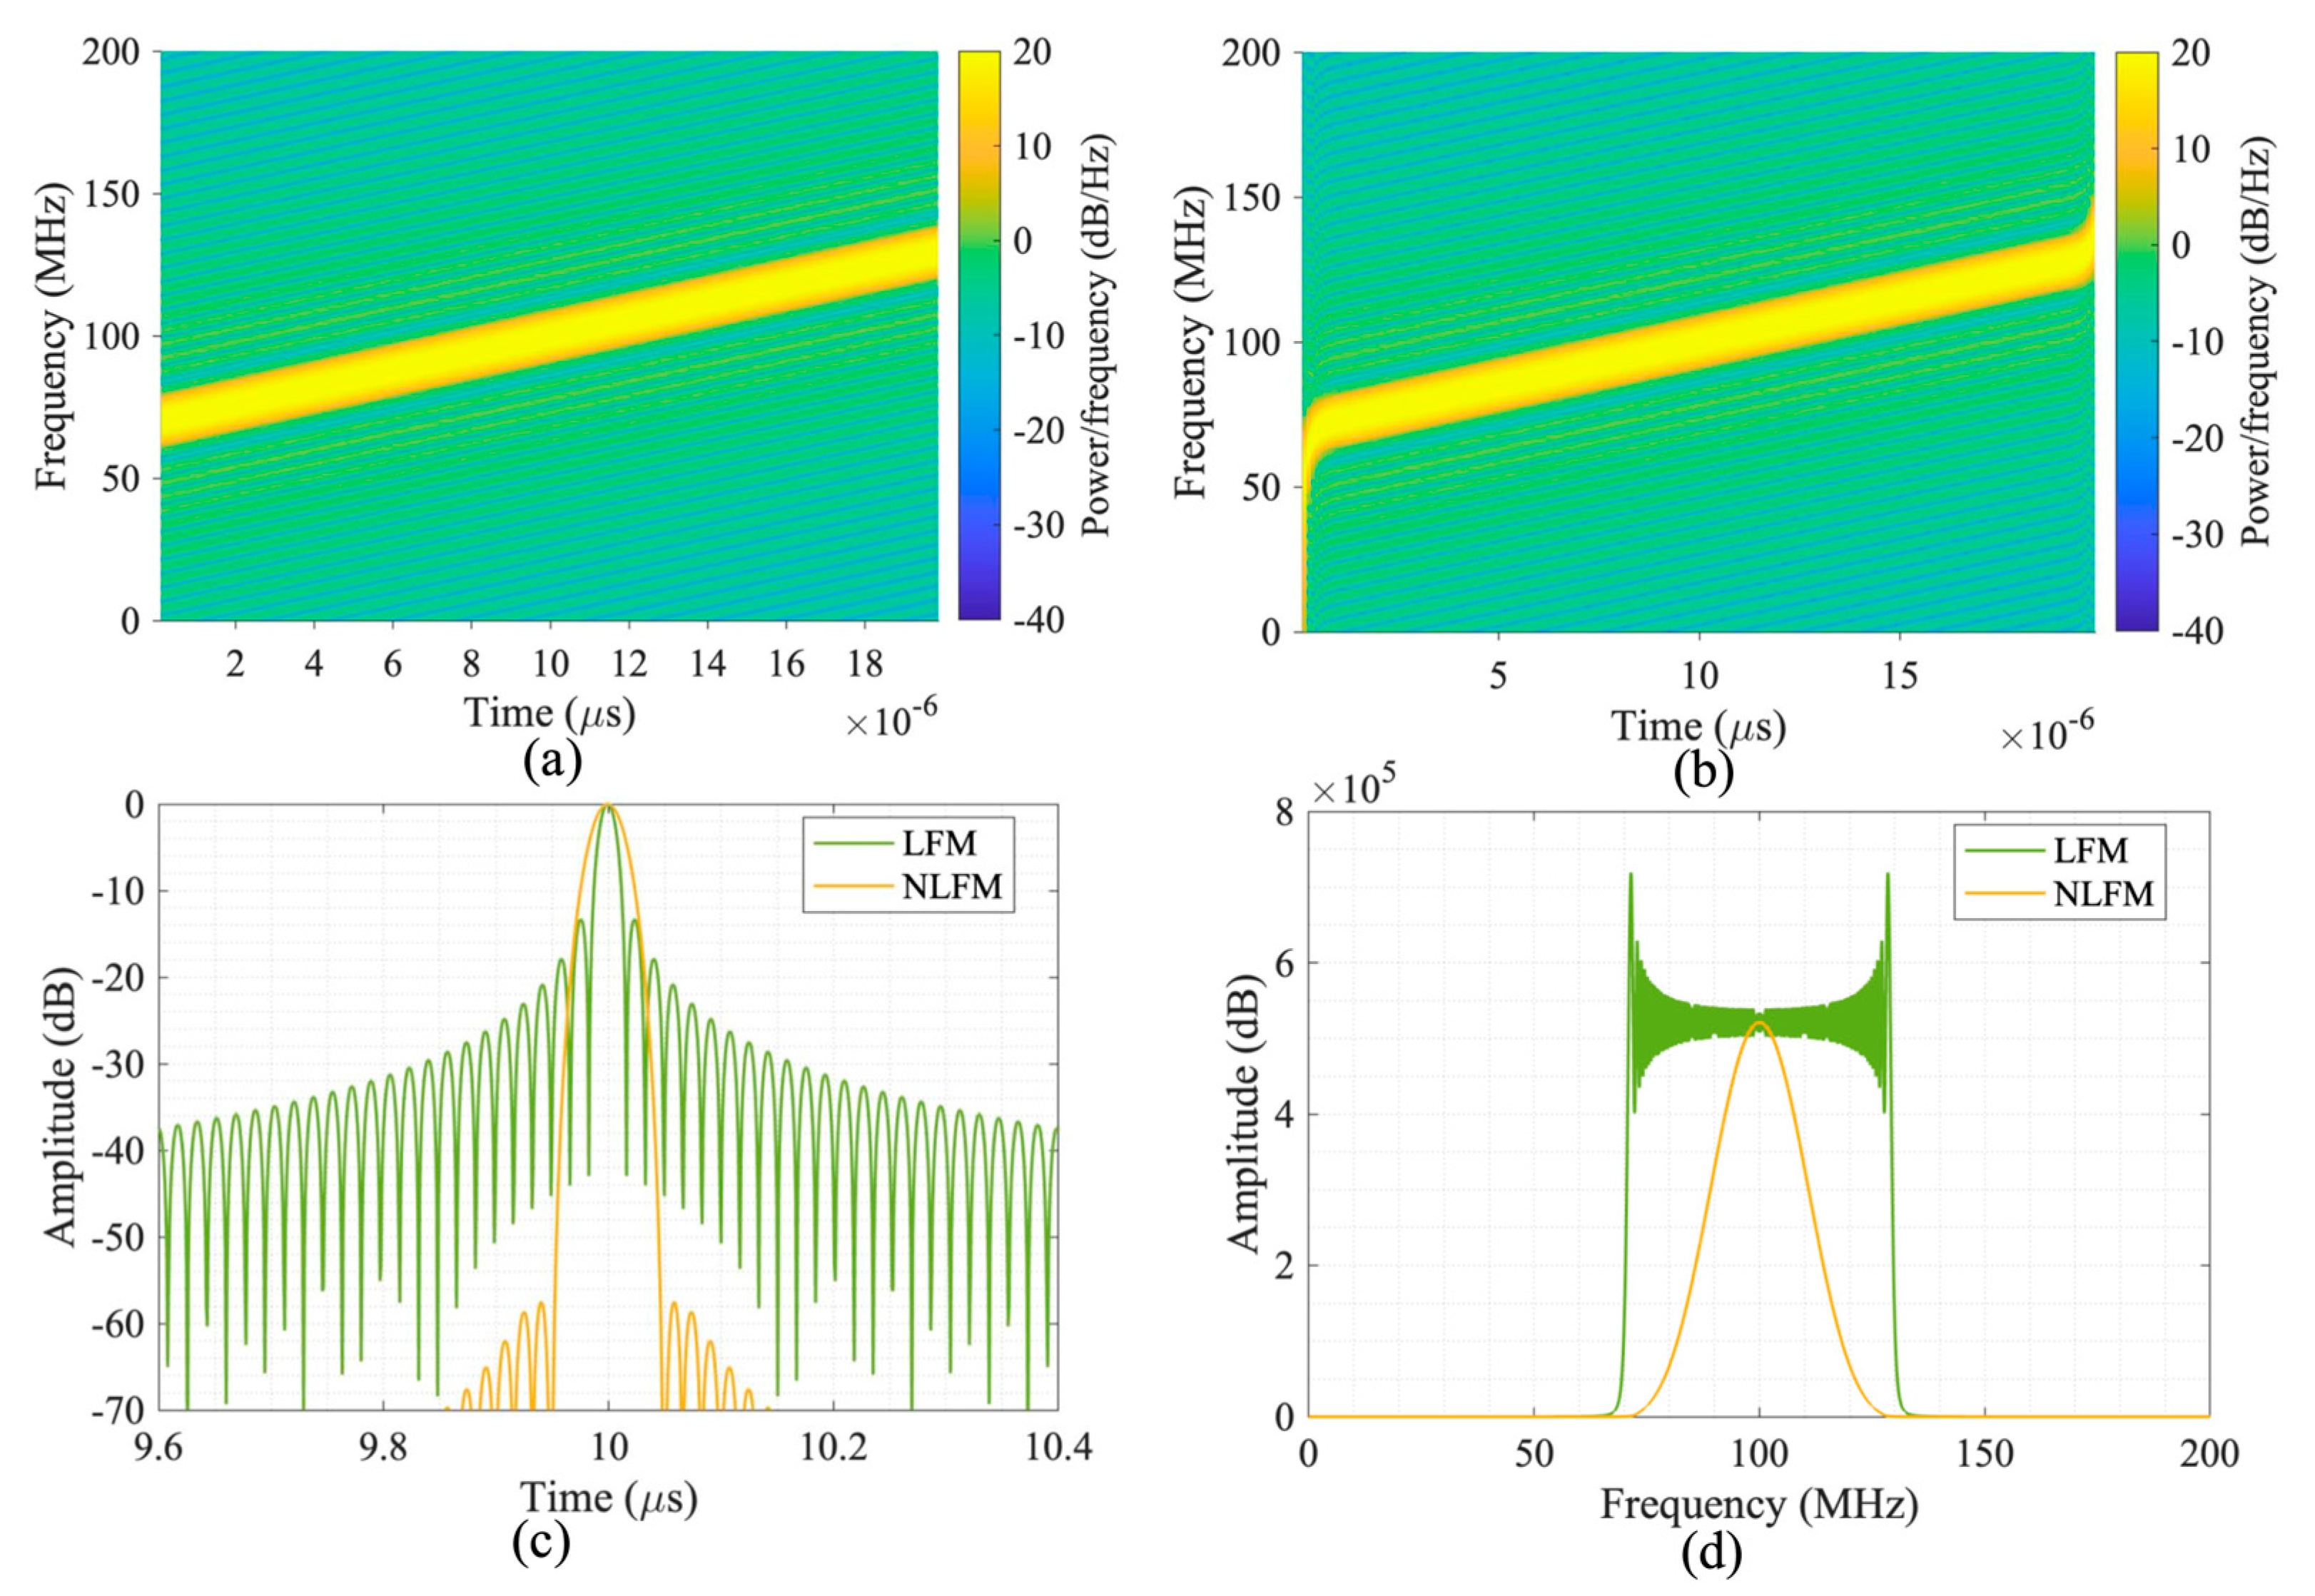
2.2.1. Limitations of LFM Signals
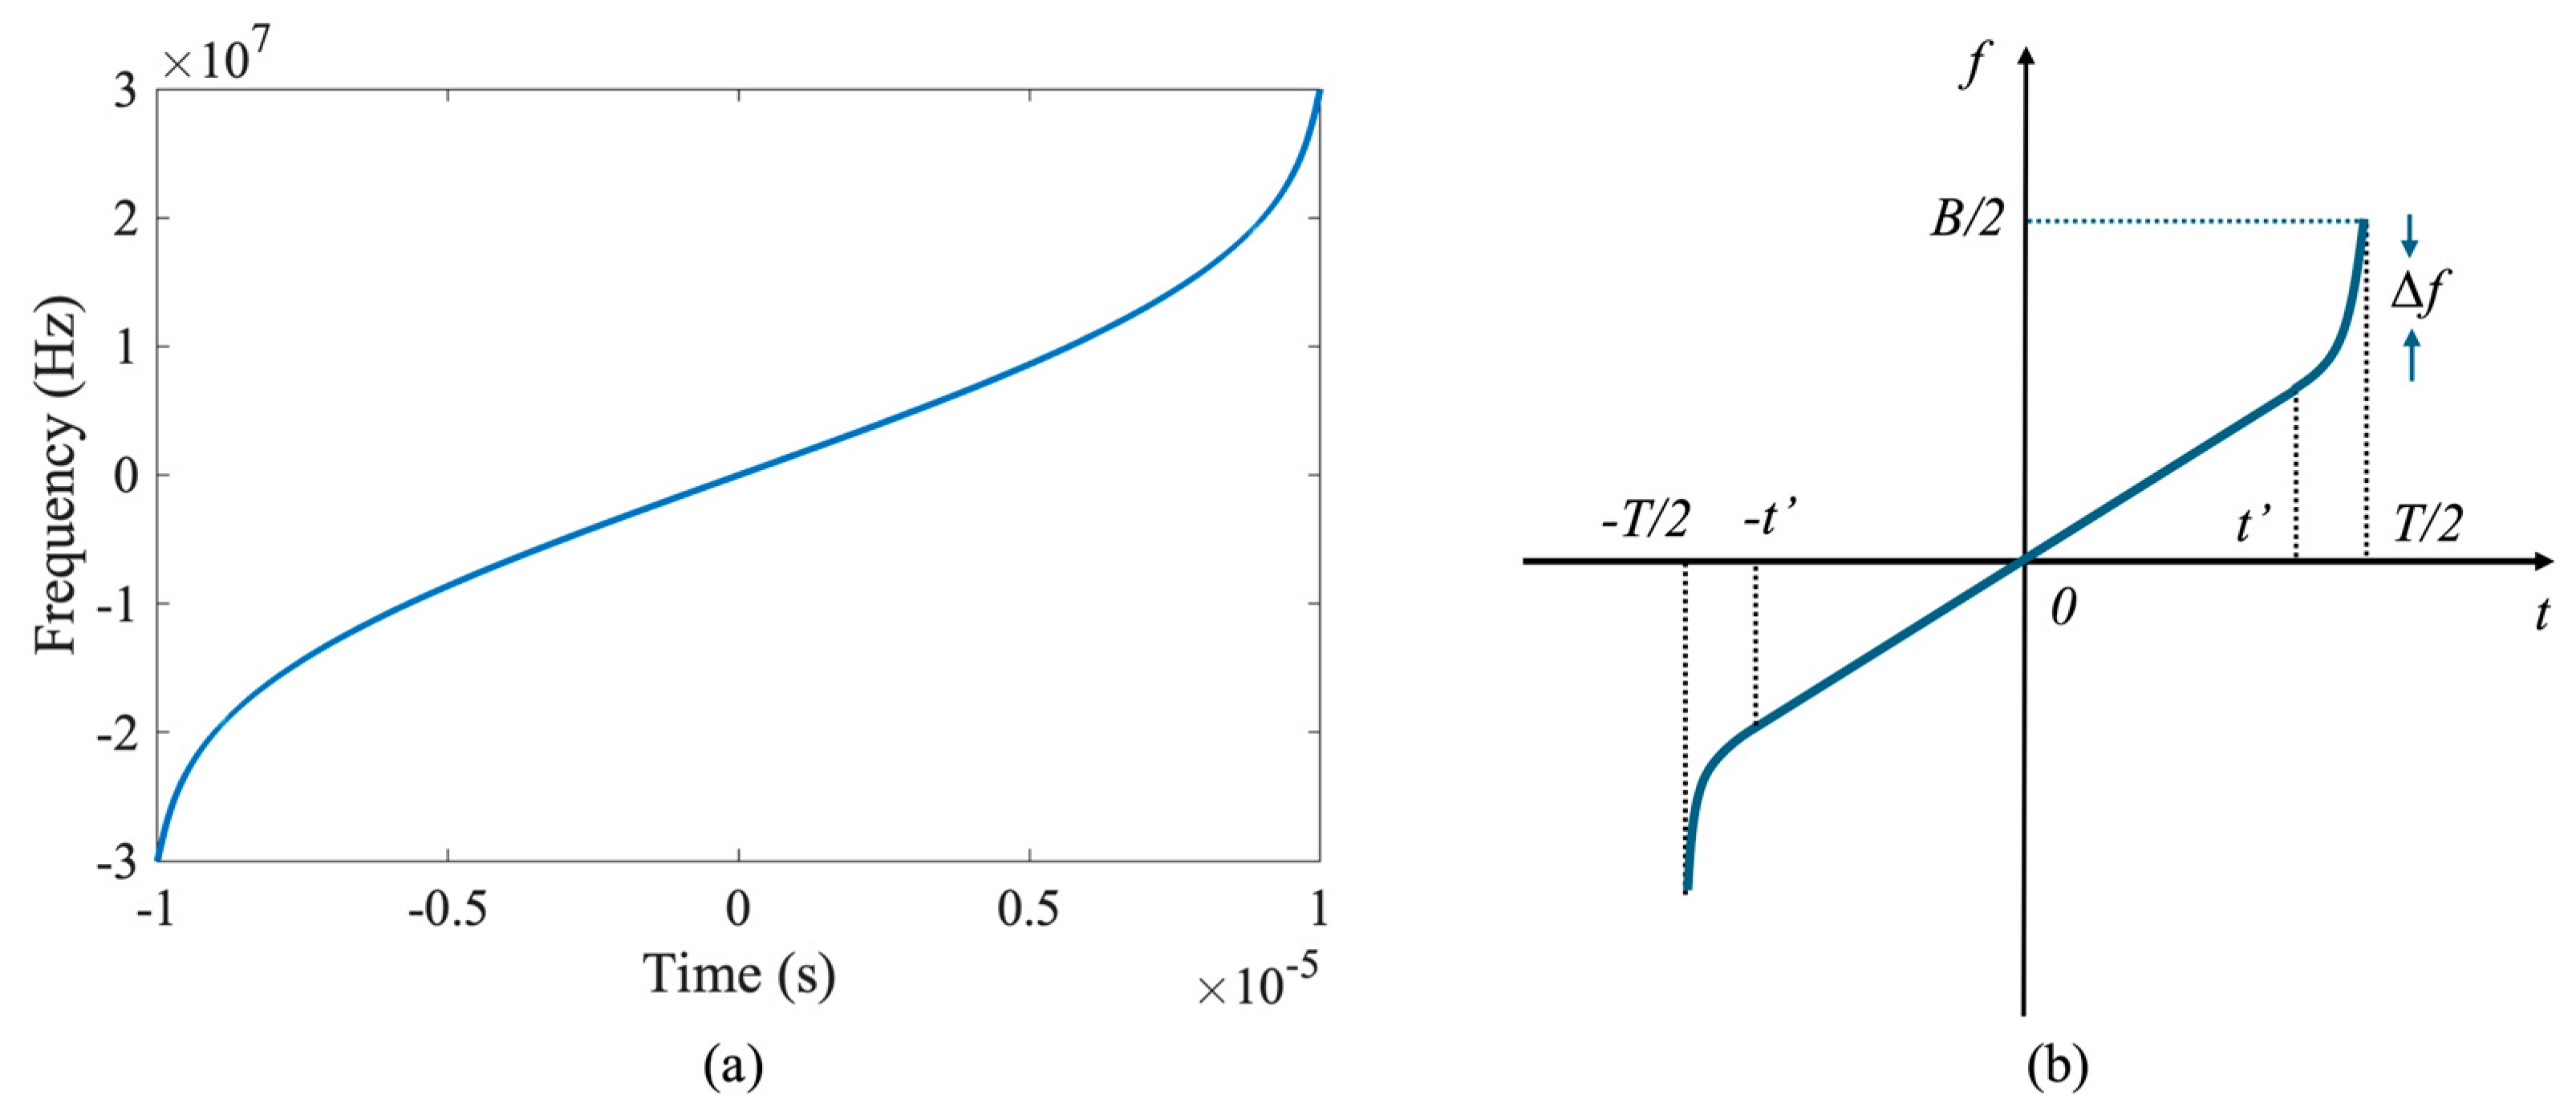
In CP-φ-OTDR systems, LFM pulses are commonly used as sweep detection signals due to their clear mathematical formulation and ease of generation. The mathematical expression for LFM signals is
s l f m = exp j 2 π f 0 t + B T π t 2
where f0 represents the starting sweep frequency, B is the sweep bandwidth, and T denotes the detection pulse width. The frequency modulation slope, denoted by K = B T , characterizes the chirp signal. When K > 0 , the signal exhibits a positive slope chirp, where the instantaneous frequency increases linearly with time. Conversely, when K < 0 , the signal is a negative slope chirp, with the instantaneous frequency decreasing linearly over time. After matched filtering, their SLR is approximately 13.6 dB. However, the relatively low sideband suppression limits their practical performance. To address this, windowing is often applied to detection pulses to improve the sideband suppression ratio. However, this approach can cause spectral splitting, redistributing pulse energy away from the central region, and offering minimal benefit to the overall sensing system performance. Based on the limitations of LFM, to enhance the robustness of CP-φ-OTDR systems, optimizing the pulse compression performance of the probe signal is particularly crucial.

2.2.2. NLFM Signal

NLFM signals are different from LFM signals. Their main advantage lies in their ability to achieve pulse compression directly without requiring weighting, thereby obtaining a high SLR. This eliminates the SNR degradation typically associated with weighting operations, making NLFM signals highly advantageous for improving system performance.
Due to the lack of a specific mathematical expression for NLFM signals, these signals are typically generated using the stationary phase principle [14]. By replacing them with various window function W f expressions, integrated windowing operations are achieved. This approach utilizes the group delay function T f to facilitate the generation of an NLFM signal, which can be expressed as
T f = K T f W υ d υ
At a certain frequency point f t = f 0 , according to the principle of stationary phase, the f t is the inverse function of T f , which is
f T f 0 = f 0
f t = T 1 t
  • Then, the phase function φ t can be obtained from f t , which can be expressed as
φ t = 2 π 0 t f τ d τ T / 2 t T / 2
s t = e j φ t
Different NLFM signals can be obtained through different W f , such as the Hamming window. The SLR of the NLFM signal pulse, even after being compressed using the window function, remains suboptimal. To improve the SLR, we simulated the time–frequency characteristics of NLFM signals using the W f of the Hamming window, as shown in Figure 2a. The results demonstrate an “S”-shaped curve, with the curvature at both ends playing a crucial role in determining the pulse compression performance. Therefore, by adjusting the curvature at both ends of the “S” curve, NLFM signals can be tailored to meet specific application requirements, as shown in Figure 2b. This method is straightforward, easy to implement, and highly flexible, making it well-suited for diverse practical scenarios.
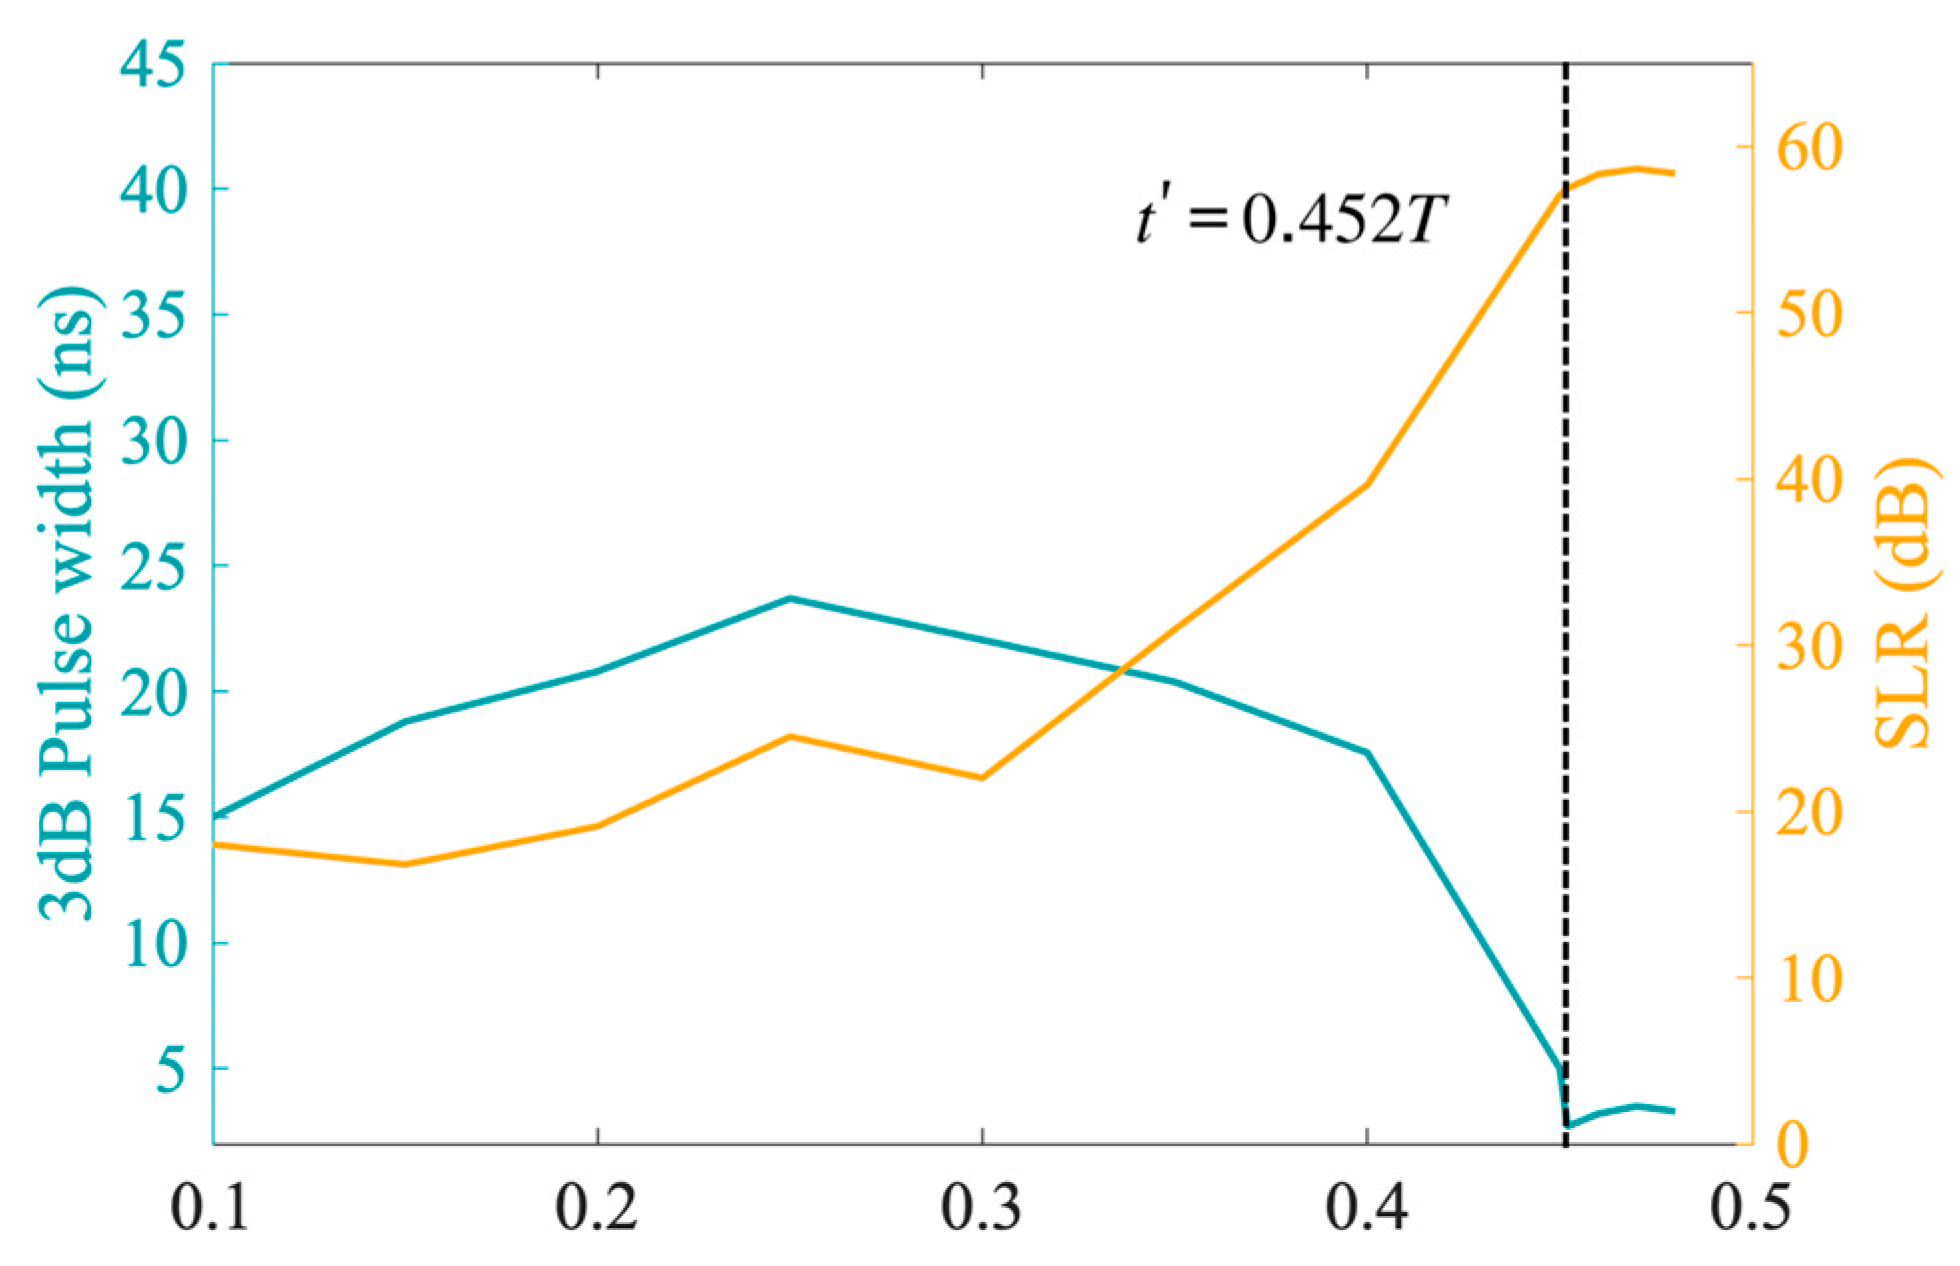
  • The optimized time–frequency function of NLFM is expressed as
f n l f m = γ t + T 2 + γ η T 2 t t B t T t t t γ t T 2 γ η t t T 2
According to the stationary phase principle, the frequency modulation function employed in generating NLFM signals exhibited a distinctive “S”-shaped characteristic. Building upon this observation, a nonlinear time–frequency function was constructed by designing a three-segment curve function and meticulously controlling the curvature of the nonlinear sections at both ends. This approach facilitated the generation of a new class of NLFM signals. As illustrated in Figure 2b, the parameter t was selected such that t lay within the interval (0, 0.5T), i.e., t 0 , 0.5 T . By integrating the time–frequency functions corresponding to various t positions, diverse forms of NLFM signals were synthesized. These signals were subsequently subjected to matched filtering, and their performance metrics, including the SLR and 3 dB pulse width, were rigorously analyzed.
To further investigate the impact of the parameter t on the pulse compression results, we conducted a simulation analysis. The simulation parameters included a probe pulse width 20 μs, a sampling rate of 1.25 GSa/s, and a sweep bandwidth of 60 MHz. The experimental results, depicted in Figure 3, demonstrate that within the interval t 0 , 0.5 T , the optimal value of t for achieving the highest possible SLR without incurring excessive broadening of the 3 dB pulse width was t = 0.452 T . And γ = f T / 2 , η = γ T / 2 t γ f T / 2 t .
Then, Figure 4 shows that a cross-correlation analysis was performed between the new NLFM signals and a LFM signal The comparison of their pulse-compressed signals reveals that the newly designed NLFM signals achieved an SLR of 57.5 dB, and a 3 dB pulse width of 2.7 m, indicating a more concentrated energy distribution after pulse compression.

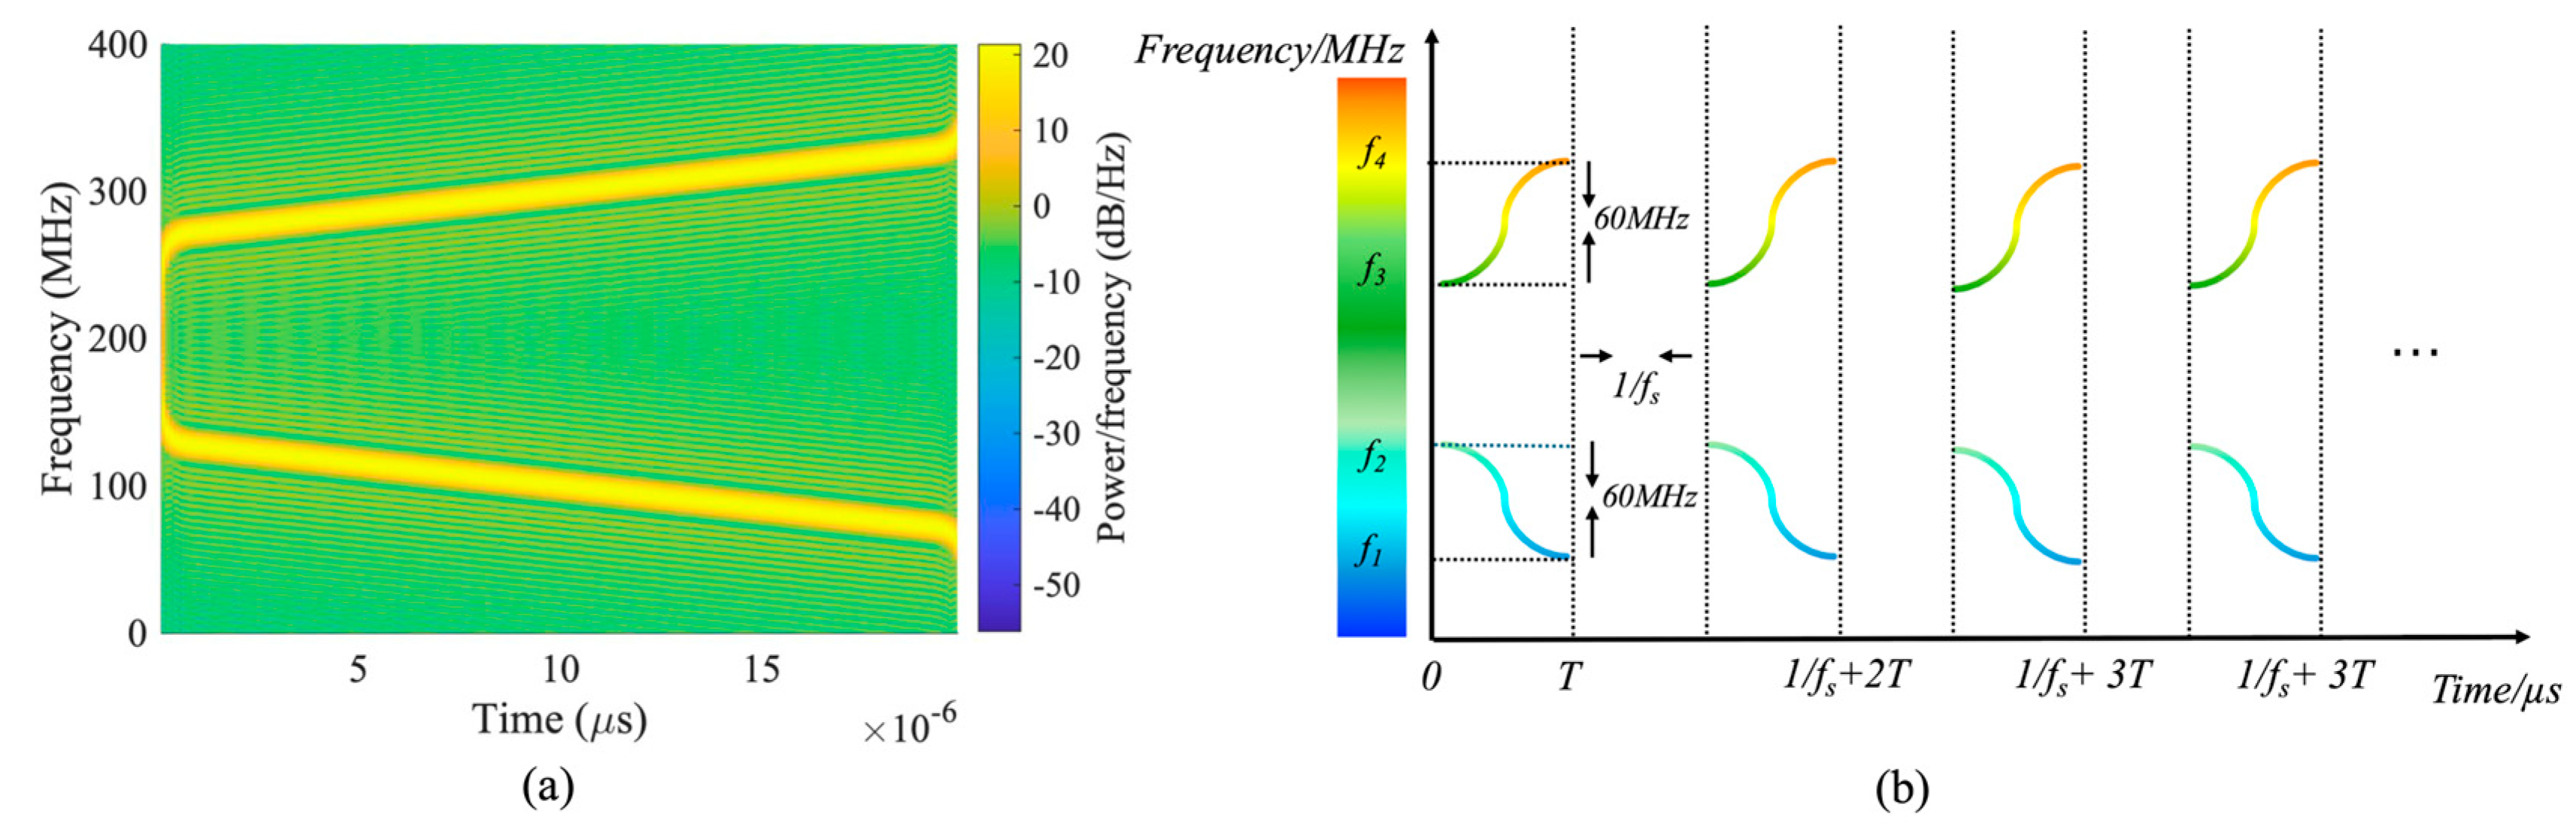
2.3. Dual-Band Frequency Division Multiplexing

In DFOS systems, fading introduces dead zones in demodulation results, significantly reducing the system’s SNR and demodulation accuracy. Addressing fading noise is a critical challenge in enhancing overall system performance. To mitigate this issue, we employed three primary techniques: dual-band frequency division multiplexing, multi-channel weighted averaging, and vector rotation superposition. In our experimental setup, an EOM was utilized to generate ± 1 s t carriers.
Compared to phase modulators [15], intensity modulators exhibit superior capabilities for harmonic multiplexing. Since the system exclusively utilizes the first-order carriers, it is imperative to suppress higher-order harmonic components. This can be achieved by carefully optimizing the modulation depth to ensure minimal interference and enhanced signal fidelity.
The EOM is activated by the RF signal generated by any signal generator (AWG). The electric field strength of the input light field is represented as E i . The electric field intensity of the output light field modulated by the EOM is expressed as E 0 , which depends on the control of modulation depth. The ratio between them is expressed as
E 0 E i = sin π V m cos φ t 2 V π e j φ 0 = sin α cos φ t e j φ 0
V A C = V m cos φ t
where α = π V m 2 V m is the modulation depth, V A C is the modulation voltage of the RF signal, and V m and φ t are the amplitude and phase of the modulated signal, respectively. When the EOM is at its minimum bias control point, the Bessel function of the above equation is expressed as
E 0 E i = 2 e j φ 0 n = 1 1 n J 2 N 1 α cos 2 n 1 φ t
where J n is the first kind of Bessel function. Based on the Bessel function relationship, α and V m can be determined, thereby maximizing the ± 1 s t carriers energy while maintaining the harmonic suppression ratio within an ideal range. After the + 200 MHz frequency shift frequency of AOM, the scanning range of the positive and ± 1 s t carriers are all within the detectable range of the balanced photodetector (BPD). A schematic diagram of the dual-band frequency division multiplexing is shown in Figure 5.
In the pulse compression process, the intensity of the RBS signal, which is positively correlated with phase noise, was used as a weighting factor. Multi-channel weighted filtering was applied to the demodulated phase curves to effectively suppress fading noise [16,17], which can be expressed as
P h a s e i = i = k i = k + n 1 p h a s e i P i i = k i = k + n 1 P i , k 1 , N
The intensity of the RBS signal is positively correlated with the SNR, meaning that locations with higher intensity generally exhibit lower noise levels, while those with lower intensity tend to have higher noise levels. The multi-channel weighted filtering technique, based on sliding average filtering, effectively addresses this by assigning higher weights to positions with better SNR—i.e., regions of higher intensity—thereby enhancing noise suppression during the filtering process.

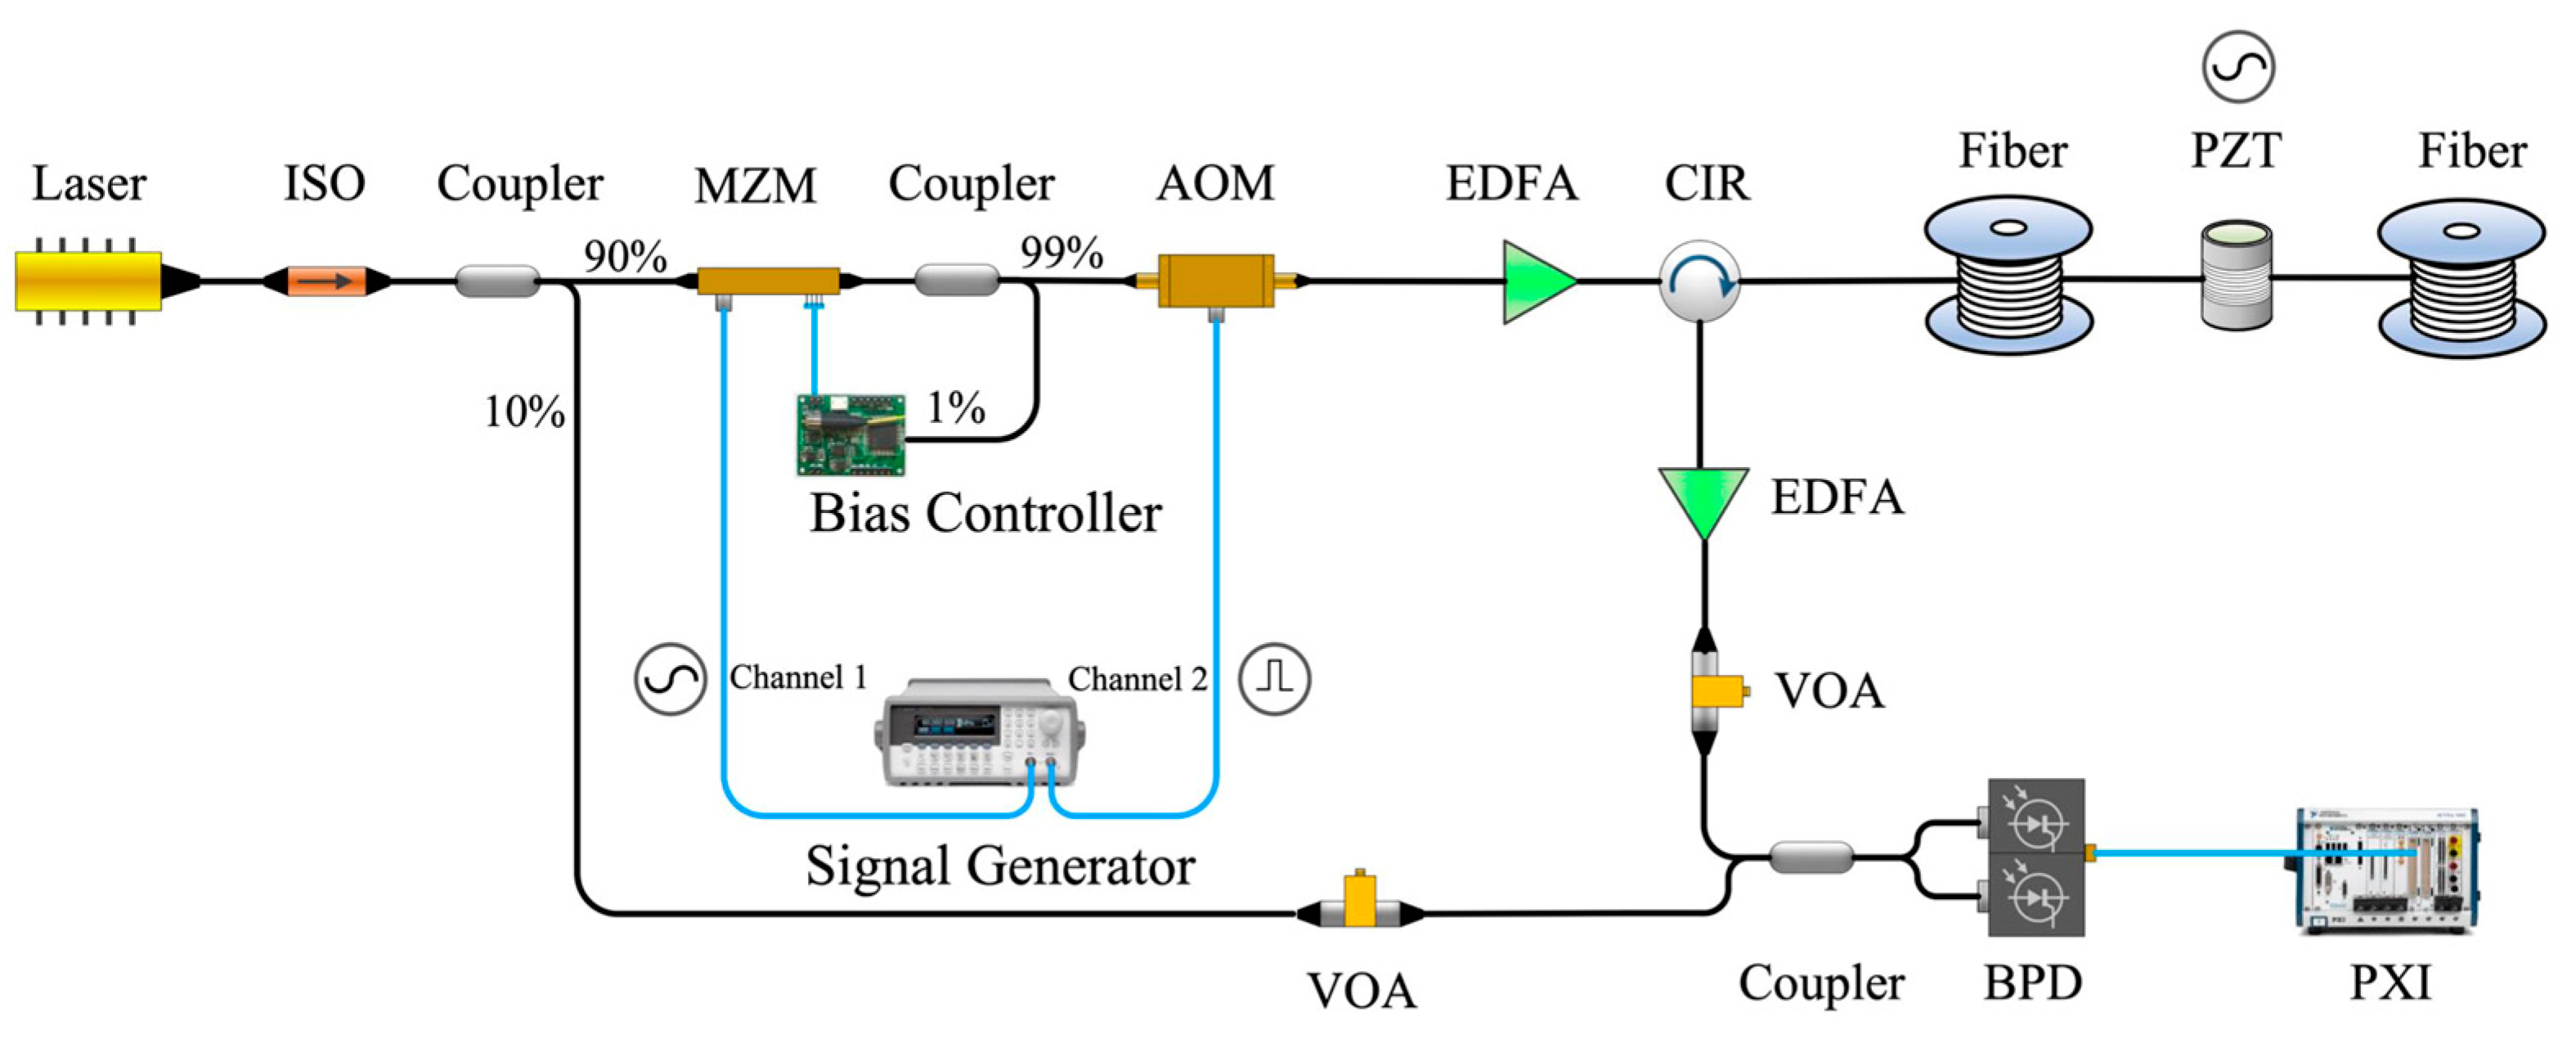
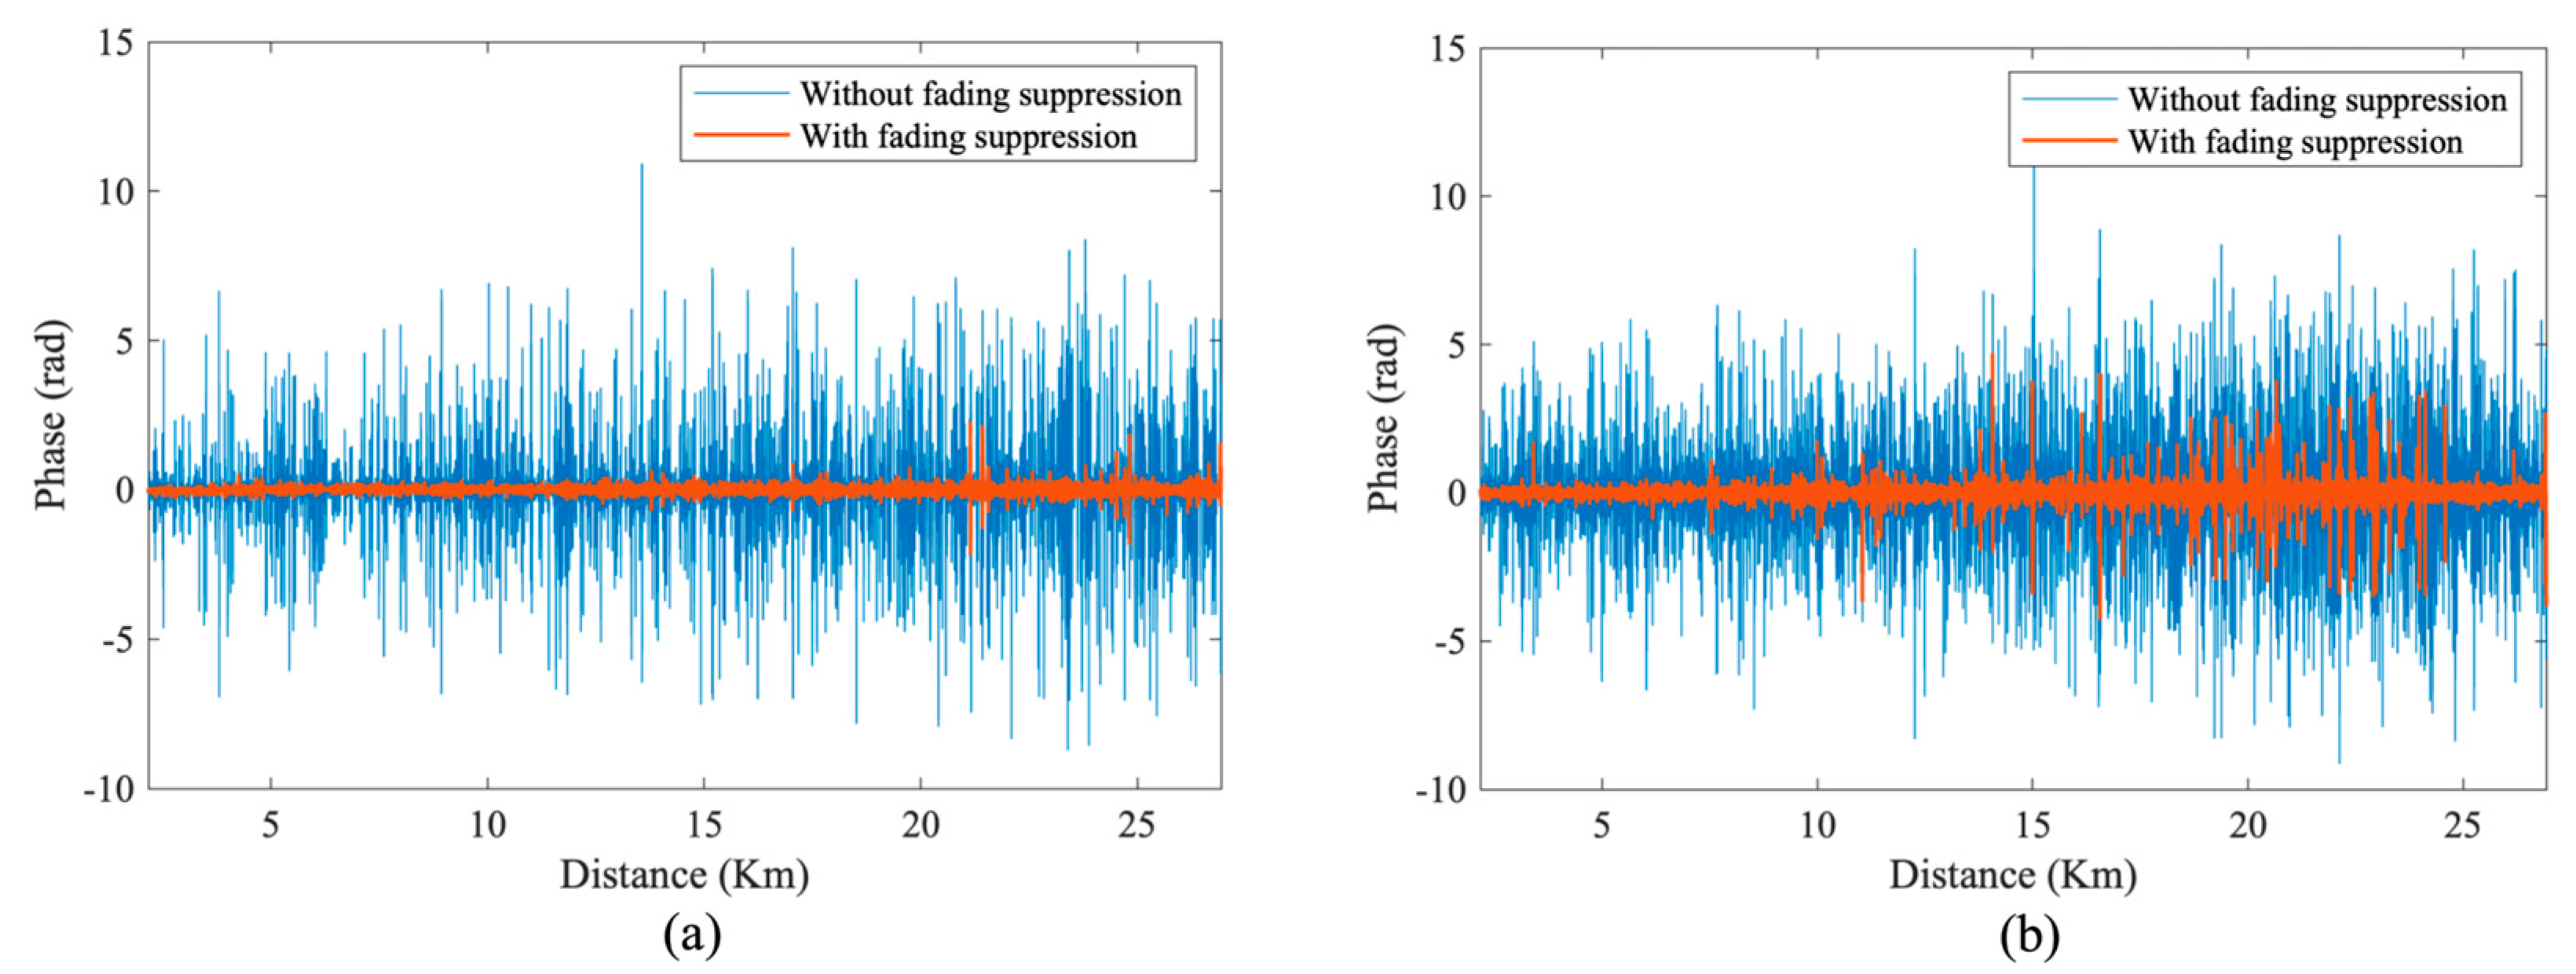
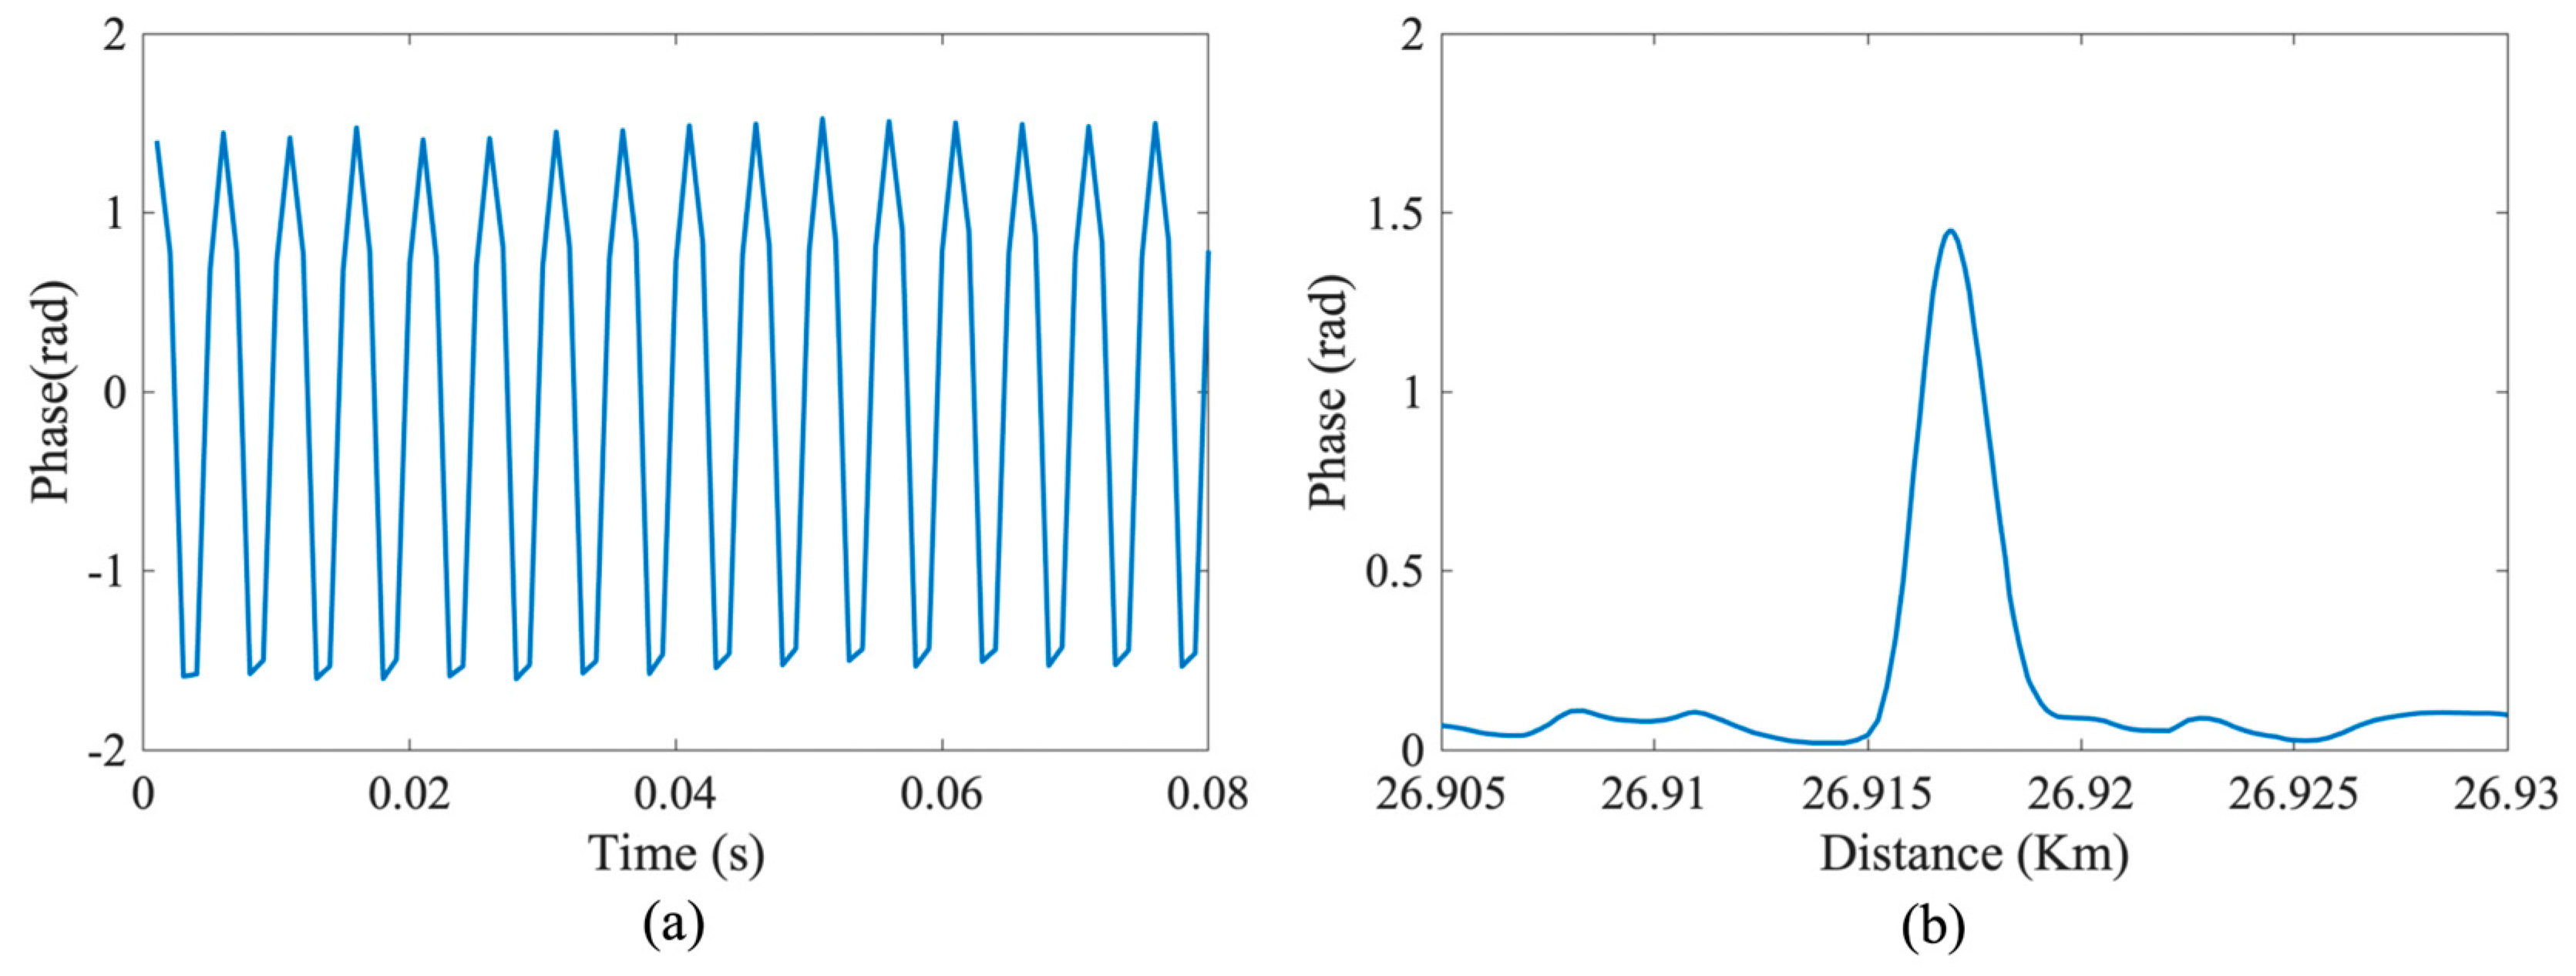
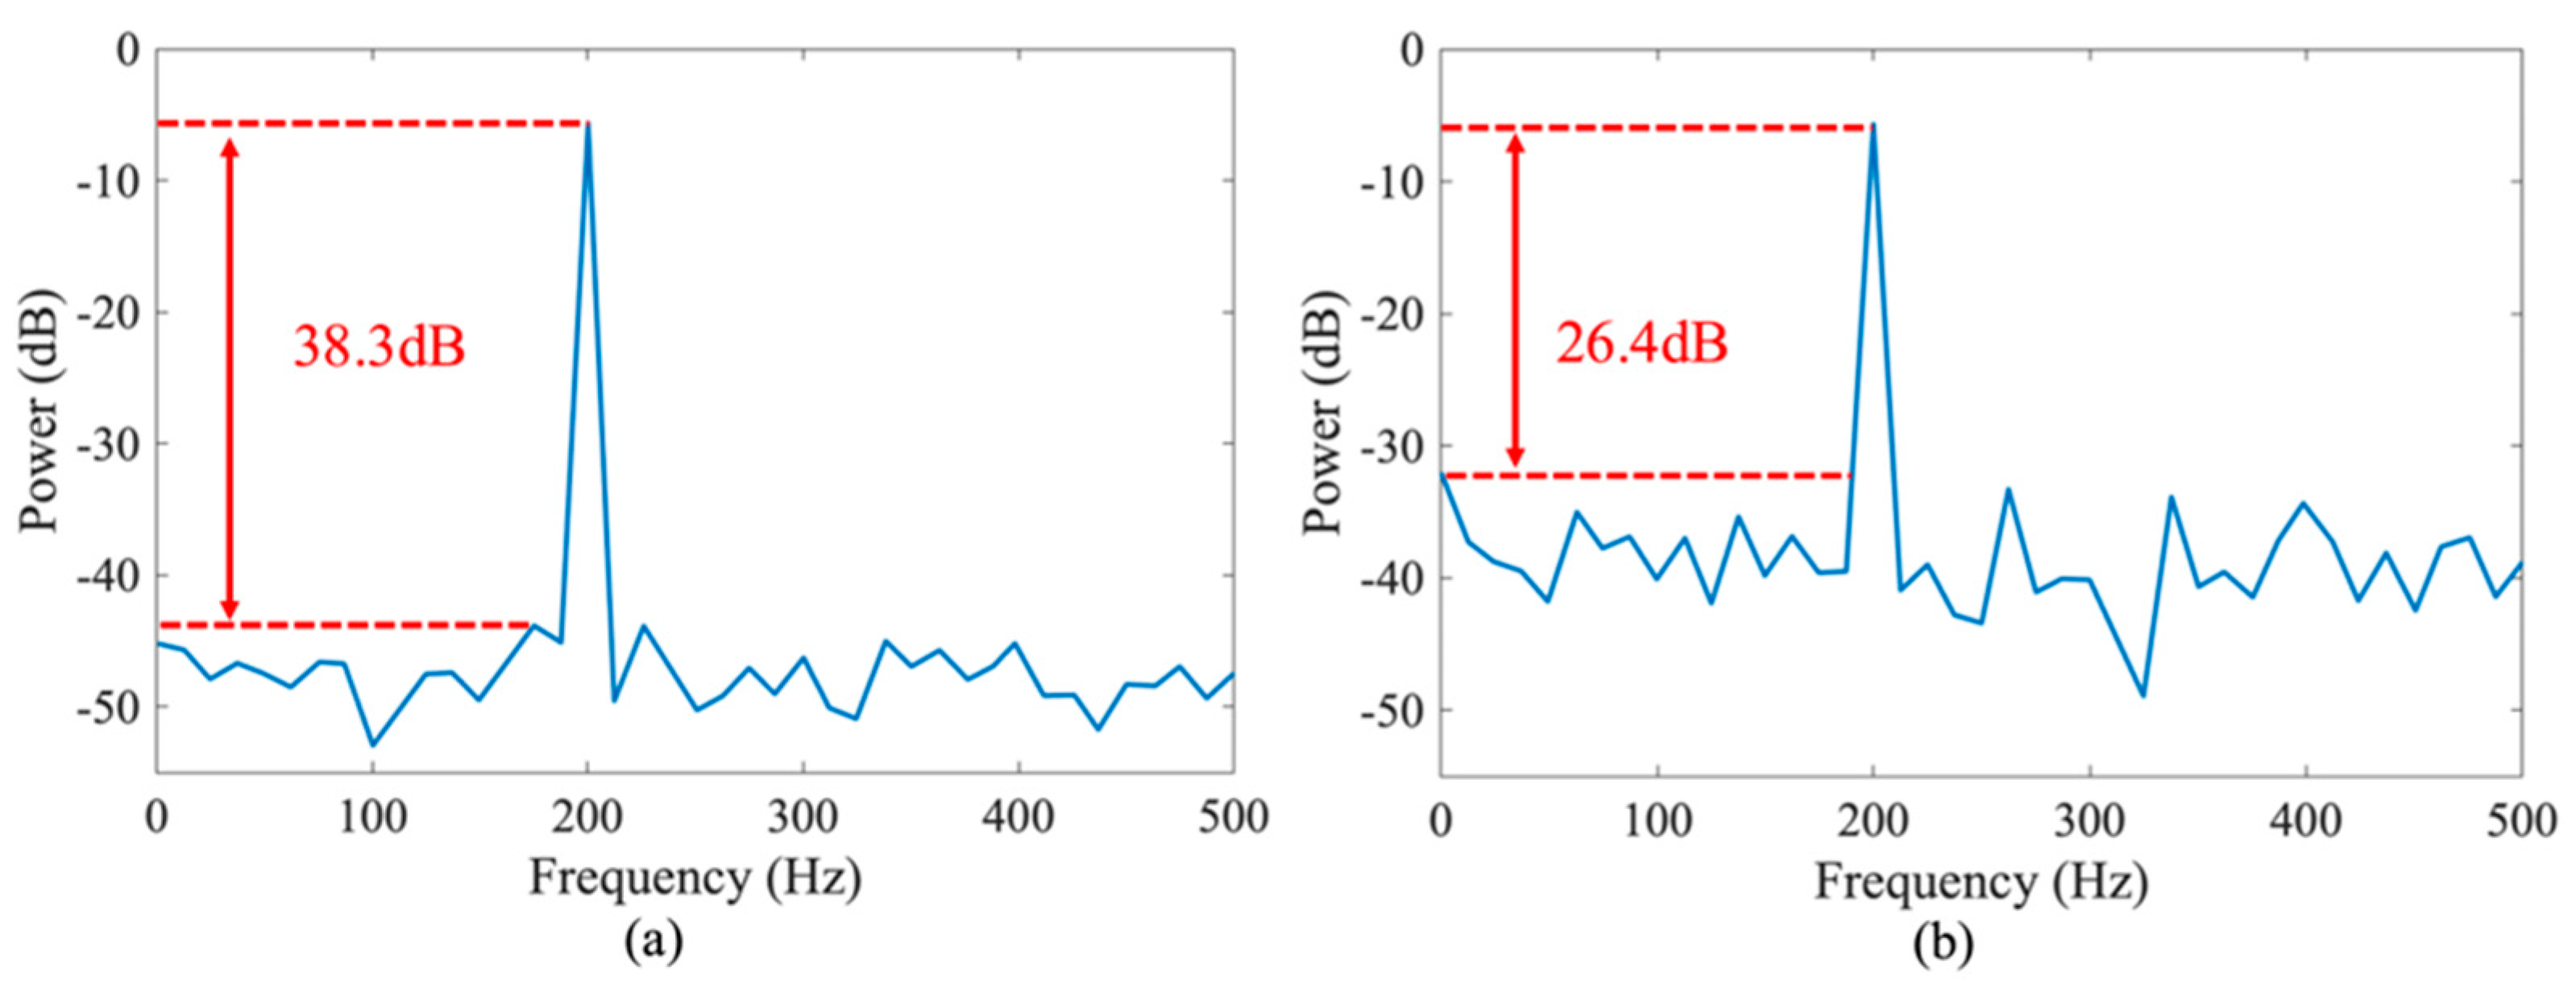
3. Experiment and Results

As shown in Figure 6, a commercial ultra-narrow linewidth laser (NKT Photonics BASIK X15, 100 Hz linewidth, Brøndby, Denmark) was employed. After passing through an isolator (ISO) and a 90:10 beam splitter, 90% of the laser was used as a probe light, and 10% was used as a local oscillator (LO) light. The probe was modulated into a dual-sideband sweep pulse through an EOM (iXblue, exail-MXAN-LN-05, Massy, France). A portion of 1% of the light output from the EOM was used as feedback light, allowing the automatic bias control system to find the minimum bias control point of the EOM. The AWG (SIGLENT, SDG7000A, Shenzhen, China) provided two electrical signals for the EOM and AOM (CETC, SGTF200-1550-1T-2A1, Chengdu, China) with a + 200 MHz frequency shift, respectively.
Under identical experimental conditions, we conducted two experiments, differing only in the time-domain signal forms of the probe pulses used. In the first experiment, we used the optimized NLFM signal with a sweep bandwidth of 60 MHz (70~130 MHz), and V m was set to 5 Vpp. At this V m , the modulation depth α = 1.2272 , and the suppression ratio between the ± 1 s t carriers generated by the EOM and the energy of other harmonics exceeded 25 dB. In the comparative experiment, the RF electrical signal applied to the EOM was an LFM signal, maintaining the same sweep bandwidth and sweep range of both sets of signals. Subsequently, the pulsed light was amplified by an erbium-doped fiber amplifier (EDFA: BG-pulse-EDFA-M-20W-1550-FC/APC, Shanghai, China) to obtain the appropriate peak power. The modulated pulse was injected into the sensing fiber through a circulator (CIR), with a piezoelectric ceramic transducer (PZT) placed at the 27 km end of the fiber. The detection pulse width was 20 µs, and the repetition frequency in the sensing system was 1000 Hz. The RBS from each point in the sensing fiber was amplified by an erbium-doped fiber amplifier (EDFA: BG-pulse-EDFA-M-20W-1550-FC/APC), passed through the CIR, and mixed with the LO light at a 3 dB coupler to produce a beat frequency. The beat frequency signal was then detected by a BPD (Aoshow, PDB1050H, 500 MHz, Shanghai, China) and converted to an electric signal through photoelectric conversion. Subsequently, these electrical signals were transmitted to a digital acquisition processing (DAQ, NI Pxie-5160, Austin, Texas) card, which worked at a 1.25 GSa/s sampling rate.
As shown in Figure 7, in the system using LFM detection pulses, the SNR at the end of the fiber was about 28 dB after the single backscattered Rayleigh light underwent matched filtering. In contrast, in the optimized NLFM system, the SNR after matched filtering was improved to 38 dB. This indicates that the system optimized with the NLFM signal exhibited a higher SNR after matched filtering. Furthermore, the number of fading points after matched filtering in the NLFM system was significantly fewer than in the LFM system. This indicates that the optimized convolution of the NLFM detection pulse signal led to higher effective detection pulse energy, thereby significantly enhancing the SNR under the same external conditions.
Then, we applied a 200 Hz sine wave with a peak-to-peak voltage of 5 V to the PZT at the distal end of the sensing fiber. Due to the storage depth limitations of the data acquisition card, we collected 80 cycles of backscattered Rayleigh scattering trajectories under different detection pulse signal forms for digital processing. In the digital domain, two distinct matched filters were used to extract the ± 1 s t carriers from the scattered signal, ensuring that the two carrier components did not interfere with each other after matched filtering. To evaluate the superiority of dual-carrier multiplexing in mitigating fading effects, it is clearly evident from the blue traces in Figure 8 that, regardless of the sweeping signal form of the detection pulse, when only one carrier was used for disturbance signal demodulation, the demodulated results contained multiple fading noise points. Moreover, the number of fading points in the LFM system was notably higher than that in the NLFM system, consistent with the results in Figure 7. The presence of fading noise resulted in a reduction in the SNR and introduced errors in the phase demodulation process, thereby affecting the measurement accuracy of the sensing system.
Furthermore, we employed phase weighting according to the intensity-weighted values of each carrier after matched filtering, followed by the application of the vector rotation aggregation method to combine the complex signals of the ± 1 s t first-order carriers. After the implementation of fading suppression, the fading noise was notably reduced, as demonstrated by the red traces in Figure 8. Moreover, the fading suppression performance of the optimized NLFM signal system surpassed that of the conventional LFM signal system. In Figure 9, the phase demodulation results clearly exhibit a significant reduction in fading noise. Furthermore, it can be observed that the fading suppression performance of the LFM detection pulse system was noticeably inferior to that of the NLFM pulse system, further highlighting the advantages of NLFM pulse signals in mitigating fading noise.
Figure 10a illustrates the results of phase demodulation for disturbance signals in the NLFM system, which effectively recovered the phase information. It also depicts the standard deviation (SD) of the phase around the vibration points, indicating the system’s precision. Notably, the measured distance between the rising and falling edges of the SD curve was approximately 2.7 m, which is consistent with the theoretical spatial resolution presented in Figure 4.
Figure 11 resents the power spectrum of the channel at the disturbance location. Figure 11a illustrates the case where the system employs NLFM probe pulses, showing that the disturbance signal at the fiber end achieved an SNR of 38.3 dB. Figure 11b depicts the system utilizing LFM probe pulses, where the disturbance signal at the same location exhibited an SNR of 26.4 dB. These results indicate that the NLFM-based system improved the SNR by approximately 11.9 dB compared to the LFM-based system at this specific position.

4. Conclusions

In this paper, we propose an optimized design method for NLFM pulses, which enhances the performance of the DAS system without incurring additional hardware costs. The optimization is achieved solely through the digital optimization of the time–frequency function. Under identical conditions, the optimized detection signal, after matched filtering, effectively suppressed background noise, resulting in an SNR increase of approximately 10 dB. To analyze the recovery of disturbance signals, we employed a multi-channel weighted averaging algorithm combined with dual-sideband multiplexing and vector rotation aggregation to mitigate interference fading noise. The optimized NLFM pulse demonstrated superior noise suppression performance compared to the LFM detection pulse. The spatial resolution at the disturbance location reached approximately 2.7 m, effectively validating the advantages of the optimized NLFM pulse in improving the SNR. These results highlight the promising potential of NLFM detection pulses for further research, with the goal of developing high-performance fiber optic sensing systems.

Author Contributions

All authors contributed substantially to the manuscript. Conceptualization, J.Z. and K.C.; methodology, J.Z.; software, J.Z.; validation, J.Z., K.C. and Y.S.; formal analysis, T.X.; investigation, J.Z.; resources, T.X.; data curation, J.Z.; writing—original draft preparation, J.Z.; writing—review and editing, T.X. and F.L.; visualization, J.Z.; supervision, T.X. and D.D.; project administration, T.X.; funding acquisition, T.X. All authors have read and agreed to the published version of the manuscript.

Funding

This research was funded by the National Key R&D Program of China (Grant No. 2023YFC3010703), the Research Program of Sanya Yazhou Bay Science and Technology City (Grant No. SKJC-2020-01-009), and the Strategic Priority Research Program of the Chinese Academy of Sciences (Grant No. XDA22040105).

Institutional Review Board Statement

Not applicable.

Informed Consent Statement

Not applicable.

Data Availability Statement

The data supporting the conclusions of this article will be made available by the authors upon request.

Acknowledgments

We sincerely appreciate the reviewers for their insightful feedback and the editors for their dedicated guidance throughout the process.

Conflicts of Interest

The authors declare no conflicts of interest.

References

  1. Catalano, A.; Bruno, F.A.; Galliano, C.; Pisco, M.; Persiano, G.V.; Cutolo, A.; Cusano, A. An Optical Fiber Intrusion Detection System for Railway Security. Sens. Actuators A 2017, 253, 91–100. [Google Scholar] [CrossRef]
  2. Snider, W.T.; Madsen, C.K.; Atkins, R.A.; Simcik, J.S., III. Border Security Utilizing a Distributed Fiber Optic Intrusion Sensor; CiteSeerX: Princeton, NJ, USA, 2008. [Google Scholar]
  3. Spingys, C.P.; Garabato, A.C.N.; Belal, M. Optical Fibre Sensing of Turbulent-Frequency Motions in the Oceanic Environment. Sci. Rep. 2024, 14, 20276. [Google Scholar] [CrossRef] [PubMed]
  4. Chen, D.; Liu, Q.; Fan, X.; He, Z. Distributed Fiber-Optic Acoustic Sensor With Enhanced Response Bandwidth and High Signal-to-Noise Ratio. J. Lightwave Technol. 2017, 35, 2037–2043. [Google Scholar] [CrossRef]
  5. Wang, Y.; Li, Y.; Xiao, L.; Liang, B.; Liu, X.; Bai, Q.; Jin, B. Interference Fading Suppression Using Active Frequency Transformation Method With Auxiliary Interferometer Feedback. J. Lightwave Technol. 2022, 40, 872–879. [Google Scholar] [CrossRef]
  6. Wang, X.; Lu, B.; Wang, Z.; Zheng, H.; Liang, J.; Li, L.; Ye, Q.; Qu, R.; Cai, H. Interference-Fading-Free $\phi$ -OTDR Based on Differential Phase Shift Pulsing Technology. IEEE Photon. Technol. Lett. 2019, 31, 39–42. [Google Scholar] [CrossRef]
  7. Jin, Z.; Chen, J.; Chang, Y.; Liu, Q.; He, Z. Silicon Photonic Integrated Interrogator for Fiber-Optic Distributed Acoustic Sensing. Photonics Res. 2024, 12, 465. [Google Scholar] [CrossRef]
  8. Liu, X.; Tang, W.; Xie, L.; Wang, Y.; Shi, J.; Liu, K. Improved Rotational Vector Summation Algorithm for Fade Suppression in Distributed Acoustic Sensing. J. Phys. Conf. Ser. 2023, 2617, 012014. [Google Scholar] [CrossRef]
  9. Xiao, Y.; Liu, H.; Li, J.; Shen, X.; Zhao, Z.; Dang, H.; Zou, D.; Zhang, A.; Wang, P.; Zhao, Z.; et al. Fading Suppression and Noise Reduction of a DAS System Integrated Multi-Core Fiber. Opt. Express 2024, 32, 26793. [Google Scholar] [CrossRef]
  10. Li, H.; Liu, T.; Fan, C.; Yan, B.; Chen, J.; Huang, T.; Yan, Z.; Sun, Q. Fading Suppression for Distributed Acoustic Sensing Assisted with Dual-Laser System and Differential-Vector-Sum Algorithm. IEEE Sensors J. 2022, 22, 9417–9425. [Google Scholar] [CrossRef]
  11. Nowak, M.; Wicks, M.; Zhang, Z.; Wu, Z. Co-Designed Radar-Communication Using Linear Frequency Modulation Waveform. IEEE Aerosp. Electron. Syst. Mag. 2016, 31, 28–35. [Google Scholar] [CrossRef]
  12. Song, R.; He, J. OFDM-NOMA Combined with LFM Signal for W-Band Communication and Radar Detection Simultaneously. Opt. Lett. 2022, 47, 2931. [Google Scholar] [CrossRef]
  13. Zhang, J.; Wu, H.; Zheng, H.; Huang, J.; Yin, G.; Zhu, T.; Qiu, F.; Huang, X.; Qu, D.; Bai, Y. 80 Km Fading Free Phase-Sensitive Reflectometry Based on Multi-Carrier NLFM Pulse Without Distributed Amplification. J. Lightwave Technol. 2019, 37, 4748–4754. [Google Scholar] [CrossRef]
  14. Vizitiu, I.; Anton, L.; Popescu, F.; Iubu, G. The Synthesis of Some NLFM Laws Using the Stationary Phase Principle. In Proceedings of the 2012 10th International Symposium on Electronics and Telecommunications, Timisoara, Romania, 15–16 November 2012; IEEE: Timisoara, Romania, 2012; pp. 377–380. [Google Scholar]
  15. Lu, L.; Song, Y.; Zhu, F.; Zhang, X. Coherent Optical Time Domain Reflectometry Using Three Frequency Multiplexing Probe. Opt. Lasers Eng. 2012, 50, 1735–1739. [Google Scholar] [CrossRef]
  16. Bahadori, M.; Yang, Y.; Hassanien, A.E.; Goddard, L.L.; Gong, S. Theory of Coupled Harmonics and Its Application to Resonant and Non-Resonant Electro-Optic Modulators. J. Lightwave Technol. 2020, 38, 5756–5767. [Google Scholar] [CrossRef]
  17. Wu, Q.; Zhou, X.; Wang, C.; Qin, Z. Channel Estimation Based on Superimposed Pilot and Weighted Averaging. Sci. Rep. 2022, 12, 10293. [Google Scholar] [CrossRef] [PubMed]
Figure 1. Principle of matched filtering. TSW: Full width at half maximum (FWHM) of sweep duration, SBW: FHWH sweep pulse width.
Photonics 12 00183 g001
Figure 2. (a) Time–frequency function generated by Hamming window; (b) optimized time–frequency function of NLFM signal.
Photonics 12 00183 g002
Figure 3. The t value under the optimal sidelobe suppression ratio and 3 dB pulse width.
Photonics 12 00183 g003
Figure 4. (a) Time–frequency spectra of LFM; (b) time–frequency spectra of NLFM; (c) compressed signals; (d) frequency spectra of LFM and NLFM.
Photonics 12 00183 g004
Figure 5. (a) Single pulse with positive and negative chirp sweep signals; (b) schematic diagram of frequency division multiplexing.
Photonics 12 00183 g005
Figure 6. Experimental setup.
Photonics 12 00183 g006
Figure 7. (a) The trace of a single backscattered Rayleigh light after matched filtering in the LFM system; (b) the trace of a single backscattered Rayleigh light after matched filtering in the NLFM system.
Photonics 12 00183 g007
Figure 8. (a) Differential phase trace diagram of NLFM system; (b) differential phase trace diagram of LFM system.
Photonics 12 00183 g008
Figure 9. (a) Demodulation phase waterfall diagram near vibration of NLFM system using single-carrier backscatter signal; (b) demodulation phase waterfall diagram near vibration of NLFM system using dual-carrier backscatter signal; (c) demodulation phase waterfall diagram near vibration of LFM system using single-carrier backscatter signal; (d) demodulation phase waterfall diagram near vibration of LFM system using dual-carrier backscatter signal.
Photonics 12 00183 g009
Figure 10. (a) Demodulated phase in NLFM system; (b) standard deviation of phase traces.
Photonics 12 00183 g010
Figure 11. (a) Power spectrum of NLFM detection pulse system; (b) power spectrum of LFM detection pulse system.
Photonics 12 00183 g011
Disclaimer/Publisher’s Note: The statements, opinions and data contained in all publications are solely those of the individual author(s) and contributor(s) and not of MDPI and/or the editor(s). MDPI and/or the editor(s) disclaim responsibility for any injury to people or property resulting from any ideas, methods, instructions or products referred to in the content.

