Article

Terahertz Multicolor Imaging of Opaque Objects Using Self-Mixing Interferometry with Quantum-Cascade Lasers

by
Jiaxuan Cai
1,2,†,
Yan Xie
3,†,
Yingxin Wang
3,
Meng Chen
3,
Lianhe Li
4,
Mohammed Salih
4,
Edmund H. Linfield
4,
Ning Yang
1,2,
Weidong Chu
1,2,*,
Peng Bai
1,2,* and
Ziran Zhao
3
1
Institute of Applied Physics and Computational Mathematics, Beijing 100088, China
2
National Key Laboratory of Computational Physics, Beijing 100088, China
3
Department of Engineering Physics, Tsinghua University, Beijing 100084, China
4
School of Electronic and Electrical Engineering, University of Leeds, Leeds LS2 9JT, UK
*
Authors to whom correspondence should be addressed.
These authors contributed equally to this work.
Photonics 2025, 12(2), 109; https://doi.org/10.3390/photonics12020109
Submission received: 30 December 2024 / Revised: 18 January 2025 / Accepted: 22 January 2025 / Published: 25 January 2025

Abstract

:
Self-mixing interference in a terahertz quantum-cascade laser has been demonstrated to be suitable for the detection of weak signals scattered or reflected by the target. This technology has achieved the high-sensitivity detection of complex refractive indices, surface/interface morphologies and molecular feature spectra. Here, a set of terahertz quantum-cascade lasers with different lasing frequencies is used to inspect a tiny amount of powder concealed inside a polytetrafluoroethylene tablet by using self-mixing interferometry combined with the penetration properties of terahertz waves. Multicolor spectral images were acquired, which were synthesized by absorption contrast images obtained at different lasing frequencies. They enable the detection of the spatial distribution of hidden objects which are totally opaque in visual light and allow for them to be identified with spectral absorption characteristics. Self-mixing interference technology can also obtain phase information when a terahertz wave interacts with a tablet, showing the difference between the hidden object and surroundings from another dimension. Our research may provide a strategy for the development of terahertz multispectral imaging technology for the inspection of hidden trace residues.

1. Introduction

Optical detection has a significant capability to carry out rapid standoff sensing without the need for sampling [1], non-destructive inspection [2,3,4,5] and the identification of substances through spectroscopic characteristics [6,7,8]. In the terahertz (THz) region, THz optical detection can take advantage of the unique properties of the interaction between a THz wave and matter. It can induce the THz photon resonance absorption of molecular vibrations and dipole rotations, providing information about the composition, structure and function of molecules, which is not achievable in other electromagnetic regions. This means that THz waves can penetrate into non-conductive and non-polar materials which have no complex permittivity changes. Recent advancements in THz technology have revolutionized the way hidden objects are inspected [9,10], which may be useful in military and security scenarios for the examination of concealed hazardous substances. In addition, THz spectroscopy provides ‘fingerprint’ spectra for various materials, allowing for their identification and characterization, such as explosives, drugs, biological tissues, DNA, RNA and protein macromolecules [11,12,13,14,15].
The challenge for THz detection and spectroscopy is to measure the weak THz signals that penetrate through or are reflected from the analytes. Many approaches have been proposed to enhance the interaction between THz waves and analytes, such as photonic crystal fibers [16], grating waveguides [17], metamaterials [18,19] and so forth. At present, engineered metamaterials have been demonstrated to utilize the resonant interaction to achieve fast, spectrally selective and highly sensitive detection in the THz band. However, one of the primary challenges for the development of metamaterials lies in the complexity of their design and manufacturing due to the requirements of precise engineering at the nanoscale, which can be both time-consuming and costly [20]. In addition, they face limitations in terms of coherent detection, and sensitivity and accuracy for distinguishing and identifying different trace-amount substances in complex systems still need to be promoted [21].
Another promising coherent detection method for highly sensitive spectroscopy can be realized by exploiting the self-mixing (SM) effect in THz quantum-cascade lasers (QCLs). The SM interference occurs in the QCL cavity where the intracavity THz wave interferes with a wave that has been reinjected into the laser cavity after interacting with a target [22,23]. The THz-QCL acts as an oscillator, a mixer and a detector. The THz-QCL SM interferometric system has the most compact configuration, as it needs no external detector. It has been demonstrated that the detectable power using the THz-QCL SM scheme is several pW [24], making it suitable for the detection of intrinsically weak scattered signals. The SM signals characterize changes in the electric field in the laser cavity, being highly sensitive to the sample complex refractive index [25,26], and reconstructing surface/interface morphology with a high-depth resolution [27,28]. In addition, the THz gas spectroscopy of compound molecules, such as D2O, CH3OD and CH3OH, has been carried out with a high spectral resolution by tuning the laser’s frequency range [29,30,31,32]. Limited by the performance of lasers and the complexity of SM interference theory, the detection of THz-QCLs using SM usually operates in a single longitudinal mode or scans within the range of a few GHz [29,30,31]. This loses the ‘fingerprint’ spectra of terahertz waves which are used to analyze materials.
In this work, we use THz-QCL SM interferometry to acquire multicolor images of a tiny amount of powder sealed inside a polytetrafluoroethylene (PTFE) tablet. The SM interferometry system is set up using three THz QCLs, switching to different frequencies to obtain the spectroscopic characterizations of the substances under concealment. Our spectroscopy and imaging system can achieve the identification of different substances with concentrations of 1.41 wt%, and can elucidate their spatial distributions in opaque substances. Our research is helpful for the development of THz multispectral imaging technology for use in the application of hidden trace residue inspection.

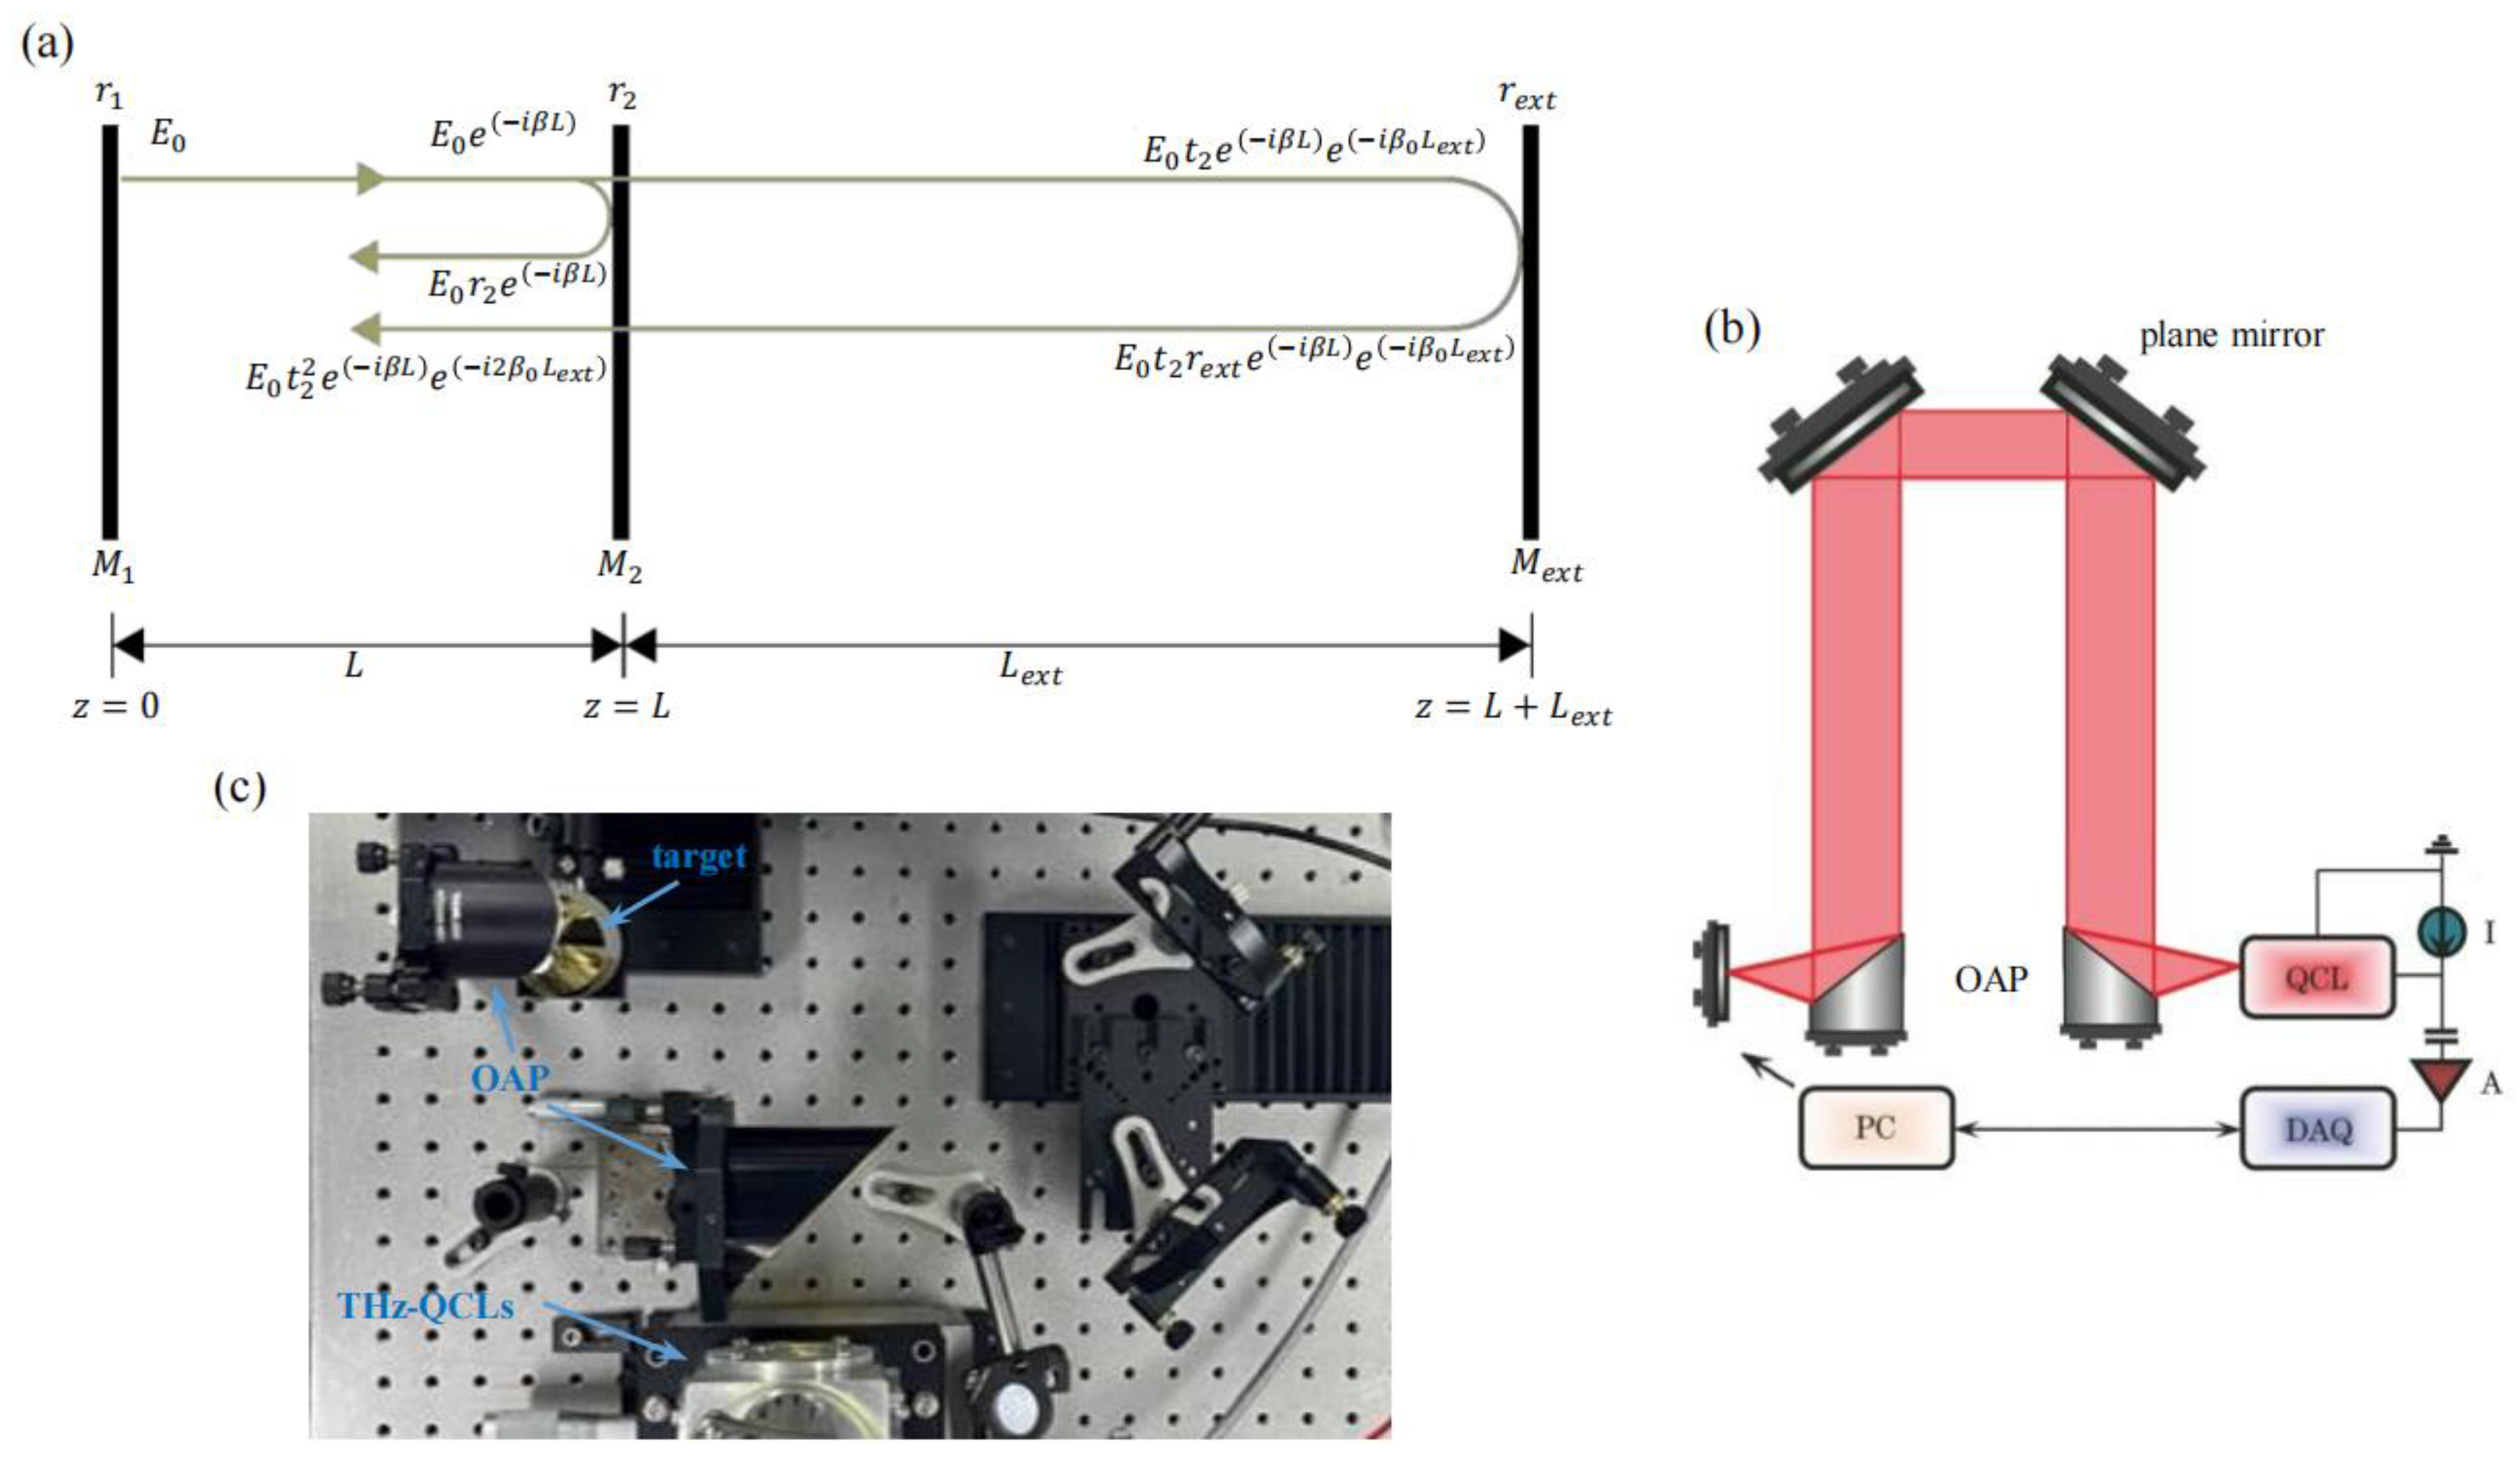
2. Physical Model and Experimental Setup

2.1. Self-Mixing Interference Theory

A theoretical modeling of SM interference is to regard the target as a reflector with a fixed reflection coefficient. Together with the end faces of the laser, a three-mirror model is established. The relationship between the laser’s dynamic parameters and the external target can be obtained by analyzing the influence of external feedback light on the dynamic stability of the laser.
Figure 1a shows the three-mirror model of SM interference, where M1 and M2 represent the mirrors corresponding to the end faces of the laser, and Mext represents the external sample. The stable operation of the laser requires periodic conditions
E0 = E0r2exp(−iβL) + E0t22rextexp(−iβL−i2β0Lext),
where r2 and rext are the reflection coefficients of M2 and Mext, t2 represents the transmission coefficient of the laser end face, β and β0 are the wave vectors inside and outside the cavity, E0 is the initial electric field intensity of the laser in the cavity, L and Lext are the lengths of the laser cavity and the external cavity and ne and n0 are the refractive indices inside and outside the laser cavity.
If M2 and Mext are regarded as an equivalent mirror Meff, whose equivalent reflection coefficient is reff [33], then
E0reffexp(−iβL) = E0r2exp(−iβL) + E0t22rextexp(−iβL−i2β0Lext),
the equivalent reflection coefficient can be expressed as
reff = r2 + t22rextexp(−i2β0Lext),
Replace the reflection coefficient of the laser output end face during free-running with reff, bring in the laser gain coefficient during free-running g0 = αs + ln(1/r1r2)/L (where αs is the loss coefficient) and consider that the feedback light intensity is much smaller than that in the cavity. We can obtain the difference between the gain coefficient of the laser when it is stable with optical feedback and when it is free-running [34]
Δg = gcg0 = −ln(1 + κextcos(2πfτext))/L,
where κext = rext(1 − r22)/r2 << 1 represents the external cavity coupling coefficient, f represents the laser’s lasing frequency under optical feedback and τext = 2neLext/c represents the propagation time of light in the external cavity. Since the external cavity coupling coefficient κext is a small quantity, which can be simplified by Taylor expansion and taking the first-order term, then Equation (4) can be simplified to
Δg = −κextcos(2πfτext)/L,
This change in gain coefficient affects the stability condition of the laser, thus affecting the inversion particle number density N. For semiconductor lasers, the terminal voltage is proportional to N. Therefore, under the condition of optical feedback, the laser terminal voltage will change from V0 to V, in which
VV0 = VSM = Ccos(2πfτext),
VSM is the SM voltage signal. Where C is the feedback coefficient [35], which is related to the photon lifetime in the cavity τn, the photon density is S0 and the group velocity of the laser is vg and κext. C can be expressed as
C = κext (1 + 1/vg S0τn(∂g/∂N))/g0,
In this formula, except for κext, all other parameters are the fixed parameters of the laser. Therefore, in the case of weak feedback, the amplitude of the SM signal is proportional to the reflection coefficient of the target [35]. The reflection condition of the target can be directly inferred by the intensity of the SM signal. In fact, all changes in electric field propagation in the external cavity are attributed to rext and Lext in the three-mirror model. If there is additional absorption in the optical path, it will be equivalent to a decrease in rext. If the electric field obtains an additional phase when reflected by the target, it will be equivalent to a change in Lext. Therefore, it is possible to infer the situation when light interacts with external objects and obtain the optical information of the target by analyzing the amplitude and phase of the SM signal.
In order to obtain a complete SM waveform to obtain the amplitude and phase, it is necessary to modulate the SM interference. Traditional SM modulation is achieved by changing the optical path length. Every time Lext changes half of the wavelength, an SM signal cycle will be obtained. This modulation method is relatively stable, but the detection efficiency is limited by the speed of mechanical movement. By changing the laser’s lasing frequency, the phase in Equation (6) can also be modulated [36]. The modulation of frequency can be achieved by adjusting the refractive index of the laser itself. The lasing of the laser must meet the standing wave condition
f = kc/2n0L,
where k is an integer. When the refractive index changes, frequency changes by
Δf = Δn0kc/(2n2L),
n0 can be changed by adjusting the carrier density. By changing the excitation current of the laser, the carrier density can be adjusted to achieve the modulation of frequency, thereby obtaining a complete SM periodic signal.

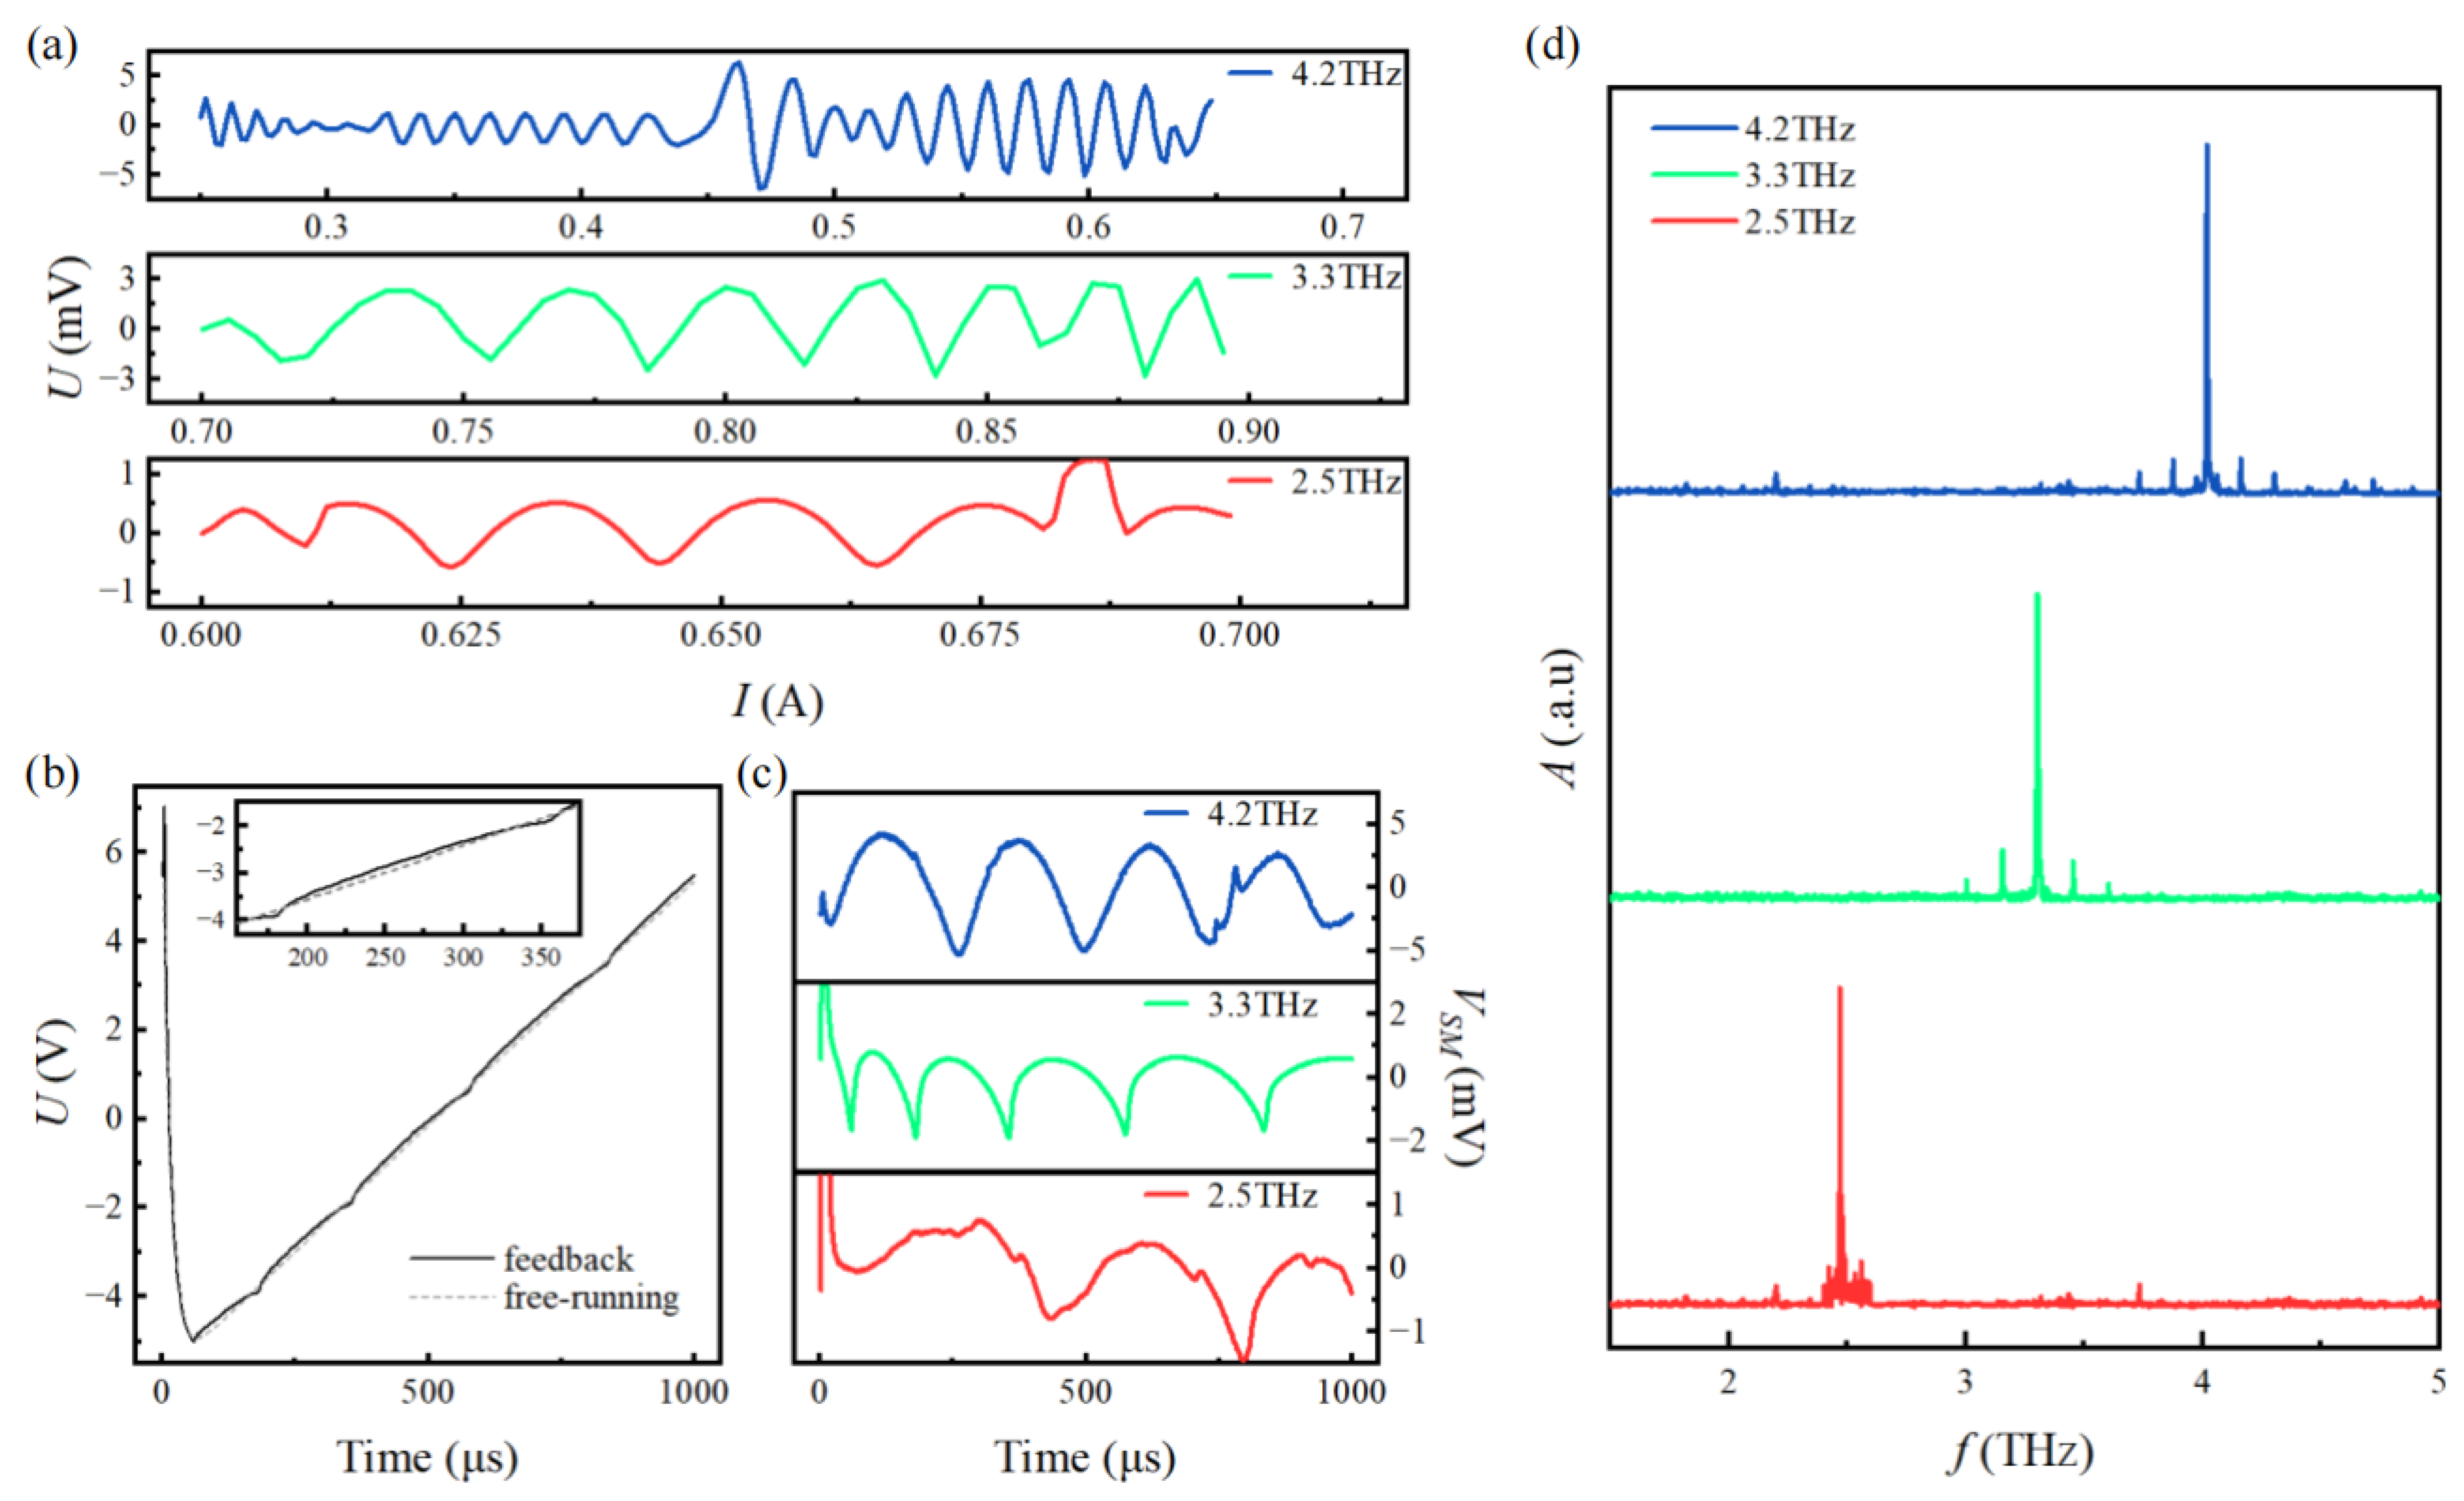
2.2. Acquirement of SM Interference Signal

The schematic diagram of the imaging device is shown in Figure 1b. Light emitted by the THz-QCLs is collected and collimated by an off-axis parabolic reflector, and then transmitted to a second off-axis parabolic reflector through a pair of vertically placed plane mirrors to be focused on the target. After being reflected or scattered by the target, the light is reinjected back into the laser cavity through the original path. The number of oscillation periods of the SM signal depends on the optical path length, which can be changed by varying the distance between the pair of plane mirrors and the QCL laser facet. According to Equation (6), the longer the optical path, the more complete cycles are presented on the SM signal.
In this work, three THz-QCLs with different lasing modes were used for multicolor imaging, with center frequencies of 2.5 THz, 3.3 THz and 4.2 THz. The schemes of the active region are all resonant phonons, with a Fabry–Pérot cavity in a semi-insulating surface plasmon waveguide [37]. They were placed side by side in a helium-flow cryostat and run at 30 K, 45 K and 30 K, respectively. The optical path was positioned on different lasers by adjusting the position of the first OAP. Their lasing spectra are shown in Figure 2d. Self-mixing signals were obtained by driving current modulation. As shown in Figure 2a, the self-mixing voltage signal shows periodic oscillations as the current increases. In certain cases, the amplitude and width of the periodic signal will change due to the mode hopping of the THz-QCLs. When the current increases, the power of the laser increases, leading to changes in the intensity of the reinjected field back into the laser cavity. Thus, the lasers will stabilize in new states. This leads to amplitude changes and mode jumps, which are manifested in the SM interference signals. To acquire a sinusoidal-like periodic SM signal, we selected 0.62–0.67 A, 0.73–0.85 A and 0.55–0.62 A as the current modulation range for THz-QCLs with frequencies of 2.5 THz, 3.3 THz and 4.2 THz, respectively.
For measurement, a sawtooth current signal with the selected variation range was loaded on the THz-QCLs at 1 kHz to achieve efficient voltage signal modulation. Due to the volt-ampere characteristic, the terminal voltage of the THz-QCL will also respond in a sawtooth waveform, regardless of whether the optical feedback exists or not. Figure 2b shows the modulated voltage variation in working states of free running and optical feedback as dashed and solid lines, respectively. Specifically, it can be observed that a weak SM signal is superposed on the sawtooth voltage due to the optical feedback, as shown in the inset of Figure 2b.
To acquire the SM signal, the voltage signal of the laser for free running was subtracted from the voltage signal under optical feedback to eliminate the effect of the volt-ampere characteristic. Figure 2c gives the SM signals of the three THz-QCLs within their respective current modulation ranges. There exist 2, 4 and 4 complete cycles in the oscillation curves of QCLs for 2.5 THz, 3.3 THz and 4.2 THz, respectively. This was achieved by setting the total optical path length at 67.5 cm.

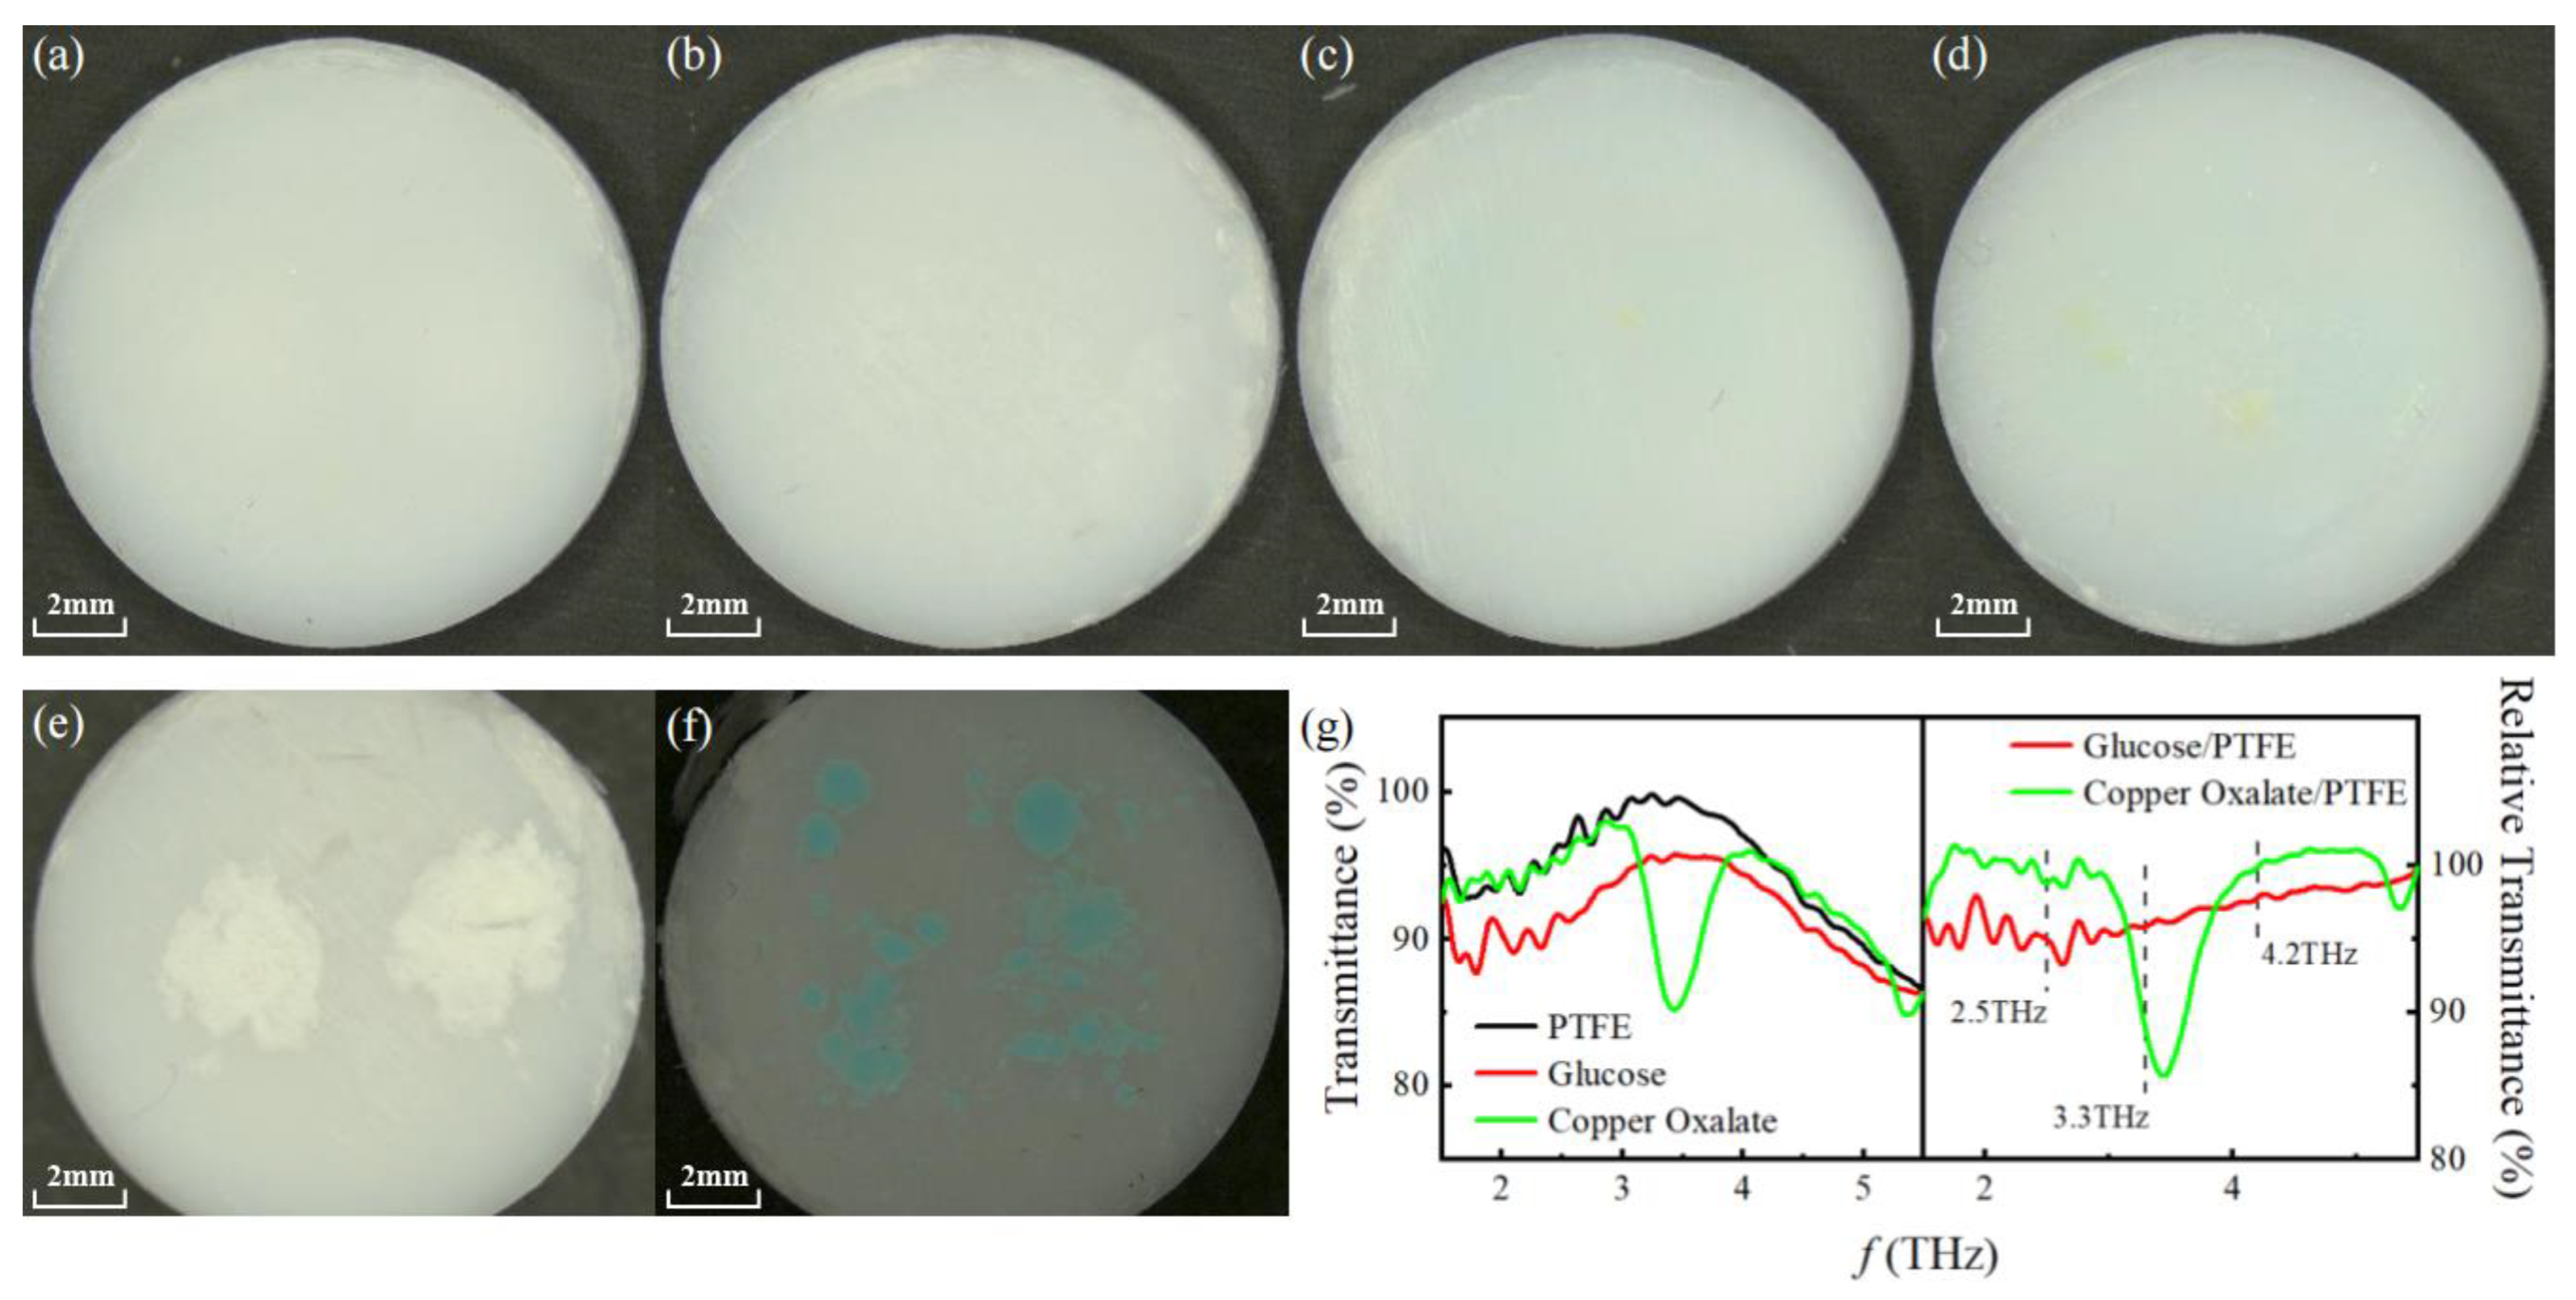
2.3. Sample Preparation
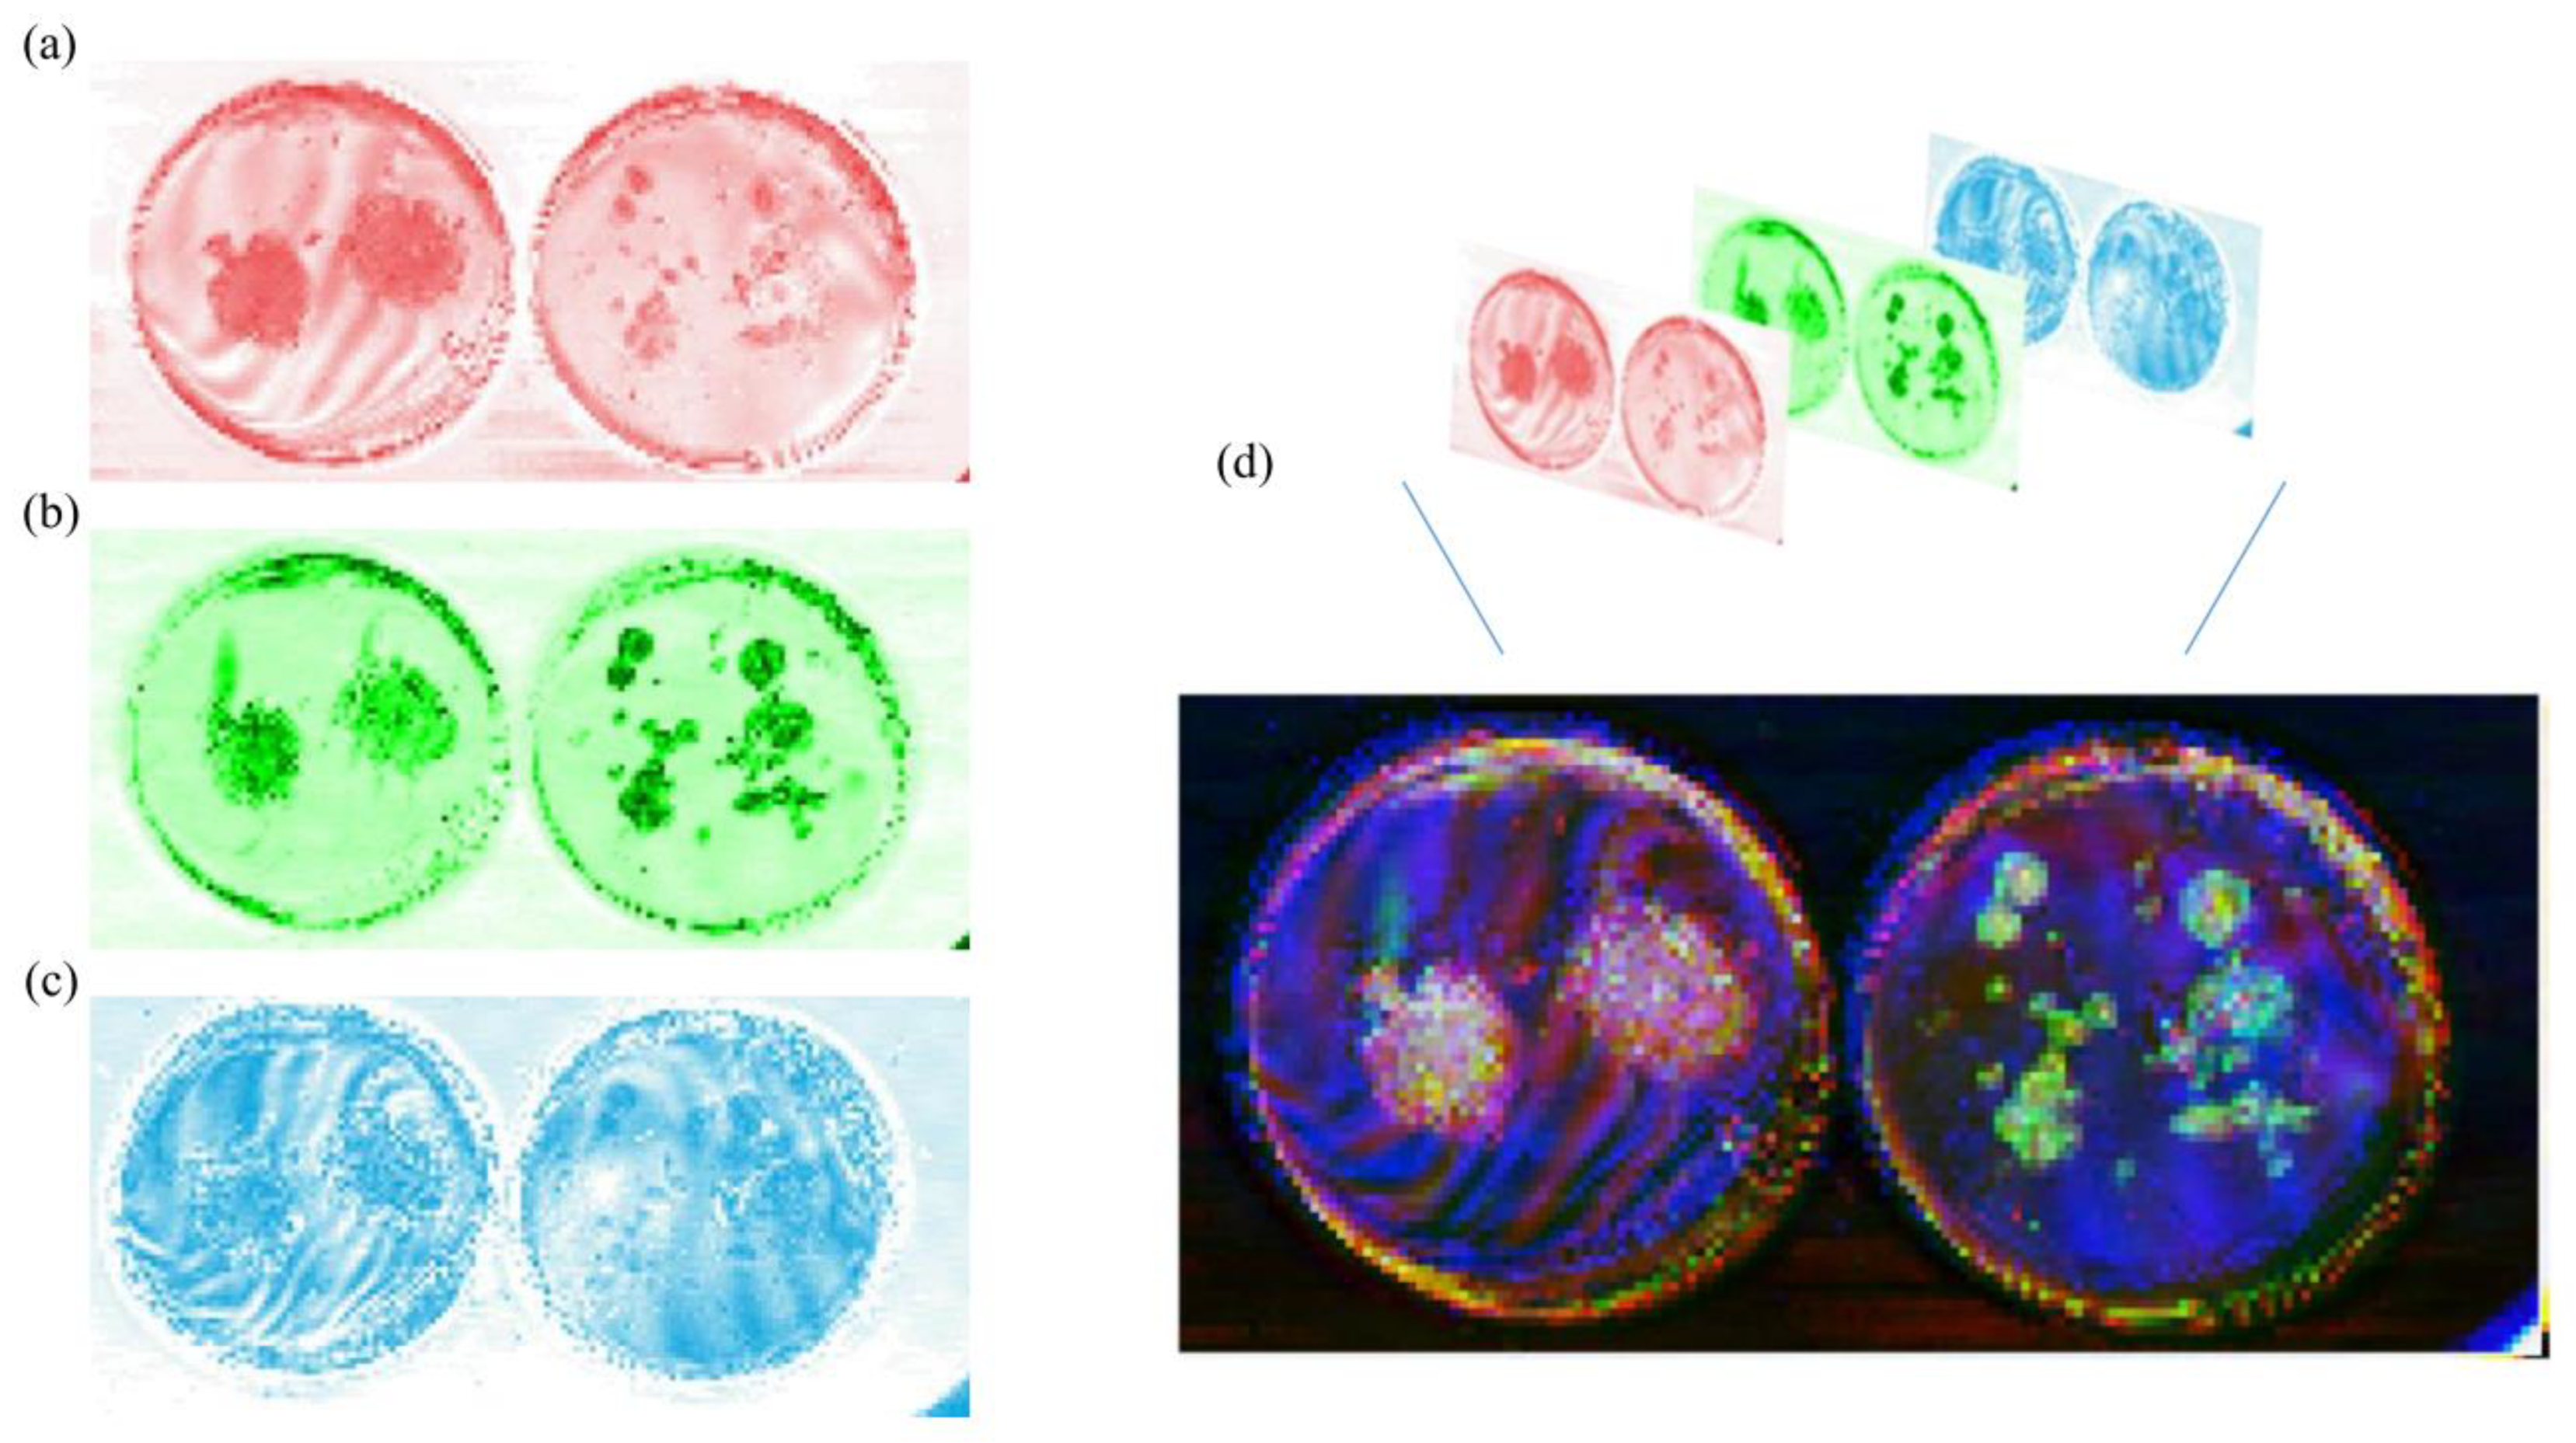
A tiny amount of glucose and copper oxalate powders were squeezed into tablets formed by pure polytetrafluoroethylene (PTFE) powder. The concealed objects of glucose and copper oxalate powders were prepared with random distributions, which are totally opaque in visual light. When preparing the sample, first take 300 mg of PTFE powder and press it to form a tablet, with a diameter of 13 mm by applying a pressure of 15 MPa for 10 min. Sprinkle 2 mg of pure glucose powder on this PTFE tablet which is pressed again for 10 min. The resulting sample is shown in Figure 3e. It is covered by another 300 mg of PTFE powder and pressed for another 10 min finally to form a PTFE tablet of a total weight of 602 mg with 2 mg glucose hidden inside. Optical photos taken from both sides of the tablet are shown in Figure 3a,b. The glucose inside can no longer be observed. Using the same method, a tablet for PTFE with 1 mg copper oxalate inside was prepared. It has a weight of 601 mg. Optical photos in the front, back and internal view are shown in Figure 3c,d,f.
The terahertz absorption spectra of the three powders used in the experiment measured by Fourier-transform infrared spectroscopy (VERTEX 80v, Bluker, Massachusetts, United States) are shown in the left panel of Figure 3g. PTFE has a weak absorption across the measured band, without any obvious characteristic absorption. Glucose has a similar transmission spectrum to that of PTFE, except for stronger absorption, especially in the lower frequency range. Compared with PTFE and glucose, the transmission spectrum of copper oxalate shows strong absorption around 3.4 THz. In order to simulate the transmission spectral intensity contrast of the tested substances, i.e., glucose and copper oxalate, in the sample tablets, the spectral intensities of these two substances relative to PTFE were calculated and are plotted in the right panel of Figure 3g. It can be recognized that these tested substances exhibit totally different absorption characteristics at three selected frequency points.

3. Results

The measured signals based on SM interferometry with three THz frequency points were used to present the absorption contrast wherever the focused THz beam scanned the sample. The scanning step of each dimension was 200 μm. For each QCL, imaging took about 20 min with 75 × 150 pixels. The SM signal obtained for each pixel was processed by fast Fourier transform to obtain its amplitude and phase. The amplitude images are shown in Figure 4a–c for lasing frequencies of 2.5 THz, 3.3 THz and 4.2 THz, respectively. In these images, the left panels depict the sample with glucose concealed, and the right ones present the sample with copper oxalate inside. Compared with the images taken at 4.2 THz, images of the hidden glucose and copper oxalate at 2.5 THz and 3.3 THz show much clearer spatial distributions, indicating relatively stronger absorption. The absorption contrast of glucose decreases as lasing frequency increases. For copper oxalate, it shows high-contrast imaging at 3.3 THz, with lower and lowest contrasts at 2.5 THz and 4.2 THz, respectively. This originates from its characteristic absorption around 3.4 THz. Furthermore, for the images at 2.5 THz and 4.2 THz, it can be observed that the absorption of glucose is stronger than that of copper oxalate. However, a converse situation occurs at 3.3 THz. All the absorption properties manifested in detail with variation in lasing frequency, and in differences at each lasing point are consistent with the sample absorption spectra shown in Figure 3g.
In Figure 4a,c, interference-like patterns can be observed in the pure PTFE area, which originates from the interference between the reflected light from the front and back surfaces of the tablet. The second OAP in the optical path focuses the light onto the back surface of the sample while also collecting the reflected light from the back surface and injecting it back into the laser. The front surface deviates from the focus; only a small amount of its reflected light is injected into the laser. However, the reflected light from the back surface will be absorbed by the sample. When it decays to the same level as the intensity of the light that is reflected by the front surface and injected into the laser, they will be injected back into the cavity after coherent superposition, and interference fringes will be generated as the tablet thickness changes [28]. Short wavelengths are more sensitive to thickness changes, so the interference fringes in Figure 4c are denser than those in Figure 4a. As can be seen from Figure 3g, the transmittance of PTFE at 3.3 THz is extremely high, so the fluctuations caused by the interference between the front and back surfaces are relatively small, so that no interference-like patterns can be observed in Figure 4b.
To acquire a multicolor spectral image, images measured at 2.5 THz, 3.3 THz and 4.2 THz are used to make a synthesis. Based on RGB mode, red, green and blue colors are assigned to the amplitude images acquired at 2.5 THz, 3.3 THz and 4.2 THz, respectively. The synthesized multicolor images for glucose and copper oxalate samples are shown in Figure 4d, and exhibit the distribution patterns of hidden substances in tablets, as well as identify them by color. Glucose has different absorption extents within the frequency range of measurement, with relatively stronger absorption at 2.5 THz. Thus, the red-colored area appears for obvious reasons, indicating the existence of glucose. Some white-colored pixels are shown inside the red area, which implies information of a relatively high glucose content exhibiting absorption characteristics across all frequency points. Obviously, the green-colored area indicates the existence of copper oxalate due to its characteristic absorption. The areas of pure PTFE remain blue due to its high-transmittance feature within the measurement frequency band.
As a coherent detection technology, the SM signals also provide a complex refractive index and thickness variation information on the tested objects by analyzing their phase values. The phase images are shown in Figure 5a–c for lasing frequencies of 2.5 THz, 3.3 THz and 4.2 THz, respectively. Here, the non-uniformity of the concealed substances’ thickness plays a dominant role in phase variation. The content of glucose is twice that of copper oxalate. From the perspective of THz inspection, it seems that between the foreign matters in the PTFE, the region of glucose is thicker than that of copper oxalate. This leads to an additional phase that can be captured by analyzing the phase variation in the SM signals. This corresponds to the pattern distribution of glucose being clearer than that of copper oxalate as shown in the phase images. However, this pattern property of phase images is not dependent on the lasing frequency. The change in the absorption coefficient of the sample will have a greater impact on the phase than the change in the topography of these samples.

4. Discussion

Detection limit is an important factor for a substance identification system. Here, the 1/e2 diameter of the beam spot at the focus point is about 200 μm, corresponding to a spot area of 0.03 mm2. According to Figure 3e,f, it can be calculated that the areas occupied by the glucose and copper oxalate powders are 25.67 mm2 and 15.45 mm2. Combined with their total mass, the average mass of each powder in a single beam spot is calculated to be 2.34 μg and 1.94 μg, with the concentration being about 1.69 wt% and 1.41 wt%, which means that this system has at least microgram-level substance detection capabilities.
In this paper, the frequency changes of hundreds of MHz for each THz-QCL are induced by modulating the current, which is used to quickly obtain the self-mixing interference signal. Since solid samples usually have a wide absorption spectrum [38], this small frequency shift has no effect on the measurement. For gas molecules with narrower absorption linewidths, self-mixing interference technology based on current modulation has been demonstrated to have the ability to obtain gas absorption spectra [29,30,31,32]. This paper uses an arbitrary function generator (DG1022Z, ROGIL, Suzhou, China) to provide a modulation signal for the current source (QCL2000, Wavelength Electronics, Bozeman, United States) used for driving the THz-QCLs. The resolution of the arbitrary function generator is 0.1 mV, which is converted into a current change of 0.04 mA by the current source. The frequency-current modulation coefficients of the three THz-QCLs are −6.2 MHz/mA, −5.1 MHz/mA and −14 MHz/mA, so the minimum frequency accuracy that can be reliably resolved by this system is 0.2 MHz.
THz multispectral detection can also be achieved by THz frequency combs [39]; however, there are great challenges in the design of active regions, material growth and preparation processes of frequency comb sources [40,41]. Only a few laboratories have the capacity to manufacture frequency comb sources in the terahertz band [42,43,44]. They also needs sophisticated optical systems and a high-performance detectors to extract information from each comb [13,45]. THz frequency combs can also be achieved by self-mixing, but complex spectral extraction and reconstruction techniques are also required [46]. In contrast, our self-mixing interferometric system only uses general THz-QCLs [37] with a simple optical system, which makes this technique more conducive to practical application.

5. Conclusions

Based on laser self-mixing interferometry technology, we used THz-QCLs to demonstrate a new multicolor imaging method in the THz band. This imaging method can simultaneously obtain the intensity and phase images of the target object. By combining several THz-QCLs with different lasing frequencies and taking advantage of the penetrability of terahertz waves and the high sensitivity of SM detection, it can achieve the spatial differentiation and material identification of trace foreign matter inside an object, which provides new ideas for the application of terahertz waves in material identification. It is expected to achieve SM interferometric hyperspectral imaging in the THz band by integrating several GaAs/AlGaAs-based THz-QCLs with different frequencies.

Author Contributions

Conceptualization, P.B., W.C. and Z.Z.; methodology, J.C., Y.X., P.B. and N.Y.; software, Z.Z. and Y.X.; validation, P.B., W.C. and Z.Z.; formal analysis, M.C., Y.W. and N.Y.; investigation, J.C., Y.X. and W.C.; QCLs manufacture, L.L., M.S. and E.H.L.; data curation, Y.X.; writing—original draft preparation, J.C. and Y.X.; writing—review and editing, P.B.; visualization, J.C. and Y.X.; supervision, P.B.; project administration, W.C.; funding acquisition, P.B. and Z.Z. All authors have read and agreed to the published version of the manuscript.

Funding

This research was funded by the National Natural Science Foundation of China (No. 62475019, 12104061 and 62327804) and the National Key R&D Program of China (No. 2023YFF0715000).

Institutional Review Board Statement

Not applicable.

Informed Consent Statement

Not applicable.

Data Availability Statement

The data presented in this study are available on request from the corresponding authors.

Conflicts of Interest

The authors declare no conflicts of interest.

Abbreviations

The following abbreviations are used in this manuscript:
SMSelf-mixing
THzTerahertz
QCLQuantum-cascade laser
DAQData acquisition
PCPersonal computer
OAPOff-axis parabolic reflector
PTFEPolytetrafluoroethylene

References

  1. Wen, P.; Amin, M.; Herzog, W.D.; Kunz, R.R. Key challenges and prospects for optical standoff trace detection of explosives. Trends Anal. Chem. 2018, 100, 136–144. [Google Scholar] [CrossRef]
  2. Li, J.S.; Yu, B.; Fischer, H.; Chen, W.; Yalin, A.P. Contributed Review: Quantum cascade laser based photoacoustic detection of explosives. Rev. Sci. Instrum. 2015, 86, 031501. [Google Scholar] [CrossRef] [PubMed]
  3. Fuchs, F.; Hugger, S.; Jarvis, J.; Yang, Q.K.; Ostendorf, R.; Schilling, C.; Bronner, W.; Driad, R.; Aidam, R.; Wagner, J. Imaging standoff trace detection of explosives using IR-laser based backscattering. Proc. SPIE 2016, 9836, 98362I. [Google Scholar]
  4. Ostendorf, R.; Butschek, L.; Hugger, S.; Fuchs, F.; Yang, Q.; Jarvis, J.; Schilling, C.; Rattunde, M.; Merten, A.; Grahmann, J.; et al. Recent Advances and Applications of External Cavity-QCLs towards Hyperspectral Imaging for Standoff Detection and Real-Time Spectroscopic Sensing of Chemicals. Photonics 2016, 3, 28. [Google Scholar] [CrossRef]
  5. Hugger, S.; Fuchsa, F.; Jarvisa, J.; Yanga, Q.K.; Rattundea, M.; Ostendorfa, R.; Schillinga, C.; Draida, R.; Bronnera, W.; Aidama, R.; et al. Quantum Cascade Laser based active hyperspectral imaging for standoff detection of chemicals on surfaces. Proc. SPIE 2018, 9755, 97550A. [Google Scholar]
  6. Kageyama, H.; Hayashi, K.; Maeda, K.; Attfield, J.P.; Hiroi, Z.; Rondinelli, J.M.; Poeppelmeier, K.R. Expanding frontiers in materials chemistry and physics with multiple anions. Nat. Commun. 2018, 9, 772. [Google Scholar]
  7. Weiskopf, N.; Edwards, L.J.; Helms, G.; Mohammadi, S.; Kirilina, E. Quantitative magnetic resonance imaging of brain anatomy and in vivo histology. Nat. Rev. Phys. 2021, 3, 570–588. [Google Scholar] [CrossRef]
  8. Sun, D.-W.; Pu, H.; Yu, J. Applications of hyperspectral imaging technology in the food industry. Nat. Rev. Electr. Eng. 2024, 1, 251–263. [Google Scholar] [CrossRef]
  9. Redo-Sanchez, A.; Heshmat, B.; Aghasi, A.; Naqvi, S.; Zhang, M.; Romberg, J.; Raskar, R. Terahertz time-gated spectral imaging for content extraction through layered structures. Nat. Commun. 2015, 7, 12665. [Google Scholar] [CrossRef]
  10. Stantchev, R.I.; Sun, B.; Hornett, S.M.; Hobson, P.A.; Gibson, G.M.; Padgett, M.J.; Hendry, E. Noninvasive, near-field terahertz imaging of hidden objects using a single-pixel detector. Sci. Adv. 2016, 2, e1600190. [Google Scholar] [CrossRef] [PubMed]
  11. Lukose, J.; Chidangil, S.; George, S.D. Optical technologies for the detection of viruses like COVID-19: Progress and prospects. Biosens. Bioelectron. 2021, 178, 113004. [Google Scholar] [CrossRef]
  12. Yin, X.-X.; Baghai-Wadji, A.; Zhang, Y. A Biomedical Perspective in Terahertz Nano-Communications—A Review. IEEE Sens. J. 2022, 22, 9215–9227. [Google Scholar] [CrossRef]
  13. Lukasz, A.S.; Jonas, W.; Yang, Y.; David, B.; John, R.; Qing, H.; Gerard, W. Terahertz hyperspectral imaging with dual chip-scale combs. Optica 2019, 6, 766–771. [Google Scholar]
  14. Seo, M.; Park, H.R. Terahertz Biochemical Molecule-Specific Sensors. Adv. Opt. Mater. 2020, 8, 1900662. [Google Scholar] [CrossRef]
  15. Yan, D.; Cui, J.; Li, X.; Zhang, L.; Li, J.; Lu, W. Enhancement of wide-band trace terahertz absorption spectroscopy based on microstructures: A review. Phys. Chem. Chem. Phys. 2023, 25, 31542–31553. [Google Scholar] [CrossRef] [PubMed]
  16. Sultana, J.; Islam, M.S.; Ahmed, K.; Dinovitser, A.; Ng, B.W.-H.; Abbott, D. Terahertz detection of alcohol using a photonic crystal fiber sensor. Appl. Opt. 2018, 57, 2426–2433. [Google Scholar] [CrossRef]
  17. Liang, L.; Hu, X.; Wen, L.; Zhu, Y.; Yang, X.; Zhou, J.; Zhang, Y.; Carranza, I.E.; Grant, J.; Jiang, C.; et al. Unity Integration of Grating Slot Waveguide and Microfluid for Terahertz Sensing. Laser Photonics Rev. 2018, 12, 1800078. [Google Scholar] [CrossRef]
  18. Zhou, Z.; Zhou, T.; Zhang, S.; Shi, Z.; Chen, Y.; Wan, W.; Li, X.; Chen, X.; Corder, S.N.G.; Fu, Z.; et al. Multicolor T-Ray Imaging Using Multispectral Metamaterials. Adv. Sci. 2018, 5, 1700982. [Google Scholar] [CrossRef] [PubMed]
  19. Chen, M.; Wang, Y.; Zhao, Z. Monolithic Metamaterial-Integrated Graphene Terahertz Photodetector with Wavelength and Polarization Selectivity. ACS Nano 2022, 16, 17263–17273. [Google Scholar] [CrossRef]
  20. Huang, W.; Li, C.; Fang, B.; Xu, J.; Liu, F.; Xu, L.; Tang, Y.; Hong, Z.; Jing, X. Research progress of terahertz wave dynamic control of digital coded metasurfaces. Opt. Lasers Eng. 2024, 174, 107977. [Google Scholar] [CrossRef]
  21. Wang, W.; Sun, K.; Xue, Y.; Lin, J.; Fang, J.; Shi, S.; Zhang, S.; Shi, Y. A review of terahertz metamaterial sensors and their applications. Opt. Commun. 2024, 556, 130266. [Google Scholar] [CrossRef]
  22. Giuliani, G.; Norgia, M.; Donati, S.; Bosch, T. Laser diode self-mixing technique for sensing applications. J. Opt. A Pure Appl. Opt. 2002, 4, S283–S294. [Google Scholar] [CrossRef]
  23. Taimre, T.; Nikolić, M.; Bertling, K.; Lim, Y.L.; Bosch, T.; Rakić, A.D. Laser feedback interferometry: A tutorial on the self-mixing effect for coherent sensing. Adv. Opt. Photonics 2015, 7, 570–631. [Google Scholar] [CrossRef]
  24. Keeley, J.; Bertling, K.; Rubino, P.L.; Lim, Y.L.; Taimre, T.; Qi, X.; Kundu, I.; Li, L.H.; Indjin, D.; Rakić, A.D.; et al. Detection sensitivity of laser feedback interferometry using a terahertz quantum cascade laser. Opt. Lett. 2019, 44, 3314–3317. [Google Scholar] [CrossRef]
  25. Rakić, A.D.; Taimre, T.; Bertling, K.; Lim, Y.L.; Dean, P.; Indjin, D.; Ikonić, Z.; Harrison, P.; Valavanis, A.; Khanna, S.P.; et al. Swept-frequency feedback interferometry using terahertz frequency QCLs: A method for imaging and materials analysis. Opt. Express 2013, 21, 22194–22205. [Google Scholar] [CrossRef]
  26. Mezzapesa, F.P.; Petruzzella, M.; Dabbicco, M.; Beere, H.E.; Ritchie, D.A.; Vitiello, M.S.; Scamarcio, G. Continuous-wave reflection imaging using optical feedback interferometry in terahertz and mid-infrared quantum cascade lasers. IEEE T. THz Sci. Technol. 2014, 4, 631–633. [Google Scholar] [CrossRef]
  27. Keeley, J.; Dean, P.; Valavanis, A.; Bertling, K.; Lim, Y.L.; Alhathlool, R.; Taimre, T.; Li, L.H.; Indjin, D.; Rakić, A.D.; et al. Three-dimensional terahertz imaging using swept-frequency feedback interferometry with a quantum cascade laser. Opt. Lett. 2015, 40, 994–997. [Google Scholar] [CrossRef]
  28. Xie, Y.; Wang, Y.; Li, L.H.; Li, Y.; Salih, M.; Sun, J.-L.; Linfield, E.H.; Yang, N.; Chu, W.; Zhao, Z. Realization of high depth resolution using two-beam self-mixing. Opt. Commun. 2023, 545, 129737. [Google Scholar] [CrossRef]
  29. Hagelschuer, T.; Wienold, M.; Richter, H.; Schrottke, L.; Biermann, K.; Grahn, H.T.; Hübers, H.-W. Terahertz gas spectroscopy through self-mixing in a quantum-cascade laser. Appl. Phys. Lett. 2016, 109, 191101. [Google Scholar] [CrossRef]
  30. Hagelschuer, T.; Wienold, M.; Richter, H.; Schrottke, L.; Grahn, H.T.; Hübers, H.-W. Real-time gas sensing based on optical feedback in a terahertz quantum-cascade laser. Opt. Express 2017, 25, 30203–30213. [Google Scholar] [CrossRef]
  31. Chhantyal-Pun, R.; Valavanis, A.; Keeley, J.T.; Rubino, P.; Kundu, I.; Han, Y.; Dean, P.; Li, L.H.; Davies, A.G.; Linfield, E.H. Gas spectroscopy with integrated frequency monitoring through self-mixing in a terahertz quantum-cascade laser. Opt. Lett. 2018, 43, 2225–2228. [Google Scholar] [CrossRef] [PubMed]
  32. Han, Y.J.; Partington, J.; Chhantyal-Pun, R.; Henry, M.; Auriacombe, O.; Rawlings, T.; Li, L.H.; Keeley, J.; Oldfield, M.; Brewster, N.; et al. Gas spectroscopy through multimode self-mixing in a double-metal terahertz quantum cascade laser. Opt. Lett. 2018, 43, 5933–5936. [Google Scholar] [CrossRef] [PubMed]
  33. James, T.K. Self-Mixing in Terahertz Quantum Cascade Lasers. Ph.D. Thesis, University of Leeds, Leeds, UK, 2016. [Google Scholar]
  34. Rubino, P. Near-Field Imaging Using Self Mixing in Terahertz Frequency Quantum Cascade Lasers. Doctoral Dissertation, University of Leeds, Leeds, UK, 2019. [Google Scholar]
  35. Donati, S. Developing self-mixing interferometry for instrumentation and measurements. Laser Photonics Rev. 2012, 6, 393–417. [Google Scholar] [CrossRef]
  36. Bertling, K.; Taimre, T.; Agnew, G.; Lim, Y.L.; Dean, P.; Indjin, D.; Höfling, S.; Weih, R.; Kamp, M.; Edlinger, M.; et al. Simple electrical modulation scheme for laser feedback imaging. IEEE Sens. J. 2015, 16, 1937–1942. [Google Scholar] [CrossRef]
  37. Wienold, M.; Schrottke, L.; Giehler, M.; Hey, R.; Anders, W.; Grahn, H.T. Low-voltage terahertz quantum-cascade lasers based on LO-phonon-assisted interminiband transitions. Electron. Lett. 2009, 45, 1030–1031. [Google Scholar] [CrossRef]
  38. Demtröder, W.; Demtröder, W. Laser Spectroscopy 1: Basic Principles, 5th ed.; Springer: Berlin, German, 2014; pp. 106–110. [Google Scholar]
  39. Picqué, N.; Hänsch, T.W. Frequency comb spectroscopy. Nat. Photonics 2019, 13, 146–157. [Google Scholar] [CrossRef]
  40. Fujita, K.; Jung, S.; Jiang, Y.; Kim, J.H.; Nakanishi, A.; Ito, A.; Hitaka, M.; Edamura, T.; Belkin, M.A. Recent progress in terahertz difference-frequency quantum cascade laser sources. Nanophotonics 2018, 7, 1795–1817. [Google Scholar] [CrossRef]
  41. Zhou, K.; Li, H.; Wan, W.J.; Li, Z.P.; Liao, X.Y.; Cao, J.C. Ridge width effect on comb operation in terahertz quantum cascade lasers. Appl. Phys. Lett. 2019, 114, 191106. [Google Scholar] [CrossRef]
  42. Burghoff, D.; Kao, T.Y.; Han, N.; Chan, C.W.I.; Cai, X.; Yang, Y.; Hayton, D.J.; Gao, J.R.; Reno, J.L.; Hu, Q. Terahertz laser frequency combs. Nat. Photonics 2014, 8, 462–467. [Google Scholar] [CrossRef]
  43. Rösch, M.; Beck, M.; Süess, M.J.; Bachmann, D.; Unterrainer, K.; Faist, J.; Scalari, G. Heterogeneous terahertz quantum cascade lasers exceeding 1.9 THz spectral bandwidth and featuring dual comb operation. Nanophotonics 2018, 7, 237–242. [Google Scholar] [CrossRef]
  44. Liao, X.; Li, Z.; Zhou, K.; Guan, W.; Zhao, Y.; Wang, C.; Wan, W.; Sijia, Y.; Zhenzhen, Z.; Chang, W.; et al. Broadband Terahertz Quantum Cascade Laser Dual-Comb Sources under Off-Resonant Microwave Injection. Adv. Photonics Res. 2022, 3, 2100361. [Google Scholar] [CrossRef]
  45. Rösch, M.; Scalari, G.; Villares, G.; Bosco, L.; Beck, M.; Faist, J. On-chip, self-detected terahertz dual-comb source. Appl. Phys. Lett. 2016, 108, 171104. [Google Scholar] [CrossRef]
  46. Pistore, V.; Pogna, E.A.A.; Viti, L.; Li, L.; Davies, A.G.; Linfield, E.H.; Vitiello, M.S. Self-induced phase locking of terahertz frequency combs in a phase-sensitive hyperspectral near-field nanoscope. Adv. Sci. 2022, 9, 2200410. [Google Scholar] [CrossRef]
Figure 1. SM interference principle and optical path diagram. (a) SM interference three-mirror model; (b) SM interference detection diagram. DAQ: data acquisition, PC: personal computer, OAP: off-axis parabolic reflector; (c) experimental device photo.
Photonics 12 00109 g001
Figure 2. The operating performances of the three THz-QCLs used in this paper. (a) The curves of the SM voltage signal changing with the driving current; (b) the voltage variation in THz-QCLs (3.3 THz) in free running and with optical feedback when loading sawtooth modulation; (c) SM voltage signals under sawtooth modulation; (d) the lasing spectra of the THz-QCLs.
Photonics 12 00109 g002
Figure 3. The preparation and characteristics of the samples. (a,b) A front and back optical photograph of a PTFE tablet containing glucose; (c,d) a front and back optical photograph of a PTFE tablet containing copper oxalate; (e) an optical photograph of glucose inside the tablet; (f) an optical photograph of copper oxalate inside the tablet; (g) the transmission spectra of PTFE, glucose and copper oxalate and the relative transmittance of the two powders compared to PTFE.
Photonics 12 00109 g003
Figure 4. The results of scanning the sample using THz-QCLs with three frequencies: (a) 2.5 THz; (b) 3.3 THz; (c) 4.2 THz; (d) a synthesized multicolor image.
Photonics 12 00109 g004
Figure 5. Phase images obtained by scanning the sample using THz-QCLs at three frequencies: (a) 2.5 THz; (b) 3.3 THz; (c) 4.2 THz.
Photonics 12 00109 g005
Disclaimer/Publisher’s Note: The statements, opinions and data contained in all publications are solely those of the individual author(s) and contributor(s) and not of MDPI and/or the editor(s). MDPI and/or the editor(s) disclaim responsibility for any injury to people or property resulting from any ideas, methods, instructions or products referred to in the content.

