Article

A Pre-Measurement Device for Contour Measurement Path Planning of Complex Small Workpieces

State Key Laboratory of Precision Measuring Technology & Instruments, Laboratory of MicroNano Manufacturing Technology, Tianjin University, Tianjin 300072, China
*
Author to whom correspondence should be addressed.
Photonics 2025, 12(11), 1140; https://doi.org/10.3390/photonics12111140
Submission received: 24 October 2025 / Revised: 12 November 2025 / Accepted: 15 November 2025 / Published: 18 November 2025

Abstract

Small overall dimensions, intricate geometries, and discontinuous local surface normals characterize complex small workpieces. These features impose stringent requirements on the alignment accuracy of the workpieces when using a profilometer for three-dimensional surface measurement. This paper presents a pre-measurement method based on a reverse projection algorithm. By capturing shadow contours from multiple viewing angles, the three-dimensional pointcloud of the workpiece can be reconstructed. The reconstructed pointcloud is then used to analyze the workpiece pose and guide the path planning of a point-scanning profilometer. Experimental results show that, for a standard sphere with a radius of 12,703 mm, the measured results of the proposed measurement device achieve a fitted radius deviation of 1.8 μm when measuring 70% of the area of the spherical surface. This accuracy meets the precision requirement for guiding the path planning of the profilometer. Furthermore, the measured results from the device are employed to correct the scanning path of a five-axis profilometer for complex workpieces, such as cross-cylinder workpieces, without the need for manual pose adjustment or high-precision fixtures.

1. Introduction

Complex small workpieces (CSWs) refer to a category of workpieces with an overall size typically in the millimeter or centimeter range. Their surfaces usually feature characteristics such as large-curvature profiles, narrow regions, complex structures, and abrupt curvature changes. CSWs have been widely applied in fields including aerospace, biomedicine, electronic information, intelligent manufacturing, and advanced industry [1]. The complete profile and quality of such workpieces often affect their application performance and service life, so the measurement of CSWs is of great significance to their processing quality and application effect [2]. Full-profile measurement means that three-dimensional (3D) measurement needs to be performed on the upper surface and each side surface of the workpiece, and the final result is a truly meaningful 3D pointcloud. Common CSWs include cross cylinders, micro-triangular pyramids, and diamond cutting tools [3,4]. The complex-structural regions on the surface of such workpieces are the difficulties in measurement, which are prone to problems such as measurement blind areas and exceeding the allowable angular ranges of sensors. Therefore, limited by the complex structural characteristics, full-profile measurement has long been a difficult problem in the field of measurement.
The measurement challenges posed by CSWs impose higher requirements on the measurement system, demanding features such as high flexibility, multiple degrees of freedom, and high precision. Since any sensor has a limited measurement range and accuracy, full-profile measurement requires systems with high degrees of freedom [5]. Multi-axis contact-based systems, such as coordinate measuring machines (CMMs), offer high flexibility; however, contact methods risk scratching the workpiece surface, and the finite size of the probe often leads to spatial interference [6,7]. Optical measurement techniques, by contrast, offer the advantage of being non-destructive, and typical profilometers integrate optical sensors with motion stages. However, the optical sensor’s performance is strongly constrained by the angle between its optical axis and the local surface normal of the measured workpiece, which affects both the received signal intensity and the signal-to-noise ratio [8]. Traditional optical measurement systems—such as machine vision, structured light, and interferometric profilometers—can capture surface or line height data over relatively large areas in a single measurement [9]. Nevertheless, when dealing with complex geometries or surfaces with large curvature, these systems often suffer from occlusion and degraded reconstruction accuracy. Park et al. proposed a feature-based coarse registration technique to establish coordinate transformations among images acquired from different frames and viewing angles, enabling multi-view point cloud registration [10]. However, these approaches still face limitations in accuracy and flexibility. In full-profile measurements, especially for components with intricate geometries, they require repeated angle adjustments and multi-image acquisitions followed by pointcloud stitching, leading to discontinuities and reduced measurement consistency [11]. Point-based interferometric and chromatic confocal (CC) sensors acquire height information from only a single point per measurement. When the sensor follows the surface normal during scanning, it can maintain high measurement accuracy and a high signal-to-noise ratio [12]. We previously integrated a point-type spectrally confocal sensor into an ultra-precision machining system for in situ measurement, achieving normal-tracking measurements of four freeform reflective mirrors distributed along the inner wall of a cylindrical cavity [13]. However, accurately correlating the scanning path with the actual position above each mirror remains a significant challenge. Therefore, the combination of a highly flexible point-measurement sensor and a multi-degree-of-freedom (MDOF) motion platform represents the optimal solution for full-profile measurement of CSWs. Sensofar developed an instrument named the Optical Profiler S neox Five Axis, which integrates both a CC sensor and a white-light interferometric sensor. This device is primarily designed for 3D profile measurement of cutting tools such as milling cutters [14]. However, it requires precise clamping of the tool on the objective stage to enable automated scanning, and the workpiece’s outer contour must be approximately cylindrical. Similarly, the StentCheck, a hybrid five-axis profilometer, is designed for measuring the profiles of stents with hollow or lattice-like structures [15]. This system combines a vision camera and a contact probe, utilizing a cradle-type structure to adjust the orientation of stents flexibly. Unfortunately, to improve measurement efficiency, the system mounts stents directly onto a supporting rod, imposing a fixed spatial constraint to ensure that both the camera and probe can capture valid measurement signals. While this configuration is highly effective for batch inspection of stents with similar geometries, it often leads to signal loss when measuring CSWs with significant variations in contour due to insufficient spatial adaptability.
In practical applications, MDOF point-scanning profilometers face a critical challenge: the pose of the measured workpiece is often unknown during path planning [16,17,18]. The workpiece is typically fixed to the measurement system using fixtures such as a three-jaw chuck, resulting in a certain deviation between its actual pose and the coordinate system or 3D model defined in the software. The influence of this misalignment on measurement accuracy primarily depends on the sensor’s measurement range and numerical aperture. The most straightforward approach is to perform preliminary scanning with the point sensor along multiple lines to estimate the workpiece’s pose. By analyzing locally measurable data, the system can infer the overall pose of the workpiece, allowing the motion stage to automatically adjust or generate a measurement path based on the current orientation. Instruments such as the Mahr MFU 200, Luphoscan, and Nanomefos adopt this strategy [19,20,21]. Although this approach requires no additional sensors, it is limited to surfaces with small sag heights and relatively simple geometries, such as spherical or aspherical surfaces. For CSWs, collisions between the probe and the workpiece can easily occur during the preliminary scanning process. Xiao et al. proposed an iterative measurement method for polyhedral freeform surface prisms, in which repeated scanning and registration between the measured data and theoretical model are performed to iteratively adjust the workpiece’s pose until the entire surface can be captured [22]. However, this process requires multiple iterations and becomes exponentially time-consuming as the surface complexity increases. Compared with such self-referenced pose estimation using the profilometer alone, the hybrid measurement approach—combining a low-accuracy but large-range sensor with the high-precision profilometer—offers greater efficiency. Lu et al. developed a hybrid measurement system integrating a CMM and a point laser sensor, where the contact probe guides the laser sensor’s scanning path [23]. While the multi-axis motion capability of this system satisfies the requirements for measuring freeform surfaces, it is not suitable for CSWs. Moreover, the inherently low efficiency of contact probes remains a significant limitation. Li et al. employed a fringe projection sensor to assist path planning for a line-structured light sensor, enabling measurements of objects such as artificial knee joint models [24]. Although this pre-measurement approach is efficient, it is only applicable to rough-surfaced components and is limited to the upper and near-upper side regions of the workpiece.
Aiming to rapidly measure the 3D profile and pose of CSWs for the path planning of the high-precision profilometer, this paper proposes a pre-measurement method. A measurement approach based on the reverse projection (RP) is developed to perform preliminary estimation of the workpiece’s pose. Then, a scanning path for the point sensor can be subsequently generated with the pre-measurement results. To enhance the accuracy of the pre-measurement process and ensure coordinate coupling between the two measurement subsystems, a series of calibration procedures is designed to determine the key geometric parameters of the system. Finally, an experiment setup is developed and validated by measuring a standard sphere, a cylinder, and a cross-cylinder—representative examples of CSWs. The measurement results verify the feasibility of the proposed approach and the effectiveness of the calibration strategy.

2. Measurement Scheme

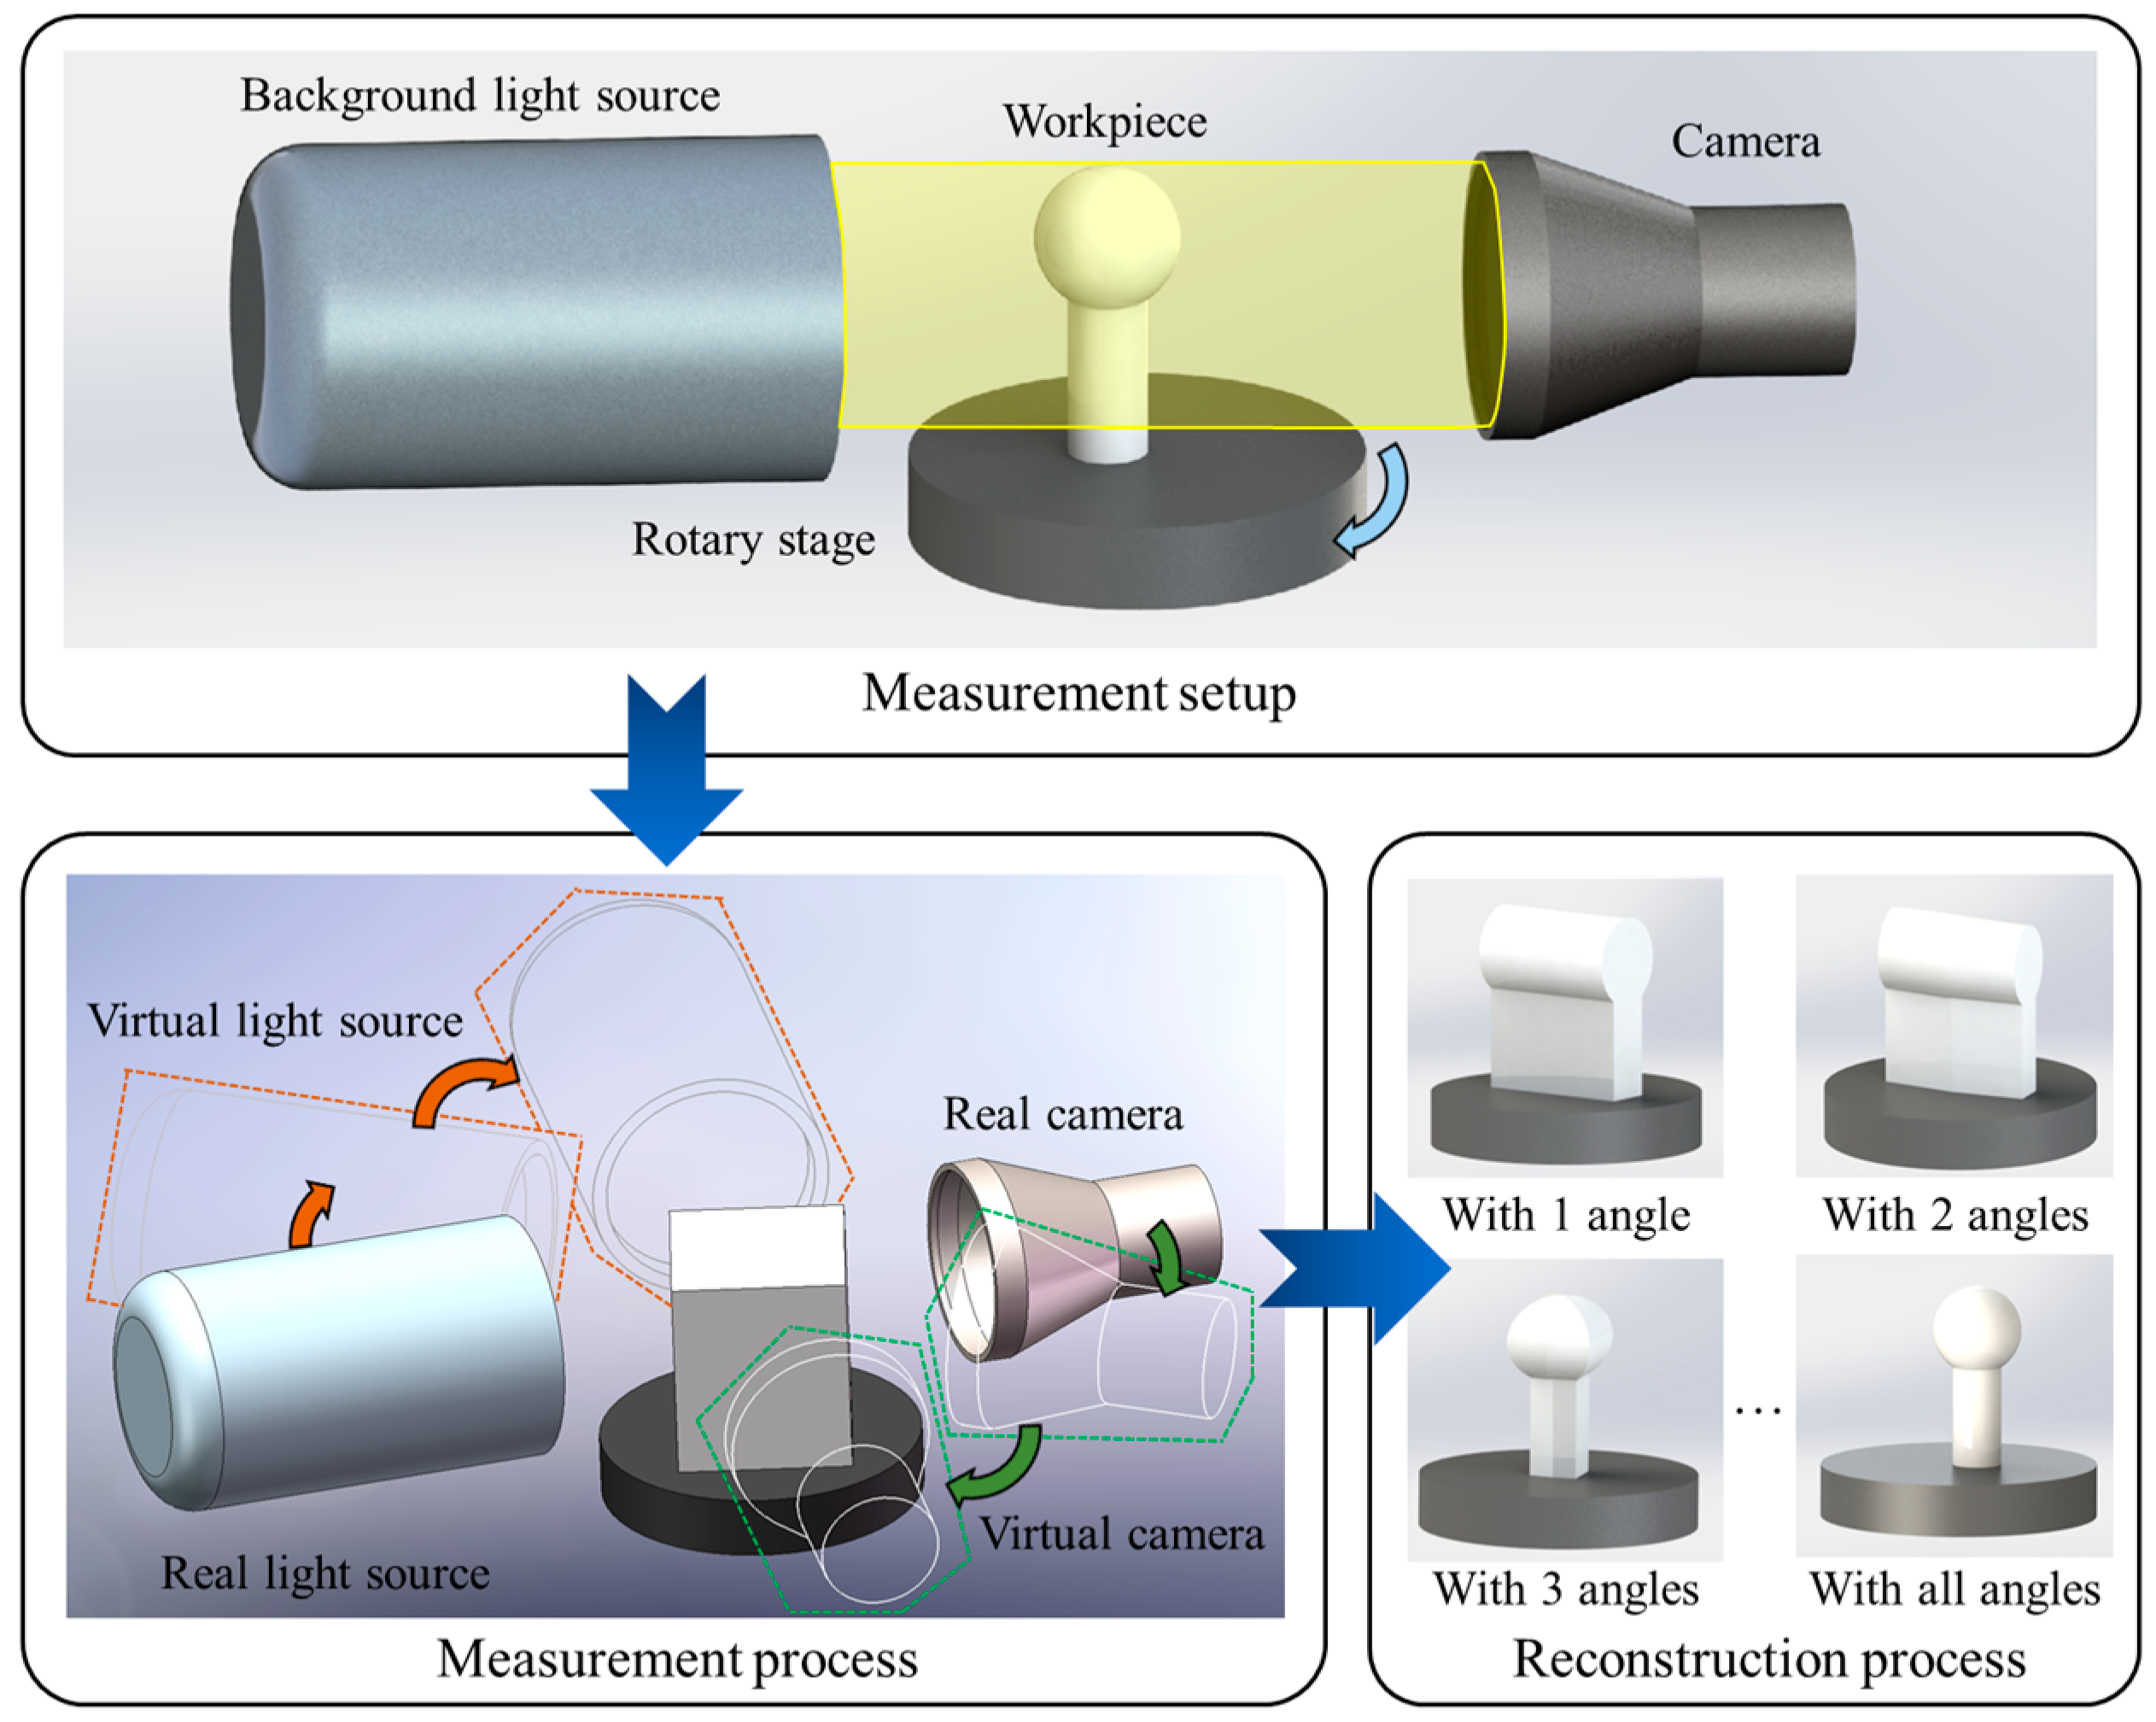
The structure and measurement process of the full-profile measurement system proposed in this paper are shown in Figure 1. This hybrid system mainly consists of an RP measurement device and a CC measurement system. The biggest challenge in measuring CSWs lies in their complex, narrow structures with abrupt curvature changes, which makes it difficult for traditional profilometers to achieve full-profile 3D measurement. These factors require the measurement system to have high precision, high degrees of freedom, and flexibility. To this end, as shown in Figure 1a, a multi-axis profilometer integrated with a CC point sensor is designed, which can meet these requirements. The motion axes adopt a five-axis system, including three linear axes (X, Y, Z) and two rotary axes (A, C). The two rotary axes form a gimbal structure, which can flexibly adjust the posture of the workpiece under test. Since the point-scanning profilometer requires a measurement path that matches the posture of the workpiece under test, an RP measurement device, as shown in Figure 1b, is proposed and integrated into the multi-axis profilometer. This measurement device is composed of a C-axis, a camera, and a background light source. The two measurement systems share the C-axis, achieving maximum hardware-level sharing and effectively saving space.
The measurement process for CSWs is shown in Figure 1c. First, the workpiece under test is subjected to pre-measurement using the RP device. Then, the measured point cloud is converted from the measurement coordinate system of the RP system to that of the CC system using a rotation-translation (RT) matrix. Finally, the measurement trajectory for the CC system is generated, and the actual measurement process can be performed.

3. Principle of the Pre-Measurement System

3.1. Measurement Process of the RP System

The RP measurement method calculates the 3D profile by capturing the two-dimensional (2D) shadow contours of the workpiece under test from various angles using a camera. As shown in Figure 2, the workpiece under test is placed on the rotary stage, positioned between the background light source and the camera. During measurement, the rotary stage drives the workpiece to rotate 360°, and the camera captures images at fixed angular intervals. Since the workpiece under test must always be within the projected contour lines at all angles, the 3D enclosing convex set of the workpiece can be approximately obtained by calculating the intersection of the projection spaces based on the shadow contours within the 360° range. A camera with an ordinary lens can be abstracted as a pinhole model, which has the issue of “near objects appearing larger and far objects smaller” when capturing the workpiece’s contours. To avoid the impact of the workpiece’s installation distance on the accuracy of 2D shadow contour extraction, the camera is equipped with a telecentric lens.
The measurement and 3D reconstruction process is shown in Figure 2. Initially, the workpiece under test is assumed to be a cuboid, and its length, width, and height are defined based on the size of the camera’s object-side field of view. In the measurement coordinate system, a dense cuboid point cloud Pini arranged at a specific interval is generated using these dimensions. Subsequently, a series of pixel matrices I(i)(u(i),v(i)) of the shadow contour is extracted from the images captured at each angle α(i) (where i is the image index, i = 1, 2, …, imax, and imax is the total number of captured images). Here, u(i) and v(i) represent the horizontal and vertical pixel indices of the shadow contour in the corresponding image, respectively. P(i) is a binary matrix composed of 0 and 1 at the i-th angle, indicating whether a pixel is a contour point (1 for the contour point, 0 for the non-contour point). Assuming the magnification of the telecentric lens is β, the corresponding contour matrix L(i)(lx(i),lz(i)) in the actual physical space can be obtained. Among them, lx(i) and lz(i) are the actual spatial coordinates, calculated as ly(i) = βu(i) and lz(i) = βv(i), respectively. Similar to P(i), L(i) is also a binary matrix with the same meaning.
Since the workpiece under test must be located within the intersection of the projection spaces, the intersection of these spaces is calculated to cut the pointcloud of the workpiece at each angle, retaining only the pointcloud Pre that lies within the space. The axis of the rotary stage is defined by the line connecting two points A1 and A2 on the axis. The specific pointcloud cutting process is as follows: first, rotate the initial pointcloud Pini around the line A 1 A 2 by an angle α(1) in 3D space to obtain the temporary pointcloud Ptem (xt,yt,zt); then, determine whether the coordinate (xt,zt) of each point in Ptem lies within the closed contour formed by L(i); retain only the points (xt,yt,zt) that are inside the contour to form Ptem. Repeat the above process for each angle α(2), α(3), …, α(imax); the final retained point cloud is Pfin. At this point, Pfin is the 3D volume pointcloud of the workpiece under test, meaning it contains not only the surface pointcloud of the workpiece but also the internal pointcloud. In this study, the α-shape algorithm [25] is used to extract the surface contour pointcloud, which facilitates the subsequent coordinate system coupling and calibration.
Since the retained 3D pointcloud satisfies the shadow contours observed from multiple angles, it can be approximately regarded as the convex hull of the actual surface of the workpiece. Compared with incremental reconstruction methods based on principles such as the inverse Radon transform, the proposed subtractive reconstruction approach—which removes points in the projection space according to shadow constraints—can effectively avoid the edge-averaging effect, provide more intuitive results, and prevent excessive convexity of the reconstructed shape. However, this pointcloud cutting method also presents specific challenges: the density of the initial cuboid pointcloud directly affects both the reconstruction accuracy and computational efficiency. A denser initial cloud improves accuracy but reduces efficiency, while a sparser one accelerates computation at the expense of precision. Therefore, enhancing reconstruction efficiency while maintaining accuracy represents a key technical challenge for the RP method.
To strike a balance between accuracy and efficiency, two optimization strategies are proposed in this study. First, instead of generating the initial cuboid pointcloud based on the entire field of view of the cameras, the cloud is constructed according to the maximum intersection boundaries in the X, Y, and Z directions of the parallel projection spaces. Specifically, for each L(i) matrix, the maximum coordinates lx(i) and lz(i) where the value equals 1 are determined, and the overall cuboid dimensions are then assigned according to the largest lx(i) and lz(i). This adaptive initialization enables a more targeted estimation of the workpiece’s actual size and position. Second, the above process yields what can be described as a solid pointcloud, which still contains internal points. In practice, however, only the surface points of the workpiece are needed to characterize its 3D profile, as surface geometry rather than internal structure is of interest in contour measurement. The density of internal points thus has little effect on the evaluation of the outer contour. To address this, the initial point cloud is designed with nonuniform spacing, where quadratic or cubic functions define point intervals along the X, Y, and Z axes. By adjusting the coefficients of these functions, the initial pointcloud can become sparser in some areas and denser in others. However, because the dimensions and shapes of the workpieces under test may be diverse and vary greatly, appropriately setting the non-uniform intervals of the initial cuboid pointcloud requires specific prior knowledge of the dimensions of the work-pieces. As shown in Figure 3a, for Workpiece 1, Workpiece 2, and Workpiece 3, their 2D contours will cut pointclouds at different positions, and the initial pointcloud is distributed at unequal intervals along the X axis, as shown in Figure 3b. Thus, there is no initial interval distribution that is the most suitable for all the workpieces. The characterization function of the pointcloud interval will also be adjusted accordingly based on the size of the workpiece under test, striving to minimize the pointcloud interval in the edge judgment area rather than increase it in the non-judgment area, to enhance computational efficiency. As shown in Figure 3c, its influence on evaluating the attitude of a workpiece is relatively small. The pose of the workpiece under test is the result of fitting, so the contour reconstruction errors in certain areas caused by misjudgment at several points will not affect the assessment of the entire pose.
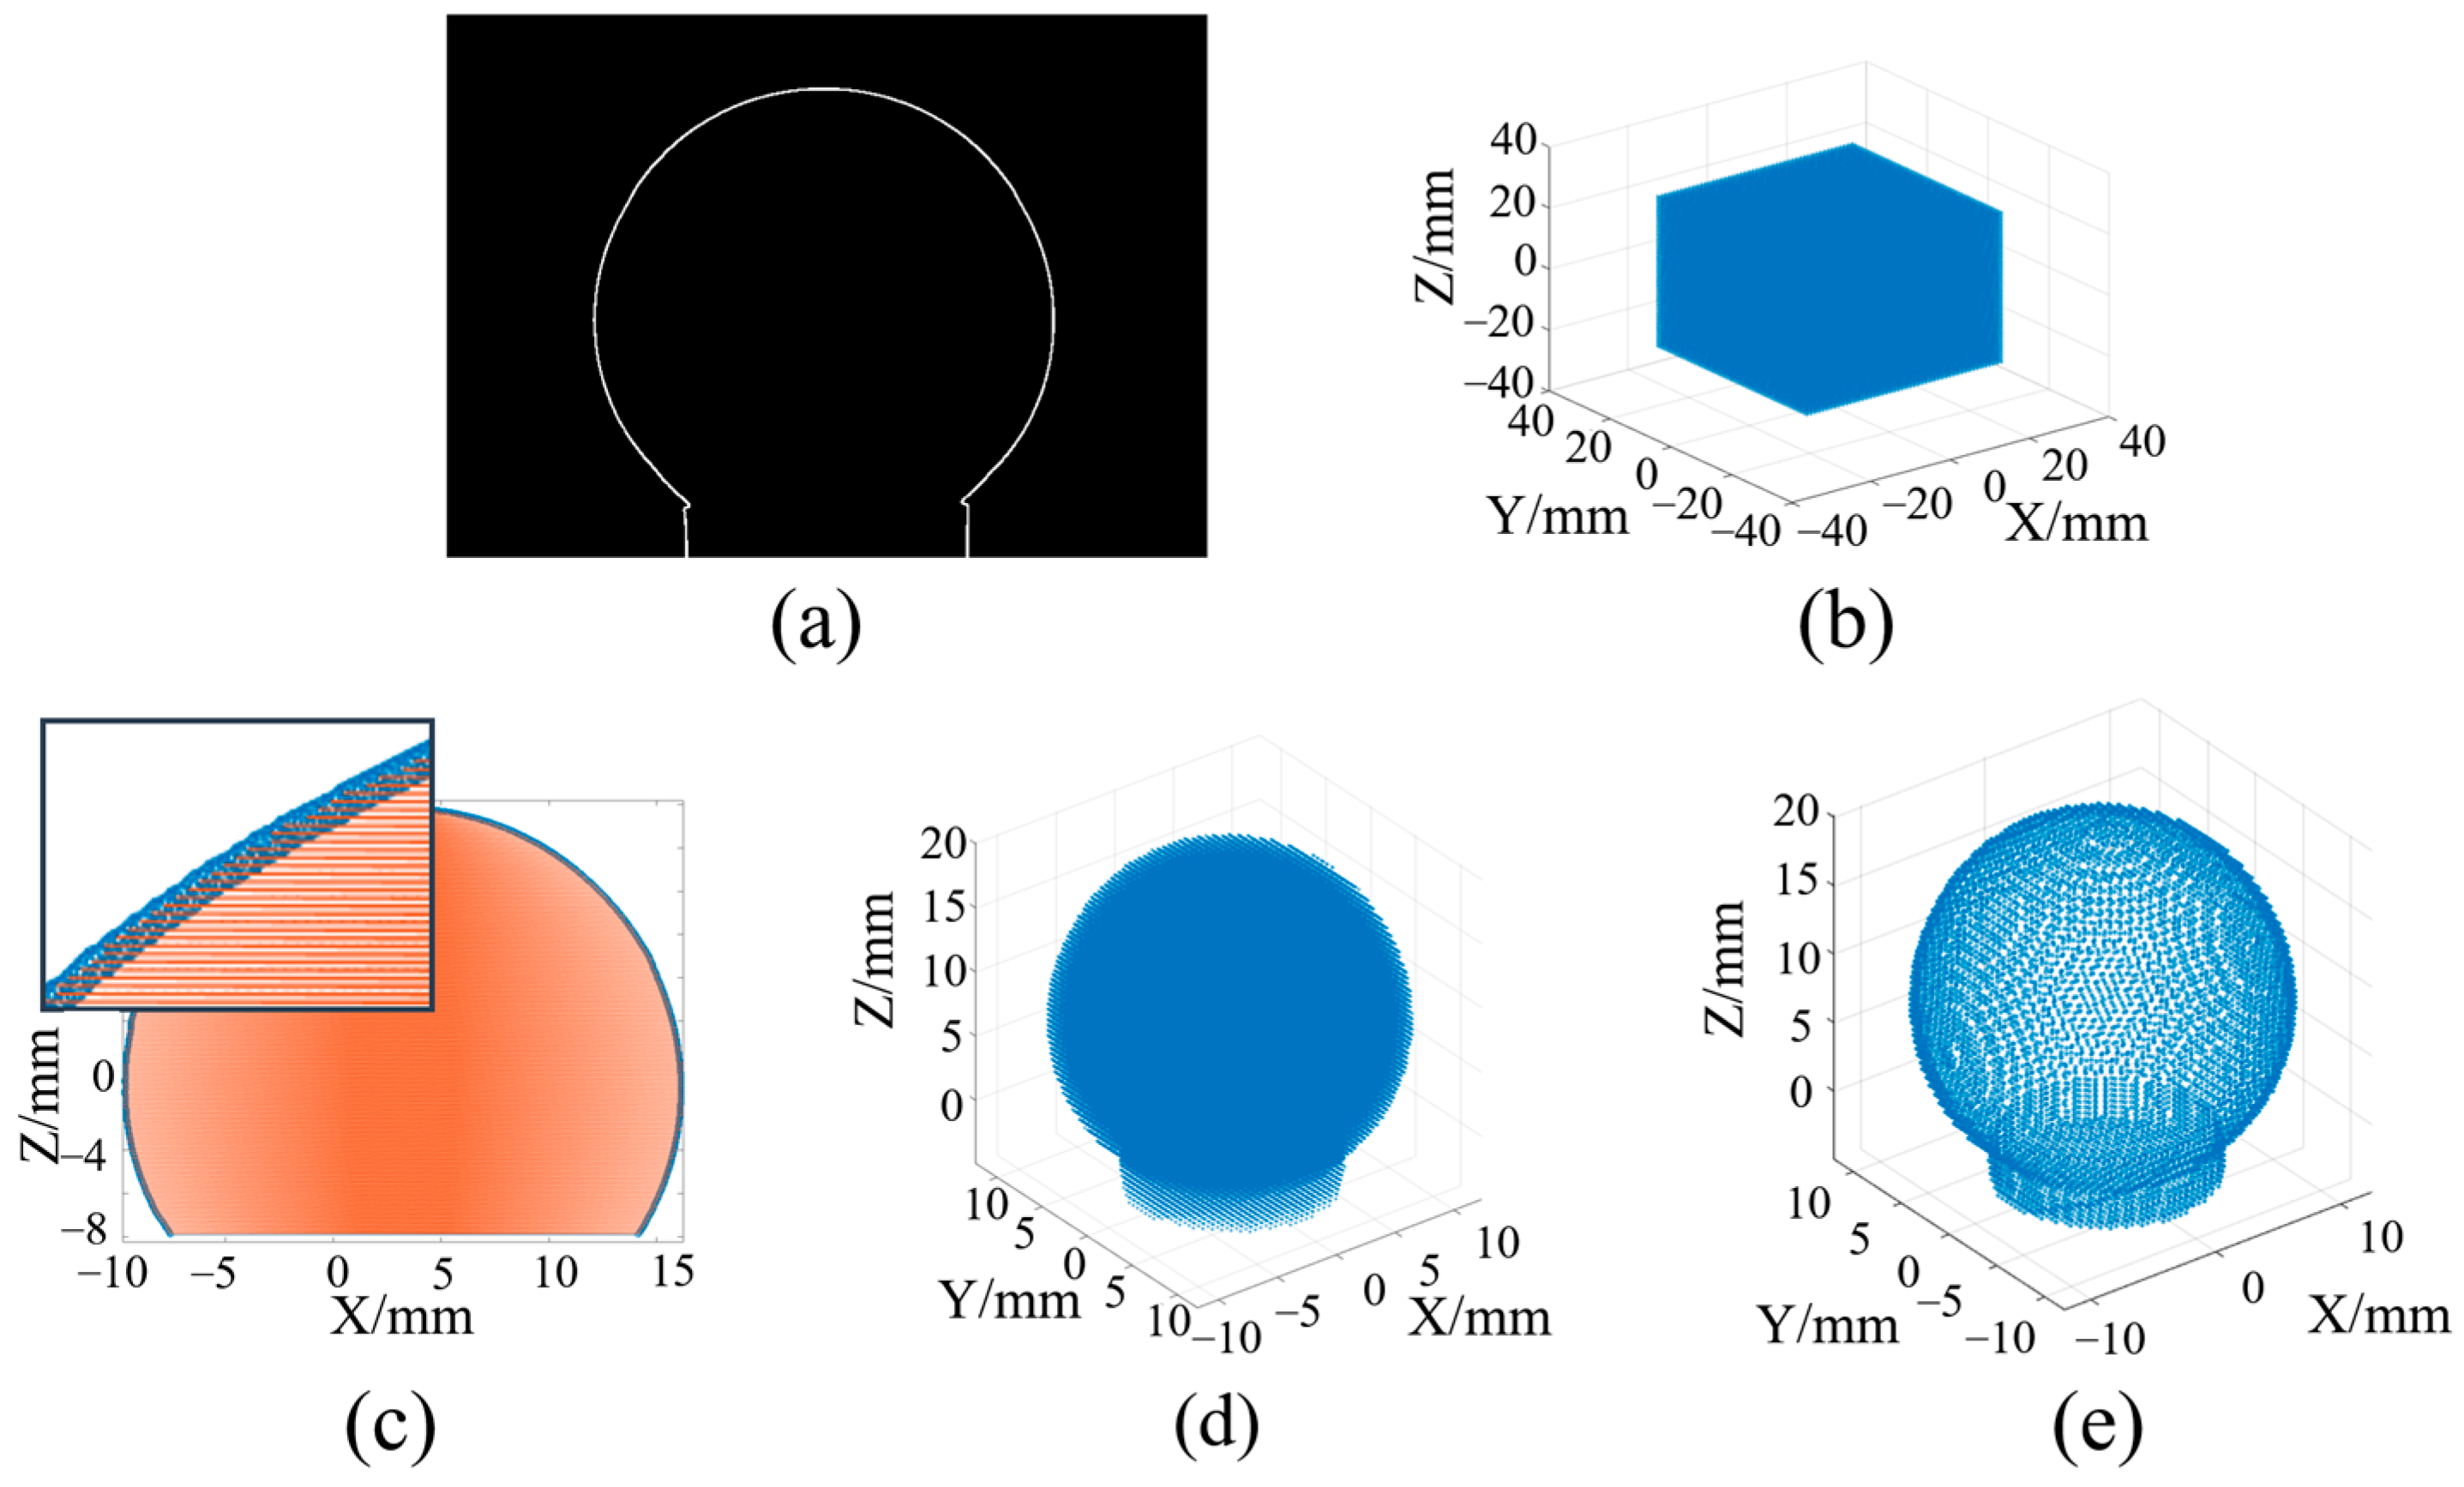
Figure 4 presents the simulation corresponding to the proposed reconstruction method. The workpiece under test is defined as a spherical rod. As shown in Figure 4a, based on the workpiece’s model, a series of simulated binarized images representing shadow contours is generated with an angular interval of 1°. As illustrated in Figure 4b, a cuboid pointcloud is first generated and then rotated to each projection angle, where it is segmented according to the corresponding shadow contour. An example of the pointcloud segmentation at a specific angle is shown in Figure 4c. After performing segmentation across all angles, the resulting pointcloud forms a solid spherical rod, while the extracted outer contour points yield the hollow spherical rod shown in Figure 4e.
Although the RP method, as a vision-based technique, cannot achieve exact 3D contour reconstruction, it remains effective for determining the initial pose of the workpiece under test. In addition, its high measurement efficiency makes it a suitable choice for pre-measurement or coarse localization.

3.2. Calibration of the RP System

The accuracy of the measurement system is guaranteed by the hardware’s inherent precision and the system’s calibration and compensation algorithms. Calibration is a crucial step to identify the actual values of the system’s geometric quantities and errors. At the same time, compensation is a process that decreases the impact of system errors (introduced during system structure assembly) on the final measurement results. In this pre-measurement system, since the pointcloud of the workpiece under test needs to be continuously rotated around the rotary stage’s axis in the measurement coordinate system during 3D reconstruction, the position and orientation errors of the axis exert a significant influence on the measurement results.
After the camera used is calibrated with a traditional distortion model, a standard sphere with a known radius is employed to calibrate the mapping magnification β between pixels and physical length. Finally, the position and orientation of the rotary stage axis in the measurement coordinate system of the RP system are calibrated.
The standard sphere is fixed on the rotary stage and rotated through 360°, with the camera capturing one image every 1°. The spherical contour in each image is extracted, and the center coordinates P c (i) (where i = 1, 2, …, 360) are obtained through fitting. Since the rotation of the standard sphere is around the rotary stage axis, the sphere center is rotationally symmetric about the axis. The axis is positioned by points A 1 and A 2 . According to Rodrigues’ rotation formula, a series of the theoretical sphere centers P c (i) (for i = 2, 3, …, 360) can be derived by rotating P c (1) as follows:
P c ( i ) = P c ( 1 ) cos ( i 1 ) + ( P c ( 1 ) A 1 A 2 ) A 1 A 2 1 cos ( i 1 ) + A 1 A 2 × P c ( 1 ) sin ( i 1 )
Here, A 1 A 2 represents the vector formed by points A 1 and A 2 . The optimization objective is to minimize the mean distance between the theoretical sphere centers and the corresponding measured coordinates at each rotation angle. Accordingly, the optimization model for calculating A 1 and A 2   is formulated as follows:
[ A 1 , A 2 ] = arg min i = 2 360 P c ( i ) P c ( i )
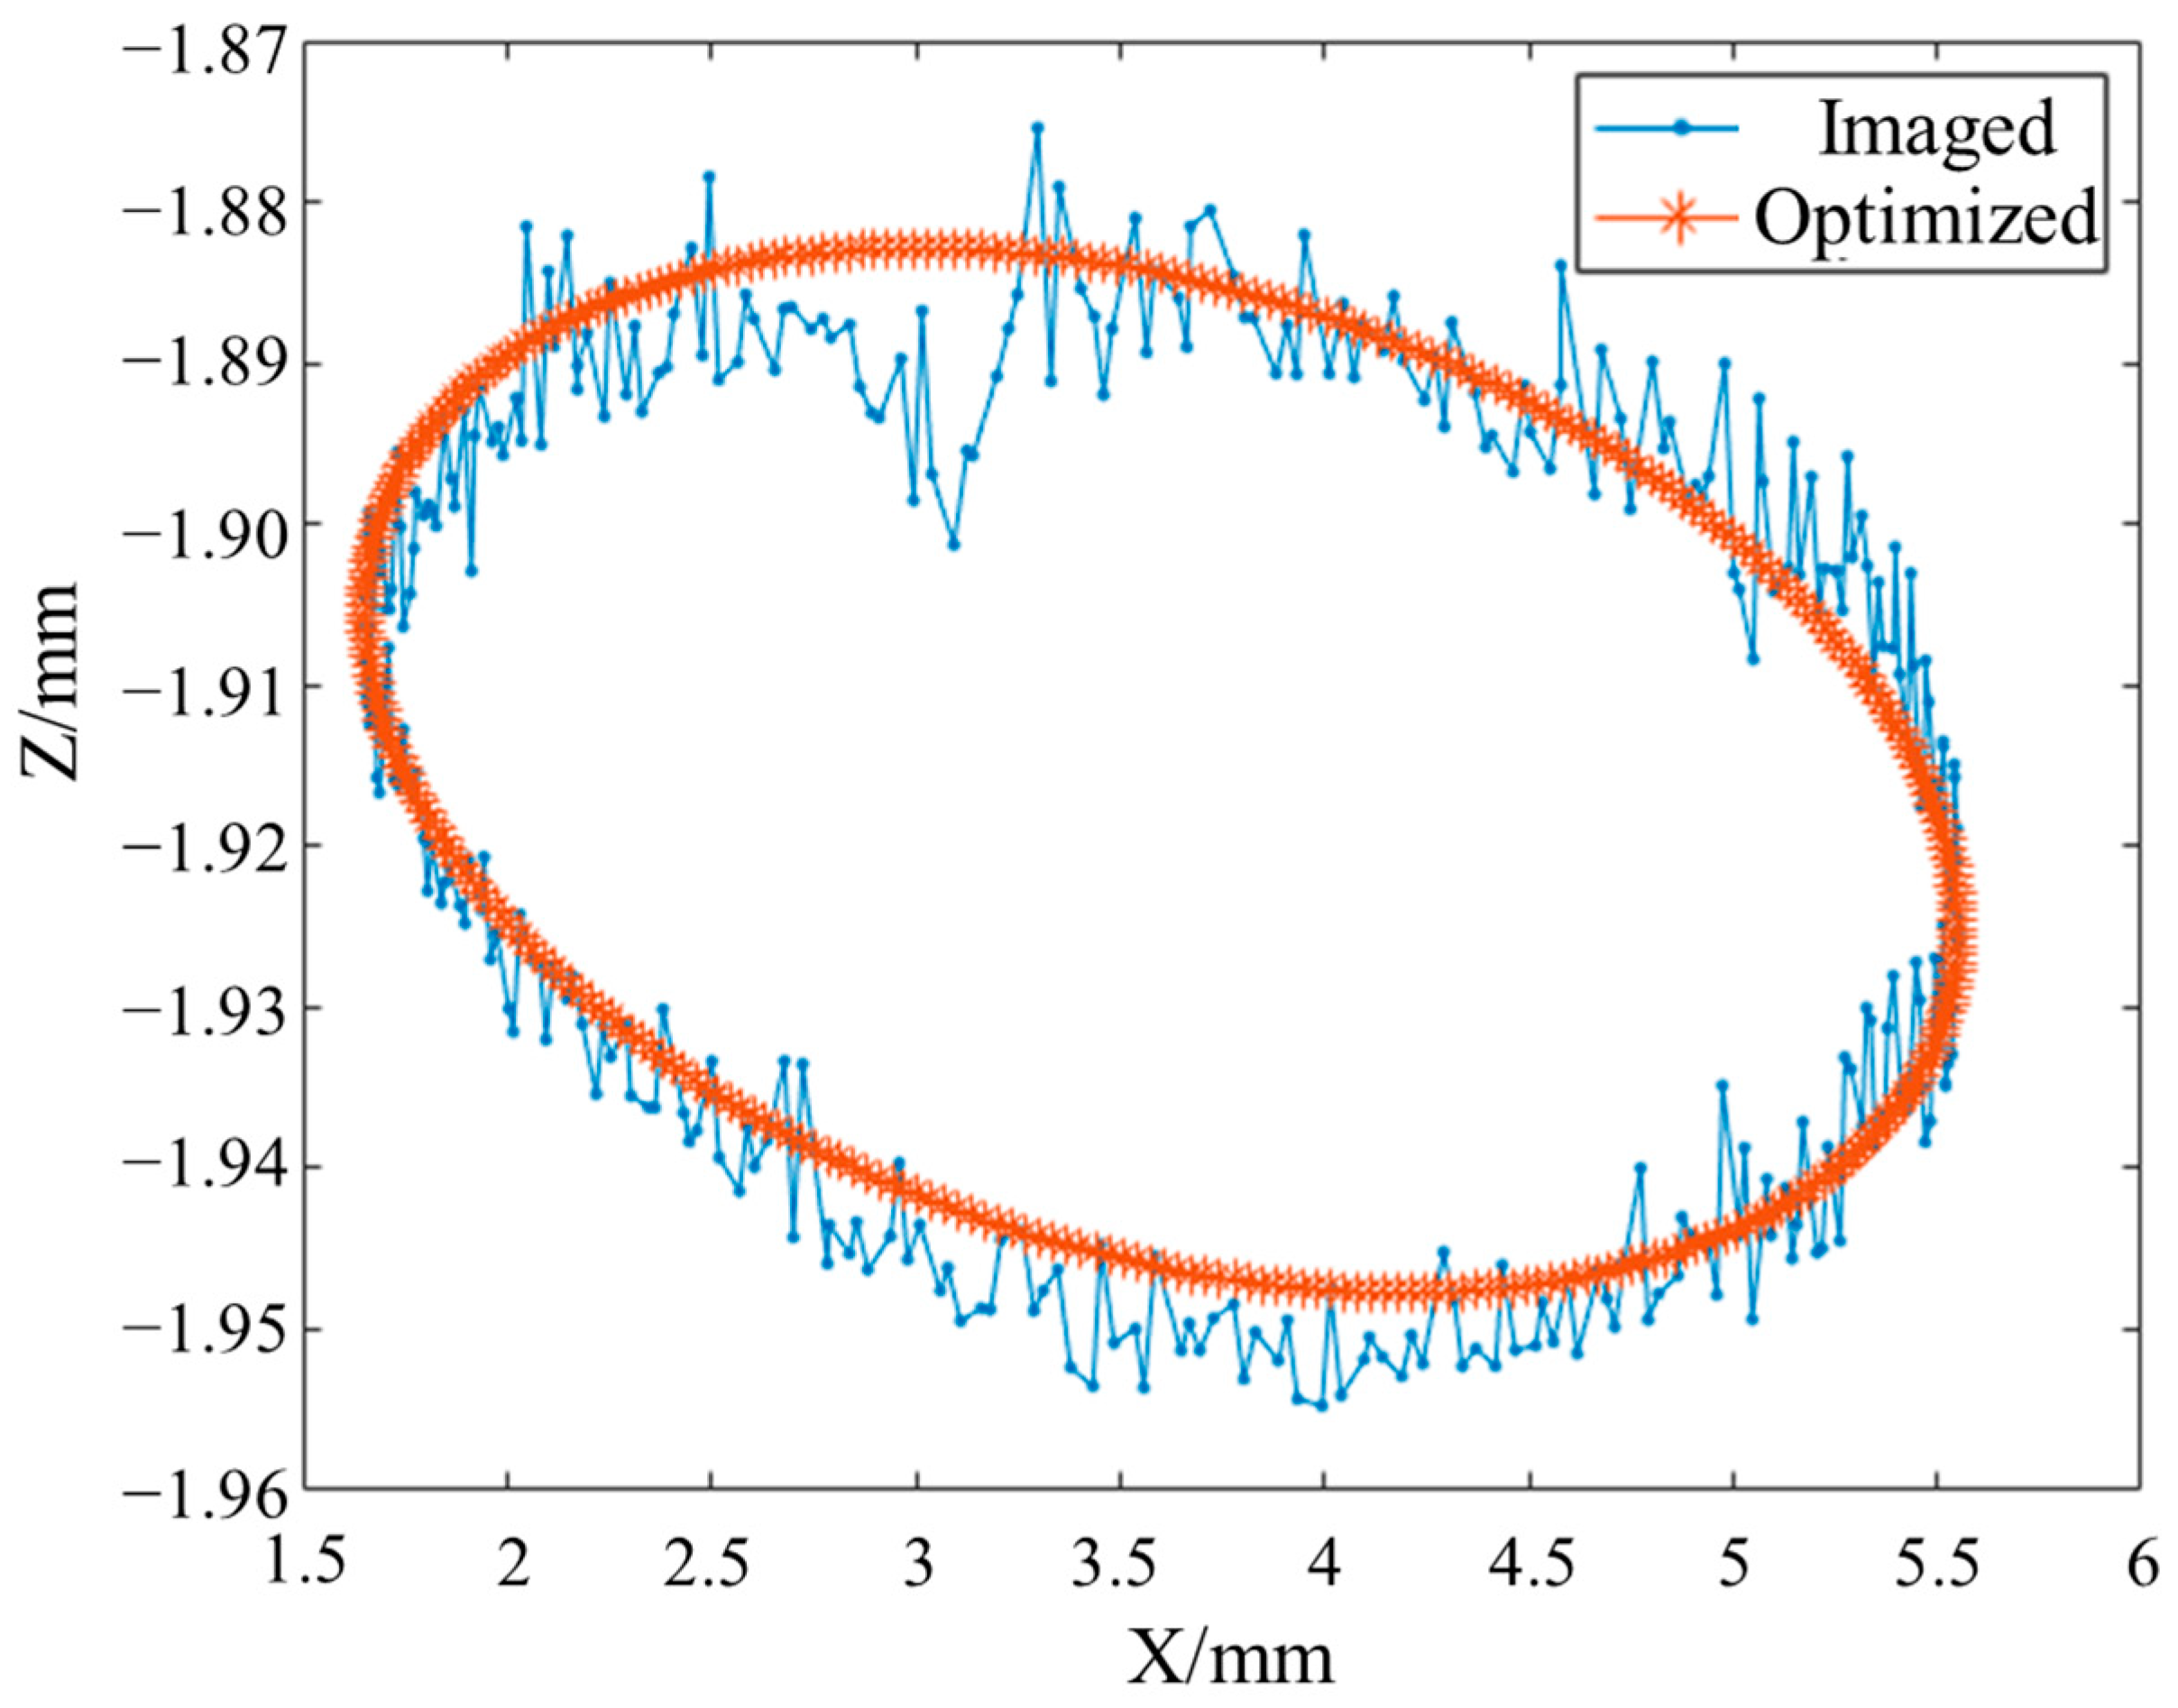
It is worth noting that infinitely many pairs of points A 1 and A 2 can be found along the rotation axis, all representing the same physical axis. Since the image provides only two-dimensional information, the sphere center coordinates can be determined only in the X and Z directions. Consequently, the computed P c ( i ) values are projected onto the XOZ plane for analysis. The XOZ plane of the measurement coordinate system is defined to pass through the initial sphere center, where the Y coordinate of the sphere center is set to zero, and the X and Z coordinates are derived from the image. The X and Z axes of the measurement coordinate system are aligned with the U and V axes of the image, respectively. Figure 5 illustrates the optimization process of this calibration algorithm through simulation. The blue trajectory represents the actual sphere center path calculated from image data, while the red trajectory shows the computed path after optimizing the rotation axis. To demonstrate the robustness of the algorithm, turntable runout errors and angular positioning errors were intentionally added during the simulation, resulting in a slightly irregular blue trajectory. Even under these conditions, the calibration algorithm successfully determines the least-squares axis, producing a red trajectory that closely matches the blue one.

4. Pre-Measurement Results Guiding Path Planning of the CC System

When the measurement results of the RP system are used to guide the path planning of the point-scanning system, it is first necessary to define the data transfer method between the two measurement systems, then calibrate the RT matrix for coordinate system mapping, and finally plan the scanning path in the CC system.

4.1. Dual-System Coupling Process

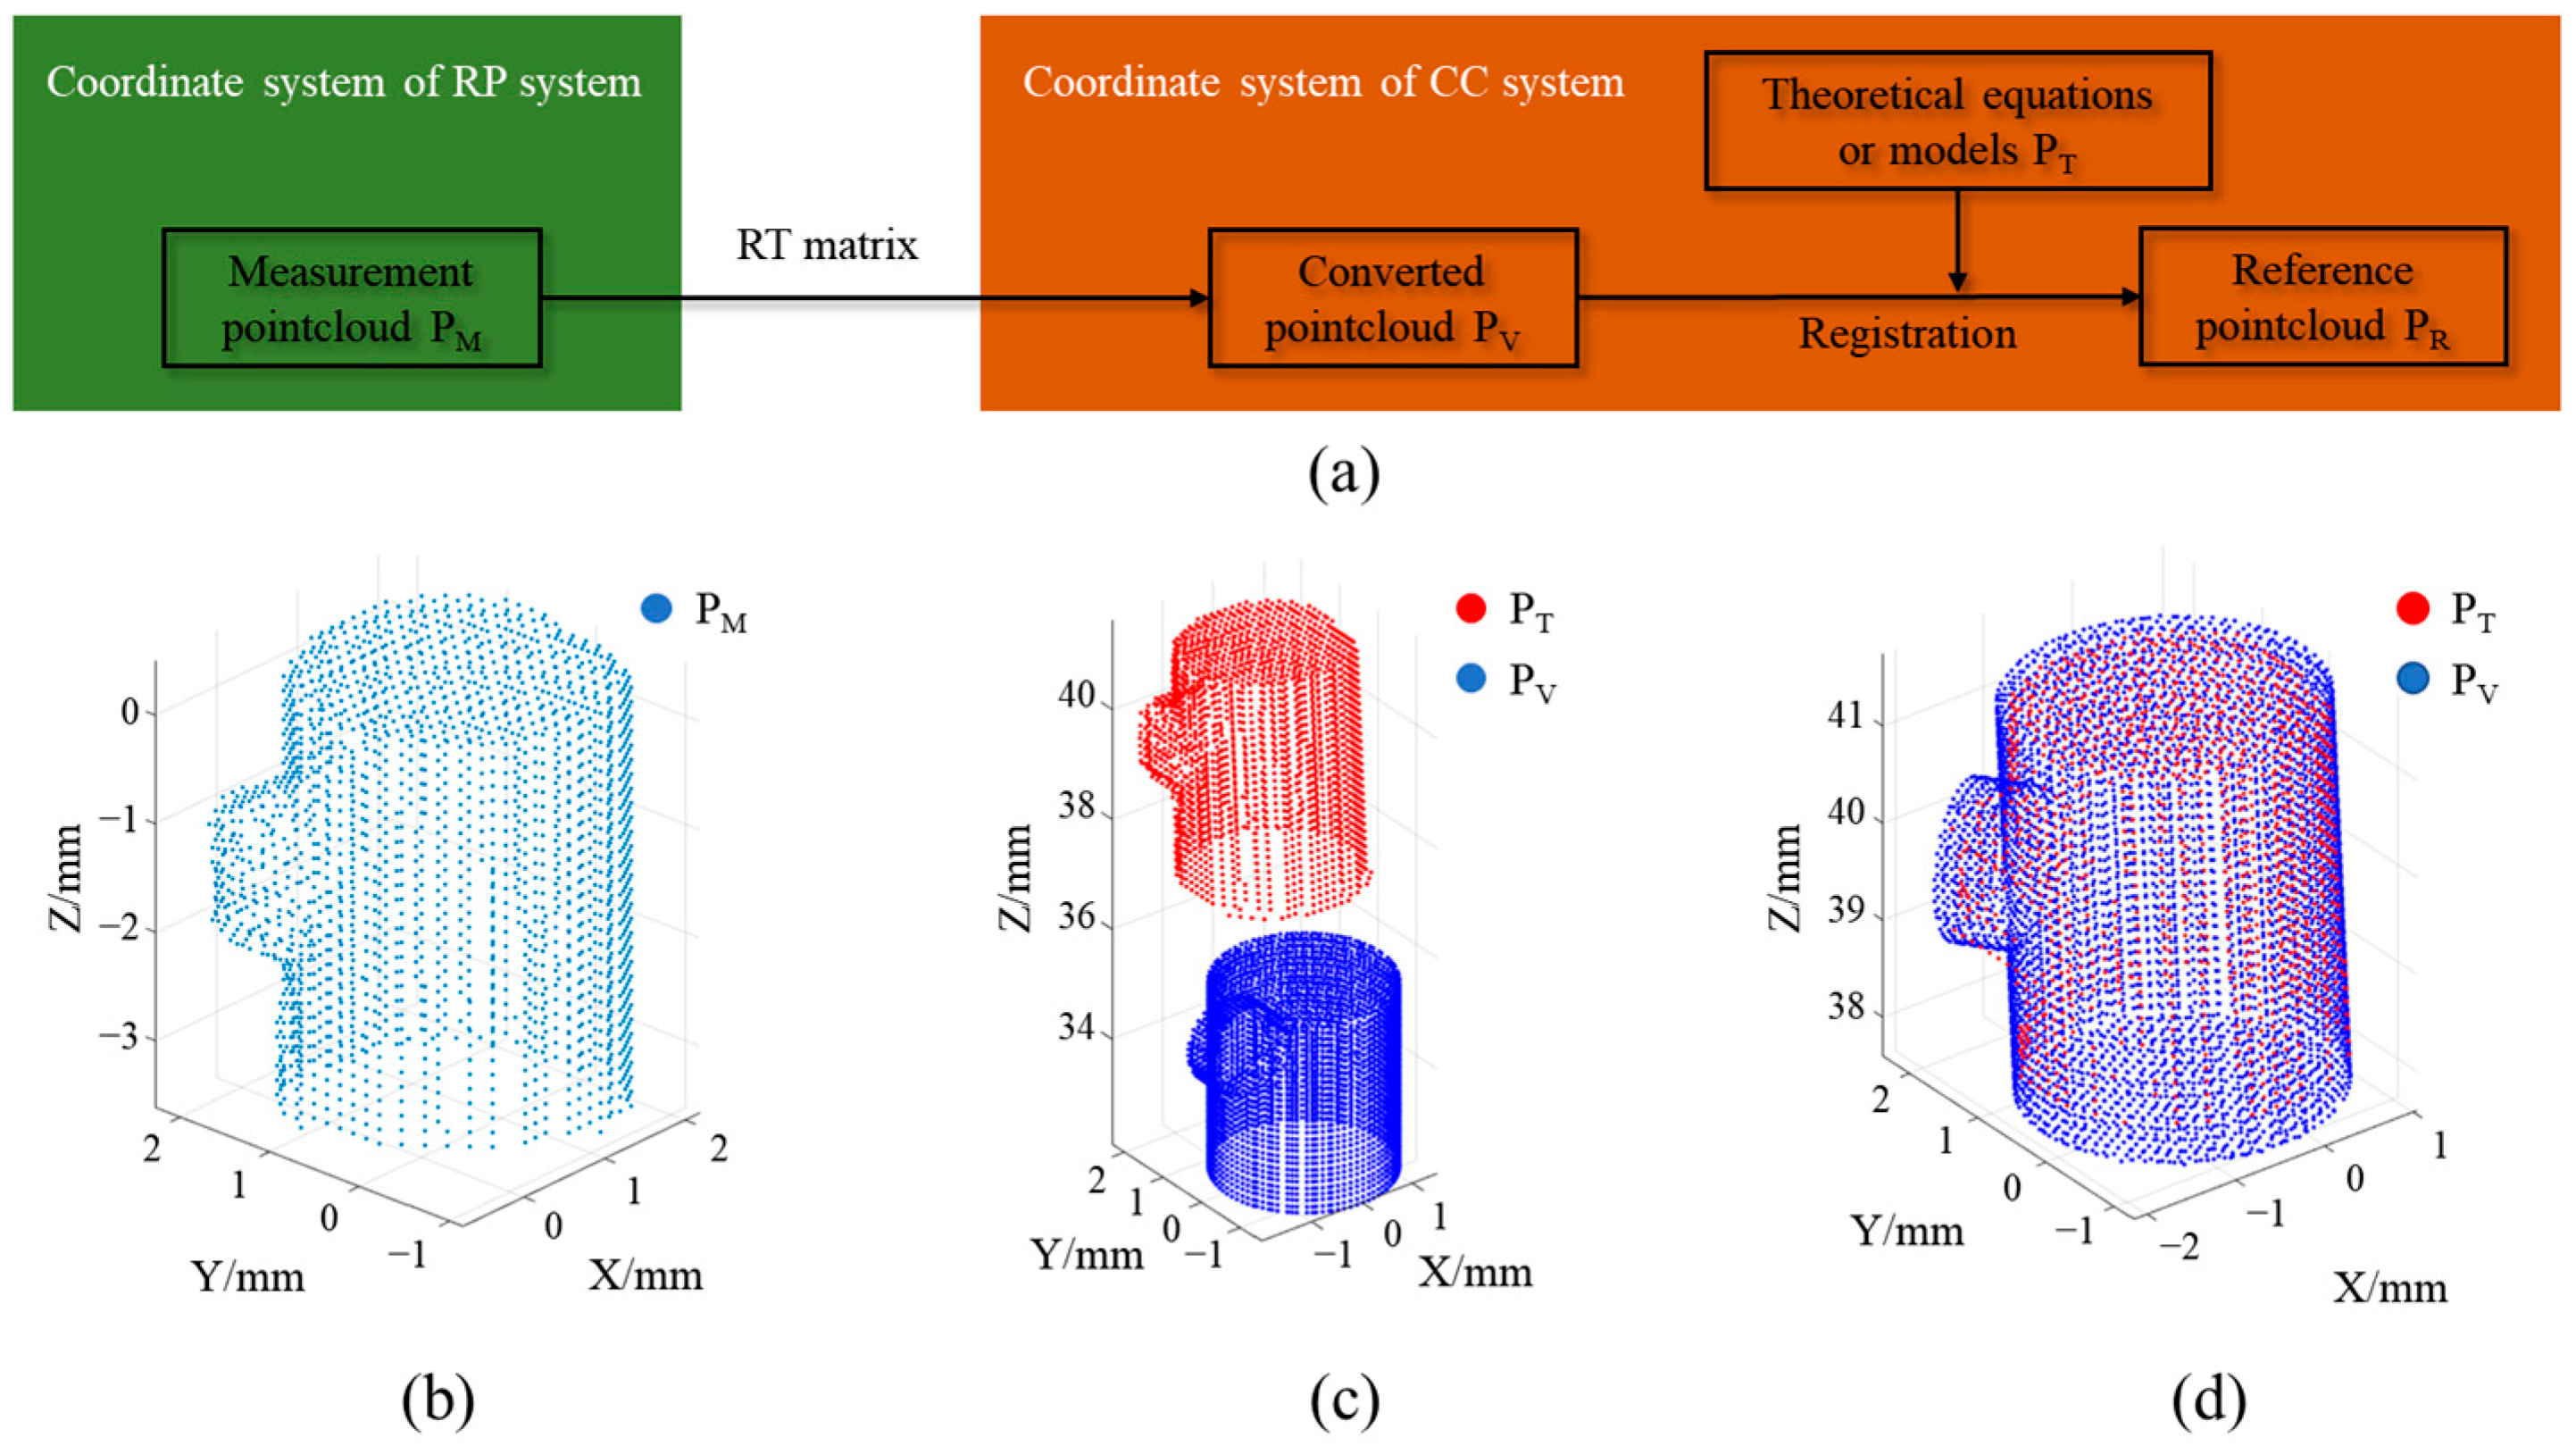
As shown in Figure 6a, coordinate transformation between the coordinate system of the RP system and that of the CC system is realized via an RT matrix. When obtaining the converted pointcloud in the CC system’s coordinate system, import the equation or 3D model of the workpiece under test and perform pointcloud registration with the converted pointcloud. Adjust the equation and model according to the posture of the converted pointcloud to match the real posture of the workpiece under test in the measurement coordinate system. The reference point cloud will be used to generate the scanning path. Figure 6b–d illustrate the pointcloud registration and posture adjustment process for a specific workpiece.
The spatial positional relationship between the measurement coordinate systems of the RP system and the CC system is characterized by an RT matrix. A standard workpiece is measured simultaneously by both systems to calibrate the RT matrix between them. A standard sphere is a common standard device, but a single standard sphere provides limited positional constraints. Therefore, the two measurement systems are used to measure standard spheres at multiple positions, respectively, and the centers of these standard spheres are fitted to obtain their coordinates in their respective measurement coordinate systems. Pointcloud registration is performed based on the one-to-one correspondence of the sphere center coordinates, and the RT matrix obtained during this registration process is used as the homogeneous transformation matrix between the two coordinate systems. All coordinates in the RP coordinate system can be converted to the CC coordinate system using this matrix.

4.2. Measurement Path Planning of the CC System

Path planning is performed using the reference pointcloud obtained in Section 4.1. The surface of the workpiece under test is sampled to obtain a series of sampling points. During the measurement process, the probe needs to traverse all sampling points on the surface of the workpiece in a specific order, so it is necessary to sort the sampling points appropriately. Meanwhile, optical sensors have specific angular characteristics. When the optical axis of the sensor is not parallel to the local normal vector of the workpiece surface, accuracy loss is likely to occur due to reduced signal-to-noise ratio. Therefore, profilometers usually need to control the sensor’s optical axis to follow the normal vector of the measured surface. Considering the above factors, it is necessary to calculate the coordinates, order, and normal vectors of the sampling points, and decouple them to form the movement amount of each axis. The sampling points need to be sorted according to a certain logic to make the entire measurement process more efficient and smoother. Research on sorting is relatively mature in both scanning measurement and machining, so it will not be elaborated here. A simple sorting method is provided here, with the specific process as follows: Since the workpiece under test is clamped on the worktable of the profilometer, the workpiece can be approximately regarded as cylindrical. The sorting method can be to slice the workpiece into layers along a direction roughly parallel to the cylindrical axis, dividing the overall 3D pointcloud into multiple sub-pointclouds and converting them into polar coordinates. Each sub-pointcloud is sorted counterclockwise in polar coordinates. Then, algorithms such as RANSAC and KD-tree can be used to calculate the neighboring points of each sampling point and obtain the local normal vector. Combined with the sensor’s range and the axis motion coordination mode of the profilometer, the coordinates of each axis are calculated, respectively, and then the measurement path file is generated.

5. Results

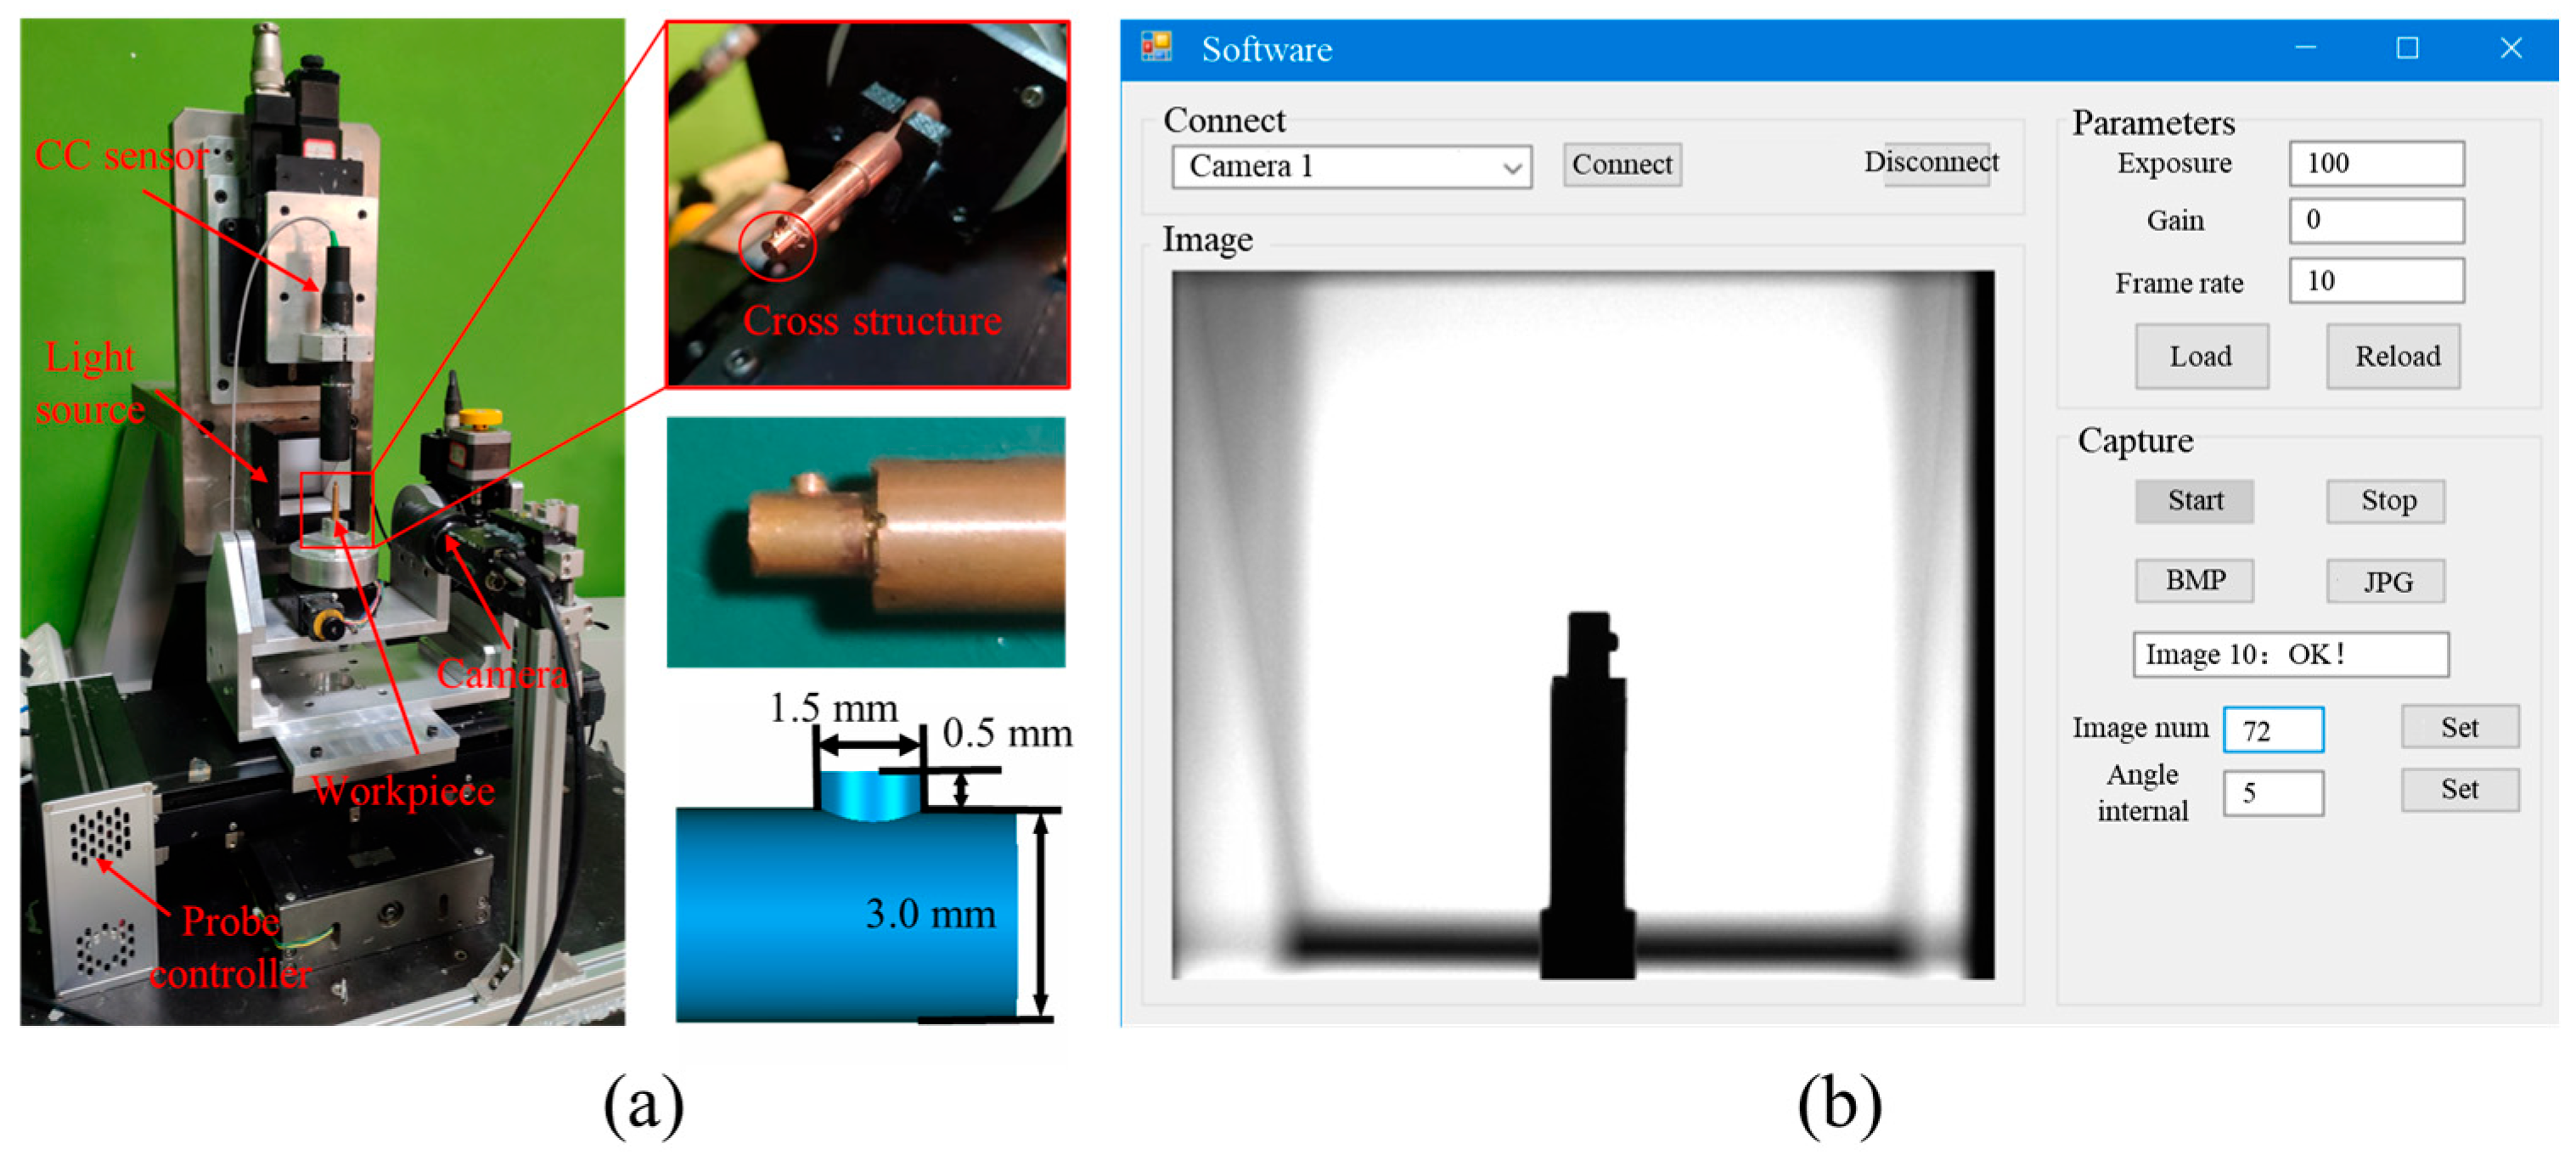
Based on the model design and theoretical analysis in Chapter 3, the experimental system built is shown in Figure 7a. The motion axes include X, Y, Z linear axes and A, C rotational axes. Since this study focuses on verifying the effectiveness of the RP system rather than the accuracy of the CC system, these axes used in the CC system are not high-precision aerostatic axes. The key parameters of the experimental setup are shown in Table 1. The cradle structure enables the profilometer not only to adjust the posture of the workpiece under test flexibly, but also to reuse the C-axis for the RP system. A cross-cylinder workpiece composed of two orthogonal cylinders is used as the measurement object. The cross-section of this workpiece features abrupt changes in normal vectors and a narrow space, which is a challenge for many commercial profilometers. When the placement posture of this cross-cylinder workpiece is difficult to align with the theoretical 3D model, problems such as sensor collision or missing measurement data will occur. The control software developed for the reverse projection measurement system and the images of this workpiece are shown in Figure 7b.
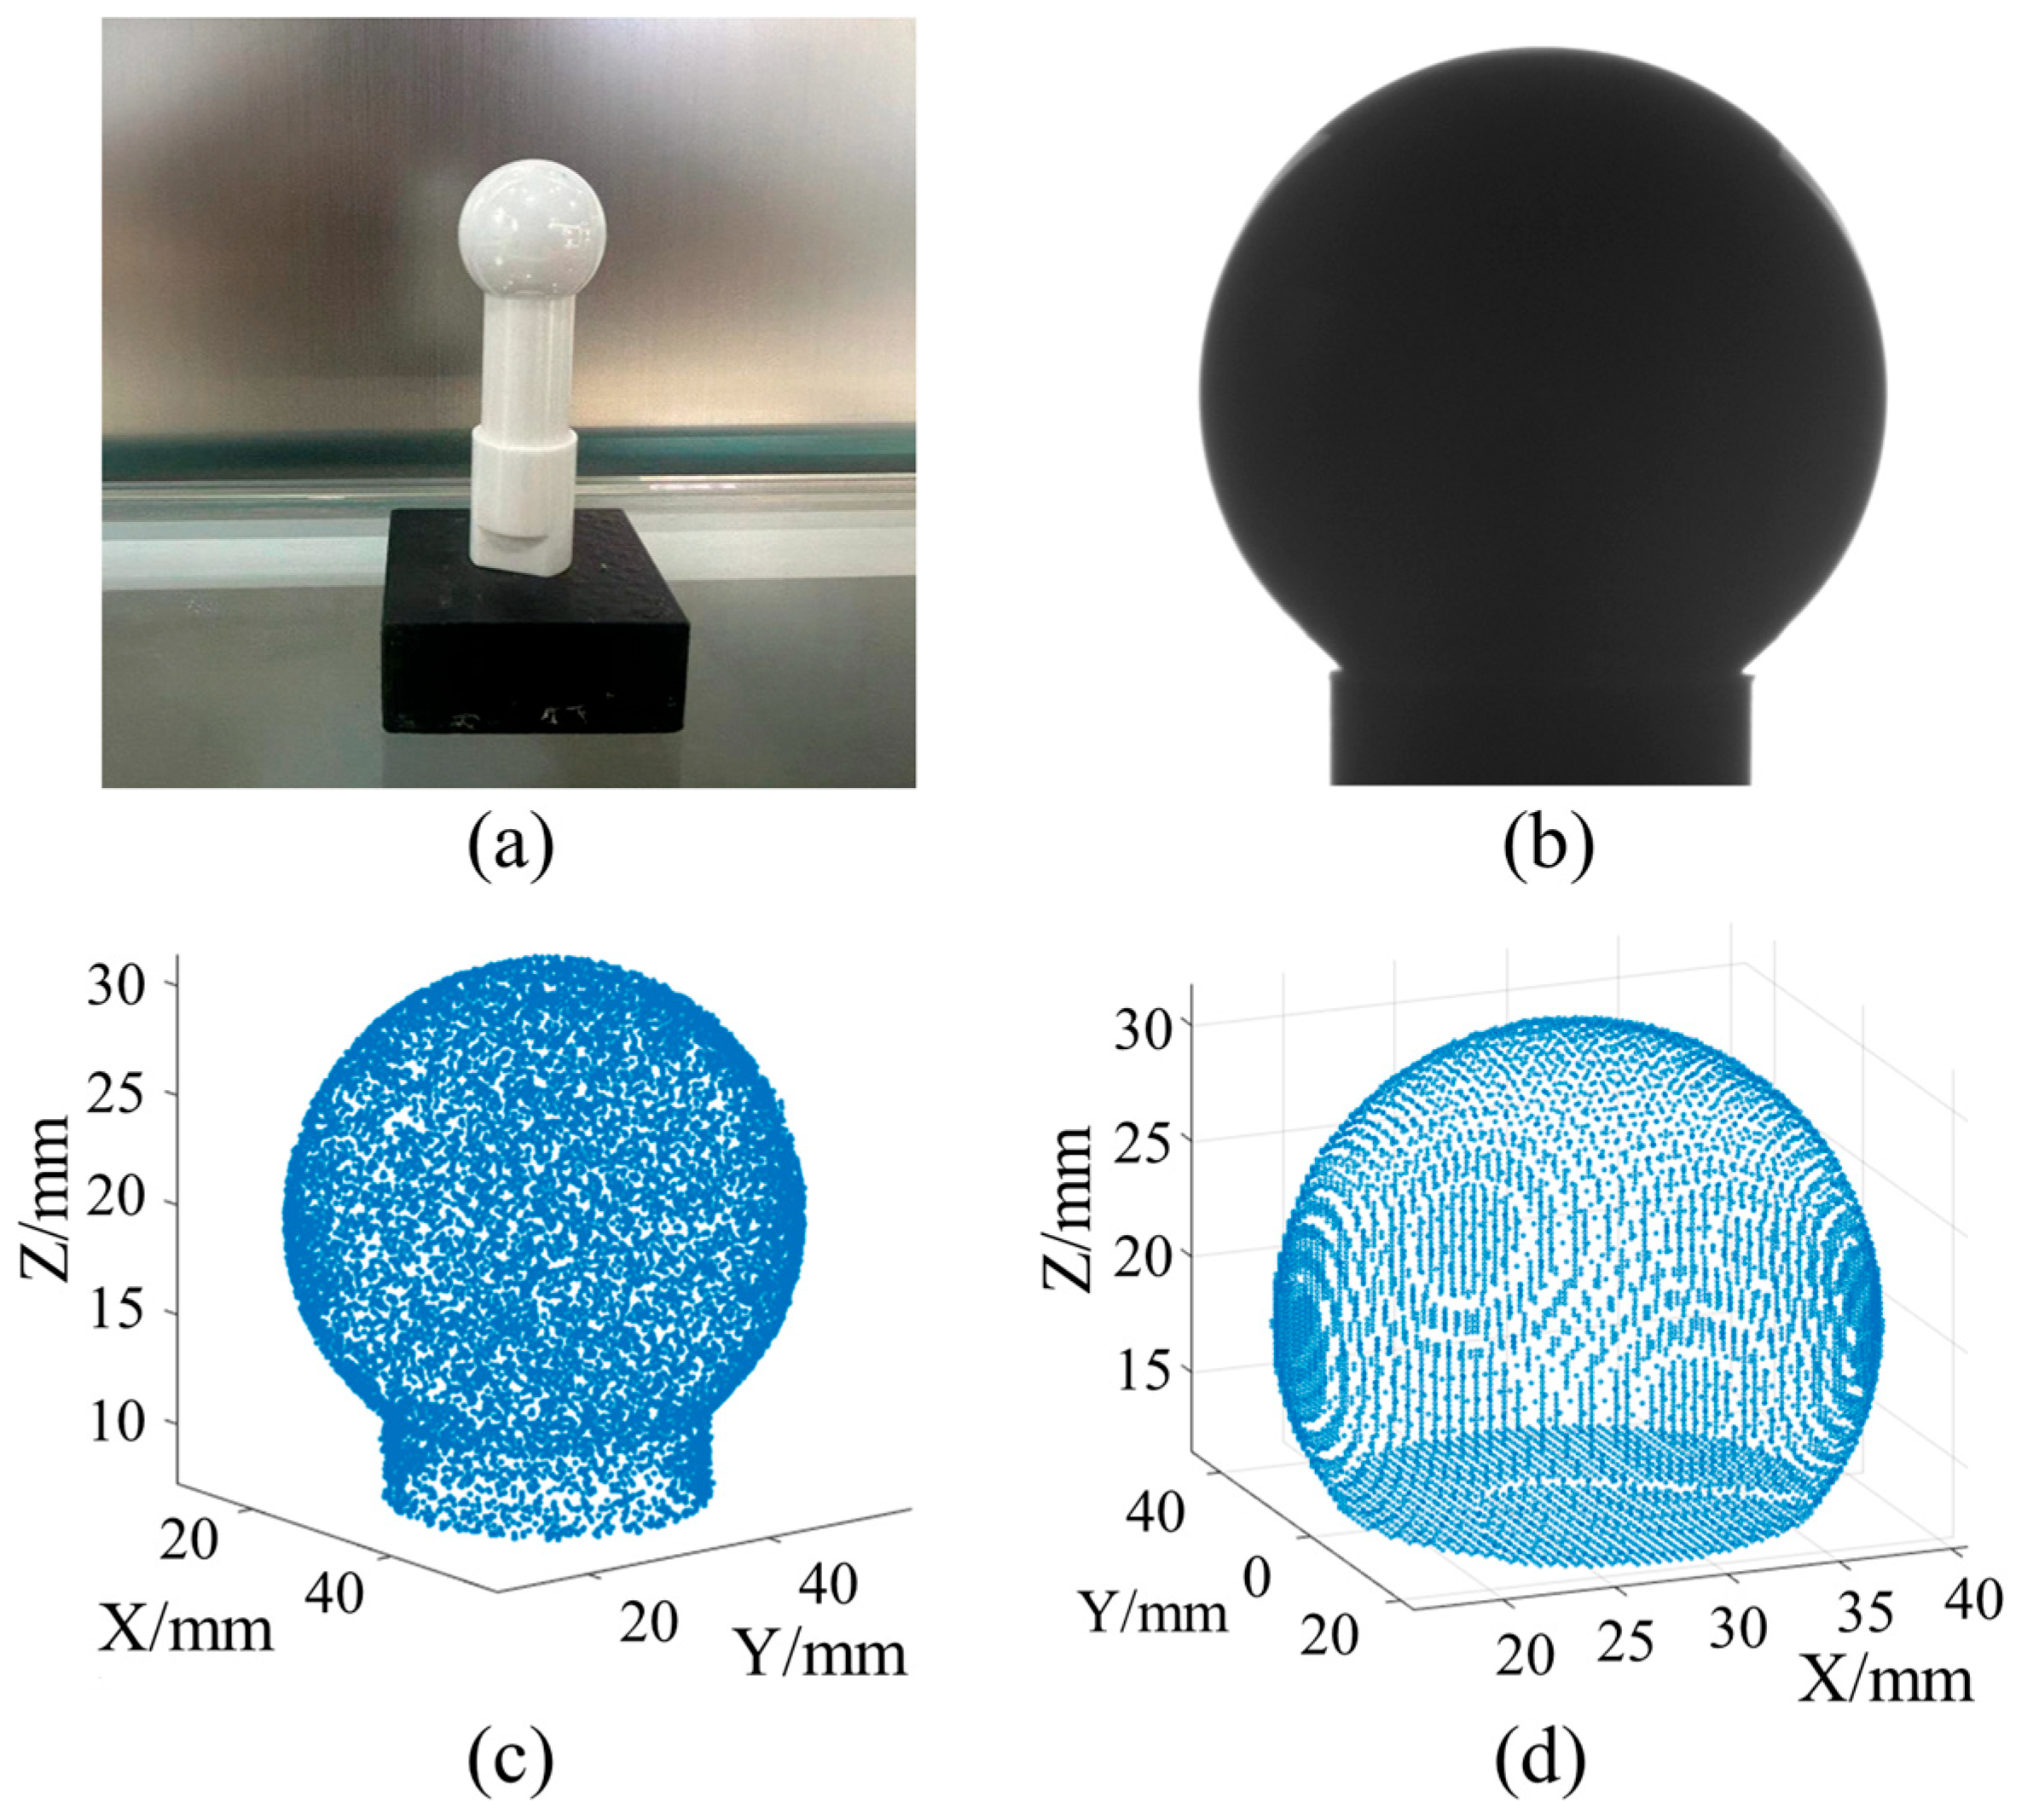
To verify the accuracy of the RP system, a standard sphere with a nominal radius of 12,703 mm is measured, as shown in Figure 8a. The image acquired by the RP system is presented in Figure 8b. After extracting the outer contour by slicing the pointclouds corresponding to shadow contours at various projection angles, the reconstructed pointcloud of the sphere is obtained, as shown in Figure 8c. The final pointcloud, retaining only the upper spherical region, is shown in Figure 8d. The measurement results are fitted to a sphere using the least-squares method, yielding a radius deviation of 1.8 μm from the nominal value. Considering the dynamic range of approximately hundreds of micrometers and the angular response of ±20° for the point CC sensor, this level of accuracy demonstrates that the RP system is sufficiently precise for planning the measurement path of the CC system.
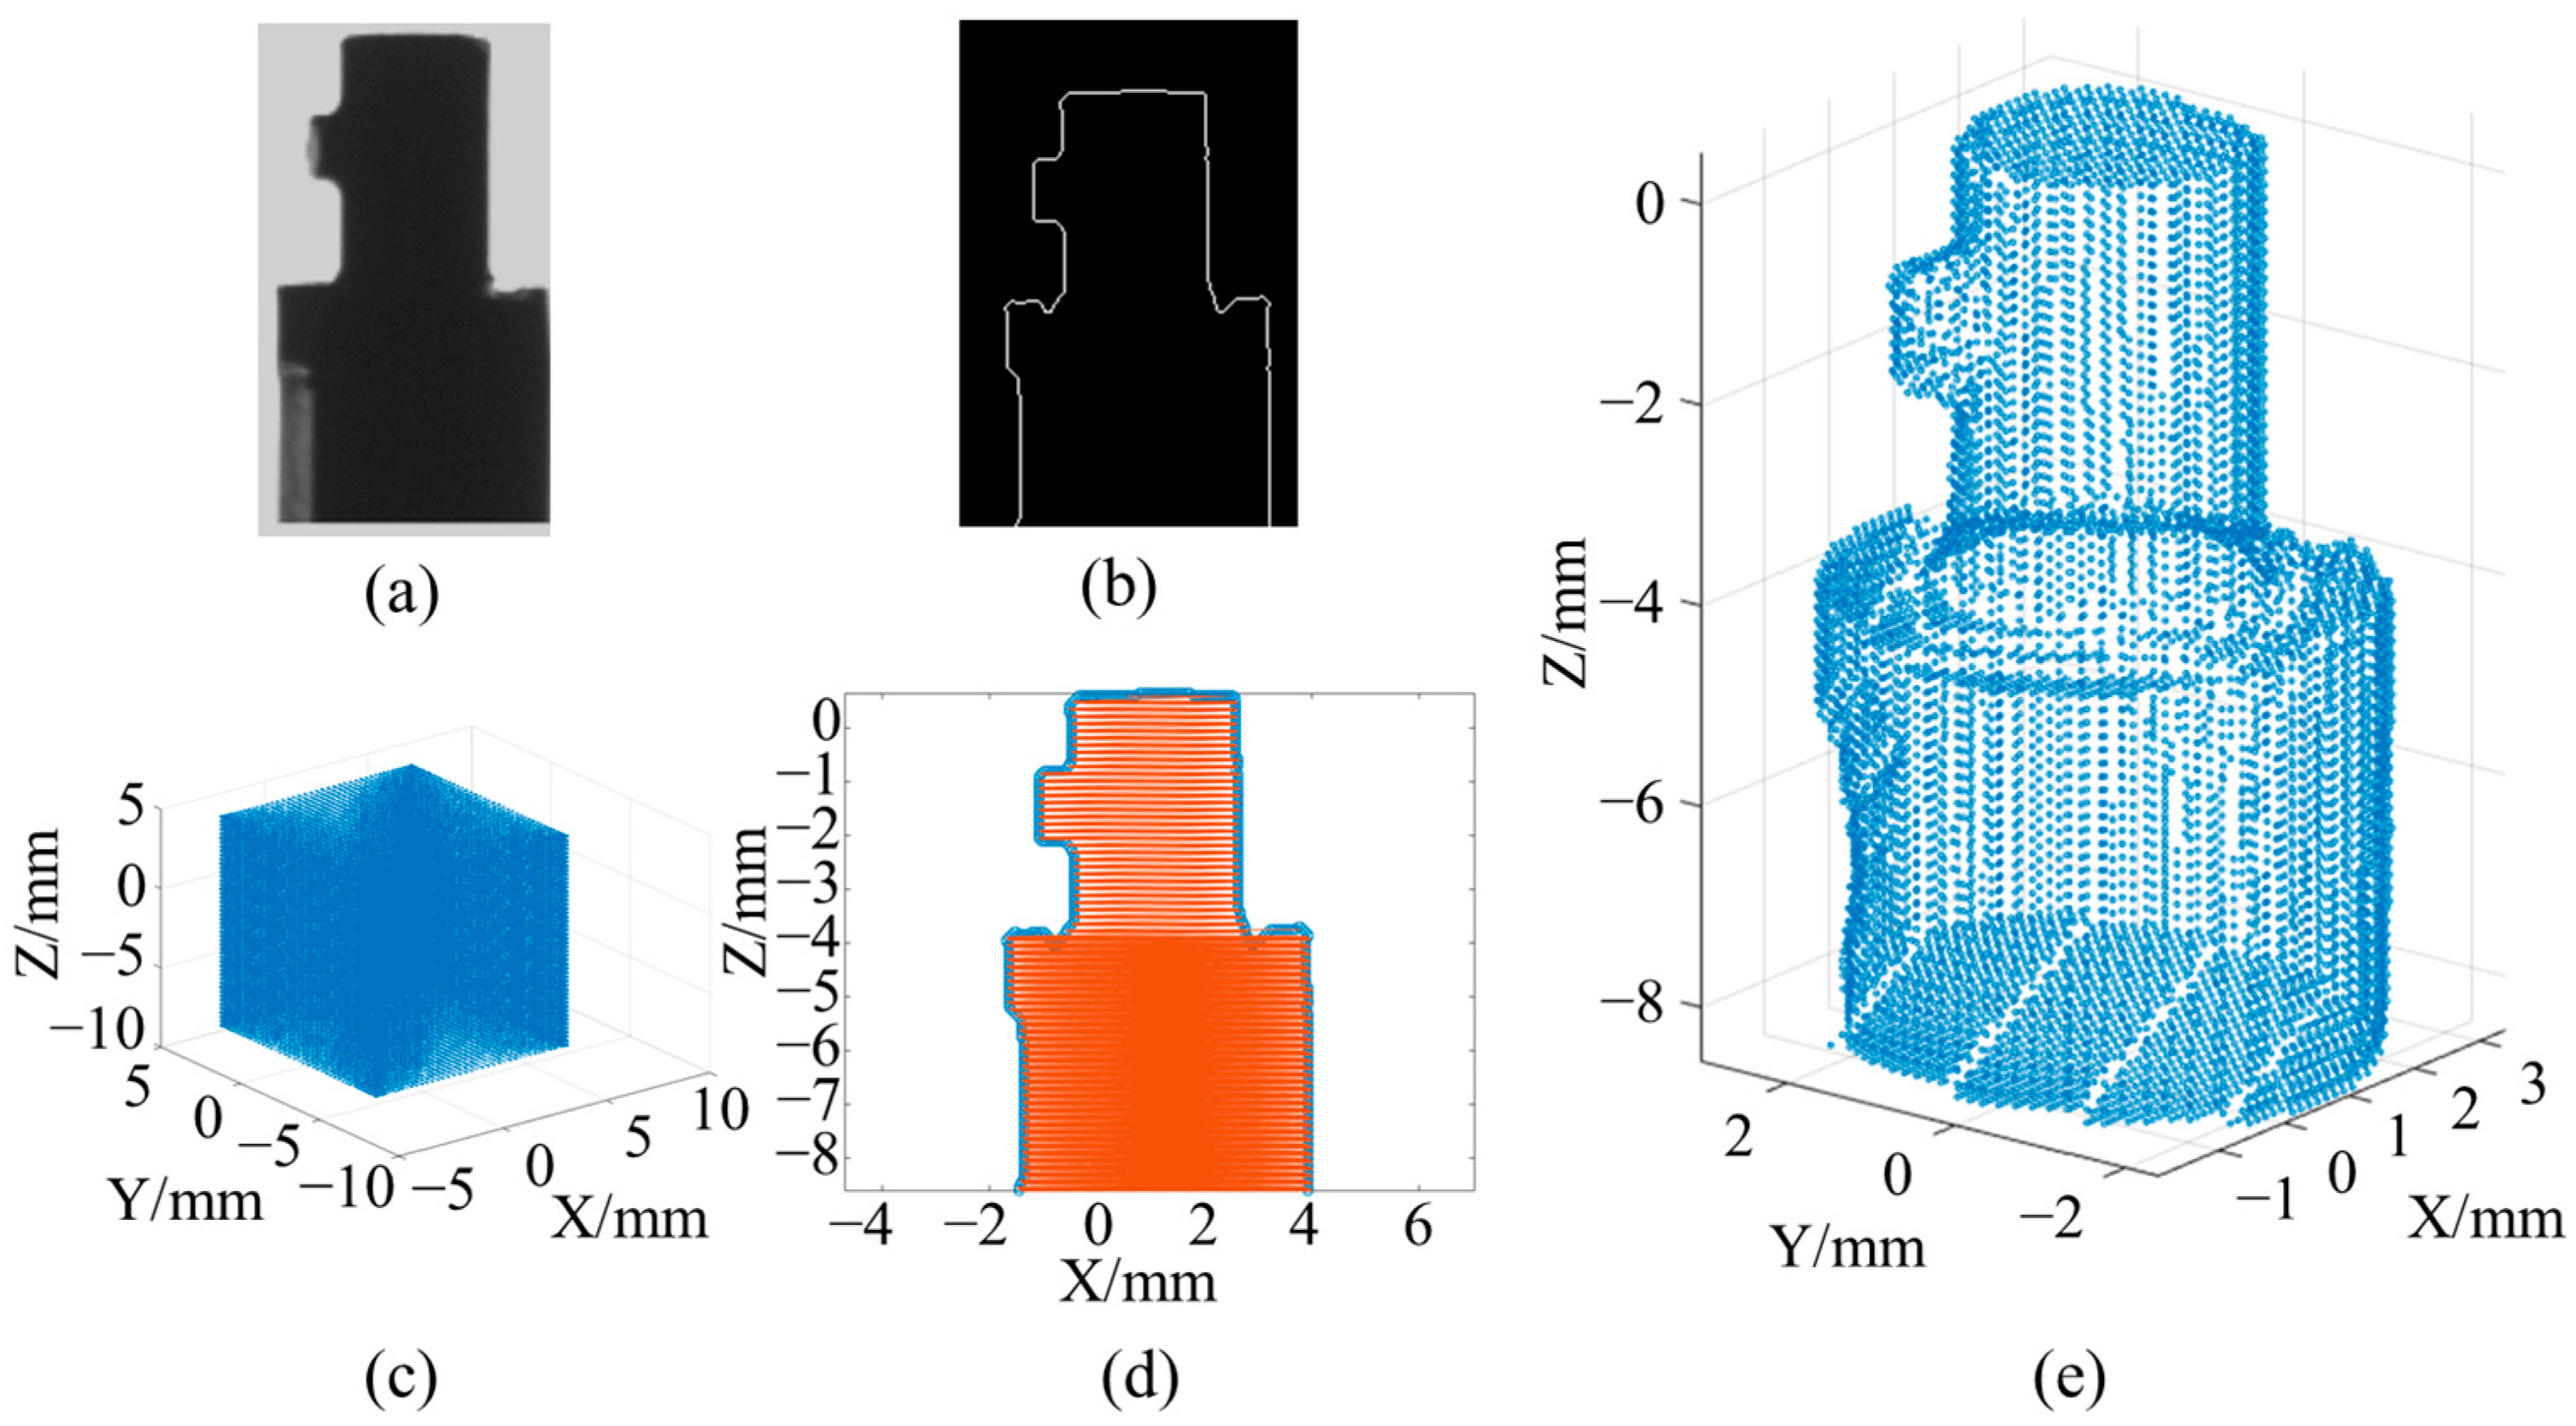
The RP system is employed to measure a crossed-cylinder workpiece. The captured image and the extracted shadow contours are shown in Figure 9a and Figure 9b, respectively. The progressive slicing process of the initial cuboid point cloud using shadow contours at different projection angles is illustrated in Figure 9c–e. Various structural features of the workpiece are well reconstructed, and the central groove of the workpiece is also automatically reconstructed with high fidelity.
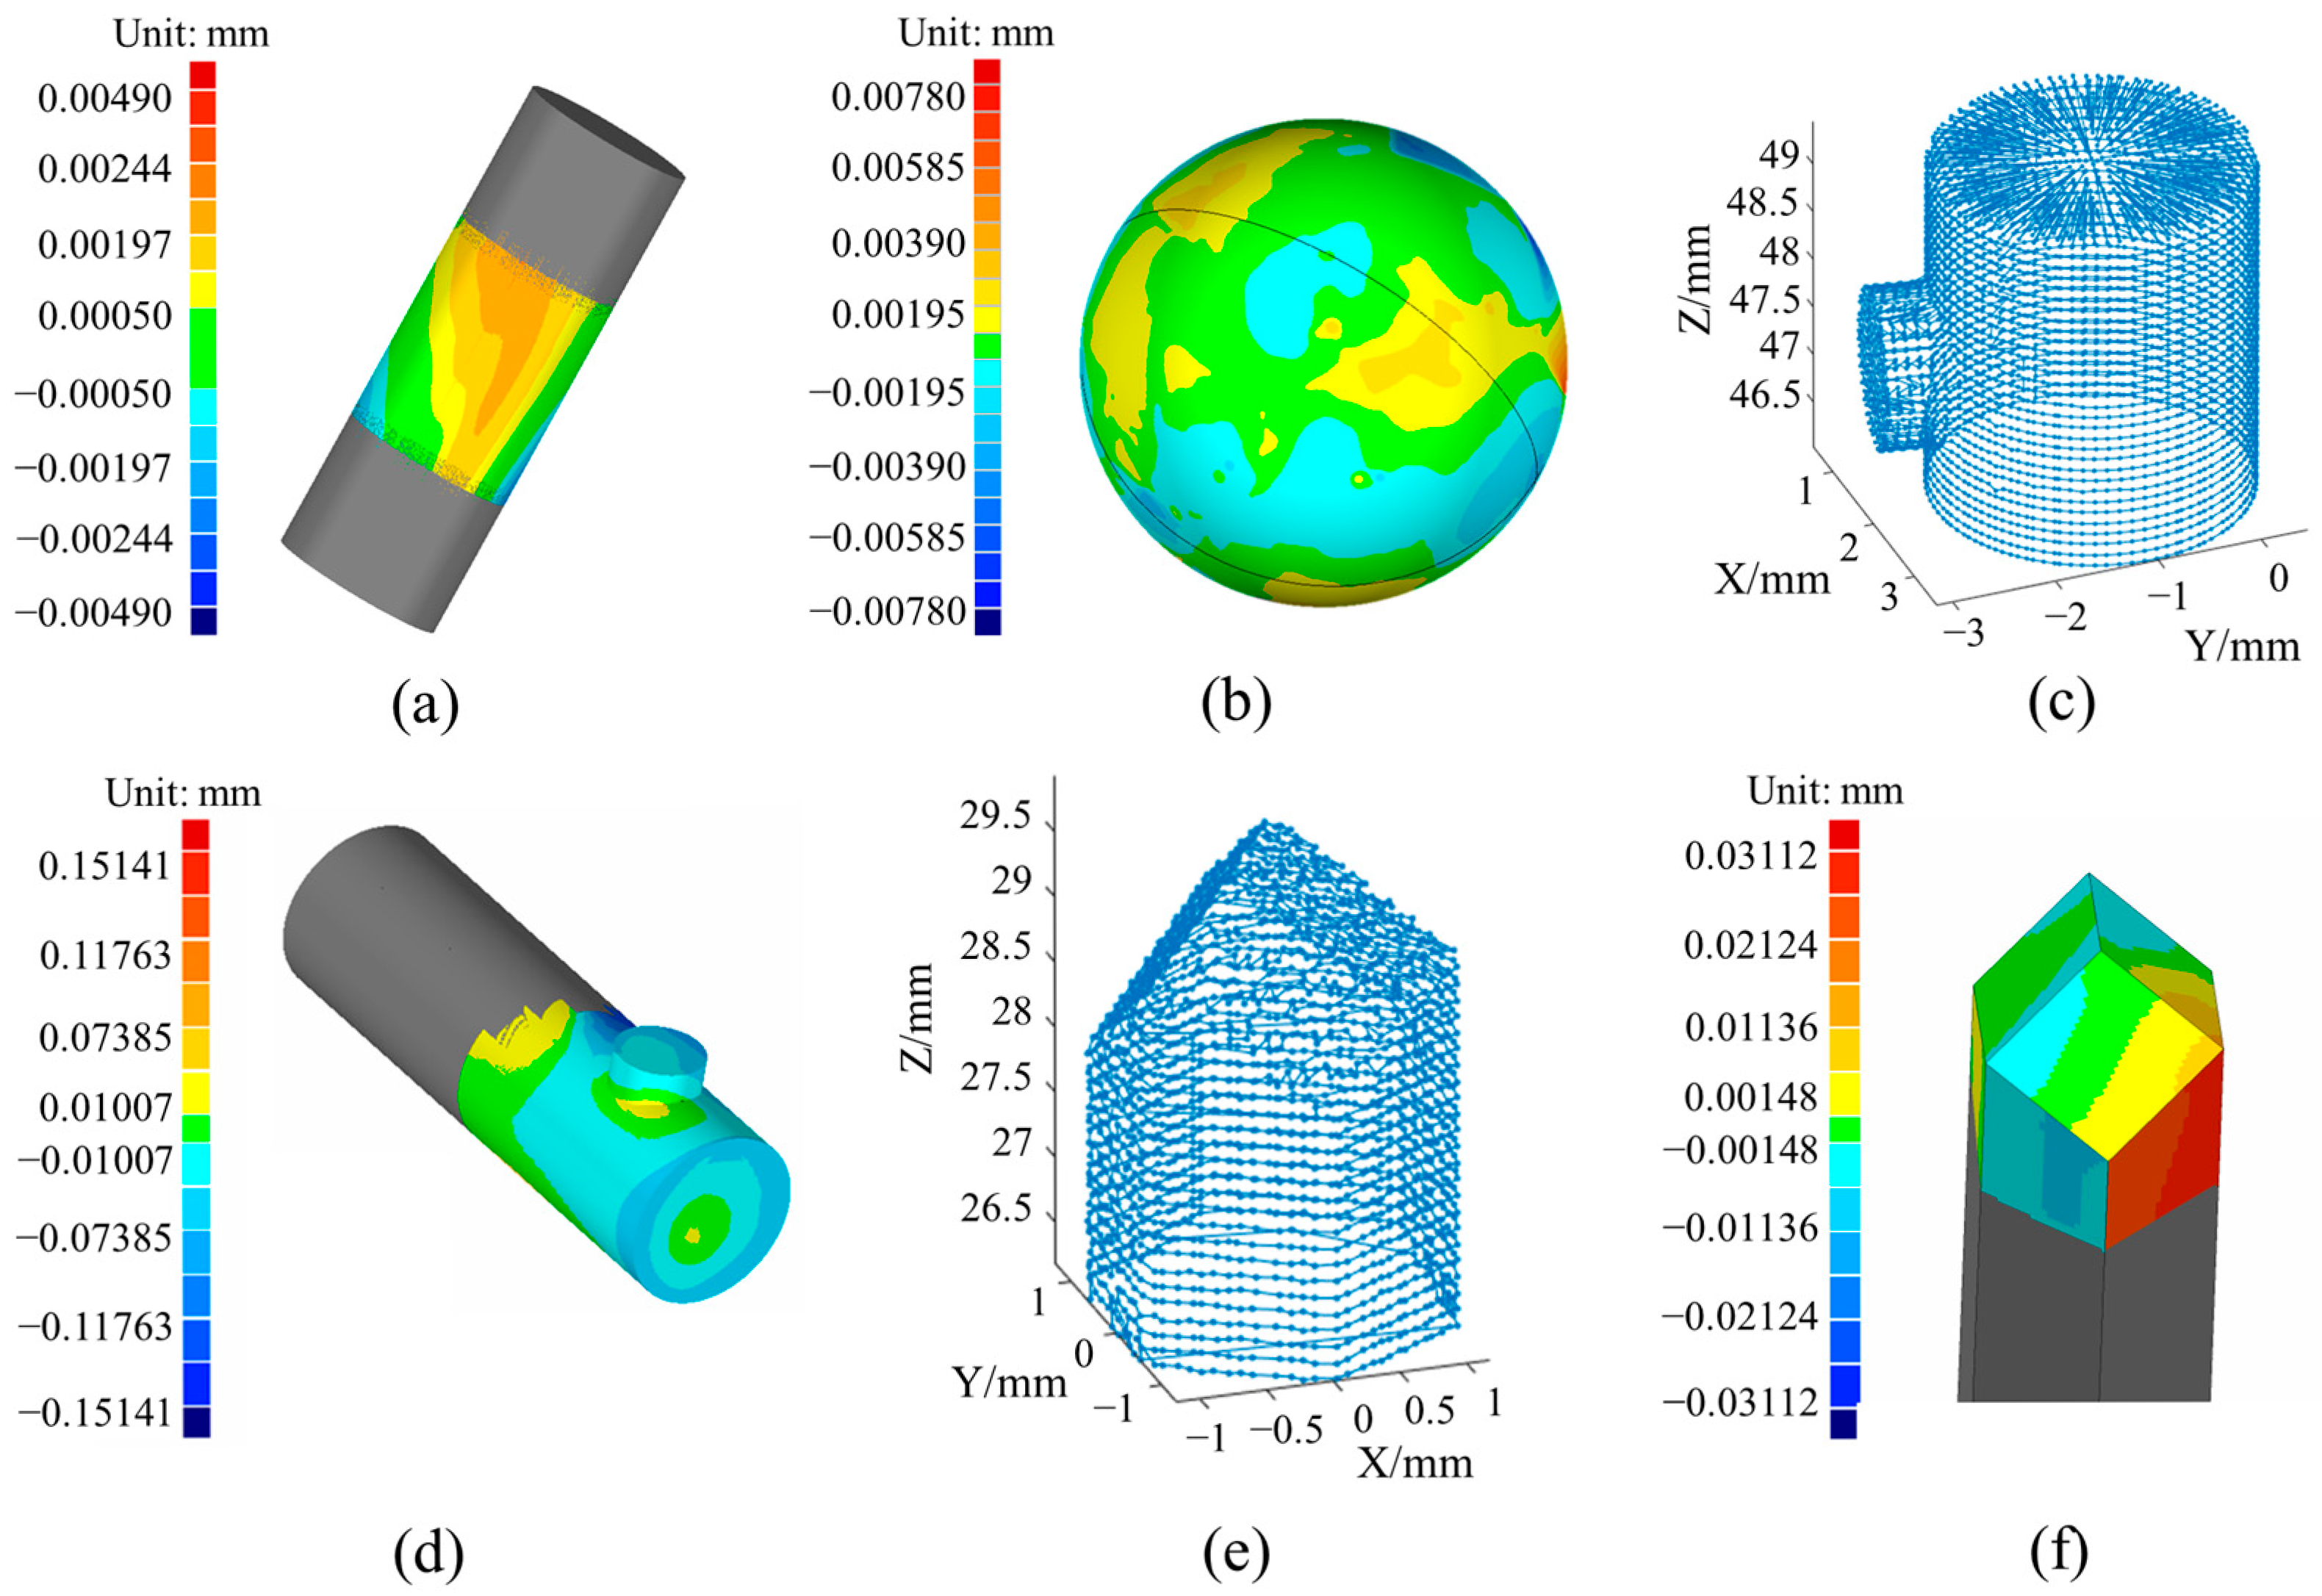
The results obtained from the RP system are used for scanning path planning, after which several workpieces are measured using the CC system. The results are shown in Figure 10. Figure 10a,b present the measurement results of two workpieces obtained along the planned scanning paths. The peak-to-valley (PV) surface form errors are within 9.8 μm and 15.6 μm, respectively. Approximately 70% of the surface area of the standard sphere can be successfully measured. Figure 10c,d show the measured pointcloud and surface form error evaluation of the key crossed region of the crossed-cylinder workpiece obtained by the CC system. The actual surface contour of this workpiece inherently differs from its theoretical model, and unfortunately, no suitable commercial instrument is currently available for its measurement as a reference. Nevertheless, by employing the pre-measurement strategy proposed in this study, both the pose recognition and scanning path planning can be accomplished without the need for dedicated fixtures for precise alignment. Aside from the lower region of the smaller cylinder—which is unmeasurable due to sensor interference—most of the other surface features are successfully captured. As shown in Figure 10e,f, with the help of the RP system, a micro-triangular-pyramid workpiece is also measured by the CC system. Compared with our previous work, the addition of the pre-measurement system enables more accurate identification of the workpiece’s pose, leading to a noticeable improvement in the measurement accuracy of the CC system. This demonstrates the importance of pose pre-measurement for workpieces before measurement in point-scanning profilometry.
Due to the higher machining accuracy of the measured cylinders and balls, and the significant deviation of the crossed-cylinder workpiece from the design model, only the cylinder and the sphere are measured five times, and the radius deviations of the measurement results are calculated, respectively. The results are shown in Table 2, which shows the deviation between the fitted radius and the nominal radius. The side measurement process of a cylinder is more straightforward and has higher measurement accuracy. For cylinders, the average radius deviations of the RP system and the CC system are 0.66 μm and 0.34 μm, respectively, with standard deviations of 0.99 μm and 0.34 μm. For the sphere, the average radius deviations of the RP system and the CC system are 1.06 μm and 0.28 μm, respectively, with standard deviations of 1.59 μm and 0.93 μm. Since the 3D pointcloud reconstruction process of the RP system is a continuous removal process, the measured radius is usually larger than the nominal value in most cases.

6. Discussions

The RP system is not a separate high-precision measurement device, but is mainly used to identify the pose of the workpiece under test in the CC system and help generate measurement paths. The pose of the workpiece, namely its position and inclination angle, focuses on the overall distribution or orientation of the measured pointcloud rather than specific surface profile deviations. Therefore, the precision requirements for the pose measurement system are much lower than those for the surface profile measurement system. As a measurement method based on contour detection at multiple angles, the measurement accuracy of the RP system is affected by the accuracy of the edge extraction algorithm, the angular positioning accuracy of the electric rotation stage, the initial pointcloud interval, and the capturing angle interval. The edge detection method adopted is a mature sub-pixel-level edge extraction algorithm that uses interpolation. When the background light source is uniform and the workpiece under test does not exceed the depth of field of the lens when rotating, the shadow contour of the workpiece is clear. The angular positioning accuracy of the electric turntable is approximately ±10″, which has no significant impact on the measurement results. Because, depending on the camera resolution and the size of the field of view, the spatial size corresponding to a single pixel is approximately 10 μm. Assuming the workpiece under test is a sphere with a radius of 12 mm, when the rotation angle error is 10″, the lateral misalignment of the sphere contour in the camera’s field of view is only 0.5 μm. This value is much smaller than the spatial resolution of the camera. The angle interval of the shadow contour capturing has a significant impact on the measurement results. For the measurement process of the standard sphere, when the angle intervals are 5° and 10°, there are many sharp corners on the surface of the reconstructed pointcloud. Because the times of the cutting process are too small, the entire process is not continuous. When the angle interval is reduced to 1° or even 0.5°, the reconstructed surface becomes relatively smooth. When measuring other workpieces, images are usually captured at intervals of 1°. However, whether it is 1° or 5°, both can meet the accuracy requirements of the CC system when identifying the workpiece’s pose. This is because the design model of the workpiece under test is used for registration with the measurement pointcloud of the RP system, and the path of the CC system is planned based on the design model. The pose is the result of fitting and will be much more accurate than the surface profile measurement.
The workpieces that the RP system can measure mainly depend on the size of the camera’s field of view. The RP experimental setup can measure the size of the workpiece approximately at 40 mm × 40 mm × 30 mm. The measurable size of the structure shall not be less than 10 μm, or the RP system will have difficulty distinguishing it (mainly because the interval of the initial pointcloud has to become really small). In addition, the RP system calculates based on the shadow contour, so it is impossible to reconstruct the contour of the area for workpieces with concave structures, such as deep holes. The RP system is more suitable for measuring workpieces with only convex structures or slightly concave structures. Despite this, it is more automated, faster, and non-destructive compared to the CMM, which requires human intervention for manual alignment adjustment [26]. When measuring complex workpieces, some studies have to integrate multiple sensors into a single measurement system, and through data fusion, the measurement results of each sensor can be pieced together into a complete pointcloud. This leads to a complex structure and still makes full automation impossible [27]. For the traditional optical profilometers, such as Luphoscan and Mahr MFU series, workpieces such as cross cylinders and triangular pyramids cannot be measured [19,21]. Compared with the harsh requirements for the materials of workpieces and the usage environment in industrial computed tomography inspection, the RP system based on visible light detection has higher flexibility [28].

7. Conclusions

In this study, we focused on developing a pre-measurement method that can be integrated into a point-scanning profilometer. An RP system was designed to identify the pose of the workpiece by analyzing its shadow contours acquired at multiple projection angles. The pre-measurement results are then utilized to plan the scanning path of the point-scanning profilometer. Experimental results show that, when measuring approximately 70% of the surface area of a standard sphere, the fitted radius deviated from the nominal radius by only 1.8 μm, demonstrating the high accuracy of the developed pre-measurement system. Furthermore, the RP system was employed to guide the CC system in scanning path planning for various workpieces, successfully achieving full-profile measurement of complex geometries such as the crossed-cylinder workpiece. The proposed pre-measurement system and methodology are straightforward for reproducing and effectively addressing the stringent alignment requirements typically imposed by conventional point-scanning profilometers. This research contributes to the advancement of precision manufacturing processes and holds significant scientific importance as well as broad potential value in the measurement of precision-engineered components.

Author Contributions

Conceptualization, L.L. and Z.L.; methodology, L.L.; software, L.L.; validation, L.L., Z.L. and X.Z.; formal analysis, Z.L.; investigation, Z.L.; resources, X.Z.; data curation, X.Z.; writing—original draft preparation, L.L.; writing—review and editing, L.L.; visualization, L.L.; supervision, Z.L. and X.Z.; project administration, X.Z. All authors have read and agreed to the published version of the manuscript.

Funding

This research was funded by the National Program of China (J0017-2326-QT); National Natural Science Foundation of China (62373274 & 52405508).

Data Availability Statement

The data presented in this study are available on request from the corresponding author.

Acknowledgments

Thanks to the Laboratory of MicroNano Manufacturing Technology for the equipment support provided.

Conflicts of Interest

The authors declare no conflicts of interest.

Abbreviations

The following abbreviations are used in this manuscript:
CSWComplex small workpiece
RPReverse projection
CCChromatic confocal
PVPeak to valley
3DThree-dimensional
2DTwo-dimensional
CMMCoordinate measuring machine
MDOFMulti-degree-of-freedom
RTRotation-translation

References

  1. Seo, J.H.; Lee, I.D.; Yoo, B. Effectiveness of rough initial scan for high-precision automatic 3D scanning. J. Comput. Des. Eng. 2021, 8, 1332–1354. [Google Scholar] [CrossRef]
  2. Catalucci, S.; Thompson, A.; Piano, S.; Branson, D.T., III; Leach, R. Optical metrology for digital manufacturing: A review. Int. J. Adv. Manuf. Technol. 2022, 120, 4271–4290. [Google Scholar] [CrossRef]
  3. Gao, J.; Lei, Y.; Xu, Z. Research on Micro-Triangular Pyramid Array-Based Fly-Cutting Technology Using the Orthogonal Test Method. Coatings 2024, 14, 806. [Google Scholar] [CrossRef]
  4. Hou, Q.; Yang, X.; Li, D.; Cheng, J.; Wang, S.; Xiao, J.; Li, W. Tribological performance of hydrophobic and micro/nano triangle textured rake face of cutting tools. Appl. Surf. Sci. 2022, 571, 151250. [Google Scholar] [CrossRef]
  5. Zhou, Q.; Zuo, J.; Kang, W.; Ren, M. High-Precision 3D Reconstruction in Complex Scenes via Implicit Surface Reconstruction Enhanced by Multi-Sensor Data Fusion. Sensors 2025, 25, 2820. [Google Scholar] [CrossRef]
  6. Zahwi, S.; Mekawi, A.M. Some effects of stylus force on scratching surfaces. Int. J. Mach. Tools Manuf. 2001, 41, 2011–2015. [Google Scholar] [CrossRef]
  7. Lee, D.-H. 3-Dimensional profile distortion measured by stylus type surface profilometer. Measurement 2013, 46, 803–814. [Google Scholar] [CrossRef]
  8. Schulz, M.; Elster, C. Traceable multiple sensor system for measuring curved surface profiles with high accuracy and high lateral resolution. Opt. Eng. 2006, 45, 060503. [Google Scholar] [CrossRef]
  9. Wang, Y.; Xie, F.; Ma, S.; Dong, L. Review of surface profile measurement techniques based on optical interferometry. Opt. Lasers Eng. 2017, 93, 164–170. [Google Scholar] [CrossRef]
  10. Park, S.-Y.; Baek, J.; Moon, J. Hand-held 3D scanning based on coarse and fine registration of multiple range images. Mach. Vis. Appl. 2011, 22, 563–579. [Google Scholar] [CrossRef]
  11. Shaw, L.; Ettl, S.; Mehari, F.; Weckenmann, A.; Häusler, G. Automatic registration method for multisensor datasets adopted for dimensional measurements on cutting tools. Meas. Sci. Technol. 2013, 24, 045002. [Google Scholar] [CrossRef]
  12. Wu, C.; Yang, L.; Luo, Z.; Jiang, W. Linear laser scanning measurement method tracking by a binocular vision. Sensors 2022, 22, 3572. [Google Scholar] [CrossRef]
  13. Li, Z.; Liu, L.; Li, C.; Fang, C.; Miao, L.; Zhu, L.; Zhang, X. Complete topographic measurement of the monolithic multi-surface workpiece on a cylindrical cavity. Opt. Laser Technol. 2023, 161, 109222. [Google Scholar] [CrossRef]
  14. Sensofar. S neox Five Axis: Complete 3D Measurement Solution. Available online: https://www.sensofar.com/metrology/industry-research/sneox-fiveaxis (accessed on 24 October 2025).
  15. Werth StentCheck®—Multi-Sensor Systems for Stent Measurement. Available online: https://www.werth.de/en/products/machines/d/production-monitoring/device/stentcheckr.html (accessed on 24 October 2025).
  16. Fan, C.; Wang, H.; Cao, Z.; Chen, X.; Xu, L. Path Planning of Autonomous 3-D Scanning and Reconstruction for Robotic Multi-Model Perception System. Machines 2022, 11, 26. [Google Scholar] [CrossRef]
  17. Han, H.; Li, S.; Chen, J.; Lin, Q.; Chen, Q.; Wang, Z. Next View Planning Policy for Autonomous 3D Reconstruction of Unknown Environments. In Proceedings of the 2023 8th International Conference on Intelligent Computing and Signal Processing (ICSP), Xi’an, China, 21–23 April 2023; pp. 766–771. [Google Scholar]
  18. Liu, Y.; Zhao, W.; Sun, R.; Yue, X. Optimal path planning for automated dimensional inspection of free-form surfaces. J. Manuf. Syst. 2020, 56, 84–92. [Google Scholar] [CrossRef]
  19. AMETEK Inc. LUPHOScan 260/420 HD. Available online: https://www.taylor-hobson.com/products/non-contact-3d-optical-profilers/luphos/luphoscan-260-420-hd (accessed on 24 October 2025).
  20. Henselmans, R.; Gubbels, G.; van Drunen, C.; van Venrooy, B.; Leijtens, J. NANOMEFOS non-contact measurement machine for aspheric and freeform optics. In Proceedings of the International Conference on Space Optics—ICSO 2010, Rhodes, Greece, 4–8 October 2010; pp. 495–500. [Google Scholar]
  21. Mahr GmbH. Mahr MarForm MFU 200. Available online: https://metrology.mahr.com/en-us/ (accessed on 24 October 2025).
  22. Xiao, S.; Li, C.; Fang, C.; Li, Z.; Zhang, X. Iterative line laser scanning for full profile of polyhedral freeform prism. Opt. Laser Technol. 2025, 181, 111712. [Google Scholar] [CrossRef]
  23. Lu, K.; Wang, W. A multi-sensor approach for rapid and precise digitization of free-form surface in reverse engineering. Int. J. Adv. Manuf. Technol. 2015, 79, 1983–1994. [Google Scholar] [CrossRef]
  24. Li, C.; Fang, C.; Zhang, X. Automated line scan profilometer based on the surface recognition method. Opt. Lasers Eng. 2024, 182, 108464. [Google Scholar] [CrossRef]
  25. Kirkpatrick, D.; Seidel, R. On the shape of a set of points in the plane. IEEE Trans. Inf. Theory 1983, 29, 551–559. [Google Scholar] [CrossRef]
  26. Sun, Y.; Lu, L.; Wu, F.; Xiao, S.; Sha, J.; Zhang, L. Error analysis of a coordinate measuring machine with a 6-DOF industrial robot holding the probe. Actuators 2023, 12, 173. [Google Scholar] [CrossRef]
  27. Xie, Z.; Wang, J.; Zhang, Q. Complete 3D measurement in reverse engineering using a multi-probe system. Int. J. Mach. Tools Manuf. 2005, 45, 1474–1486. [Google Scholar] [CrossRef]
  28. Fan, Y.; Liu, B.; Chen, P. Research on CT imaging method of complex shaped workpiece based on contour prior constraint. Chin. J. Electron. 2020, 48, 1976–1982. [Google Scholar]
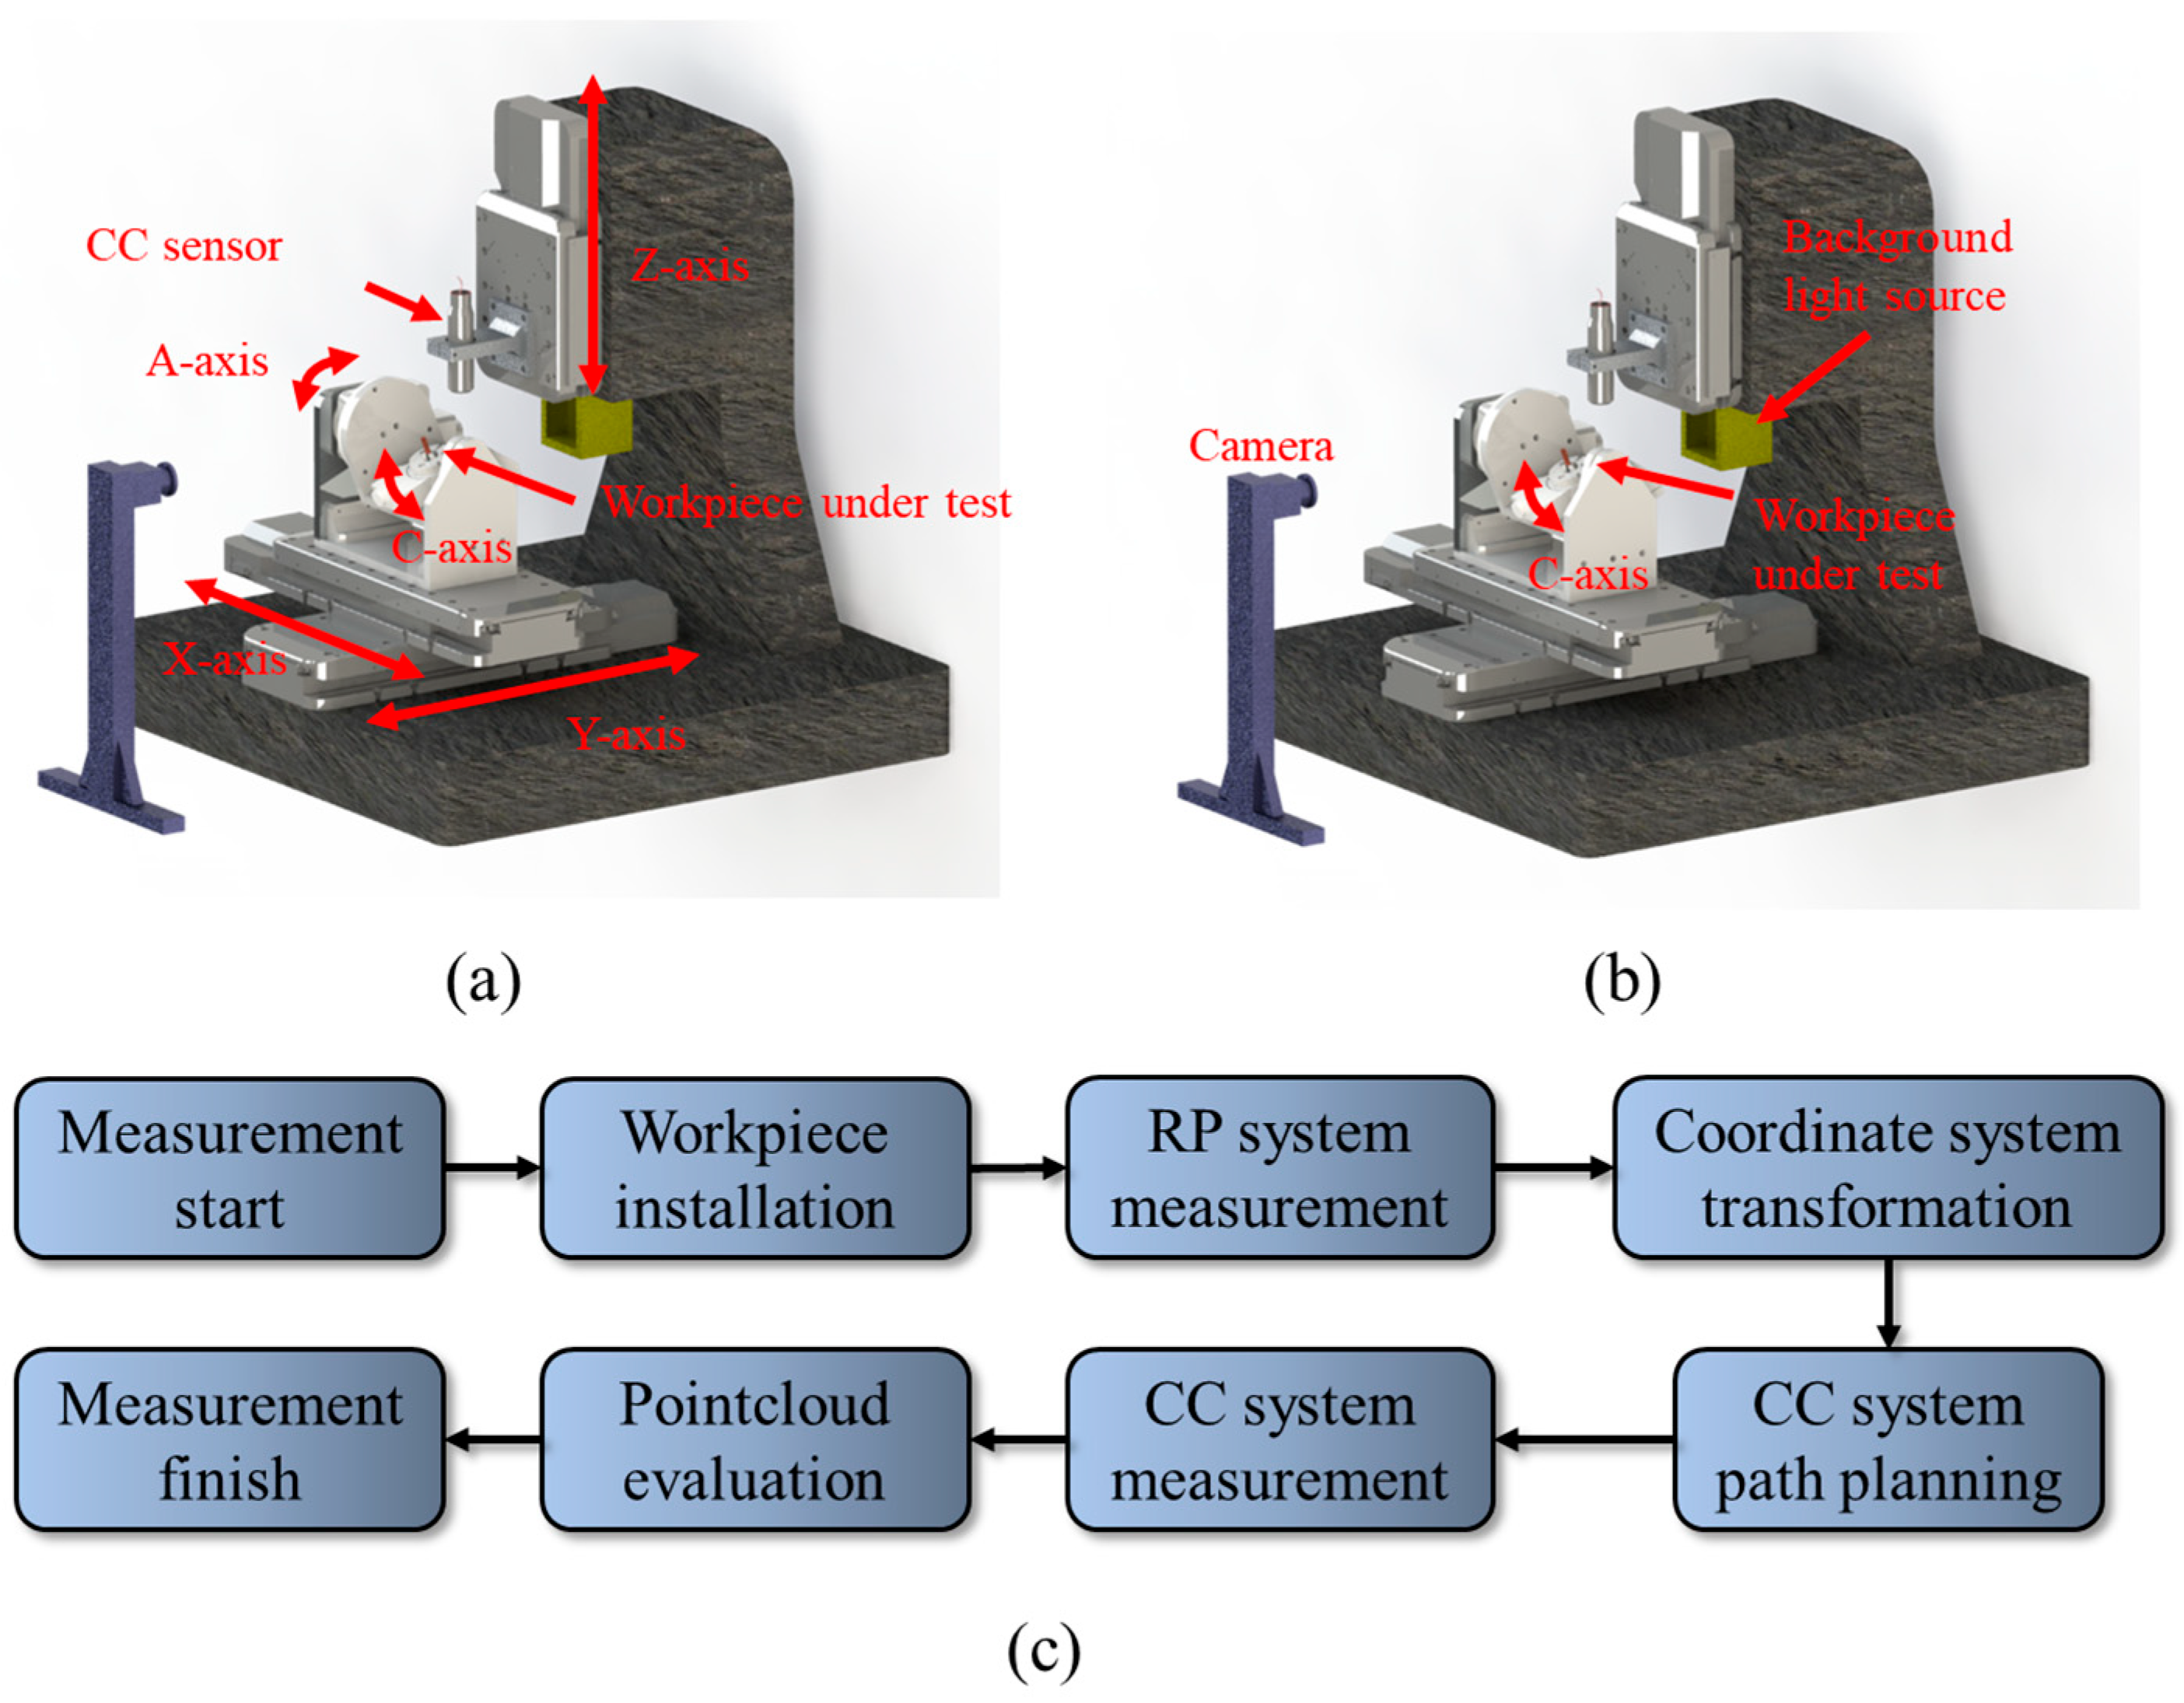
Figure 1. Schematic diagram of the hybrid measurement system. (a) Composition of the CC system. (b) Composition of the RP system. (c) Measurement process.
Photonics 12 01140 g001
Figure 2. Principle of pointcloud calculation via RP method.
Photonics 12 01140 g002
Figure 3. The relationship between point cloud intervals and posture measurement. (a) Contours of different workpieces under measurement and specific point intervals. (b) Non-uniform pointcloud intervals in (a). (c) Contours of different poses in specific point intervals.
Photonics 12 01140 g003
Figure 4. Principle of the pointcloud slicing method. (a) Simulated binarized contour image of a spherical rod. (b) The initial cuboid pointcloud. (c) Pointcloud sectioning at a specific projection angle. (d) Reconstructed solid pointcloud of the spherical rod after all slices are applied. (e) Extracted outer contour yielding a hollow pointcloud.
Photonics 12 01140 g004
Figure 5. Simulation of axis calibration for the RP system.
Photonics 12 01140 g005
Figure 6. Dual-system coupling process. (a) Mapping Principle of pointclouds. (b) Workpiece pointcloud in RP coordinate system. (c) Workpiece pointcloud in CC coordinate system. (d) Pointcloud registration and posture adjustment process.
Photonics 12 01140 g006
Figure 7. Experimental setup and software. (a) System device and workpiece under test. (b) Control software of the RP system.
Photonics 12 01140 g007
Figure 8. Standard sphere measurement process. (a) Standard sphere under test. (b) Shadow contour of the sphere at a certain angle. (c) Reconstructed pointcloud of the RP system. (d) Reconstructed pointcloud of the spherical rod.
Photonics 12 01140 g008
Figure 9. Measurement process of the crossed-cylinder workpiece. (a) Image of the workpiece at a certain projection angle. (b) Shadow contour of the workpiece at the same angle. (c) Initial cuboid pointcloud. (d) Pointcloud slicing at a specific projection angle. (e) Reconstructed pointcloud of the workpiece.
Photonics 12 01140 g009
Figure 10. Measurement results of the CC system assisted by the pre-measurement system. (a) Measurement result of a cylindrical workpiece. (b) Measurement result of a standard sphere. (c) Measured pointcloud of the crossed-cylinder workpiece. (d) Measurement result of the crossed-cylinder workpiece. (e) Measurement pointcloud of the micro-triangular-pyramid workpiece. (f) Measurement result of the micro-triangular-pyramid workpiece.
Photonics 12 01140 g010
Table 1. Key parameters of the experimental setup.
SystemsParametersValues
RP systemCamera resolution4096 × 2160
Telecentric degree of lens0.1°
Field of view40 mm × 40 mm × 30 mm
CC systemStroke of the X/Y/Z stages100 mm
Positioning accuracy of the X/Y/Z axes1.0 μm
Angular range of the A/C stages180°/360°
Angular positioning accuracy of the A/C axes±10″
Range of the CC sensor150 μm
Allowable angle range of the sensor±45°
Table 2. Repeated measurement results of the cylinder and the sphere.
TimesCylinderSphere
RP SystemCC SystemRP SystemCC System
11.3 μm0.3 μm1.8 μm1.1 μm
21.3 μm0.3 μm1.3 μm−0.9 μm
31.2 μm0.4 μm−1.3 μm−0.7 μm
4−0.2 μm0.4 μm1.7 μm1.0 μm
5−0.3 μm0.3 μm1.8 μm0.9 μm
Disclaimer/Publisher’s Note: The statements, opinions and data contained in all publications are solely those of the individual author(s) and contributor(s) and not of MDPI and/or the editor(s). MDPI and/or the editor(s) disclaim responsibility for any injury to people or property resulting from any ideas, methods, instructions or products referred to in the content.