5.1. Experimental Design
To investigate the applicability of the spindle-type FBG pressure sensor proposed herein in practical engineering scenarios, an experimental study on a scaled model of the foundation ring-type wind turbine foundation was conducted. This study adopted a 2 MW foundation ring-type wind turbine foundation from a wind farm in Guizhou Province as the prototype. For the scaled model of the foundation ring-type wind turbine foundation, its geometric, material, and load parameters were determined based on similarity ratio principles under analogous environmental conditions [
19].
The scaled model of the wind turbine foundation meets the similarity conditions in three aspects: geometry, physics and boundary, which are specified as follows:
Among them, Sμ is the similarity constant of displacement μ, Sε is the similarity constant of linear strain ε, SL is the similarity constant of geometric length L, Sγ is the similarity constant of angular strain γ, Sσ is the similarity constant of elastic stress σ, SE is the similarity constant of elastic modulus E, Sτ is the similarity constant of shear stress τ, SG is the similarity constant of shear modulus G, Sp is the similarity constant of concentrated force p, SP is the similarity constant of concentrated force P, SM is the similarity constant of bending moment M.
Accounting for constraints of the experimental environment, a 1:20 geometric similarity ratio was employed for the scaled model’s construction, with the structural dimensions of the scaled model detailed in
Table 2. The tower of the wind turbine model was made of Q345-D steel, while C35 concrete was specified for the model foundation.
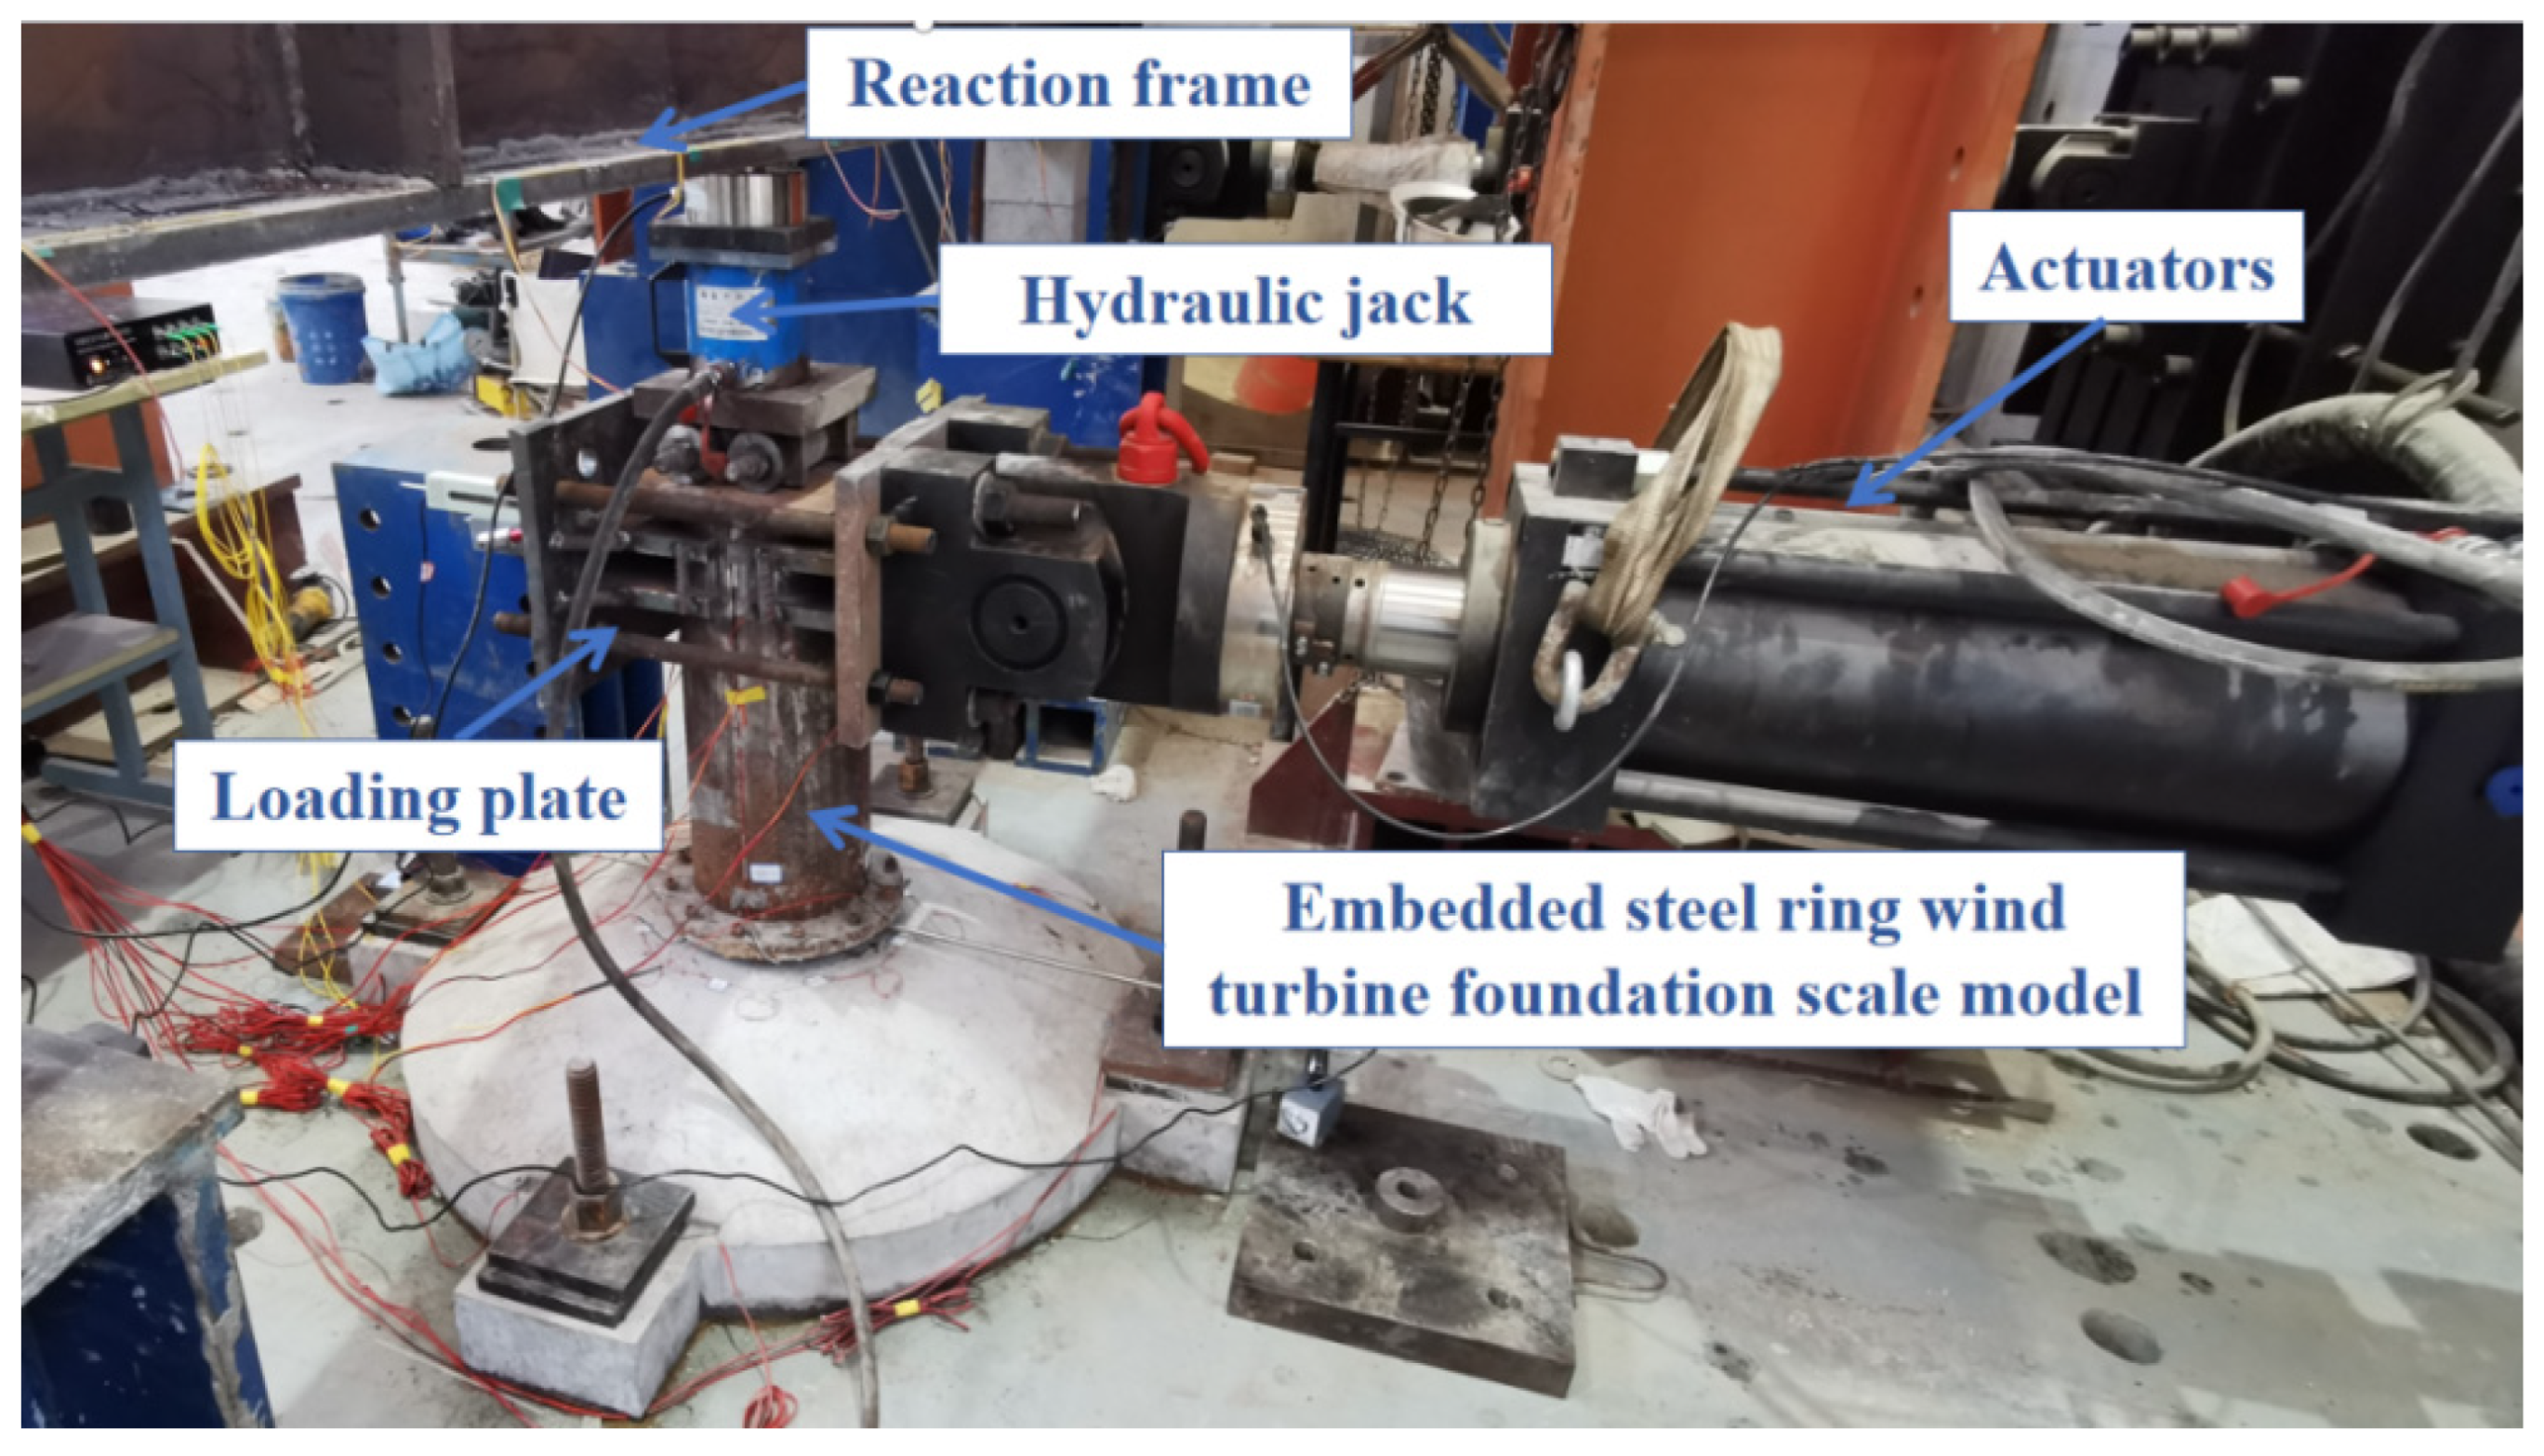
As shown in
Figure 12, a 25-ton MTS actuator was used in the experiment to apply a horizontal load at the 70 mm-high loading plate on top of the tower. A thin-type hydraulic jack (Model: RCS-502; maximum load capacity: 50 tons) was fixed to the upper part of the wind turbine model via a reaction frame to apply a vertical load. According to existing research on the concrete deterioration mechanism of foundation ring-type wind turbine foundations, the foundation ring–concrete interface debonding initiates when the wind speed reaches 20 m/s. Based on
Table 3, the horizontal equivalent load under this wind speed is 90.67 kN. The measured wind speed spectrum of a wind farm in Guizhou Province was used to determine that the average annual wind speed during the wind turbine’s service life is approximately 7 m/s, which translates to an equivalent static wind load of 20.93 kN at the top of the tower.
The experimental loading was divided into two phases:
Static loading phase: Loading was conducted in 17 stages at a rate of 5 kN/min, following the wind speed equivalent loads specified in
Table 3, until the load reached 90.67 kN.
Fatigue loading phase: A low-cycle cyclic load of ±20.93 kN was applied to the tower at a loading rate of 125.58 kN/min.
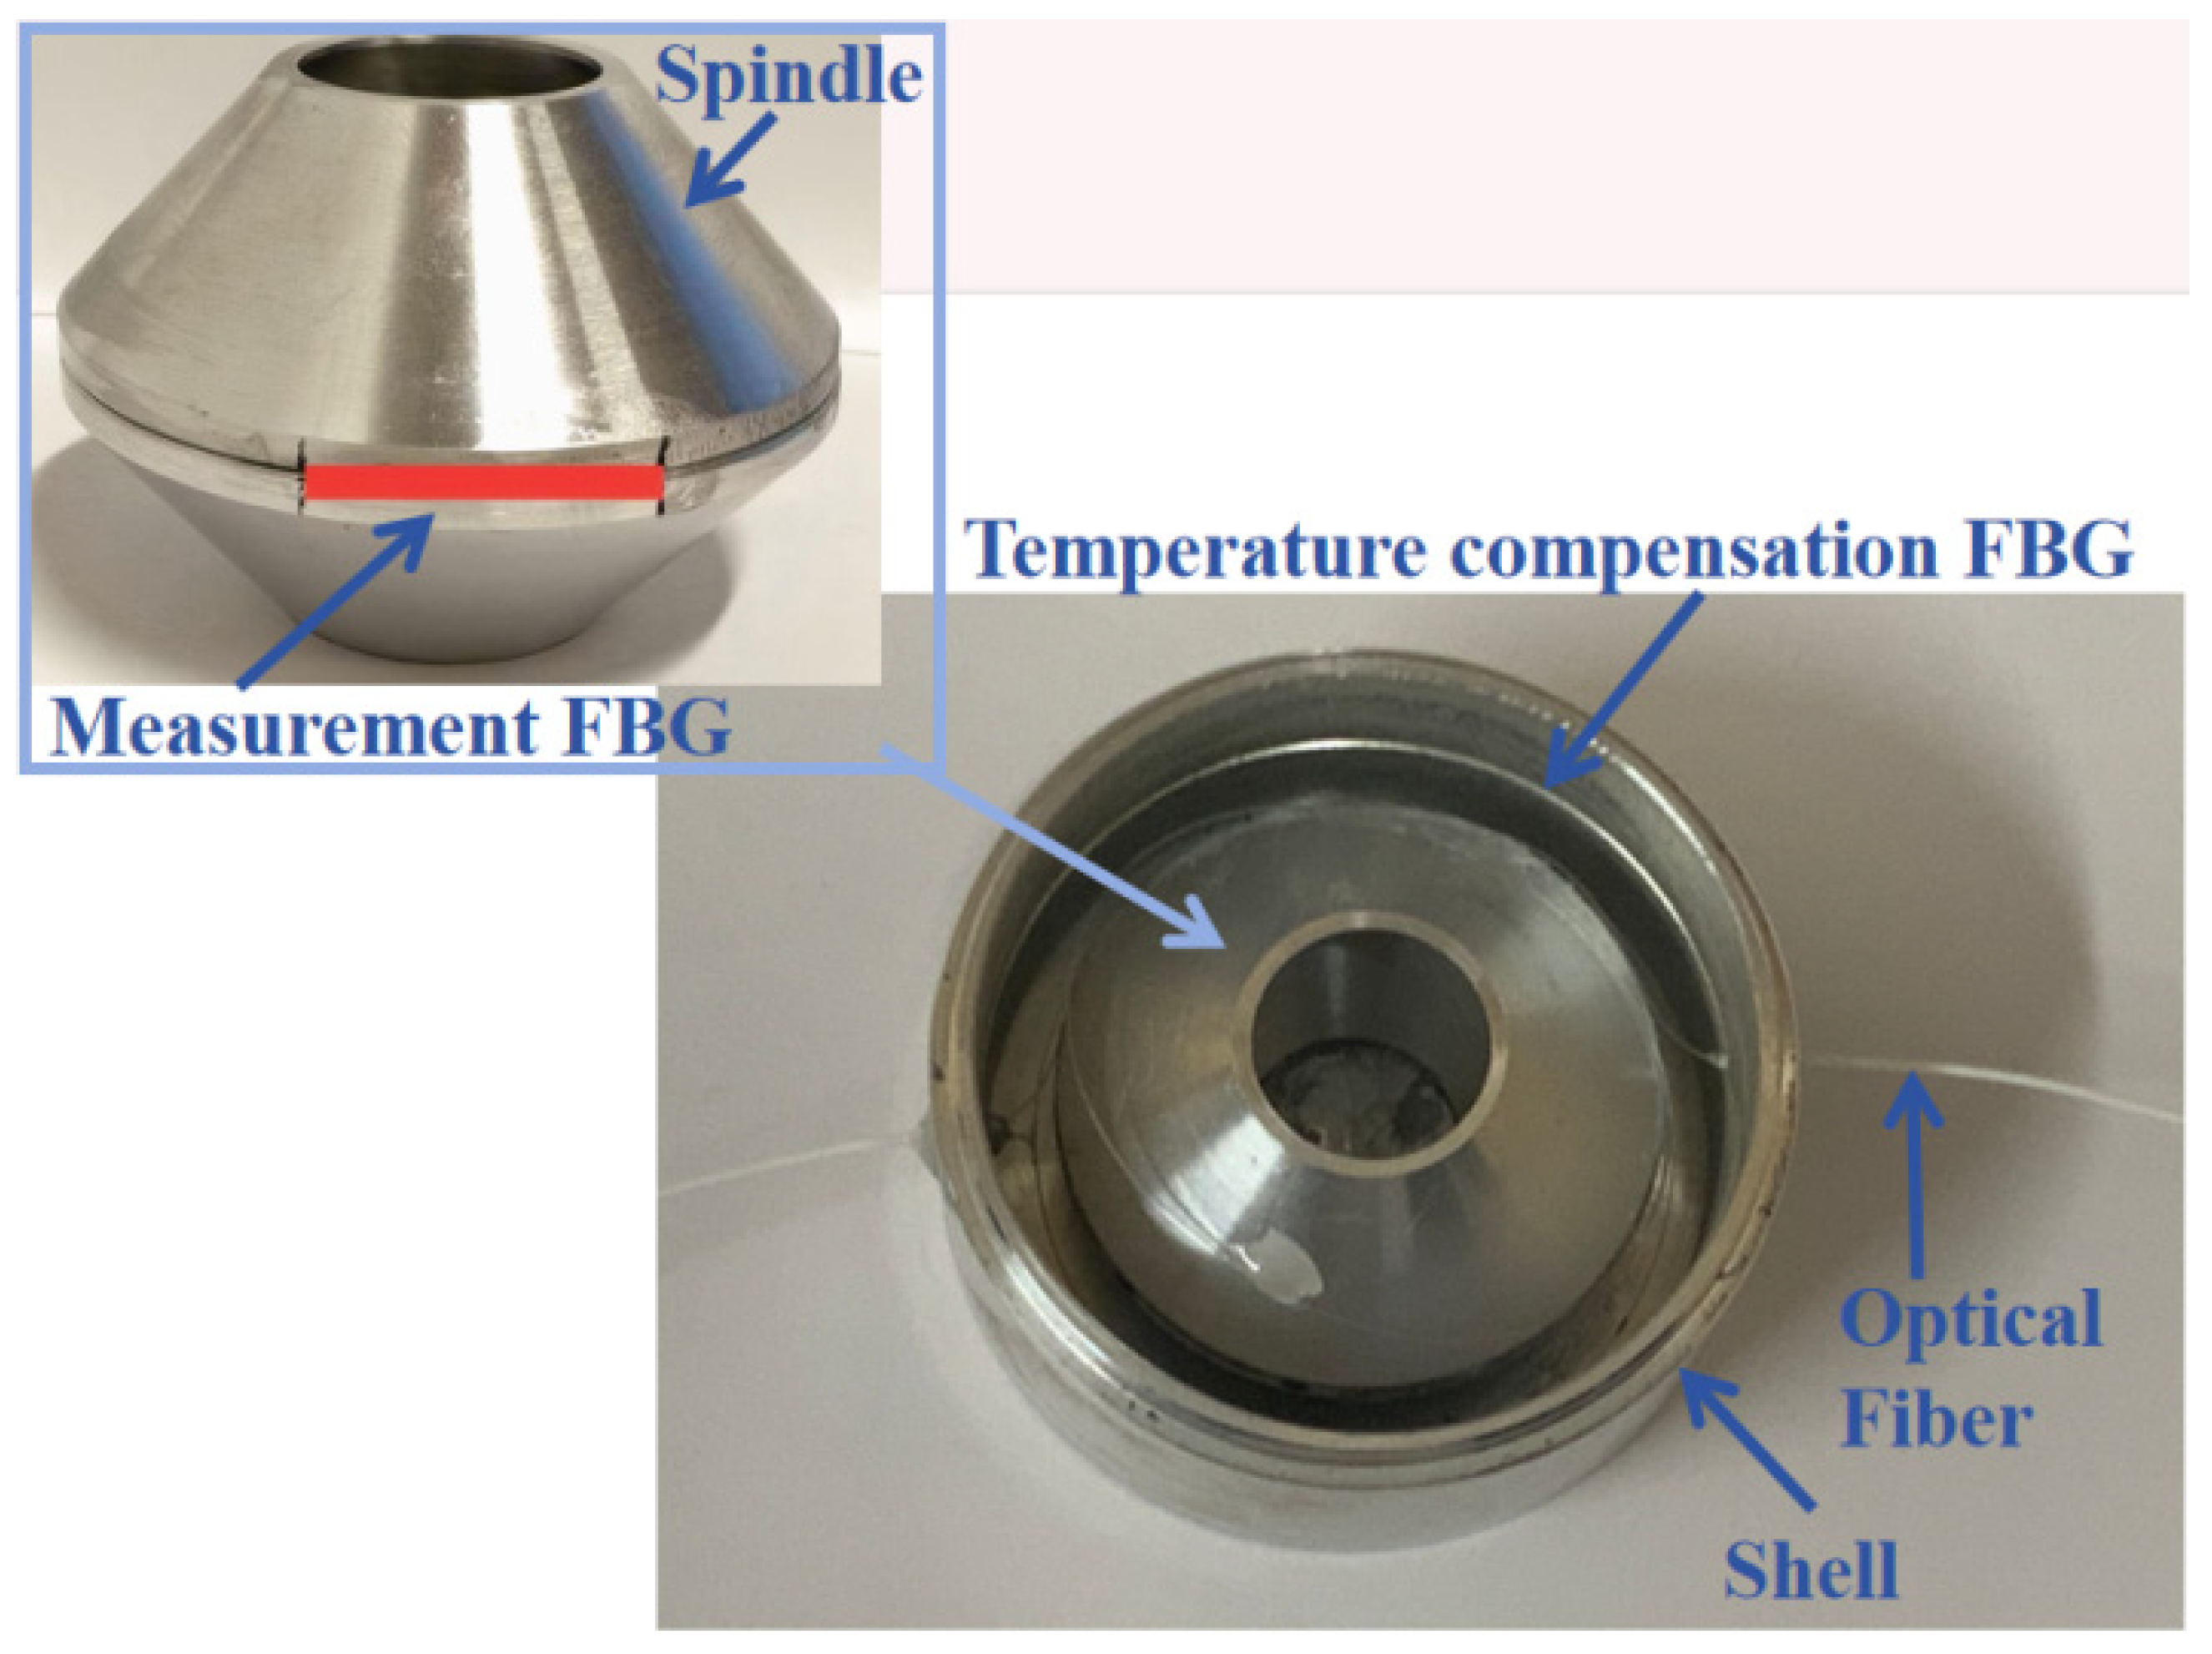
The spindle-type FBG pressure sensor proposed in this study was used to monitor the pressure signal changes at the foundation ring–concrete interface during the wind turbine’s simulated service process, so as to verify the service performance of the spindle-type FBG pressure sensor in practical engineering scenarios. Signals from the spindle-type FBG pressure sensor were acquired using an FBG demodulator.
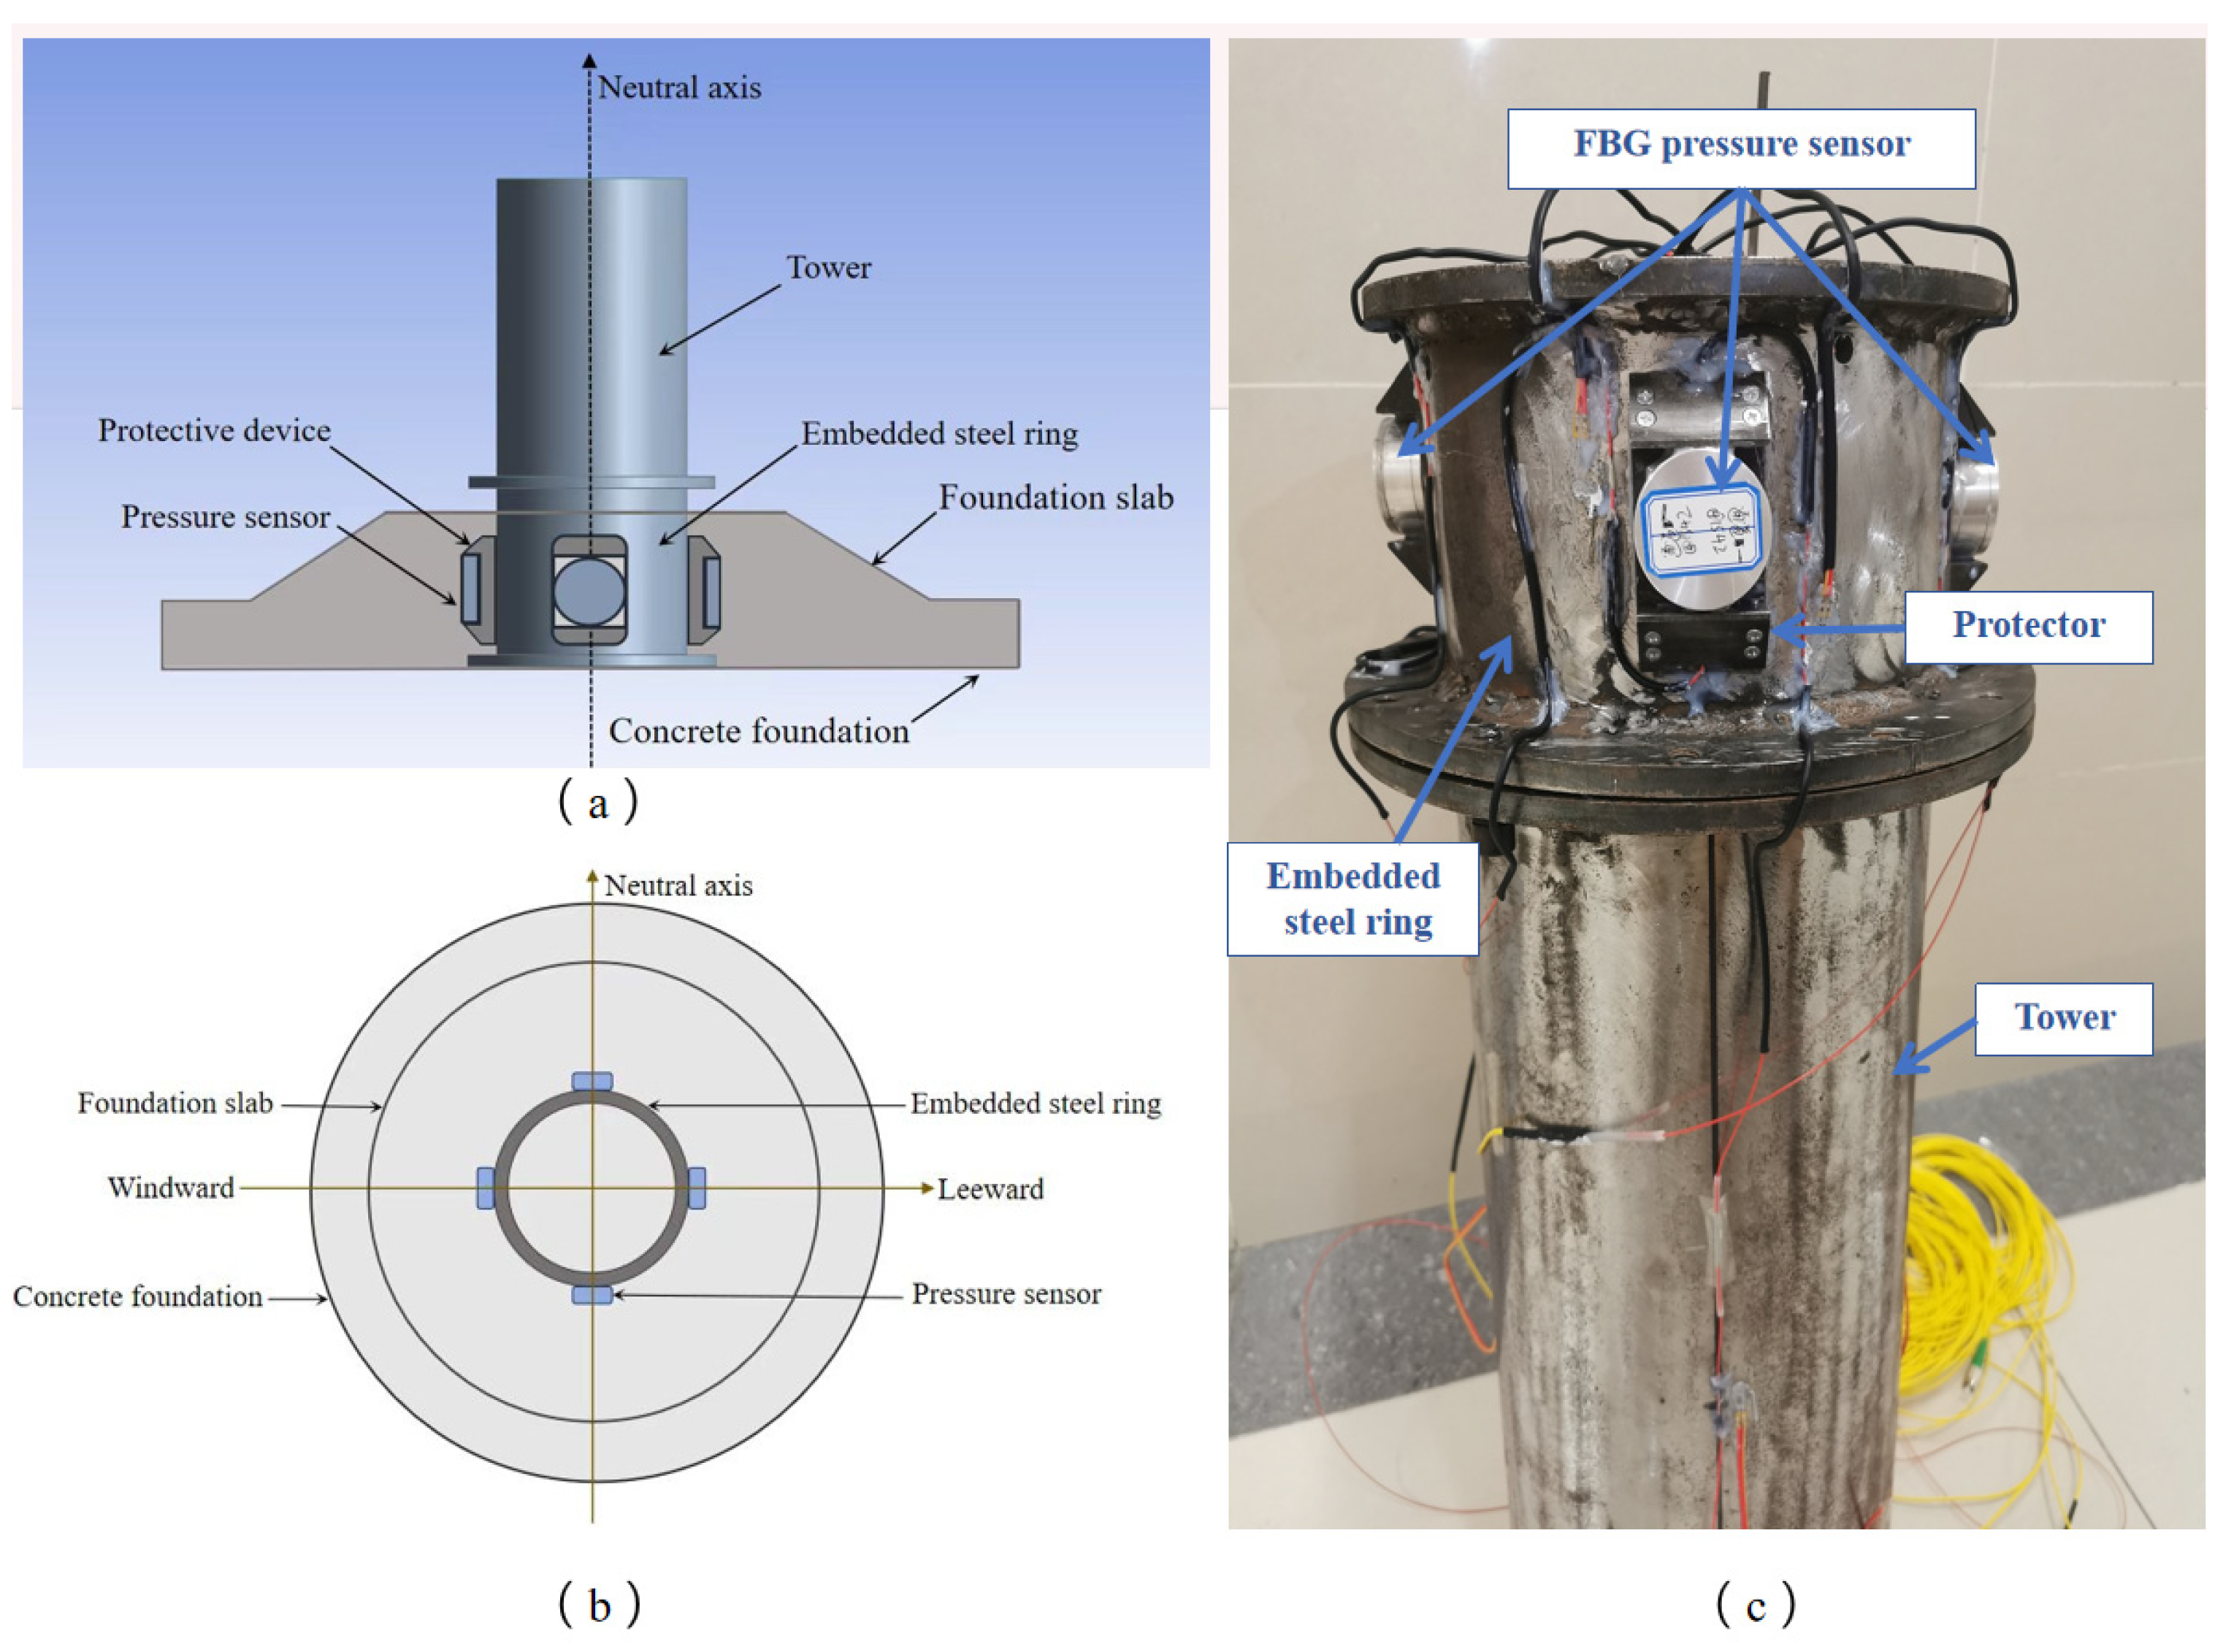
Based on the actual service conditions of wind turbines, the debonding at the foundation ring–concrete interface is found to first occur on the windward and leeward sides. Although the structural response along the neutral axis is minimal, it can still be used to detect deviations of the wind turbine tower. In this study, the action position of the MTS actuator was defined as the windward side in the wind turbine’s operating scenario, while the position 180° opposite to the windward side was designated as the leeward side. For this test, the spindle-type FBG pressure sensors proposed in this paper were installed at four angular positions on the cross-section of the foundation ring structure: windward side, positive neutral axis, leeward side, and negative neutral axis (see
Figure 13). To enhance the survival rate of the pressure sensors and ensure their tight adhesion to the foundation ring surface, a groove-type sensor protection device was employed to maintain the sensors’ normal operation.
5.2. Analysis of Experimental Results
Based on the temperature influence elimination method presented in
Section 4.2, this study used the wavelength variation in the temperature compensation grating inside the spindle-shaped FBG pressure sensor to determine the extent of temperature influence. Pressure-induced data were extracted by subtracting the central wavelength variation in the temperature compensation grating from that of the temperature-measuring grating. After eliminating temperature effects from the wavelength variations in the variations of the measuring gratings in the spindle-type FBG pressure sensors at the leeward side, windward side, and neutral axis, the monitoring data of these sensors under pressure influence were plotted in
Figure 14,
Figure 15,
Figure 16 and
Figure 17. Since the wavelength variations in the pressure sensors at the neutral axis were nearly identical, only the wavelength variation trend of the sensor at the positive neutral axis is presented herein.
Figure 13.
Layout plan for pressure sensors: (a) Lateral view schematic diagram; (b) Top view schematic diagram; (c) On-site physical picture.
Figure 13.
Layout plan for pressure sensors: (a) Lateral view schematic diagram; (b) Top view schematic diagram; (c) On-site physical picture.
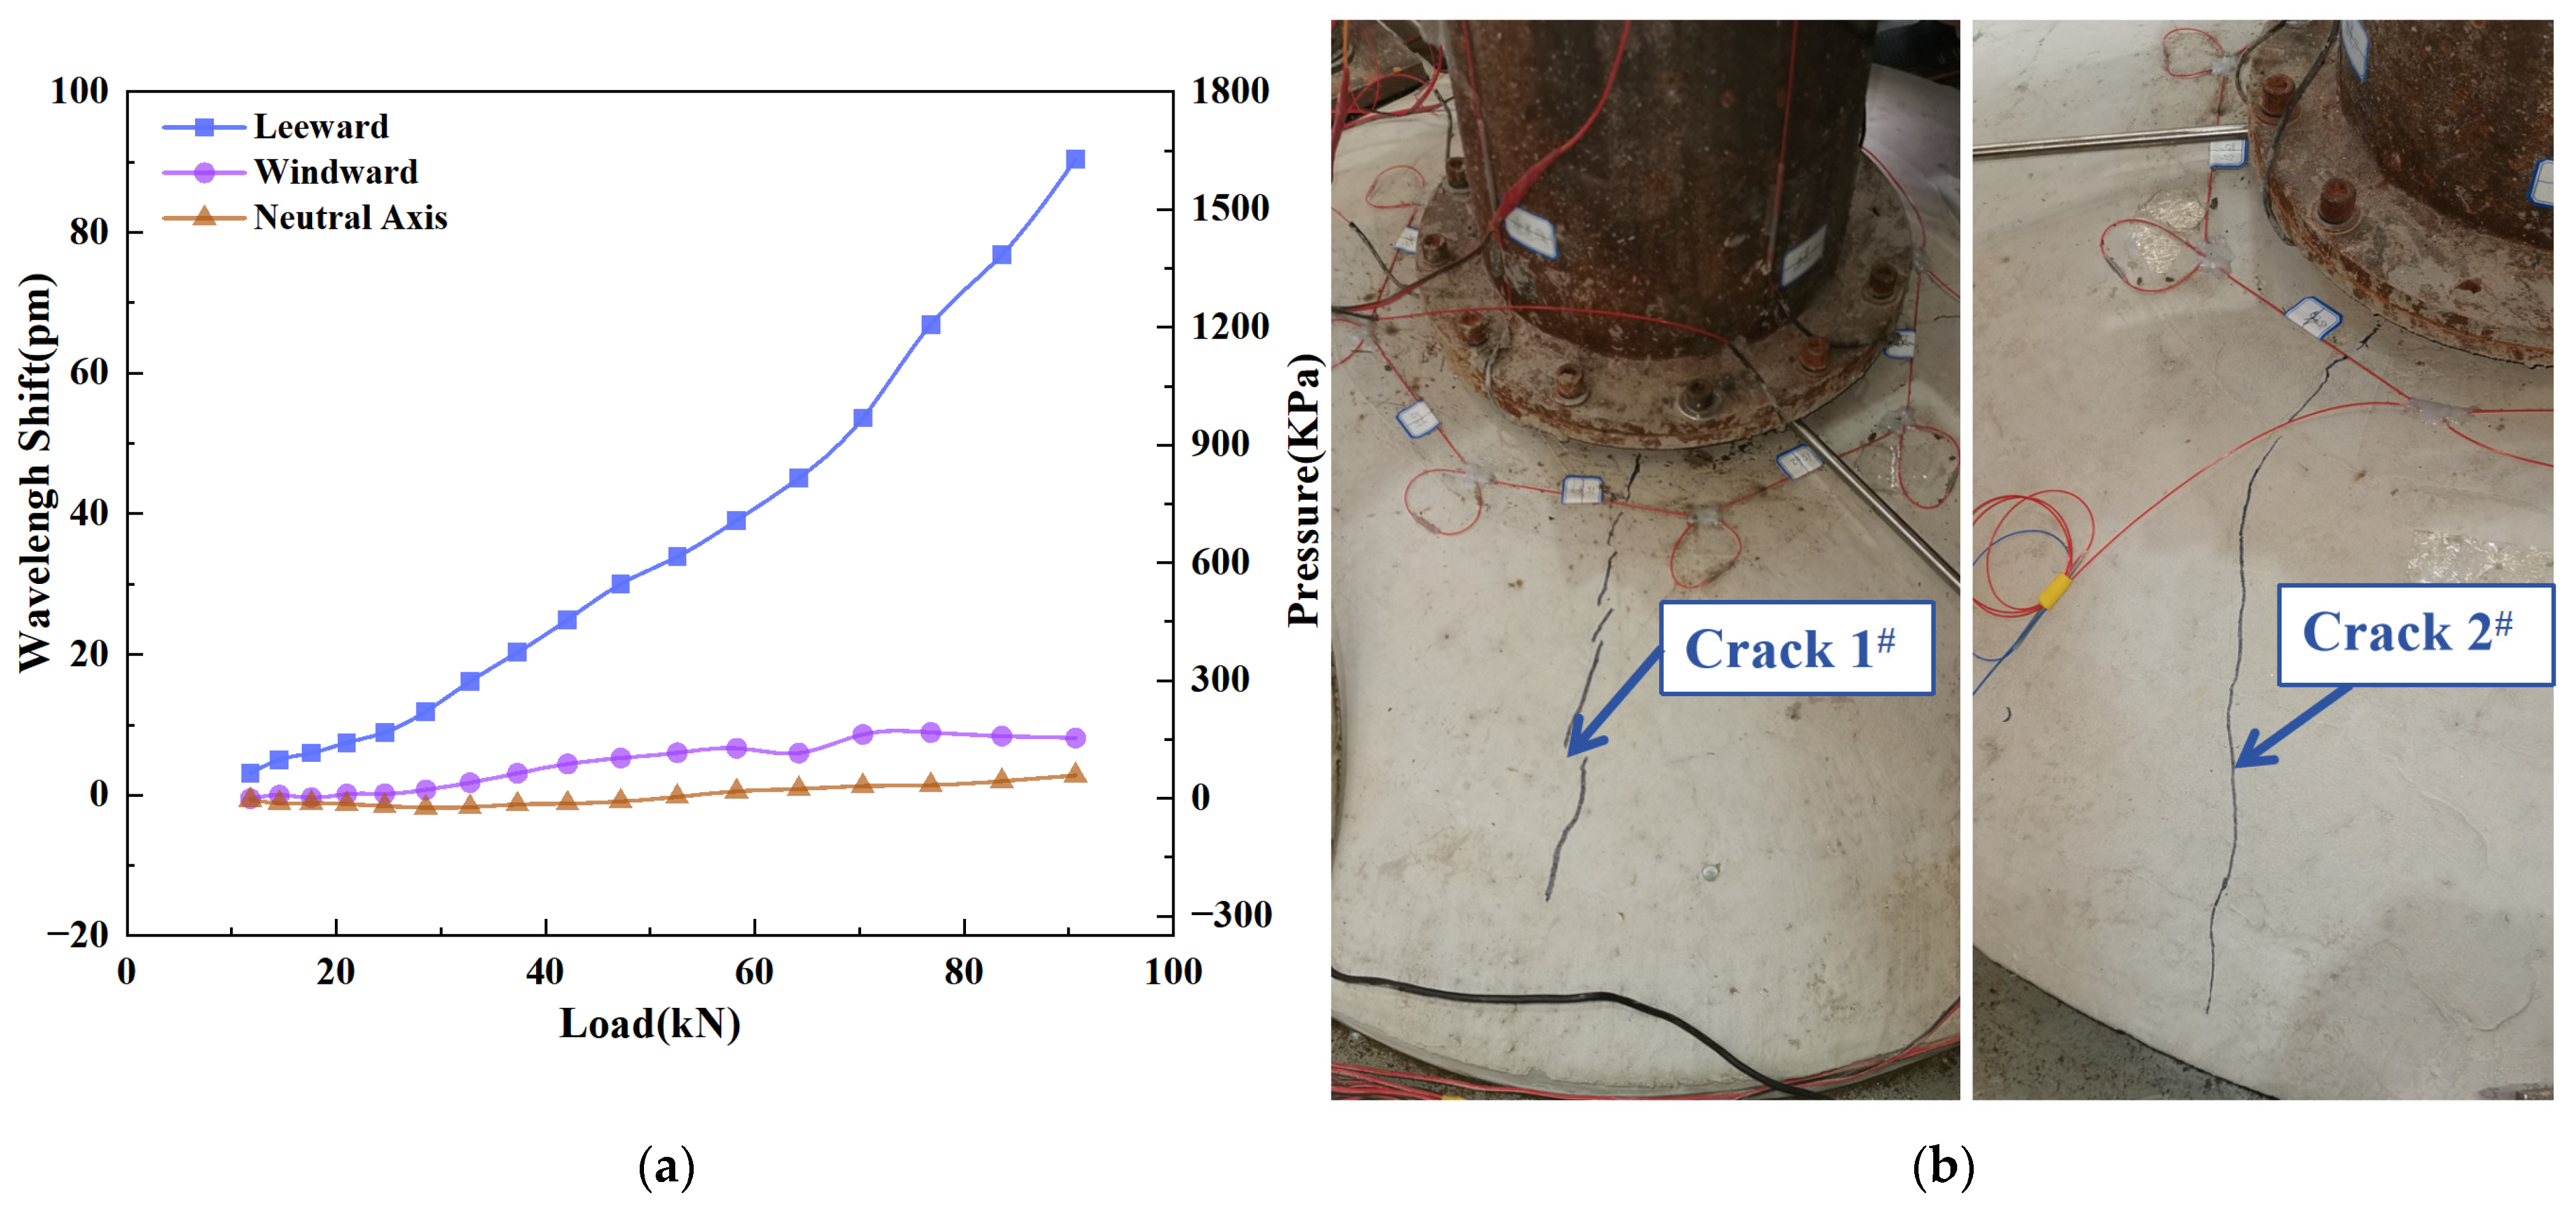
Figure 14.
Results of the wind turbine foundation in static loading stage: (a) Monitoring data of FBG pressure sensors; (b) Cracks at the concrete platform.
Figure 14.
Results of the wind turbine foundation in static loading stage: (a) Monitoring data of FBG pressure sensors; (b) Cracks at the concrete platform.
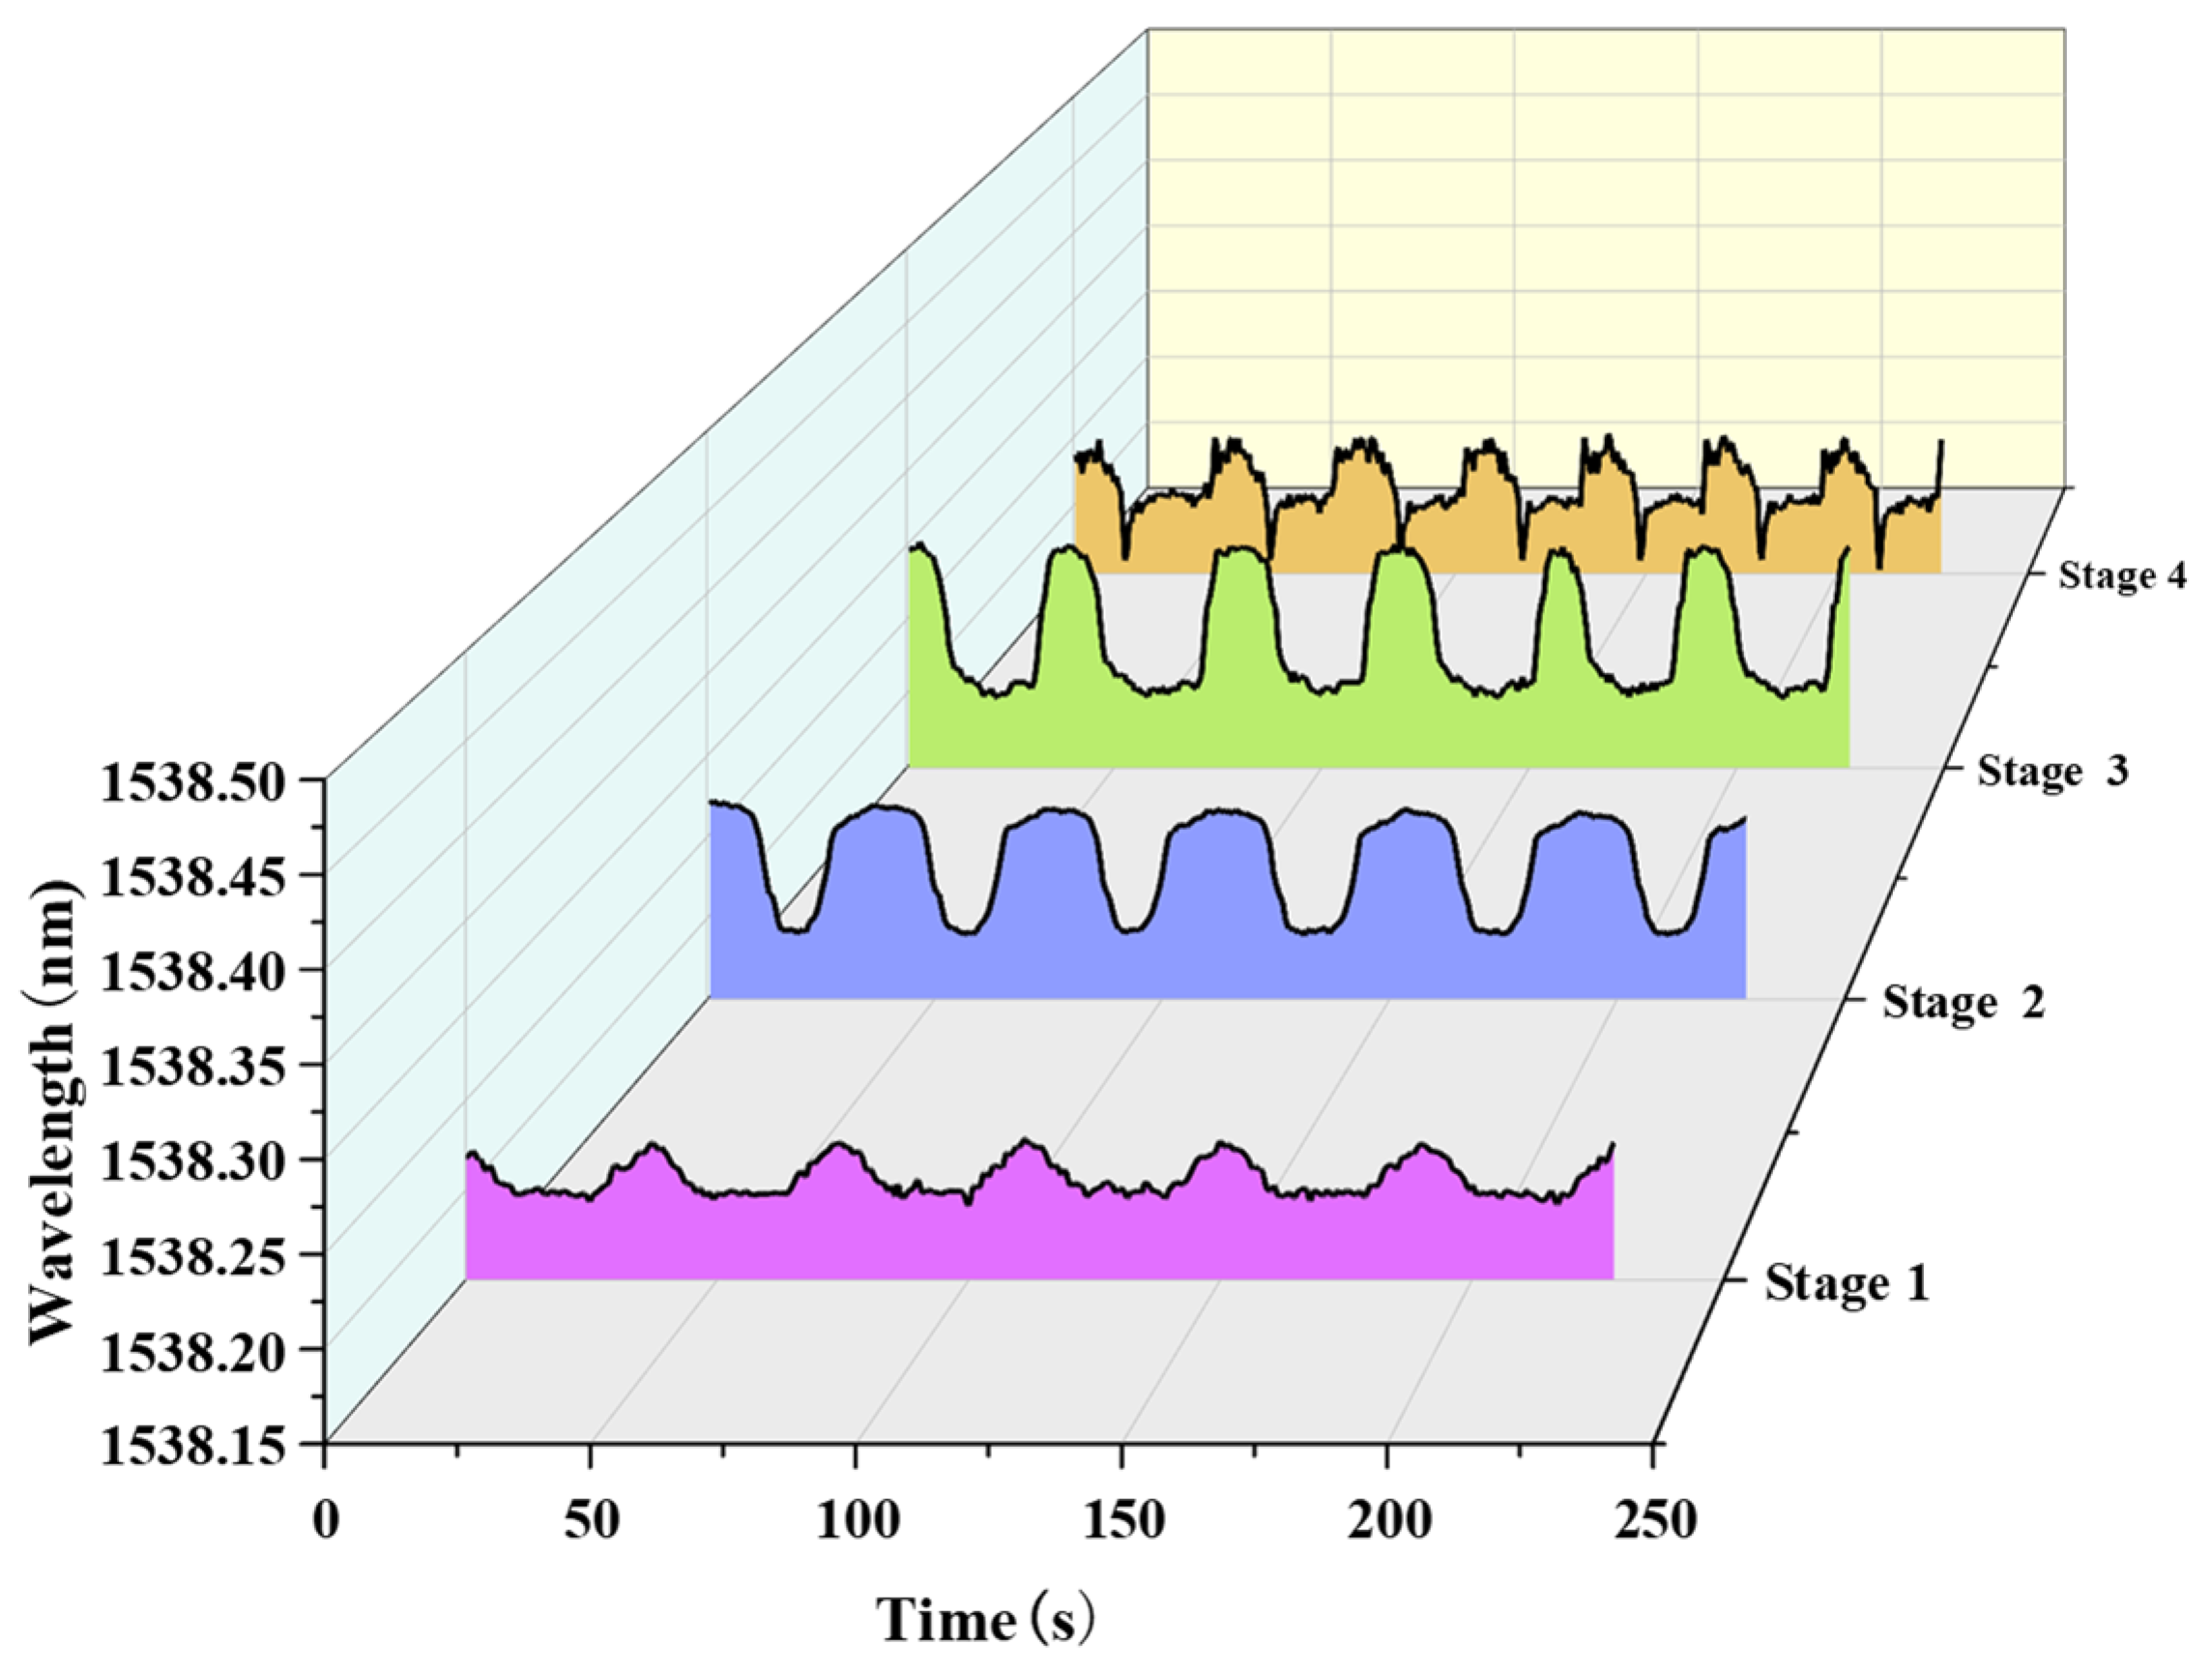
Figure 15.
FBG pressure sensor monitoring data of leeward side at each stage.
Figure 15.
FBG pressure sensor monitoring data of leeward side at each stage.
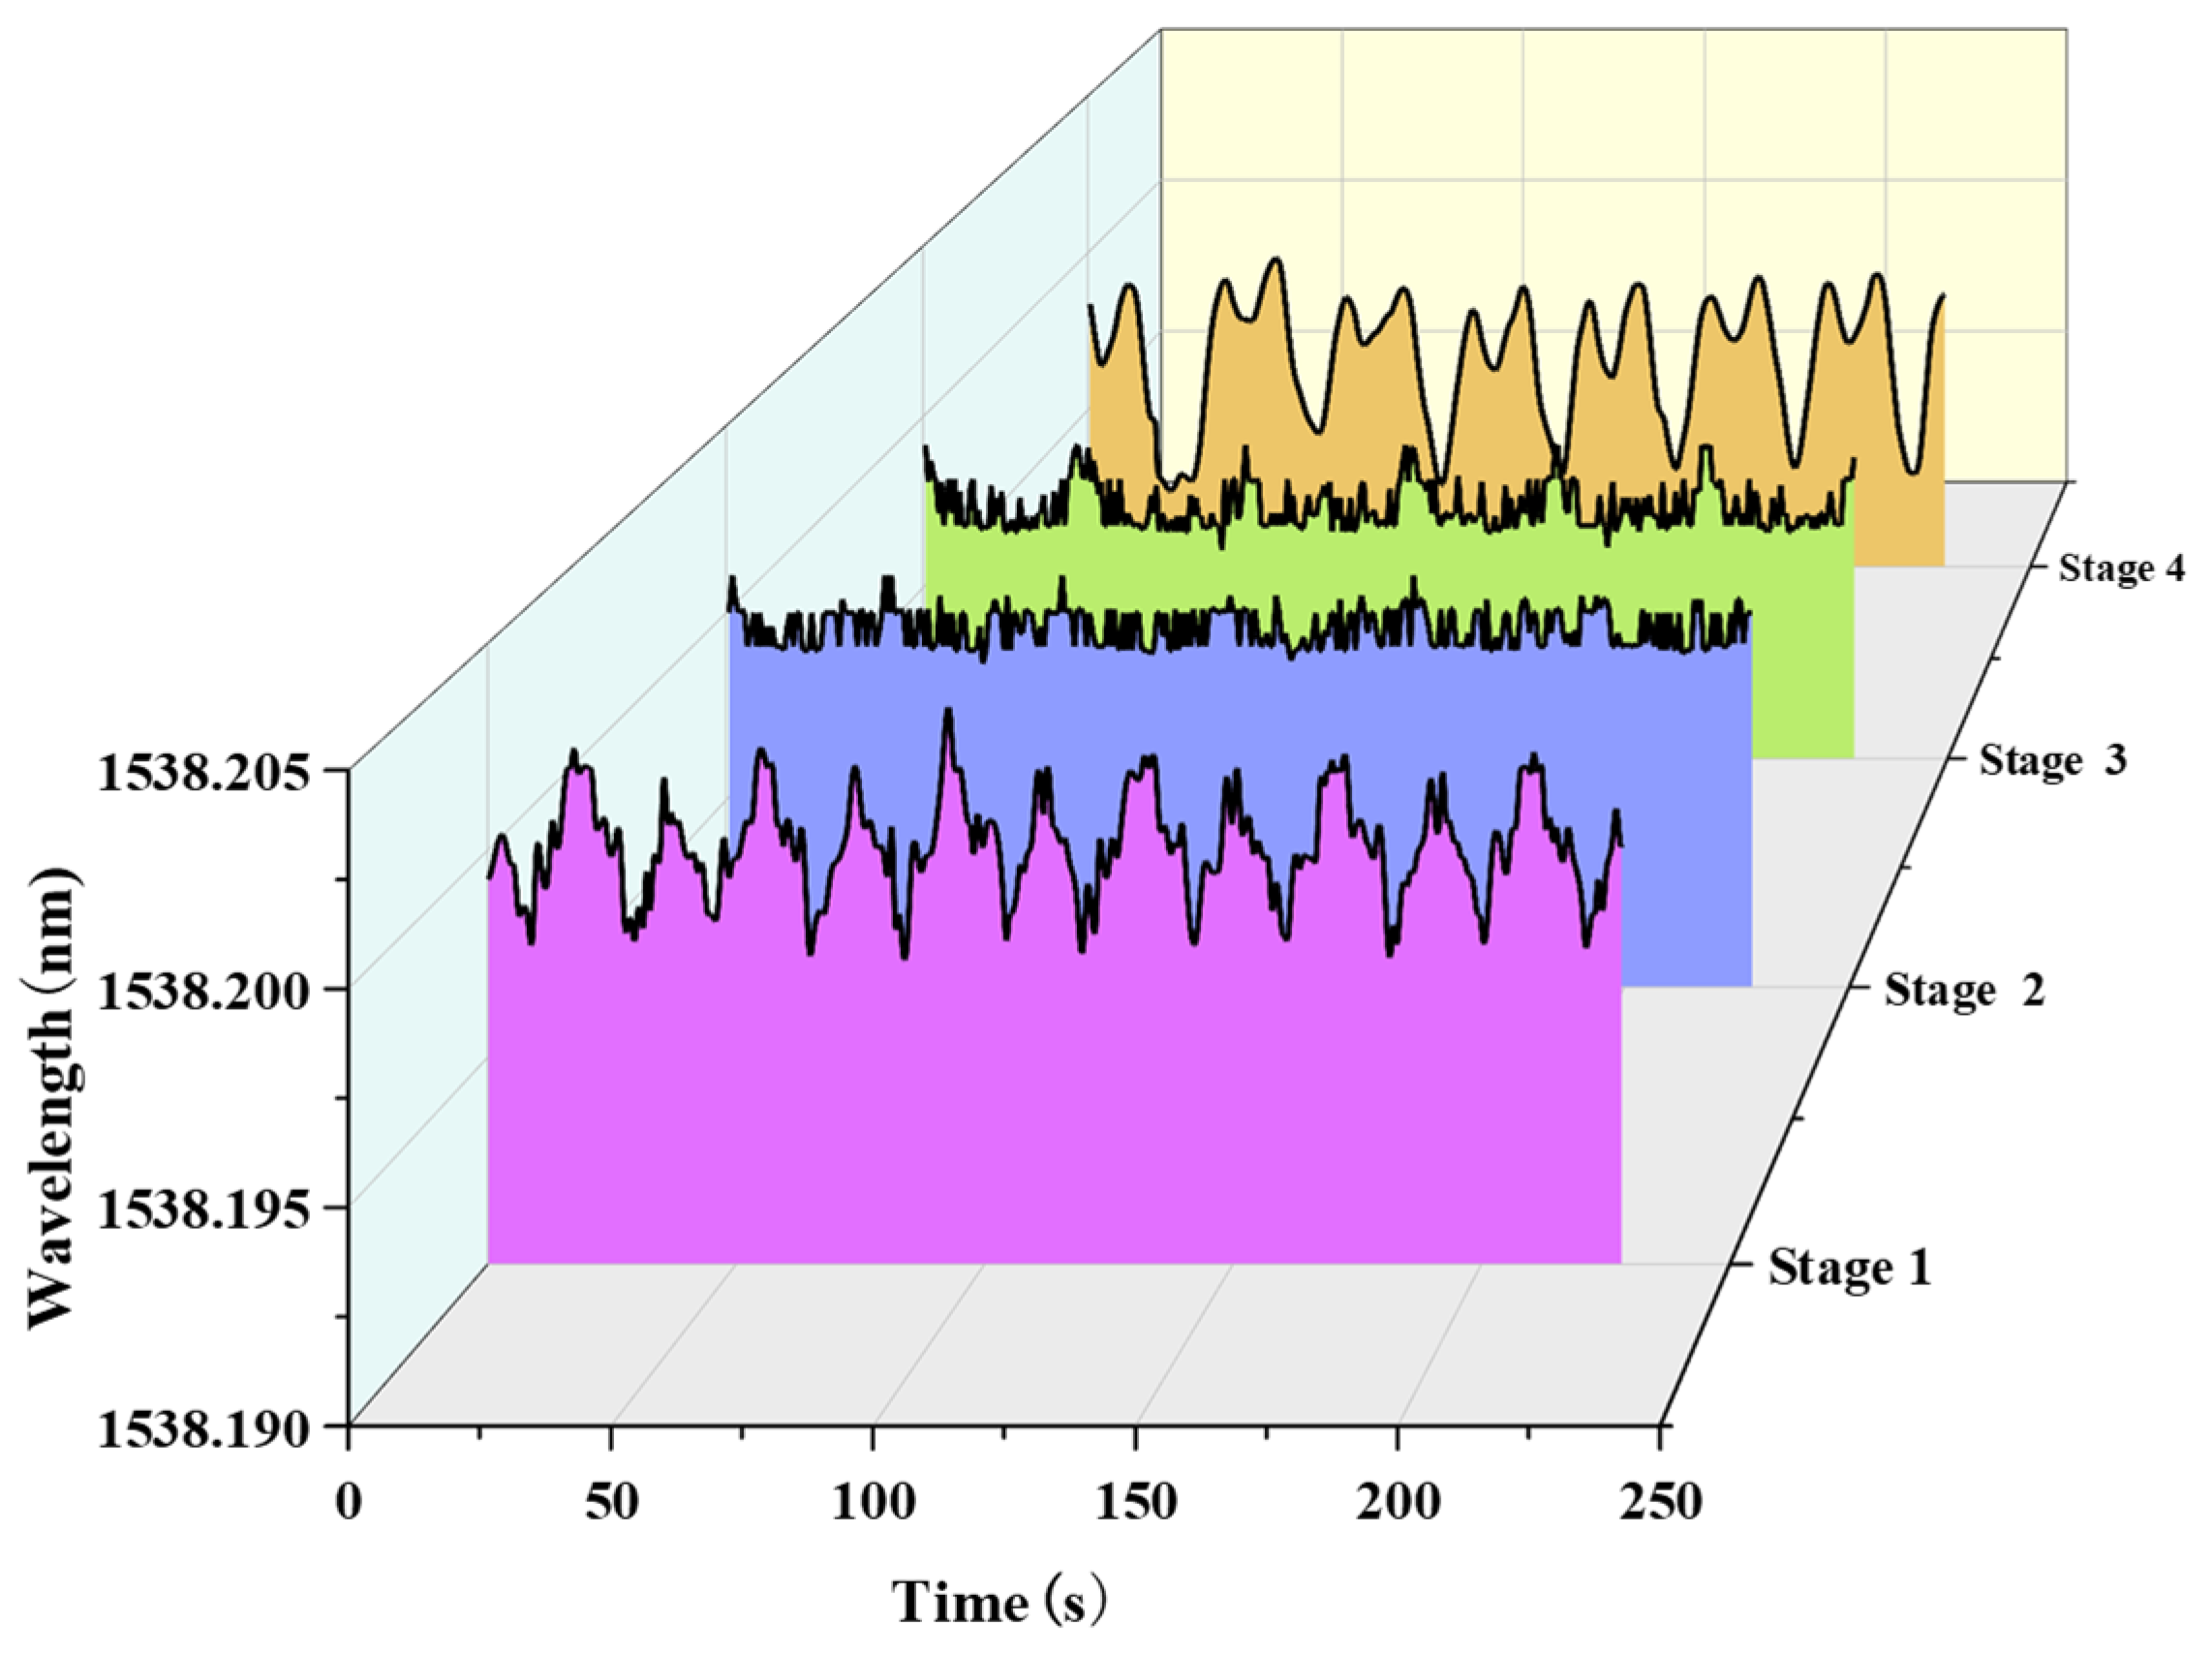
Figure 16.
FBG pressure sensor monitoring data of windward side at each stage.
Figure 16.
FBG pressure sensor monitoring data of windward side at each stage.
Figure 17.
FBG pressure sensor monitoring data of neutral axis at each stage.
Figure 17.
FBG pressure sensor monitoring data of neutral axis at each stage.
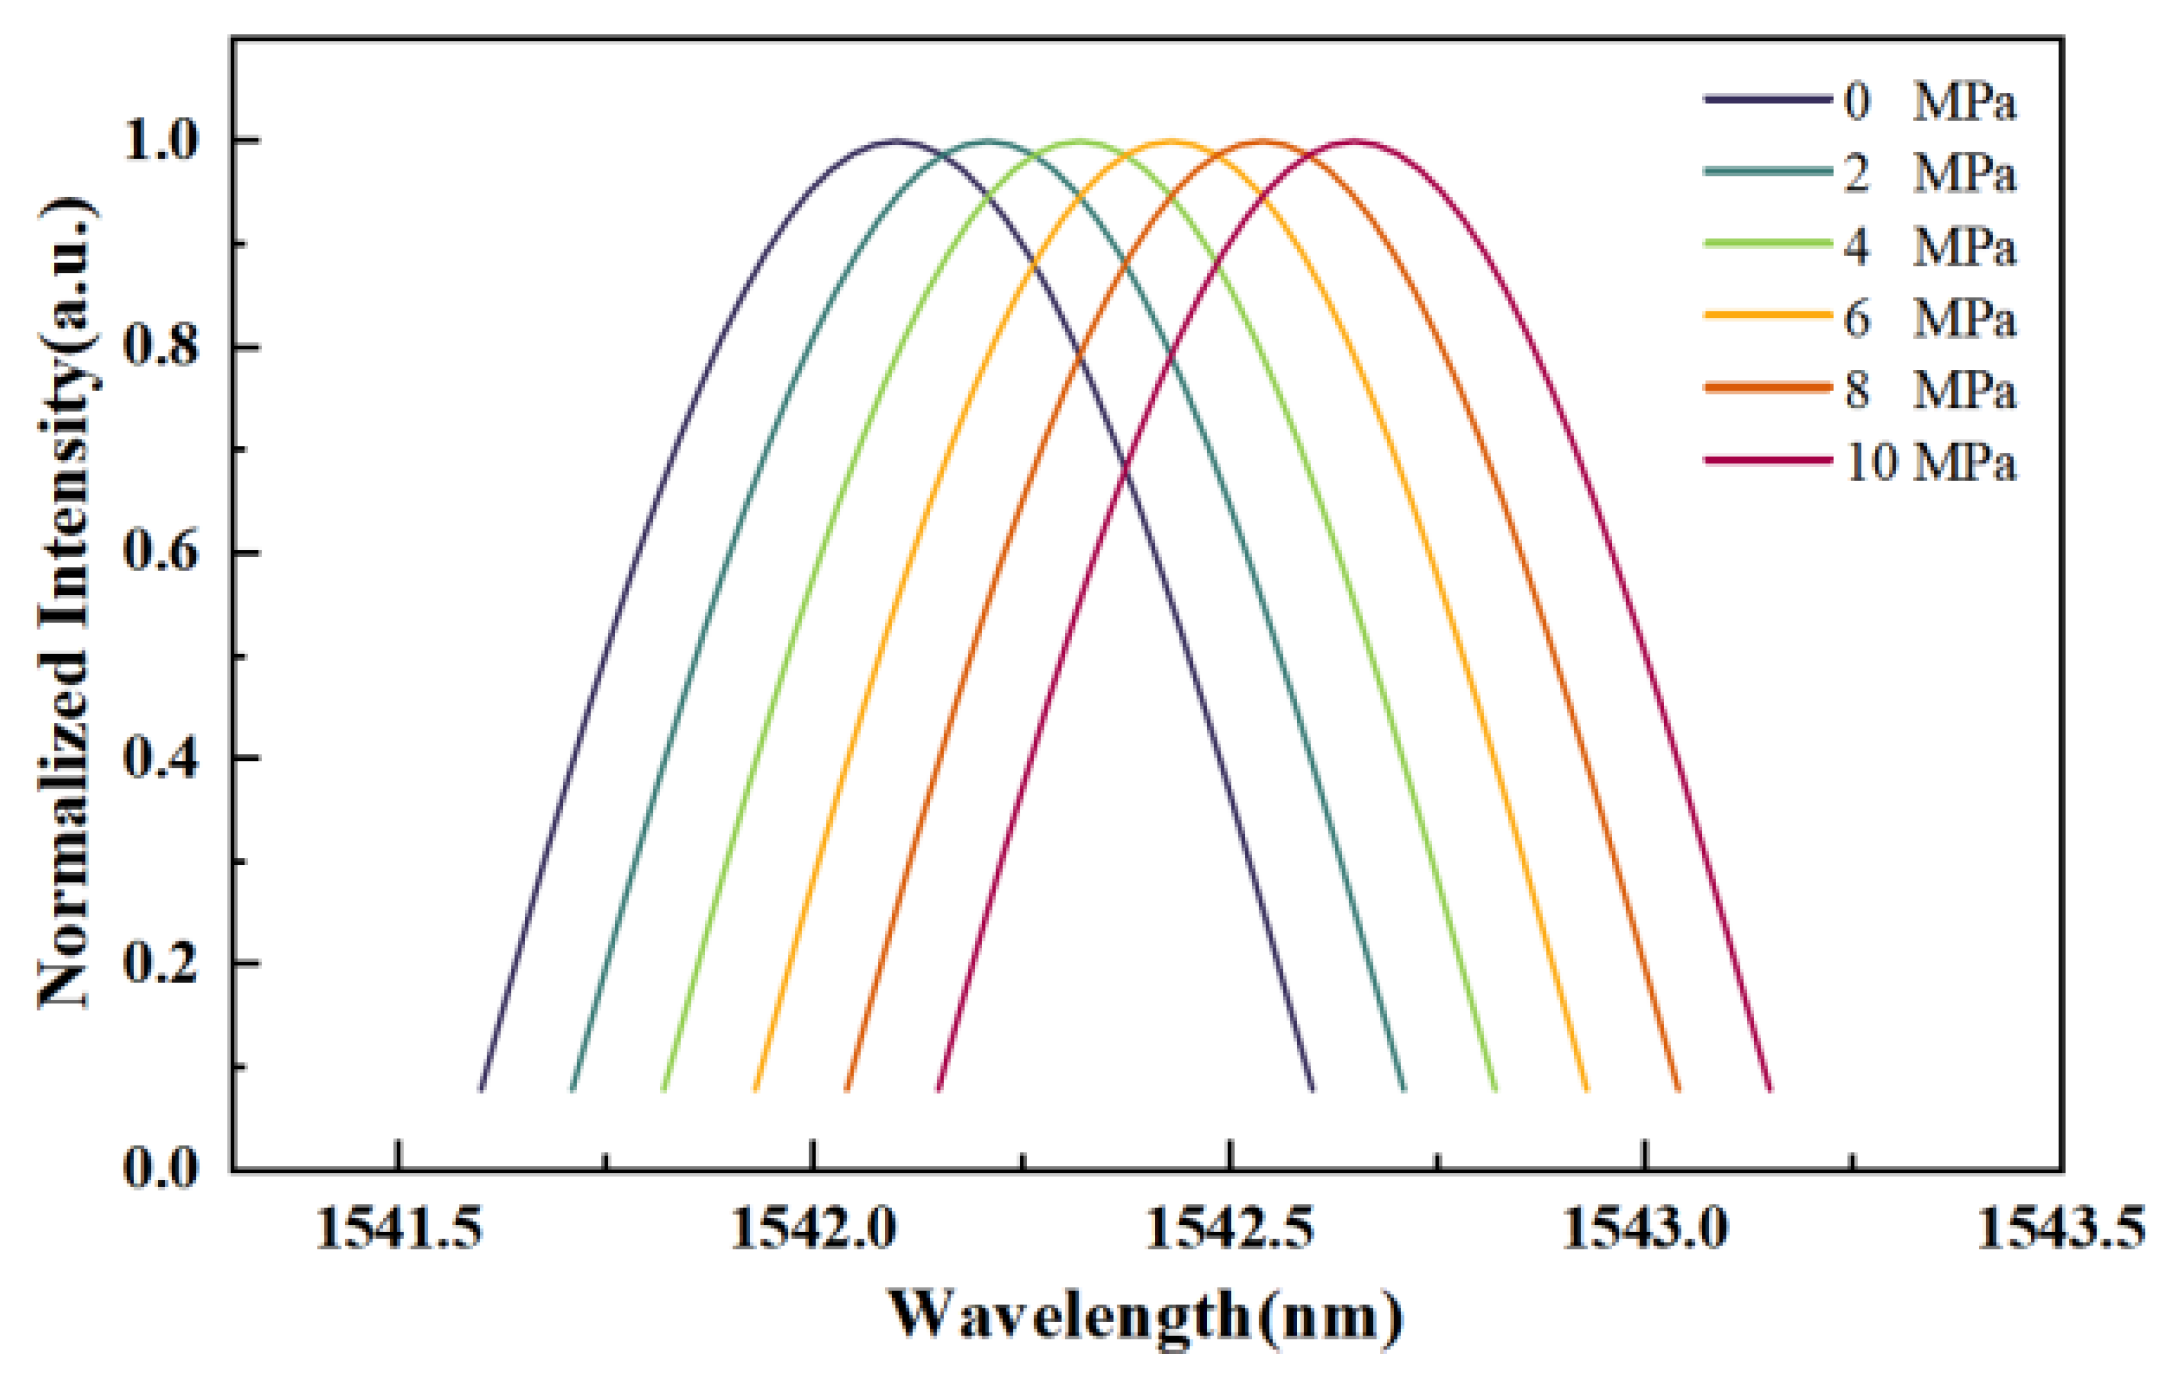
Figure 14a shows the FBG pressure sensor monitoring data under different load levels during the static loading stage. Using Equation (3) and the FBG pressure sensor sensitivity of 55.01 pm/MPa, the monitoring data were processed to obtain the pressure values at the interface between the foundation ring and concrete at each stage. The wavelength of the FBG pressure sensor on the leeward side of the foundation ring increased linearly with the increment of load. This phenomenon indicates that the pressure at the interface between the foundation ring and concrete on the leeward side of the foundation ring-type wind turbine is positively correlated with wind load. When the horizontal load reached 90.67 kN, the monitoring data of the FBG pressure sensor increased to 1.64 MPa. According to the theoretical bearing capacity of the foundation ring-type wind turbine, cracks should have appeared in the concrete cap at this point.
As shown in
Figure 14b, when the horizontal load reached 64.23 kN, visible cracks occurred at the 210° and 305° positions of the concrete cap. With the increase in load, Crack 1# at 210° and Crack 2# at 305° of the concrete cap propagated until radial cracks formed. During the static loading test stage, the monitoring data of the pressure sensors at the windward side and neutral axis remained approximately around 0 kPa. This data characteristic confirms that the wind turbine foundation did not twist during the static loading stage, and displacement only occurred in the direction of wind load application. The above results demonstrate that the spindle-type FBG pressure sensor proposed in this study can effectively monitor the pressure variation law at the interface between the foundation ring and concrete under static load.
By applying low-cycle reciprocating fatigue loads to the wind turbine model and filling the formed cracks in the concrete bearing platform with water, the entire debonding process at the interface between the foundation ring and concrete was simulated. Due to the long duration of low-cycle fatigue load application, only representative data from 6 cycles (approximately 240 s) were selected for analysis in each stage.
As shown in
Figure 15, at the initial stage of the fatigue load application, the wavelength increment of the pressure sensor at the leeward foundation ring–concrete interface exhibited a sawtooth-like variation. When the load reached the maximum value, the wavelength increased to a peak accordingly; when the load decreased to the minimum value, the pressure sensor was no longer subjected to pressure, and the monitoring data gradually returned to the initial value. When the debonding at the leeward foundation ring–concrete interface further progressed, the fatigue test entered the second stage. At this point, an obvious harmonic phenomenon appeared in the wavelength of the pressure sensor at the leeward foundation ring–concrete interface. With the increase in horizontal load, the pressure sensor first squeezed with the mud to form a small wave peak. Subsequently, the mud at the interface between the pressure sensor and concrete was squeezed out of the concrete bearing platform along the damage cracks from bottom to top inside the concrete, and the wavelength of the pressure sensor began to decrease. When the foundation ring came into contact with the concrete interface, there was no mud left at the interface, and the wavelength of the pressure sensor returned to the initial value. As the pressure sensor squeezed against the concrete interface, the wavelength of the pressure sensor reached a large wave peak; then, the pressure sensor debonded from the concrete interface, and the wavelength returned to the initial value again. When the foundation ring separated from the concrete interface, mud refilled the cavity, and the pressure value rose to a small wave peak. During the process of horizontal load changing from 0 kN to −20.93 kN, the wavelength of the pressure sensor remained around the initial value.
After the second stage lasted for 526 reciprocating load cycles, a plateau appeared in the peak wavelength of the leeward pressure sensor, and the foundation damage of the foundation ring-type wind turbine entered the third stage. In this stage, the peak wavelength of the leeward pressure sensor only showed a small wave peak when the foundation ring separated from the concrete interface. This phenomenon indicates that the mud formed by the mixture of broken concrete on the leeward side and rainwater had filled the entire crack cavity.
After the third stage lasted for 1200 fatigue load cycles, there was no longer a small wave peak in the leeward pressure signal, and the foundation damage entered the fourth stage. The wavelength variation trend of the leeward pressure sensor was “rising-flattening-falling”. This is because the increase in cracks led to more internal mud, and the mud played a wear role when squeezed, resulting in complete debonding at the leeward foundation ring–concrete interface.
In
Figure 16, the wavelength variation trend of the pressure sensor at the windward side was similar to that at the leeward side in the first stage, both showing a sawtooth pattern. In the second stage, a short plateau appeared in the wavelength of the windward pressure sensor during the peak phase. In the third stage, the wavelength variation trend of the windward pressure sensor was consistent with that in the second stage, but the peak value was larger than that in the second stage. In the fourth stage, the peak wavelength of the windward pressure sensor decreased; combined with the analysis of
Figure 15, this indicates that the extrusion effect at the interface between the windward foundation ring and the concrete foundation was weakened. According to the “lever principle”, the wind turbine as a whole tilted toward the leeward direction at this point. During the fatigue test, the wavelength variation in the pressure sensor at the neutral axis was small, which indicates that the wind turbine foundation still did not twist during the fatigue test (see
Figure 17).
After calculating the pressure sensor wavelength data in
Figure 15,
Figure 16 and
Figure 17, the maximum pressure values at the interface between the foundation ring and concrete on the leeward side, windward side, and neutral axis at each stage of the fatigue test were obtained (see
Table 4).The maximum pressure at the leeward side shows a continuous upward trend across all stages, increasing from 451.88 kPa in Stage 1 to 3158.91 kPa in Stage 4. This significant growth (nearly 7-fold increase) indicates that the leeward foundation ring–concrete interface bears the main load during the fatigue test. With the progression of stages (from initial loading to complete interface debonding), the interface undergoes gradual damage (such as crack expansion and mud extrusion), and the stress concentration effect is continuously enhanced—hence the steady rise in maximum pressure.
The windward maximum pressure exhibits a “rise first, then fall” trend: it increases from 244.46 kPa (Stage 1) to 1808.36 kPa (Stage 3), then decreases to 905.45 kPa in Stage 4. The initial rise is consistent with the leeward side, as the windward interface also bears partial load during the early fatigue stage. The subsequent decline in Stage 4 is closely related to the “leeward tilt” of the wind turbine: as the overall structure tilts leeward, the stress on the windward interface is relieved, leading to a significant drop in maximum pressure.
The neutral axis maximum pressure is consistently low and shows a slight downward trend, even turning negative in later stages: it starts at 36.91 kPa (Stage 1), decreases to 8.36 kPa (Stage 2), and further drops to −14.91 kPa (Stage 3) and −18.91 kPa (Stage 4). The low pressure values confirm that the neutral axis is not a main stress-bearing area of the foundation, which aligns with the earlier observation that “the wind turbine foundation does not twist during the fatigue test.” The negative pressure in Stages 3 and 4 may be attributed to the slight tensile stress generated at the neutral axis interface as the foundation tilts leeward, but the magnitude is negligible and does not affect the overall stress distribution.
After the fourth stage lasted for 560 fatigue load cycles, the tilt degree of the wind turbine tower reached 16.9 mm/m. At this point, the overall structure of the wind turbine failed. The above phenomena indicate that the spindle-type FBG pressure sensing proposed in this study can effectively identify the entire process of debonding at the foundation ring–concrete interface inside the wind turbine foundation, providing a new idea for the internal structural health monitoring of the wind turbine foundation.
