Article

Development of a Spindle-Type FBG Pressure Sensor for Pressure Monitoring at the Wind Turbine Foundation Ring–Concrete Interface

1
Architectural Engineering Institute, Kaili University, Kaili 556011, China
2
College of Civil Engineering and Architecture, Jiangsu University of Science and Technology, Zhenjiang 212100, China
3
MOE Key Laboratory of High-Speed Railway Engineering, School of Civil Engineering, Southwest Jiaotong University, Chengdu 610000, China
4
Key Laboratory of Specialty Fiber Optics and Optical Access Networks, Joint International Research Laboratory of Specialty Fiber Optics and Advanced Communication, Shanghai University, Shanghai 200444, China
*
Authors to whom correspondence should be addressed.
Photonics 2025, 12(11), 1139; https://doi.org/10.3390/photonics12111139
Submission received: 24 October 2025 / Revised: 13 November 2025 / Accepted: 14 November 2025 / Published: 18 November 2025

Abstract

This study presents a fiber Bragg grating (FBG) pressure sensor with a spindle-type protective structure, optimized using the NSGA-II algorithm, for monitoring pressure variations at the contact interface between wind turbine foundation rings and concrete. To optimize the sensor sensitivity and measurement range, the NSGA-II algorithm was employed to determine the optimal structural dimensions and material properties of the spindle-type sensor. This approach addresses two critical challenges: firstly, enhancing the survivability of FBG pressure sensors in harsh service environments, and secondly, enabling accurate monitoring of weak pressure signals at the foundation ring–concrete interface. Linearity verification tests demonstrate a sensor sensitivity of 55.01 pm/MPa within a 10 MPa measurement range, accompanied by a linear correlation coefficient of 0.999, confirming high stability of the fabricated sensors. Furthermore, wind turbine foundation model experiments validate the practical service performance of the proposed sensor. Results indicate that the spindle-type FBG pressure sensor not only withstands severe operating conditions but also achieves real-time monitoring of interfacial pressure changes in foundation ring–concrete systems.

1. Introduction

With the extension of service life, concrete spalling occurs at the interface between the foundation ring and concrete inside wind turbine foundations under the reciprocating motion of the turbine, which may eventually lead to sudden fracture and collapse of the turbine tower. Therefore, the detection of internal damage states in wind turbine foundations is of critical significance. However, conventional electrical sensors commonly adopted nowadays fail to meet the requirements for long-term durability, corrosion resistance, and service reliability [1]. In recent years, fiber-optic sensing technology has gradually gained attention in the field of monitoring structural fatigue damage evolution [2,3]. Researchers both domestically and internationally have employed fiber optic sensing technology to identify damages in components such as wind turbine blades, towers, foundation piles, and gearboxes [4,5]. To monitor the dynamic strain characteristics of wind turbine towers and substructures, Bang et al. [6] developed a fiber Bragg grating (FBG)-based sensing system and applied it to strain monitoring of the tower structure at the Woljeong test-site wind turbine in Jeju Island. Mcalorum et al. [7] utilized ultra-long fiber strain sensors to monitor the propagation of cracks on the concrete surface of the pile cap. Pacheco et al. [8] monitored the strain response of wind turbine blades using a FBG sensing system to assess the fatigue condition of wind turbine blades. Nevertheless, the harsh service environment inside wind turbine foundations results in a low survival rate of fiber optic sensors, and current research rarely involves deploying fiber optic sensors inside wind turbine foundations. Meanwhile, wind turbines generate intense vibrations during operation, which can shorten the service life of components [9]. Only Perry et al. [10] attached FBG sensors to the internal reinforcement of wind turbine foundations to measure the vibration response of the foundation structure. Therefore, it is necessary to develop a high-sensitivity FBG pressure sensor suitable for the harsh service environment of wind turbine foundations.
Existing research and development of FBG sensors mainly focus on the optimization of measurement gratings and the selection of protective devices. Burhanuddin et al. [11] added internal measurement gratings to FBG pressure sensors and developed a multi-parameter pressure sensor suitable for underground soil pressure detection. Zhou et al. [12] optimized the protective structure of FBG sensors by utilizing a rhombus-shaped metal frame, thereby developing a soil pressure sensor with dual-sided pressure-sensing capabilities. Based on the existing structural form of FBG pressure sensor protective devices, this paper conducts structural optimization analysis to meet the requirements for sensitivity and measurement range, and optimizes the dimensions and materials of the packaging structure. Currently, commonly used structural optimization algorithms include genetic algorithm (GA) [13], particle swarm optimization (PSO) [14], and non-dominated sorting genetic algorithm II (NSGA-II), etc. Among them, NSGA-II performs operations such as non-dominated sorting on the population, enabling the algorithm to quickly approach the Pareto frontier and output optimal solutions while maintaining population diversity, thus being frequently used to solve multi-objective optimization problems. Stanković et al. [15] conducted multi-objective optimization based on the NSGA-II algorithm, considering constraints such as stress and displacement, with the objectives of minimizing structural mass and deflection. The above research results indicate that the NSGA-II algorithm can be applied to optimize the packaging structure of FBG pressure sensors.
This paper introduces a spindle-type FBG pressure sensor designed to monitor internal damage within wind turbine foundations. Based on the FBG sensing principle, finite element analysis is first employed to identify the key parameters influencing the sensor’s sensitivity and measurement range. Taking sensitivity and measuring range as optimization objectives and the identified parameters as the design subset, the structural configuration of the FBG pressure sensor is optimized using the NSGA-II algorithm, thereby facilitating the intelligent development of the spindle-type sensor. Finally, by directly detecting pressure variations at the foundation ring–concrete interface, the sensor enables monitoring and identification of the entire process—from initiation to progression—of internal damage in wind turbine foundations.

2. Working Principle of Spindle-Type FBG Pressure Sensor

The FBG pressure sensor applied to internal damage detection of wind turbine foundations shall satisfy two requirements: sufficient sensitivity to capture subtle pressure variations at the foundation ring–concrete interface and ensure performance stability in harsh service environments. In this study, an optimized design is performed based on the existing protective structure of FBG pressure sensors, aiming to achieve the identification of the evolution process of internal damage in wind turbine foundations.

2.1. Principle of FBG Sensing

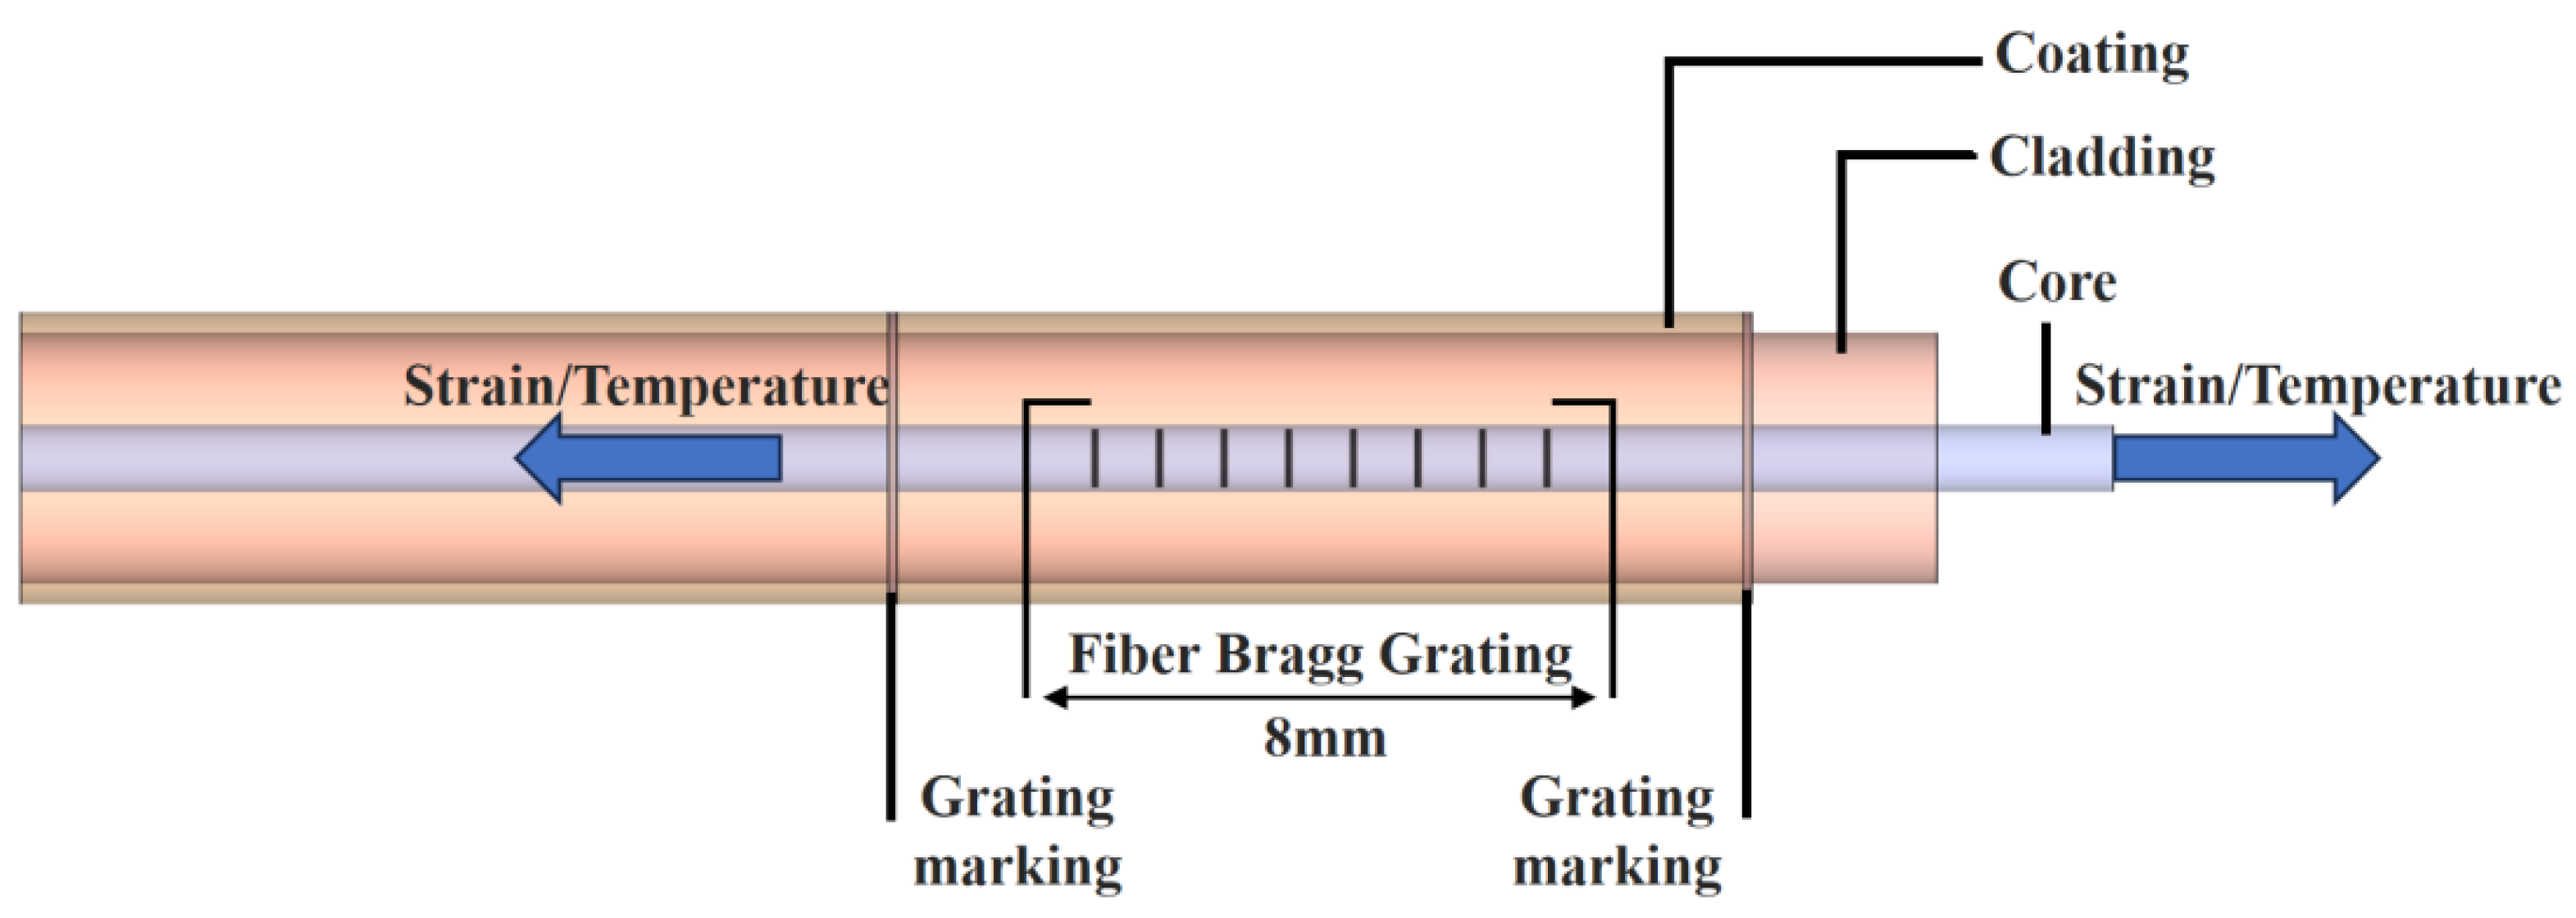
The operating principle of an FBG is illustrated in Figure 1. When the Bragg reflection conditions are fulfilled, the wavelength of the reflected light within the grating adheres to the following equation:
λ B = 2 n e f f Λ
where λB is the central wavelength of the FBG sensor, neff is the effective refractive index of the guiding mode, Λ is the grating period.
When FBG is exposed to the combined effects of external strain ε and temperature T, the deviation ∆λB in the center wavelength of the FBG is given by
λ B λ B = ( 1 p e ) ε + ( α Λ + α n ) T
where pe is the elasto-optical coefficient, generally about 0.22, αΛ and αn are the thermal expansion and thermos-optic coefficients of optical fiber, respectively, ∆T is the temperature change in Kelvin.

2.2. Principle of FBG Pressure Sensor

The pressure sensor protection device used in this paper primarily comprises a pressure-receiving circular diaphragm, an outer protective casing, and a spindle-shaped sensitizing structure. The spindle-shaped sensitizing structure exhibits symmetry from top to bottom, featuring a groove circumferential positioned at its widest midsection for bonding pressure measurement gratings and winding connecting. The operational principle of this pressure sensor lies in the deformation of the spindle-shaped sensitizing structure under pressure applied to the circular diaphragm casing, which results in an expansion of its circumferential length. As illustrated in Figure 2, the wavelength of the fiber grating FBG1 encircling the spindle-shaped sensitizing structure increases correspondingly.
As indicated by Equation (2), the bare FBG is simultaneously influenced by both external force and temperature. When the FBG is affixed to the pressure sensor protection device introduced in this paper, the central wavelength shift ∆λB resulting from external environmental impacts on the FBG is given by
Δ λ B λ B = K P P + C T T + C ε ε T
where KP represents the pressure sensitivity coefficient, P is the applied pressure, CT and Cε are the temperature sensitivity coefficient and strain sensitivity coefficient, respectively. T is temperature, εT is the material strain induced by temperature. In this paper, the impact of both temperature and material strain due to temperature changes is mitigated by adhering a temperature compensation grating FBG2 to the groove on the inner wall of the box. Consequently, the pressure sensitivity coefficient of the sensor can be formulated as follows [16]:
K P = Δ λ B P = 3 ( 1 p e ) ( 1 μ 2 ) λ B c o t θ 8 d E t 3 ( R 2 r 2 ) 2
where μ is Poisson’s ratio, θ is the angle formed between the hypotenuse of the spindle and the horizontal axis, d is the diameter at the point of maximum circumference of the spindle, E is elastic modulus, t is the thickness of the compressed cover plate, R is the circular membrane radius, and r indicates the inner radius of the spindle’s upper section.

3. FBG Pressure Sensor Structural Optimization

Building on the FBG pressure sensing principle elaborated earlier, this study carries out structural optimization design for FBG pressure sensors. The objective is to develop FBG pressure sensors with specialized functionalities that satisfy the internal monitoring requirements of wind turbine foundations. Firstly, the finite element method is used to analyze the relationship between packaging structure parameters and the sensitivity and measuring range of FBG pressure sensors, so as to determine the structural optimization subsets of FBG pressure sensors. Subsequently, the NSGA-II algorithm is adopted, with sensitivity and measuring range as objective functions, to track the structural optimization subsets of FBG pressure sensors. Finally, multiple sets of algorithm results that meet the monitoring function requirements are selected based on application scenarios.

3.1. Analysis of Structural Optimization Subsets for Spindle-Type FBG Pressure Sensors

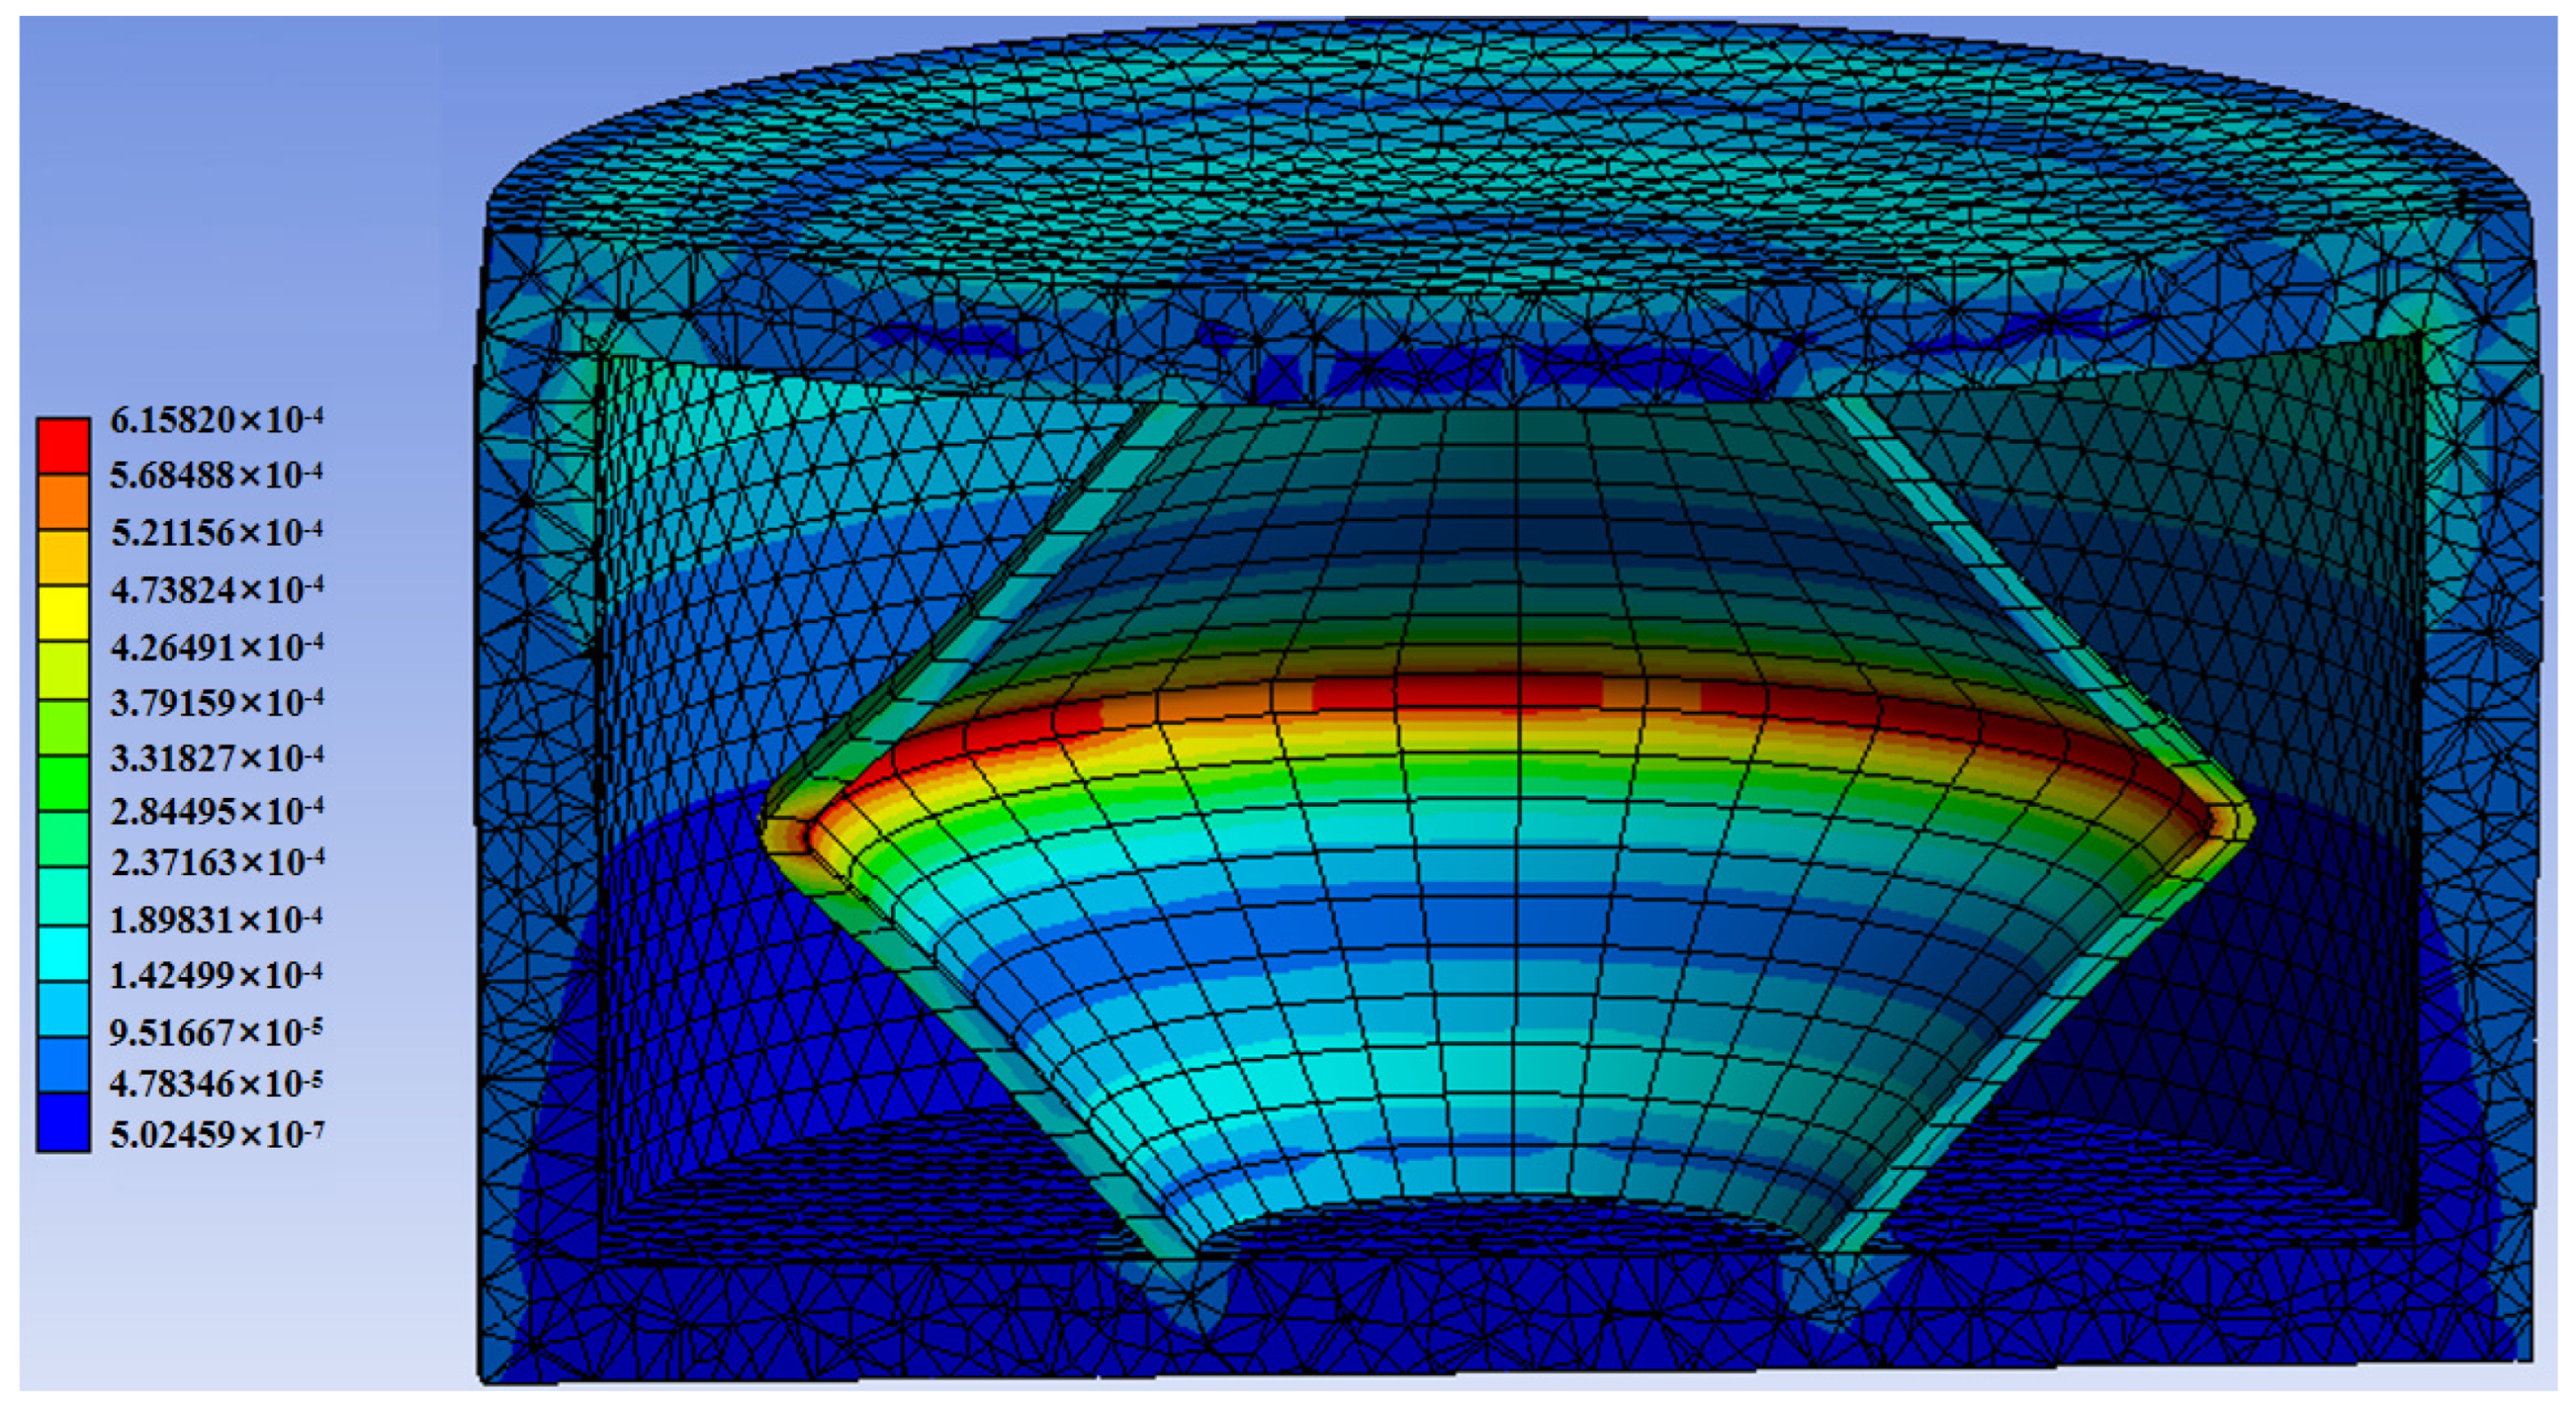
As indicated by Equation (4), the sensitivity of the spindle-type FBG pressure sensor employed in this study is primarily governed by five parameters: the angle θ of the spindle structure, the inner radius R of the upper cover plate, the upper inner radius r of the spindle, the thickness t of the upper cover plate, and the diameter d at the maximum circumference of the cone. Among these, the angle θ of the spindle structure is correlated with the upper inner radius r of the spindle and the diameter d at the maximum circumference of the cone, thus it will be excluded from the finite element analysis. The measuring range of a pressure sensor is correlated with its structural stiffness. When the structural configuration is fixed, the properties of structural materials determine the measuring range of the sensor. Therefore, in this finite element analysis, five parameters are selected as the analysis objectives: the upper inner radius r of the spindle, the inner radius R of the upper cover plate, the thickness t of the upper cover plate, the diameter d at the maximum circumference of the cone, as well as the elastic modulus E of the structural material. The purpose is to identify the structural optimization subsets for the high-sensitivity FBG pressure sensor. The finite element analysis model is shown in Figure 3, and its structural dimensions and material property parameters are listed in Table 1. The FBG pressure sensor finite element model with this dimensional configuration exhibits a sensitivity of 51 pm/MPa and a measuring range of 7.1 MPa.
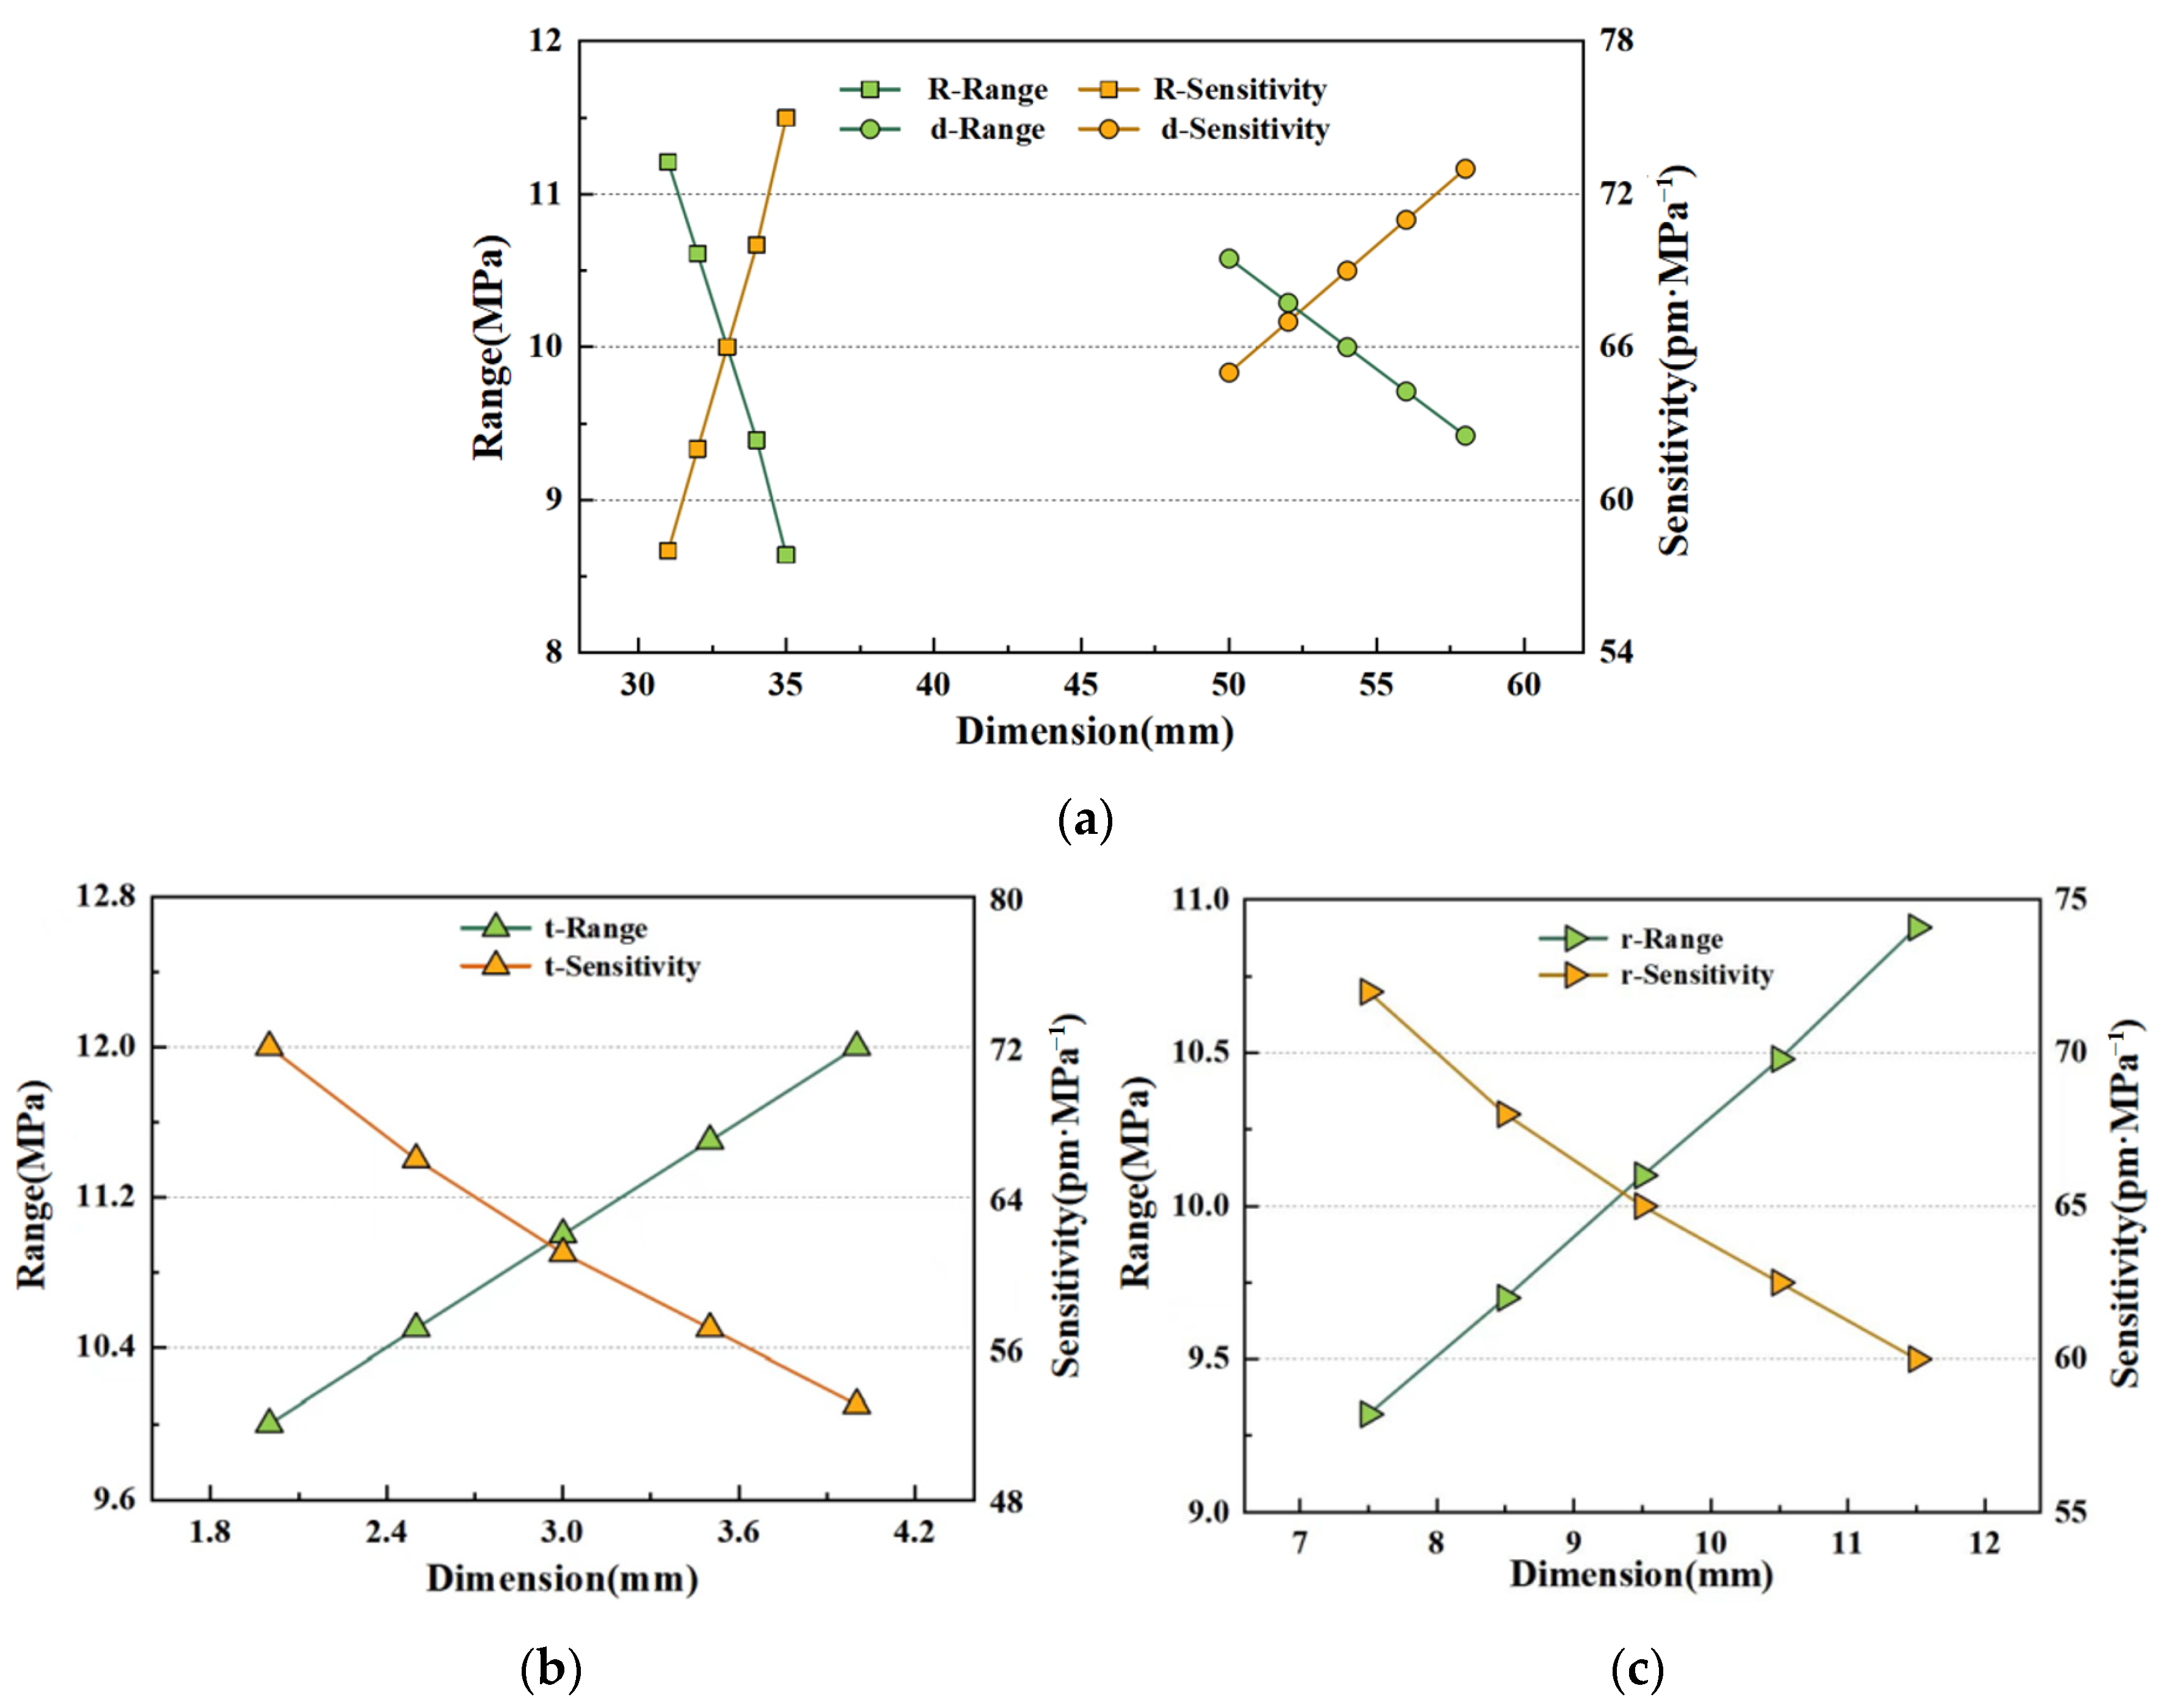
Figure 4 illustrates that the sensitivity of the spindle-type FBG pressure sensor exhibits a positive correlation with the inner radius R of the upper cover plate and the diameter d at the maximum circumference of the cone, while showing a negative correlation with the thickness t of the upper cover plate and the upper inner radius r of the spindle. Among the positively correlated parameters, the influence range of the spindle’s diameter d on sensitivity is just 65.2~73.8 pm/MPa, marginally smaller than that of the inner radius R. For the negatively correlated parameters, the influence range of the upper inner radius r on sensitivity is similarly merely 60~72.3 pm/MPa—far smaller than that of the upper cover plate’s thickness t.
Figure 4a reveals that both the inner radius R of the upper cover plate and the diameter d at the maximum circumference of the cone are inversely proportional to the measurement range of the spindle-type FBG pressure sensor. Furthermore, the influence magnitude of the upper cover plate’s inner radius R on the sensor’s measurement range is marginally greater than that of the spindle’s diameter d.
Figure 4b,c indicate that the thickness t of the upper cover plate and the upper inner radius r of the spindle are positively proportional to the sensor’s measurement range, with their influence magnitudes comparable to that of the inner radius R.
Figure 5 shows that the elastic modulus E of the structural material is inversely proportional to sensitivity, with an influence range far exceeding those of other parameters. These findings align with the theoretical analysis presented in Equation (4). Therefore, for the sensitivity-oriented optimization of the spindle-type FBG pressure sensor, the inner radius R of the upper cover plate, the thickness t of the upper cover plate, and the elastic modulus E of the structural material may be designated as the sensor’s structural optimization subgroup. Figure 5 further demonstrates that the elastic modulus E of the structural material is positively proportional to the pressure sensor’s measurement range. Consistent with the analysis of sensitivity-influencing parameters, the influence of elastic modulus E on the sensor’s measurement range far surpasses that of other parameters. Based on the aforementioned analysis, the diameter d at the maximum circumference of the cone at its maximum circumference exerts a relatively minor impact on both the sensitivity and measurement range of the spindle-type FBG pressure sensor; thus, it will be excluded from the sensor’s structural optimization subgroup.

3.2. Structural Parameter Optimization of Spindle-Type FBG Pressure Sensor

In multi-objective optimization design problems, the NSGA-II algorithm features an efficient non-dominated sorting mechanism and an elitism preservation strategy. This enables it to converge rapidly to the Pareto optimal solution set while maintaining population diversity, a characteristic that has established it as a landmark algorithm in the field of multi-objective optimization. Although numerous improvement studies and process optimizations targeting the NSGA-II algorithm have emerged, its core steps have remained unchanged, which are identifying the optimal solution and making decisions based on the Pareto solution [17]. This has enabled NSGA-II to remain one of the most popular research methods for addressing multi-objective optimization problems to date [18]. A multi-objective optimization problem can generally be formulated as follows:
min / max     y = f ( x ) = ( f 1 ( x ) ,    f 2 ( x ) , f k ( x ) ) , k 2 s . t                                                                                g i ( x ) 0 , i = 1 , 2 , k                                                                                          h j ( x ) = 0 ,       j = 1 , 2 , m
where x = (x1, x2, xn) is an n-dimensional decision vector in xRn, fk(x) is the objective function, gi(x) and hj(x) are inequality constraints and equality constraints, respectively. The workflow of the NSGA-II algorithm mainly includes non-dominated sorting, crowding distance calculation, selection, crossover, and mutation operations. Non-dominated sorting, as the core process of this algorithm, classifies the population into different layers based on the concept of Pareto dominance. In multi-objective maximization problems, if the following conditions are satisfied, we say that x1 dominates x2.
j = 1 , 2 , , k      ,      f j ( x 1 ) f j ( x 2 )
j = 1 , 2 , , k      ,      f j ( x 1 ) > f j ( x 2 )
The crowding distance is used to evaluate the density of solutions surrounding a specific solution. It is defined as the average distance between the nearest neighboring solutions on either side of the target solution along its dimensional axis. Selection, crossover, and mutation operations form a tightly integrated core process in NSGA-II. The selection phase employs selection operators to filter superior individuals for the next generation, following these rules: individuals with higher Pareto dominance ranks are prioritized; for individuals with the same rank, those with larger crowding distances are selected first. Both crossover and mutation are effective mechanisms for enhancing population diversity. Crossover operations utilize crossover operators to set multiple crossover points in population individuals, swapping genetic material on either side of these points. Mutation operations, executed with a predefined mutation probability, introduce genetic variations into selected individuals by replacing specific gene segments with random values.
During the structural design of the FBG pressure sensor, sensitivity and measurement range were identified as the core optimization objectives. When cracks occur at the interface between the wind turbine foundation ring and concrete, the interface pressure measures 0.01 MPa. Consequently, the minimum sensitivity target for the FBG pressure sensor was set to 10 pm/MPa. The internal monitoring environment of the wind turbine foundation is extremely harsh, necessitating the FBG pressure sensor to have high structural stiffness and an adequate measurement range. In this study, the minimum target for the sensor’s measurement range was therefore established at 10 MPa.
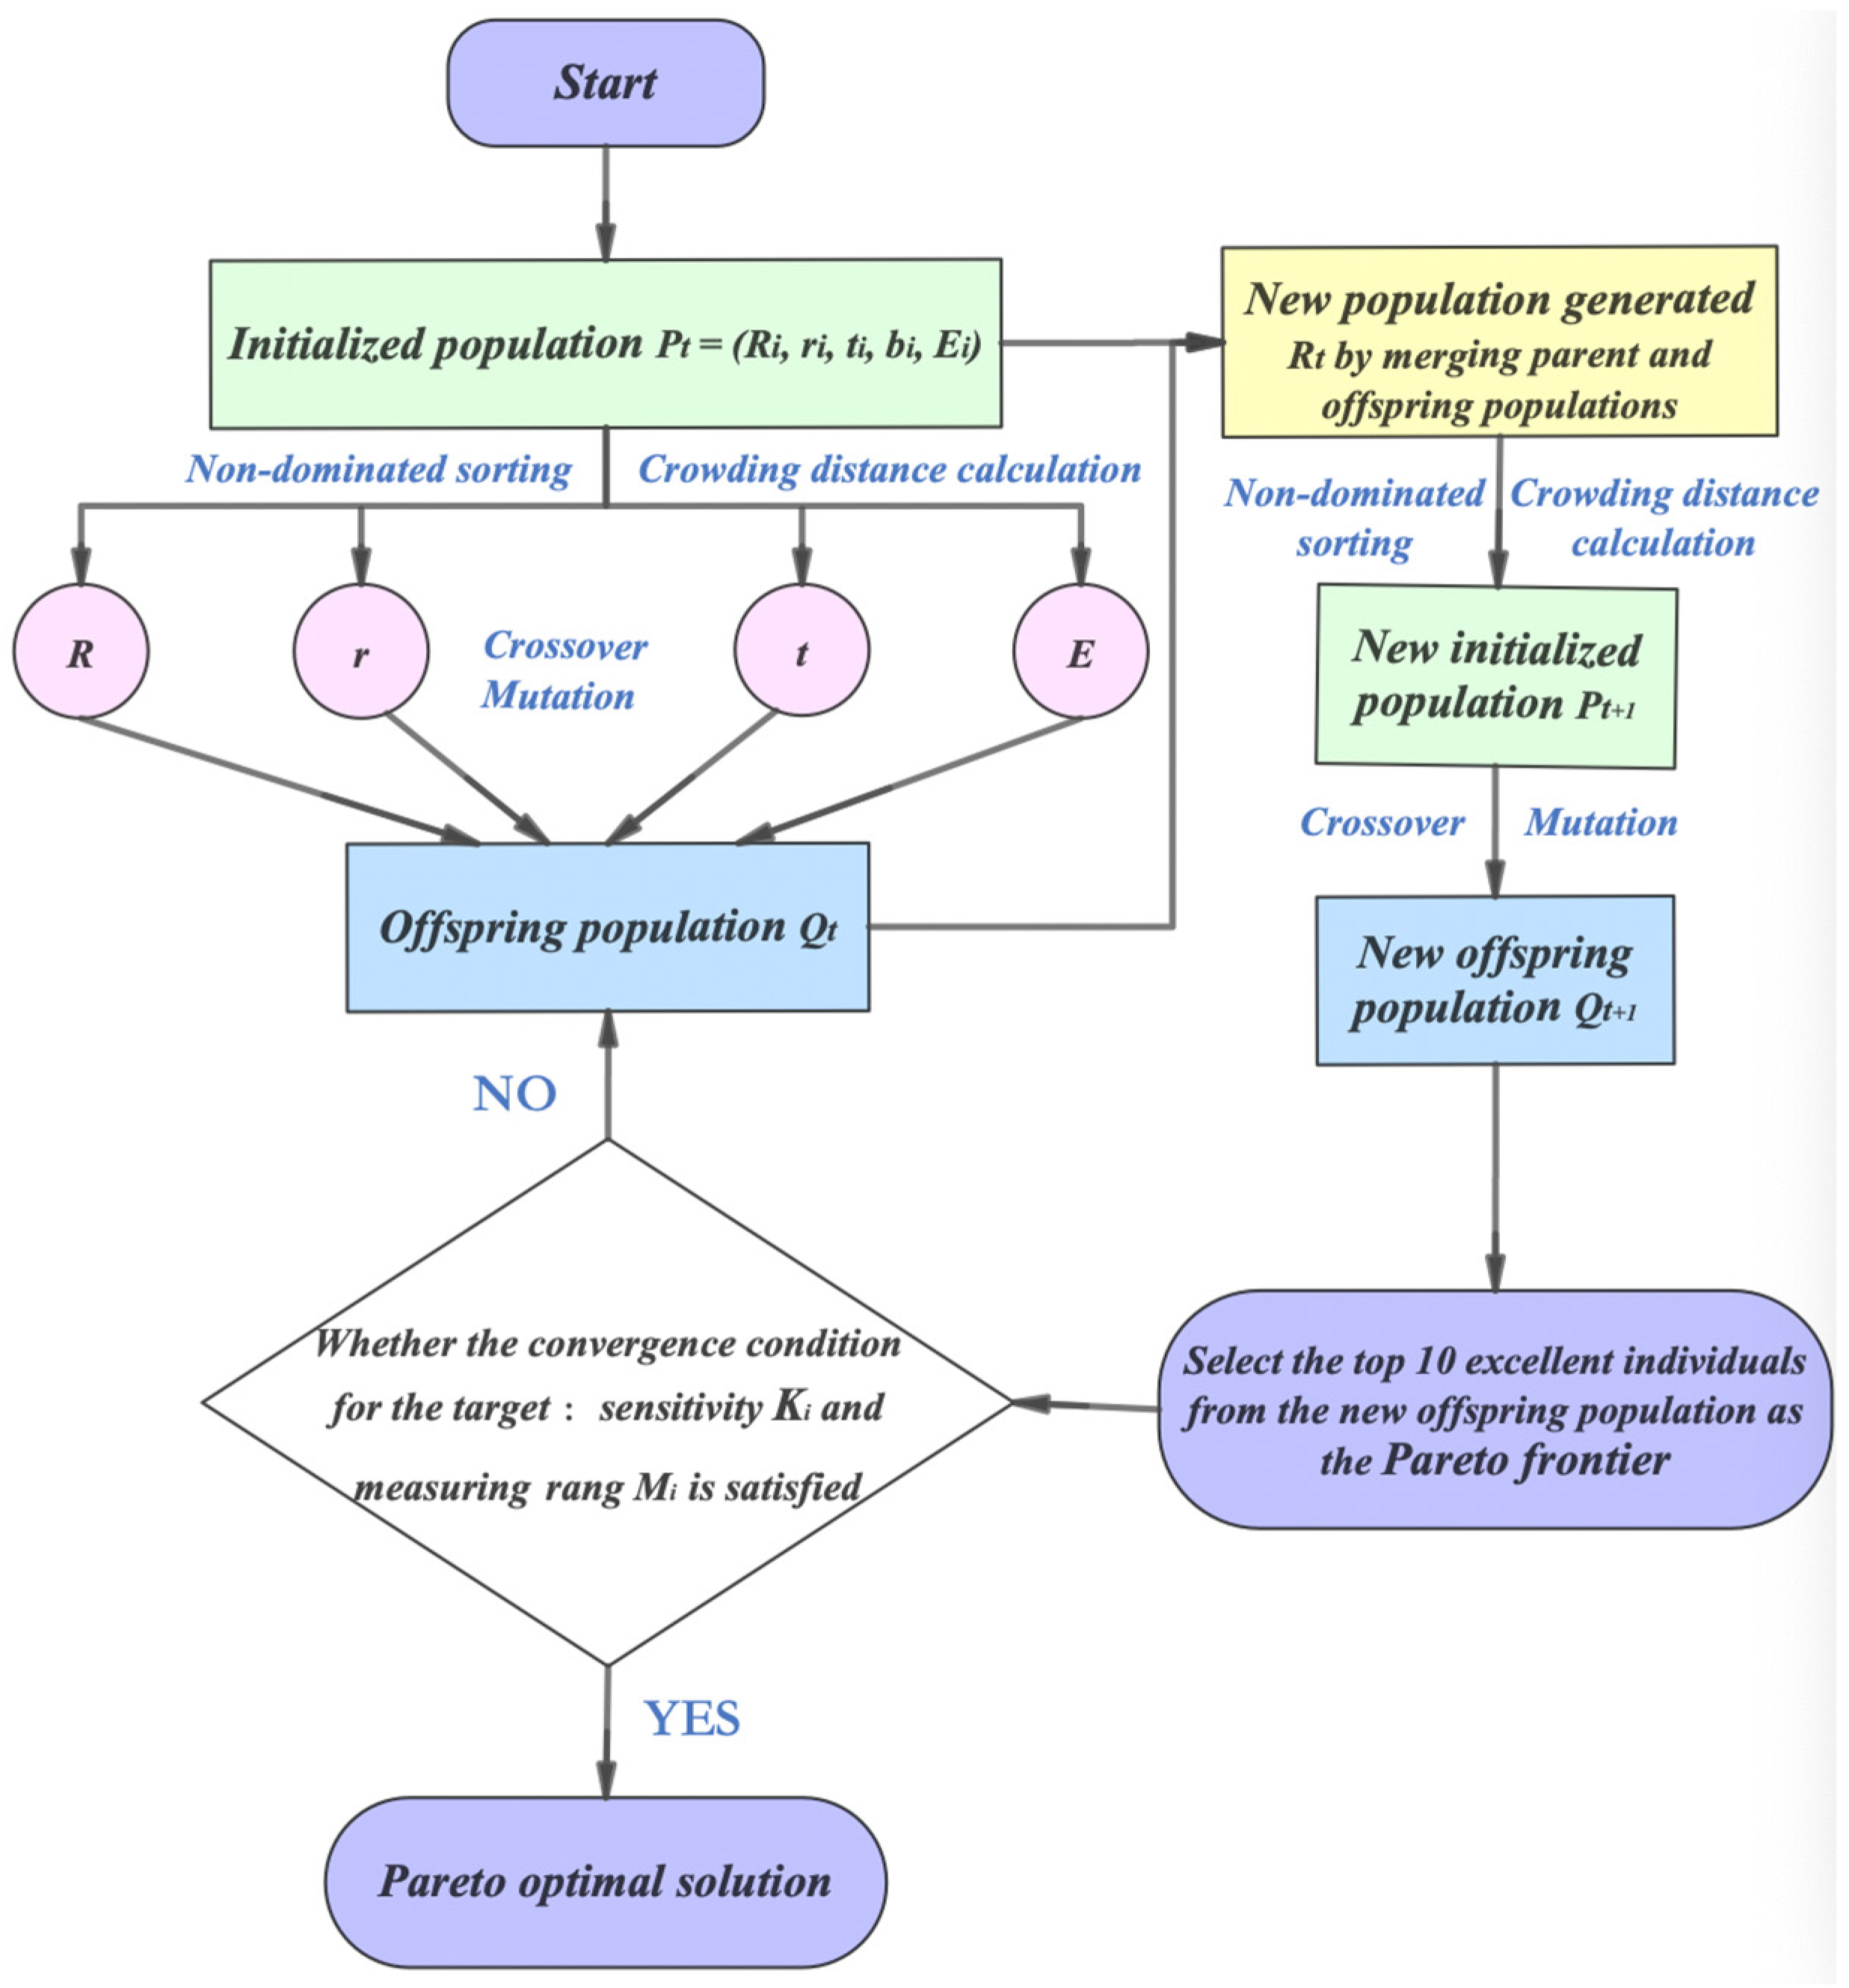
Based on subgroup analysis for FBG pressure sensor structural optimization, this study focused on four key design parameters: the upper inner radius r of the spindle, the inner radius R of the upper cover plate, the thickness t of the upper cover plate, and the elastic modulus E of the structural material. In the crossover-mutation process, individuals exhibiting high sensitivity but limited measurement range were specifically selected for crossover with those showing low sensitivity but high measurement range. For individuals that still had significant defects post-crossover, the mutation probability of parameters associated with these defects was increased. This approach not only enhanced population diversity but also guided the population to continuously converge toward the optimization objectives. The detailed optimization workflow is illustrated in Figure 6. Finally, based on the wind turbine foundation structure, the structural parameters of the selected spindle-type FBG pressure sensor were finalized as follows:
Upper inner radius of the spindle r is 9.5 mm; Inner radius of the upper cover plate R is 33 mm; Thickness of the upper cover plate t is 2 mm; Diameter at the cone’s maximum circumference d is 27 mm; The structural material exhibits a Young’s modulus E is 2.2 GPa.
The spindle-type FBG pressure sensor with the above dimensions achieves a sensitivity coefficient (Kp) of 70 pm/MPa and a measurement range of 11 MPa.

4. Linearity Test

4.1. Test Design

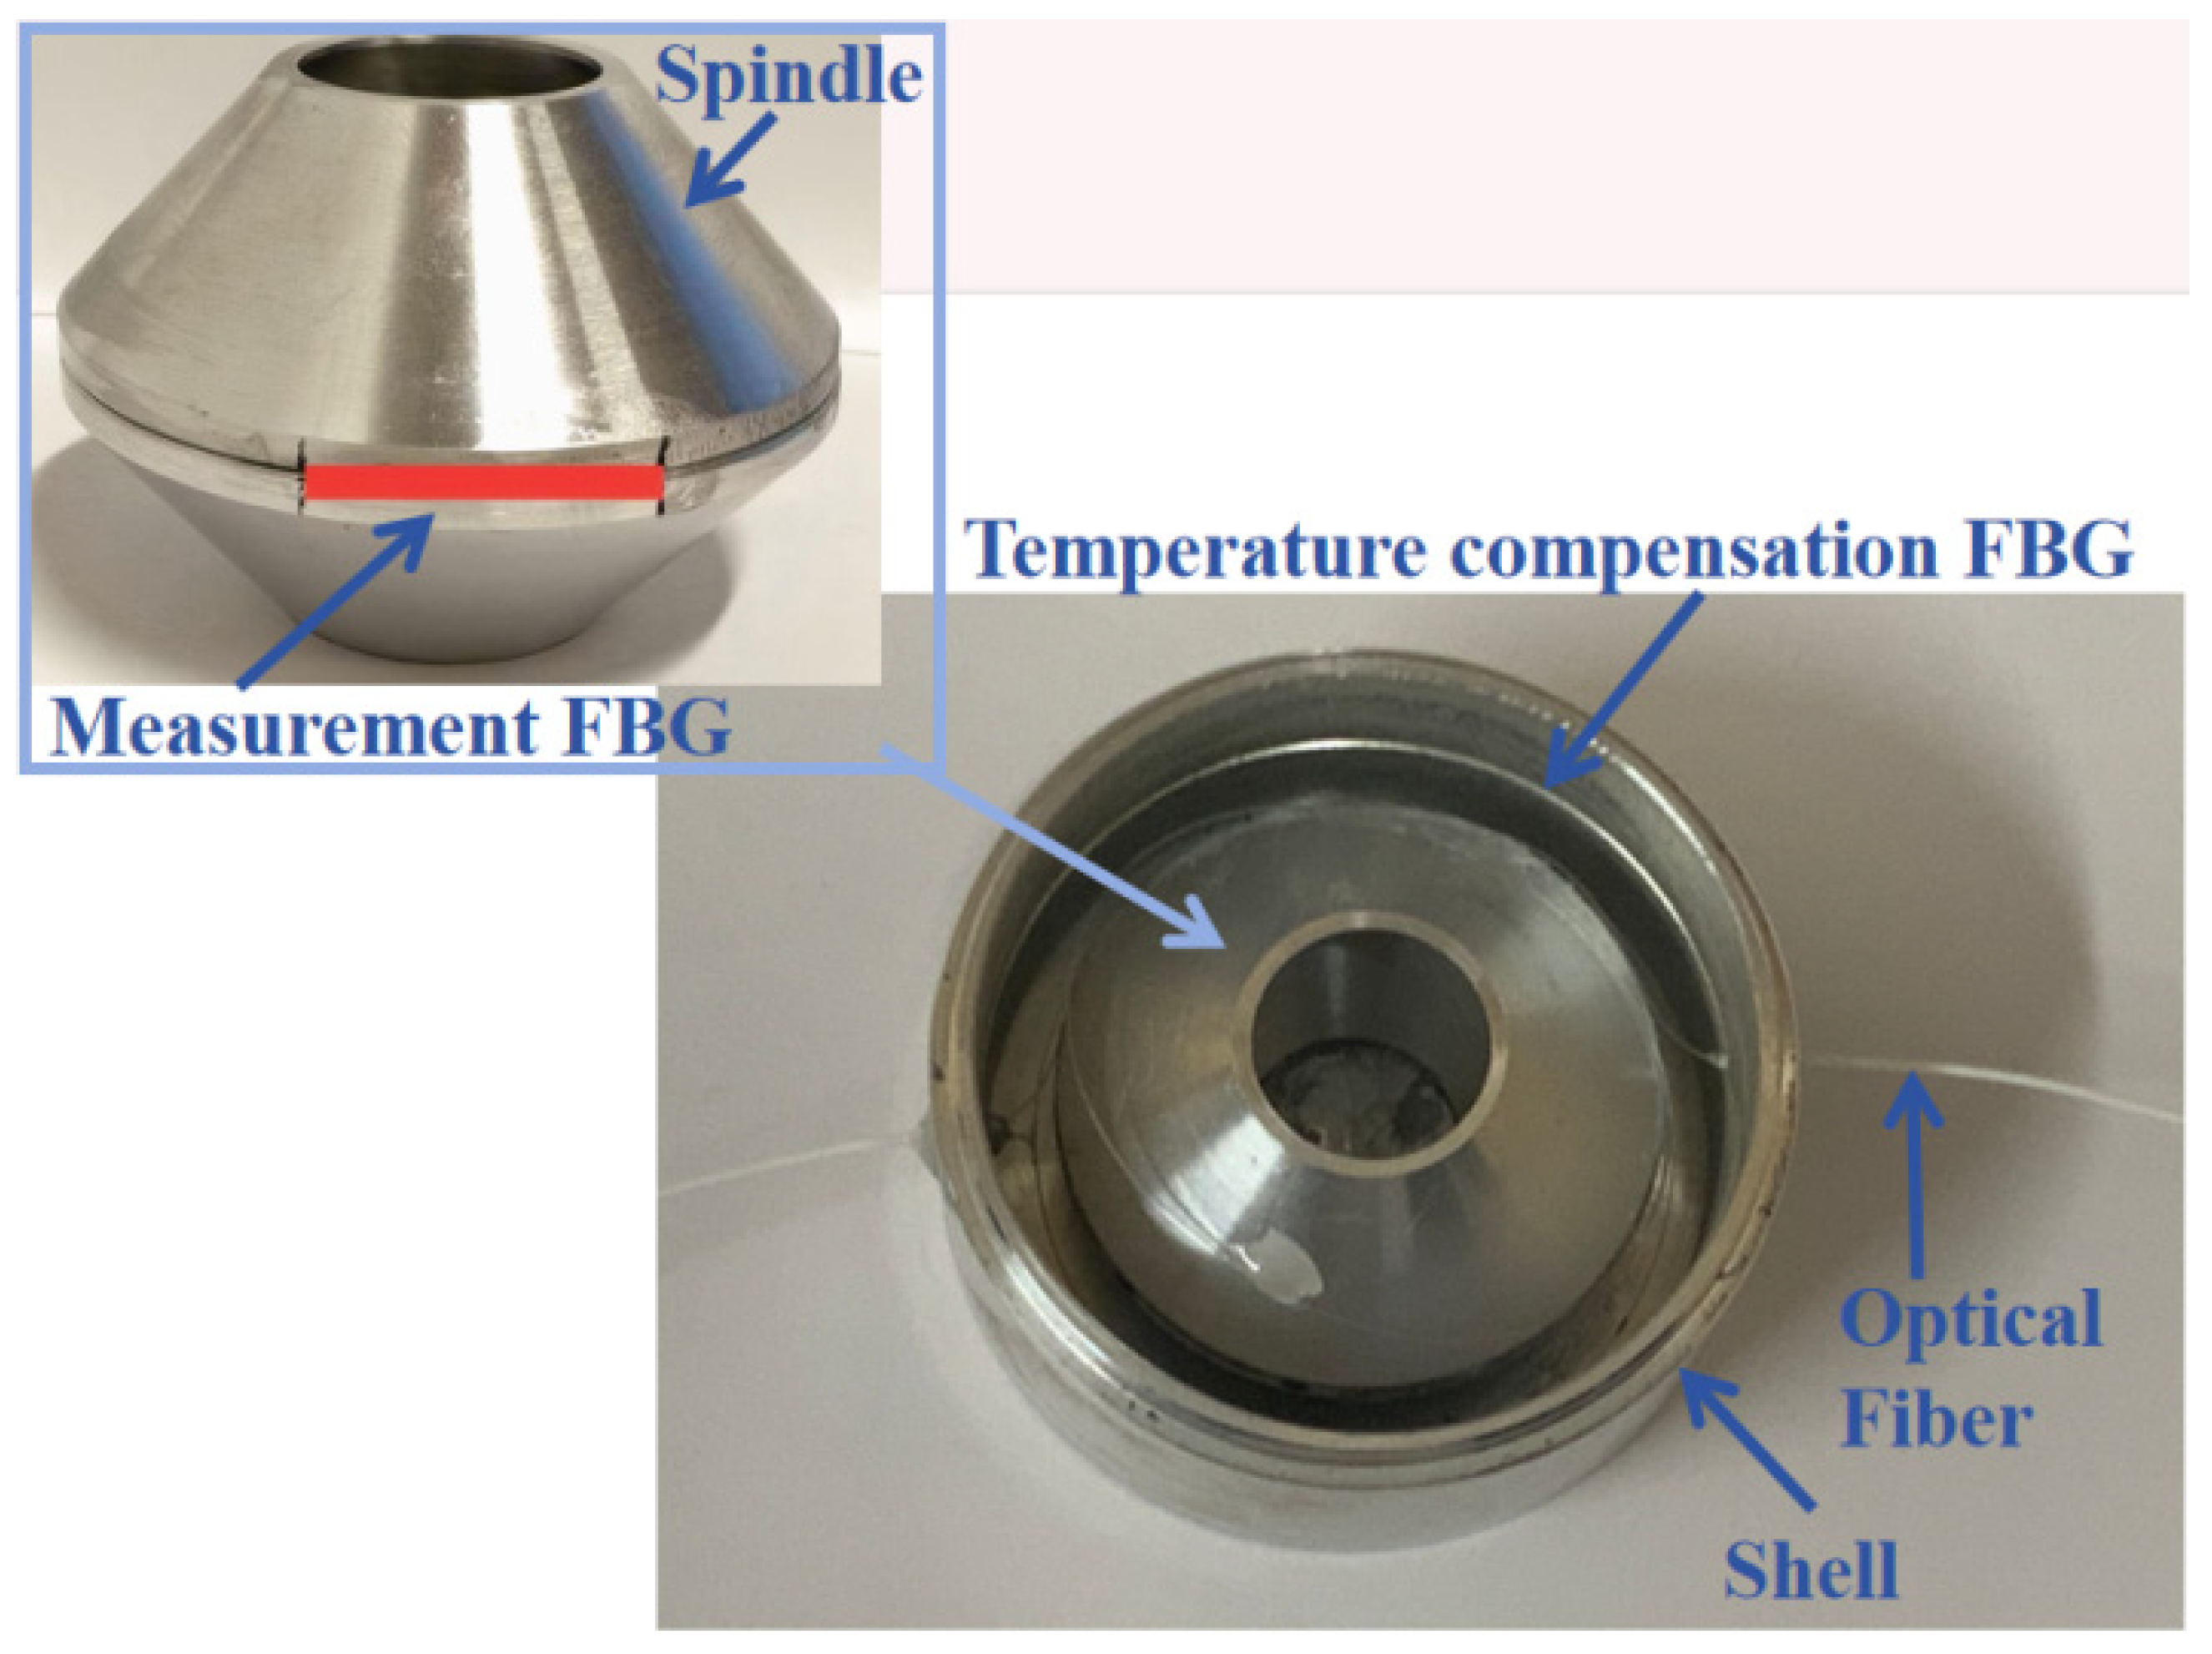
In this study, FBG pressure sensors were fabricated according to the structural parameters of the selected spindle-type FBG pressure sensor (Figure 7). The linearity and sensitivity stability of the proposed FBG pressure sensors were verified through linearity tests. Fiber Bragg gratings were bonded using epoxy resin, and the sensor protective devices were encapsulated. For the linearity test, the loading conditions were set as 0 MPa, 2 MPa, 4 MPa, 6 MPa, 8 MPa, and 10 MPa, with each loading stage maintained for 60 s. After reaching the maximum loading condition of 10 MPa, the load was unloaded stepwise back to 0 MPa following the same sequence. To investigate the measurement stability of the proposed FBG pressure sensors, the loading-unloading experiment was repeated five times.
The linearity test setup consisted of a universal testing machine and an FBG demodulator (Figure 8). The universal testing machine, with a maximum test force of 300 kN, an effective test space of 600 mm, and a test force resolution of 1/±500,000, was used for applying and unloading pressure. The fiber Bragg grating demodulator, featuring a sampling frequency of up to 1 kHz and a resolution of less than 1 pm, was employed to collect the offset of the central wavelength of the FBG pressure sensor with respect to pressure changes.

4.2. Test Results

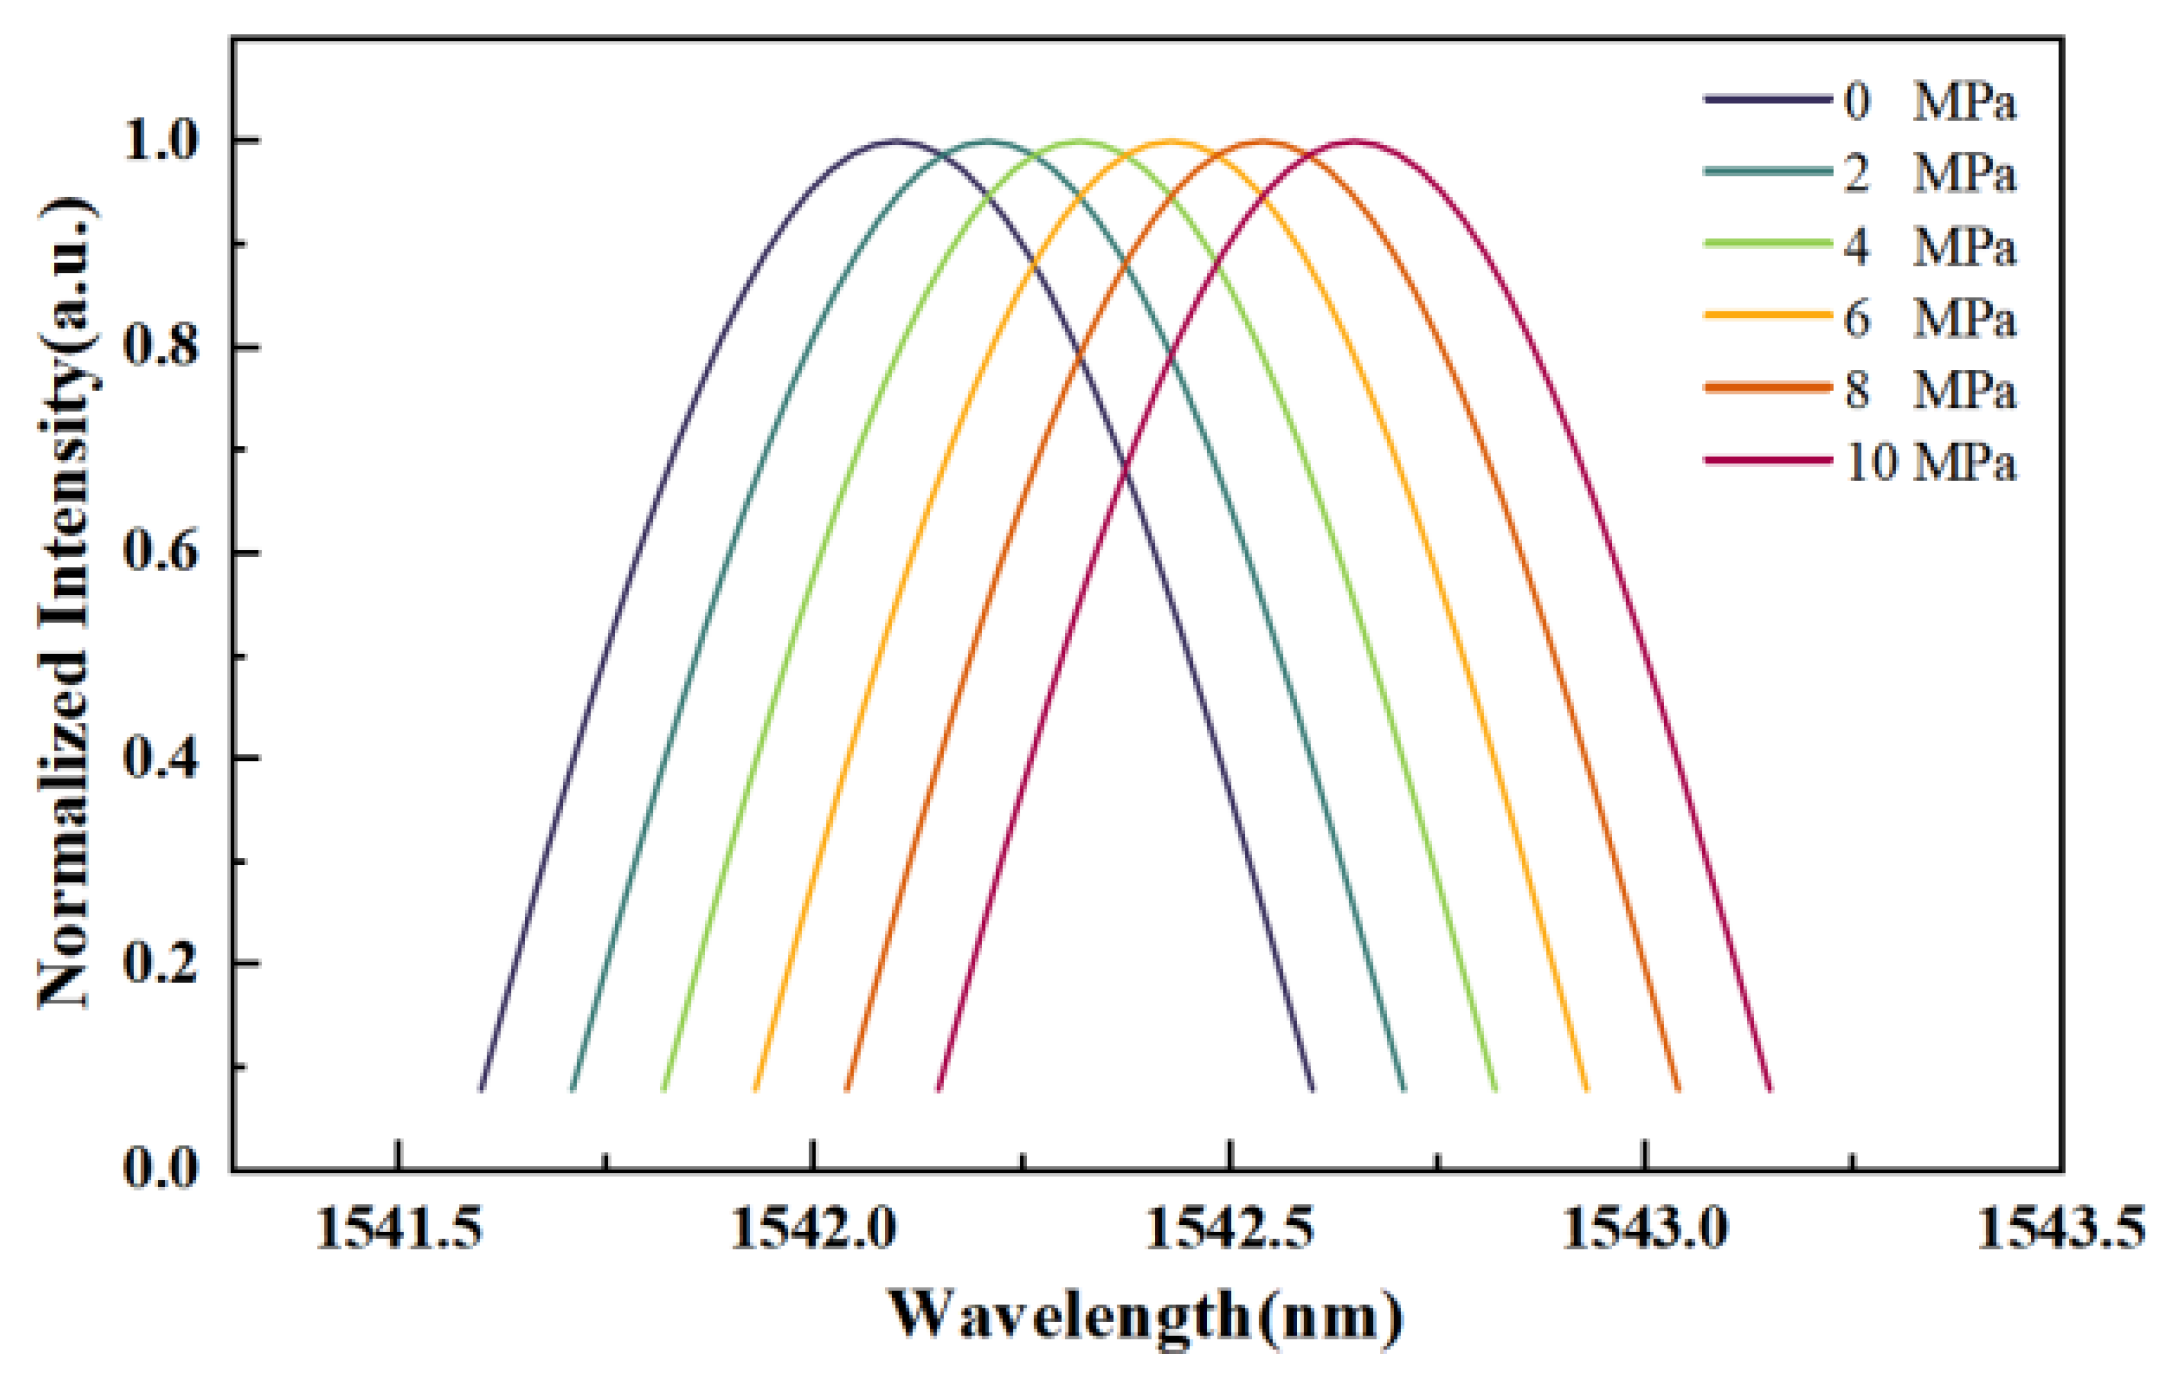
Test results are presented in Figure 9 and Figure 10. As shown in the spectral diagram of pressure-measuring grating (Figure 9), the initial wavelength of the FBG pressure sensor’s pressure-measuring grating is 1542.1 nm. When the pressure reaches 10 MPa, the wavelength of this pressure-measuring grating shifts to 1542.65 nm. As illustrated in Figure 10, the central wavelength of the sensor’s pressure-measuring grating first increases in a stepwise manner before gradually returning to its initial value, demonstrating excellent repeatability. During the 1 min load-holding period, the wavelength of the pressure-measuring grating maintains stability, resulting in a distinct plateau. In Figure 10, the temperature-compensating grating FBG2 exhibits negligible variation and essentially maintains a linear profile.
By leveraging the monitoring data of the temperature-compensated fiber Bragg grating (FBG), the temperature-induced component in the central wavelength shift in the pressure-measuring FBG was isolated. On this basis, the sensitivity and linearity of the FBG pressure sensor were derived. As illustrated in Figure 11, the central wavelength shifts in the FBG pressure sensor at the same pressure level show good consistency. Linear fitting was performed on the central wavelength shifts in the FBG pressure sensor across different operating conditions. The fitting results indicate that the sensitivity of the proposed FBG pressure sensor is 55.01 pm/MPa—a value lower than the outcomes of multi-objective optimization. This discrepancy arises from the relatively complex structure of the FBG pressure sensor: simplified boundary conditions adopted in the finite element analysis (FEA) process tend to introduce errors. Nevertheless, the actual sensitivity of the proposed sensor is significantly higher than the minimum sensitivity threshold specified in the FBG pressure sensor optimization objectives, fully satisfying the pressure monitoring demands of the fan foundation ring–concrete interface.
The linear correlation coefficient from the fitting in Figure 11 reaches 0.999, which confirms that the FBG pressure sensor exhibits low repeatability error and excellent linearity. After five test cycles, the sensor structure remained intact and reusable. This observation demonstrates two key performances of the proposed sensor: it achieves a measurement range of 10 MPa, and maintains high stability within the elastic deformation range. Thus, the Non-dominated Sorting Genetic Algorithm II can be employed to optimize the packaging structure of FBG strain sensors, thereby facilitating the development of FBG pressure sensors tailored to specific functional requirements.

5. Scaled Model Experiment of Wind Turbine Foundation

5.1. Experimental Design

To investigate the applicability of the spindle-type FBG pressure sensor proposed herein in practical engineering scenarios, an experimental study on a scaled model of the foundation ring-type wind turbine foundation was conducted. This study adopted a 2 MW foundation ring-type wind turbine foundation from a wind farm in Guizhou Province as the prototype. For the scaled model of the foundation ring-type wind turbine foundation, its geometric, material, and load parameters were determined based on similarity ratio principles under analogous environmental conditions [19].
The scaled model of the wind turbine foundation meets the similarity conditions in three aspects: geometry, physics and boundary, which are specified as follows:
S μ = S ε S L = S γ S L S μ = 1 , S σ = S E S ε , S τ = S G S γ S p = S σ , S P = S E S L 2 , S M = S E S L 3
Among them, Sμ is the similarity constant of displacement μ, Sε is the similarity constant of linear strain ε, SL is the similarity constant of geometric length L, Sγ is the similarity constant of angular strain γ, Sσ is the similarity constant of elastic stress σ, SE is the similarity constant of elastic modulus E, Sτ is the similarity constant of shear stress τ, SG is the similarity constant of shear modulus G, Sp is the similarity constant of concentrated force p, SP is the similarity constant of concentrated force P, SM is the similarity constant of bending moment M.
Accounting for constraints of the experimental environment, a 1:20 geometric similarity ratio was employed for the scaled model’s construction, with the structural dimensions of the scaled model detailed in Table 2. The tower of the wind turbine model was made of Q345-D steel, while C35 concrete was specified for the model foundation.
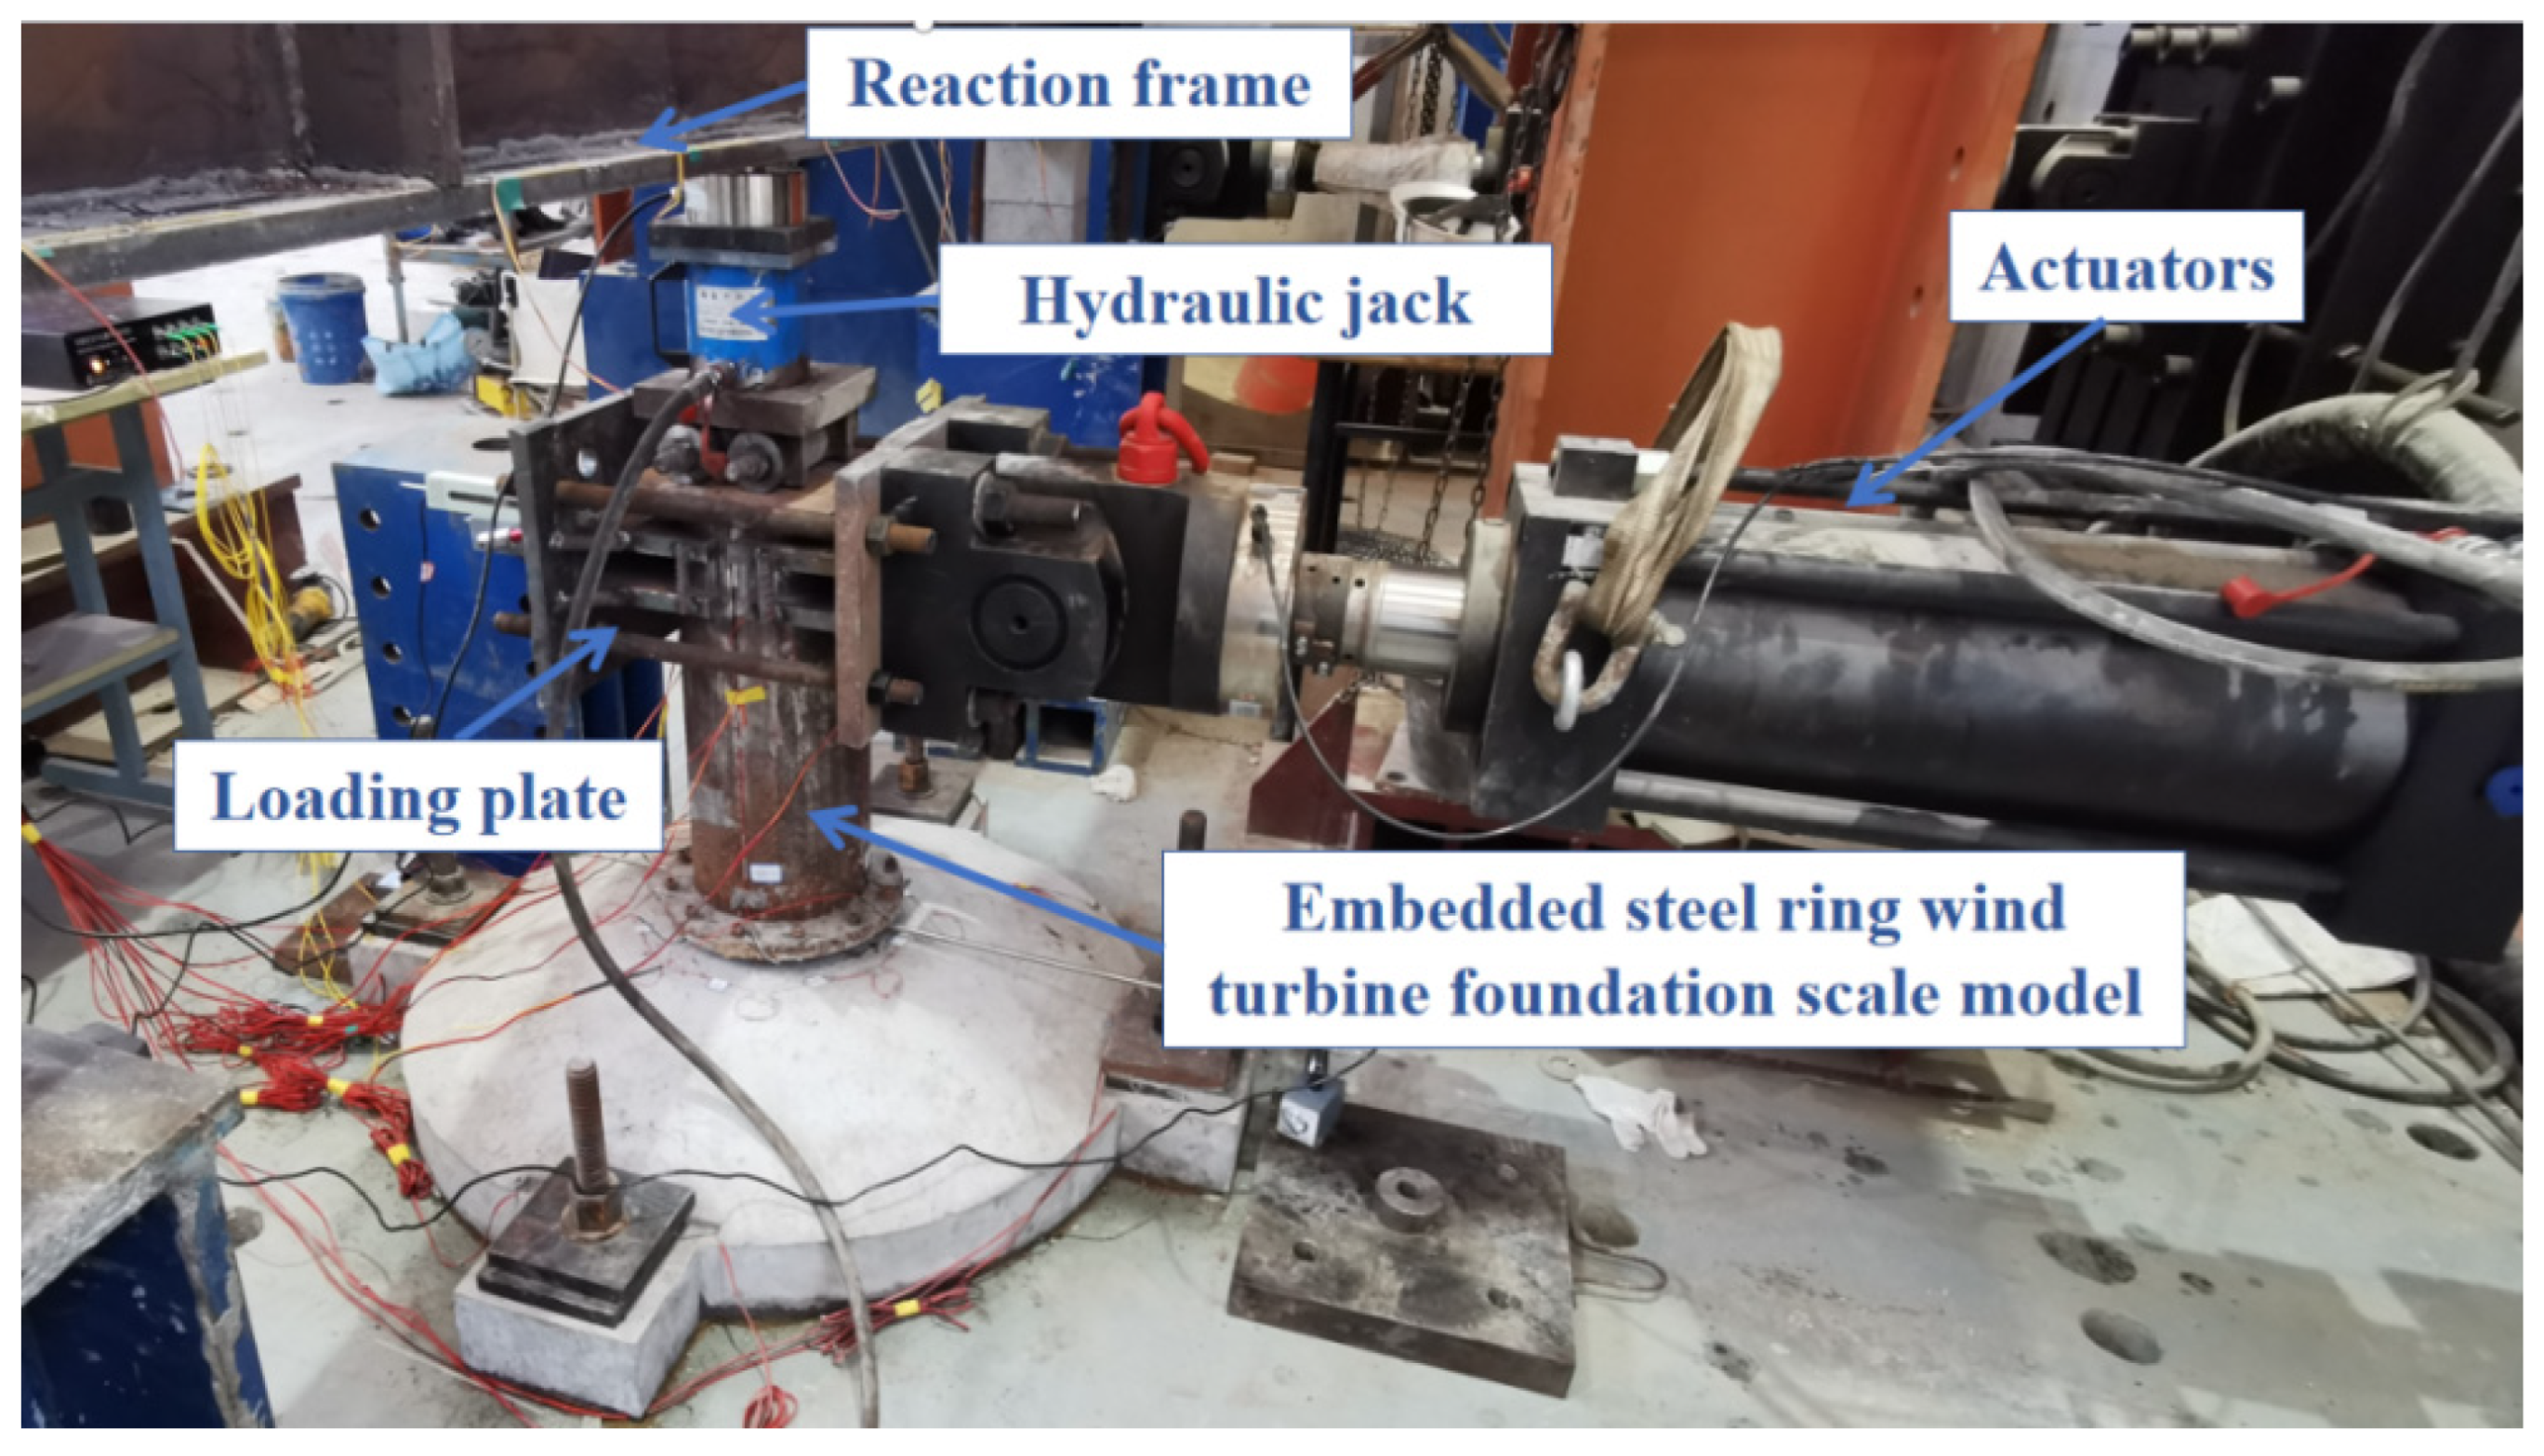
As shown in Figure 12, a 25-ton MTS actuator was used in the experiment to apply a horizontal load at the 70 mm-high loading plate on top of the tower. A thin-type hydraulic jack (Model: RCS-502; maximum load capacity: 50 tons) was fixed to the upper part of the wind turbine model via a reaction frame to apply a vertical load. According to existing research on the concrete deterioration mechanism of foundation ring-type wind turbine foundations, the foundation ring–concrete interface debonding initiates when the wind speed reaches 20 m/s. Based on Table 3, the horizontal equivalent load under this wind speed is 90.67 kN. The measured wind speed spectrum of a wind farm in Guizhou Province was used to determine that the average annual wind speed during the wind turbine’s service life is approximately 7 m/s, which translates to an equivalent static wind load of 20.93 kN at the top of the tower.
The experimental loading was divided into two phases:
Static loading phase: Loading was conducted in 17 stages at a rate of 5 kN/min, following the wind speed equivalent loads specified in Table 3, until the load reached 90.67 kN.
Fatigue loading phase: A low-cycle cyclic load of ±20.93 kN was applied to the tower at a loading rate of 125.58 kN/min.
The spindle-type FBG pressure sensor proposed in this study was used to monitor the pressure signal changes at the foundation ring–concrete interface during the wind turbine’s simulated service process, so as to verify the service performance of the spindle-type FBG pressure sensor in practical engineering scenarios. Signals from the spindle-type FBG pressure sensor were acquired using an FBG demodulator.
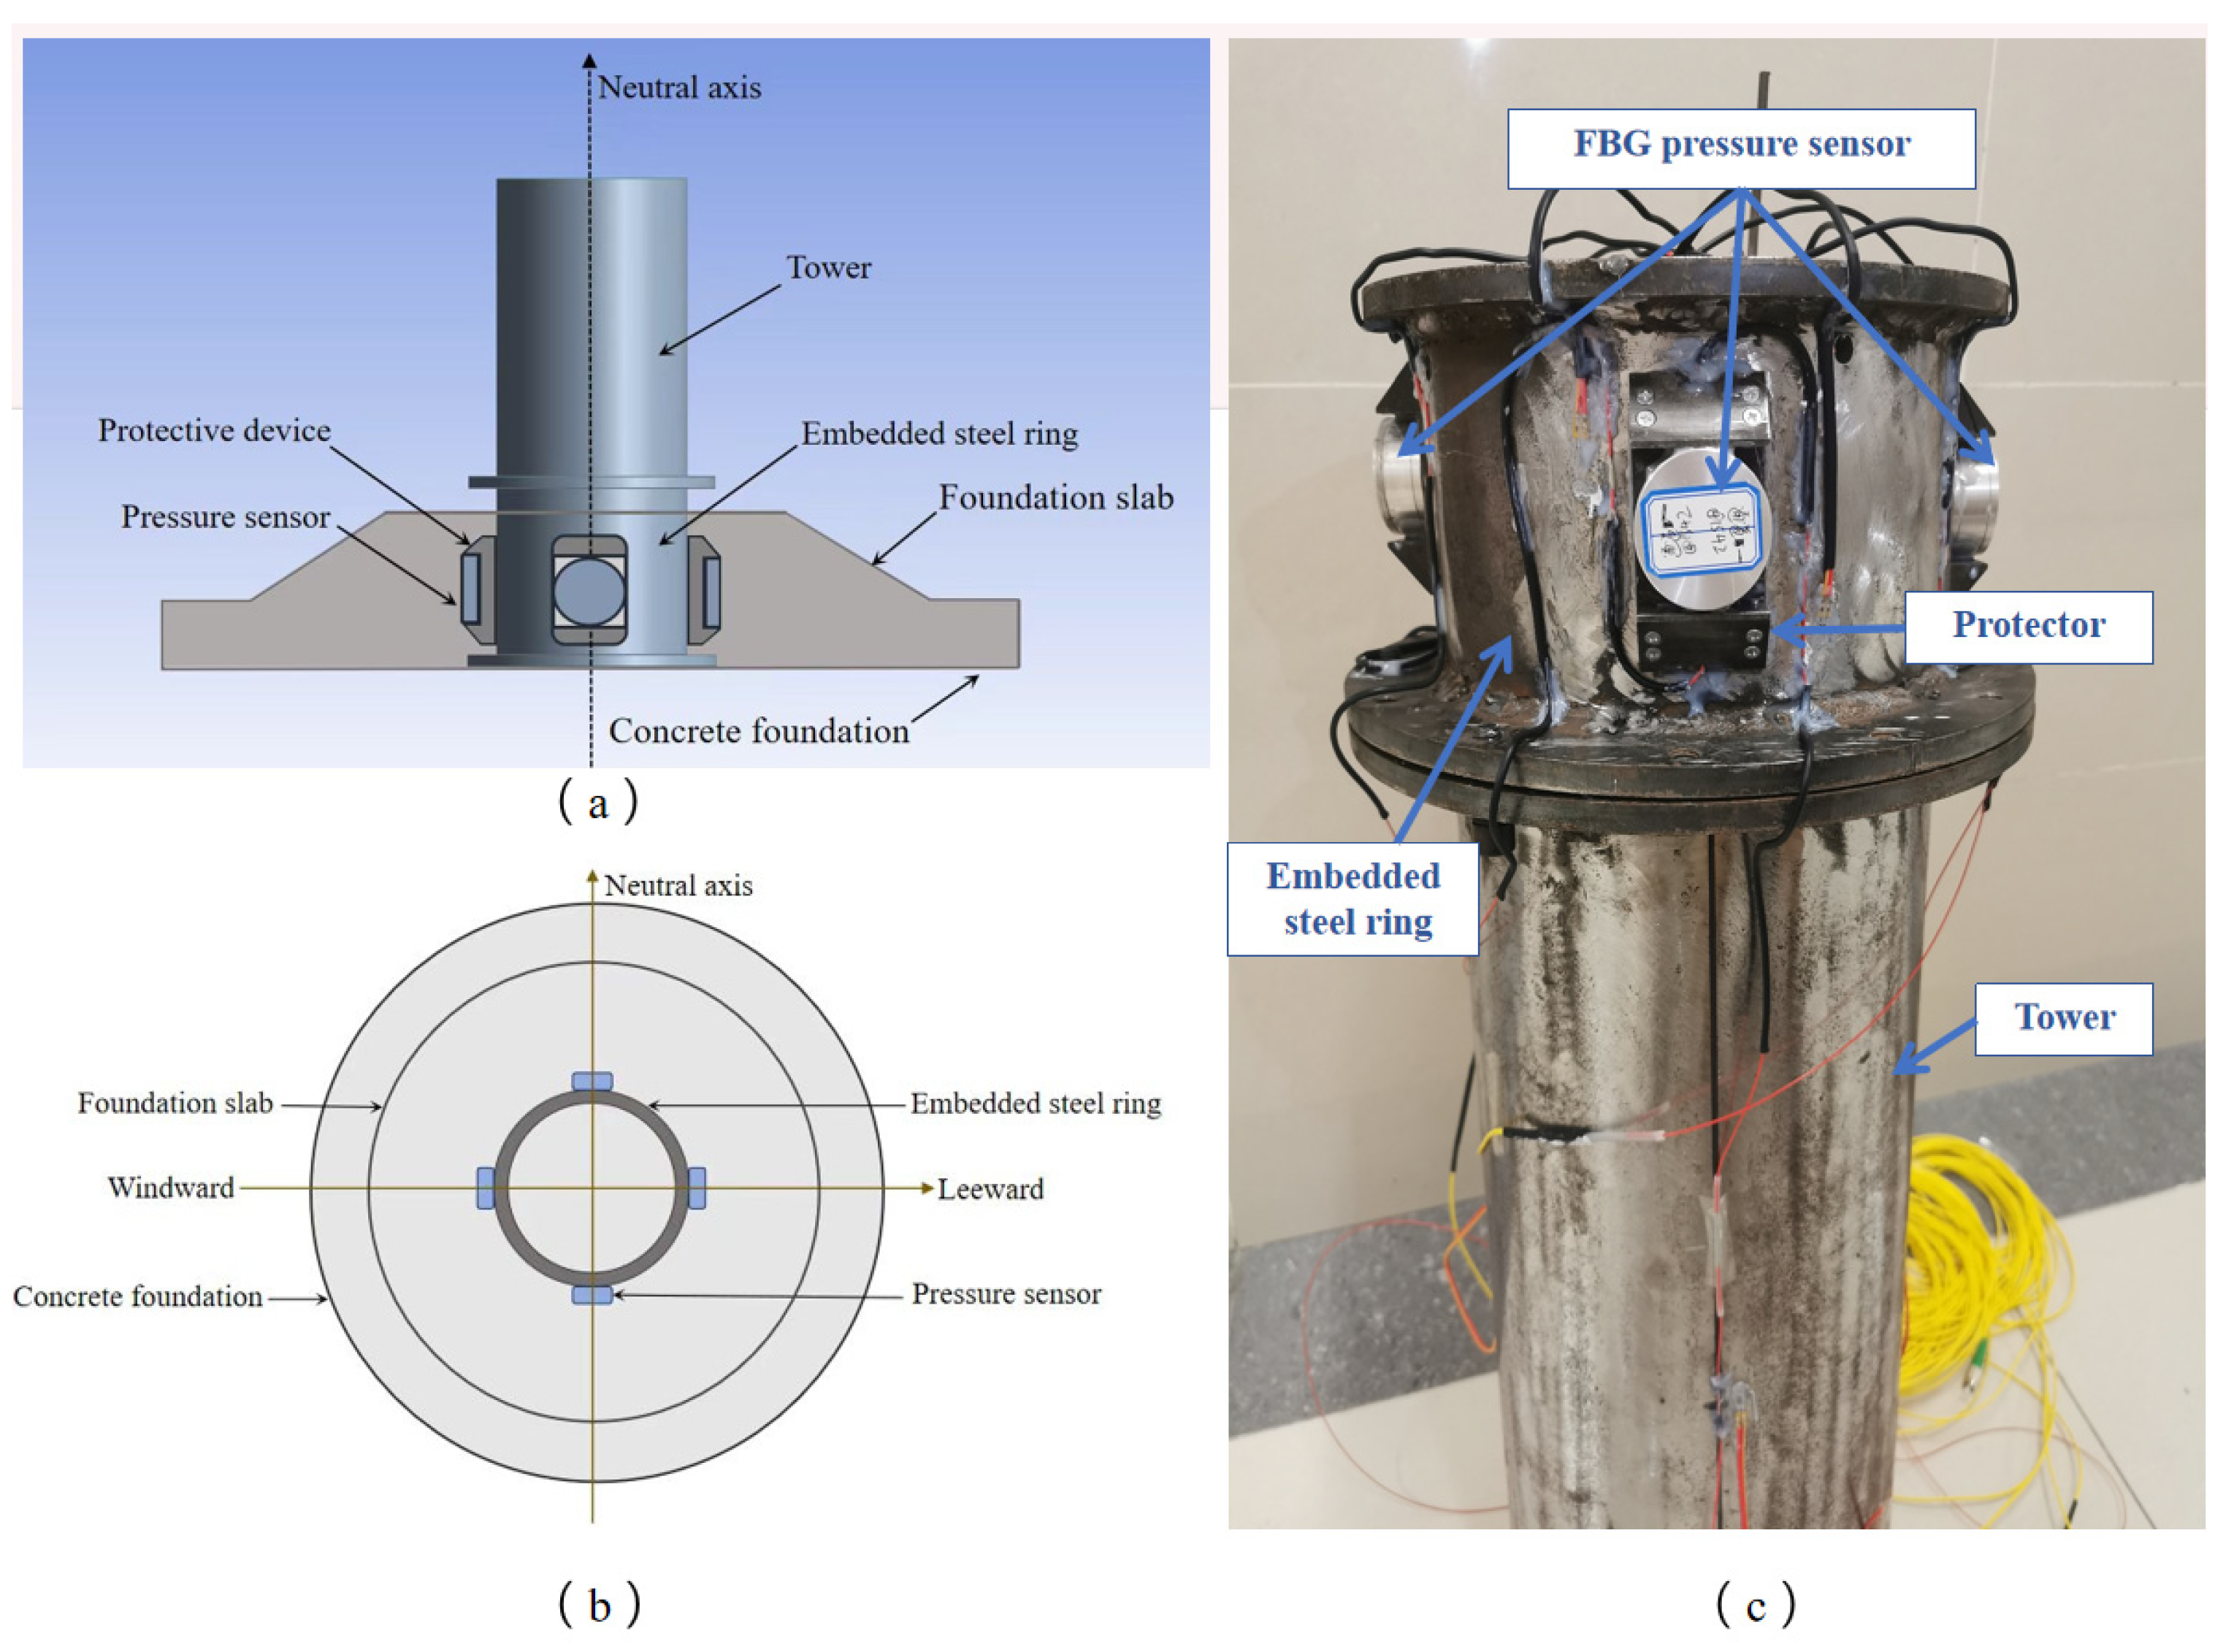
Based on the actual service conditions of wind turbines, the debonding at the foundation ring–concrete interface is found to first occur on the windward and leeward sides. Although the structural response along the neutral axis is minimal, it can still be used to detect deviations of the wind turbine tower. In this study, the action position of the MTS actuator was defined as the windward side in the wind turbine’s operating scenario, while the position 180° opposite to the windward side was designated as the leeward side. For this test, the spindle-type FBG pressure sensors proposed in this paper were installed at four angular positions on the cross-section of the foundation ring structure: windward side, positive neutral axis, leeward side, and negative neutral axis (see Figure 13). To enhance the survival rate of the pressure sensors and ensure their tight adhesion to the foundation ring surface, a groove-type sensor protection device was employed to maintain the sensors’ normal operation.

5.2. Analysis of Experimental Results

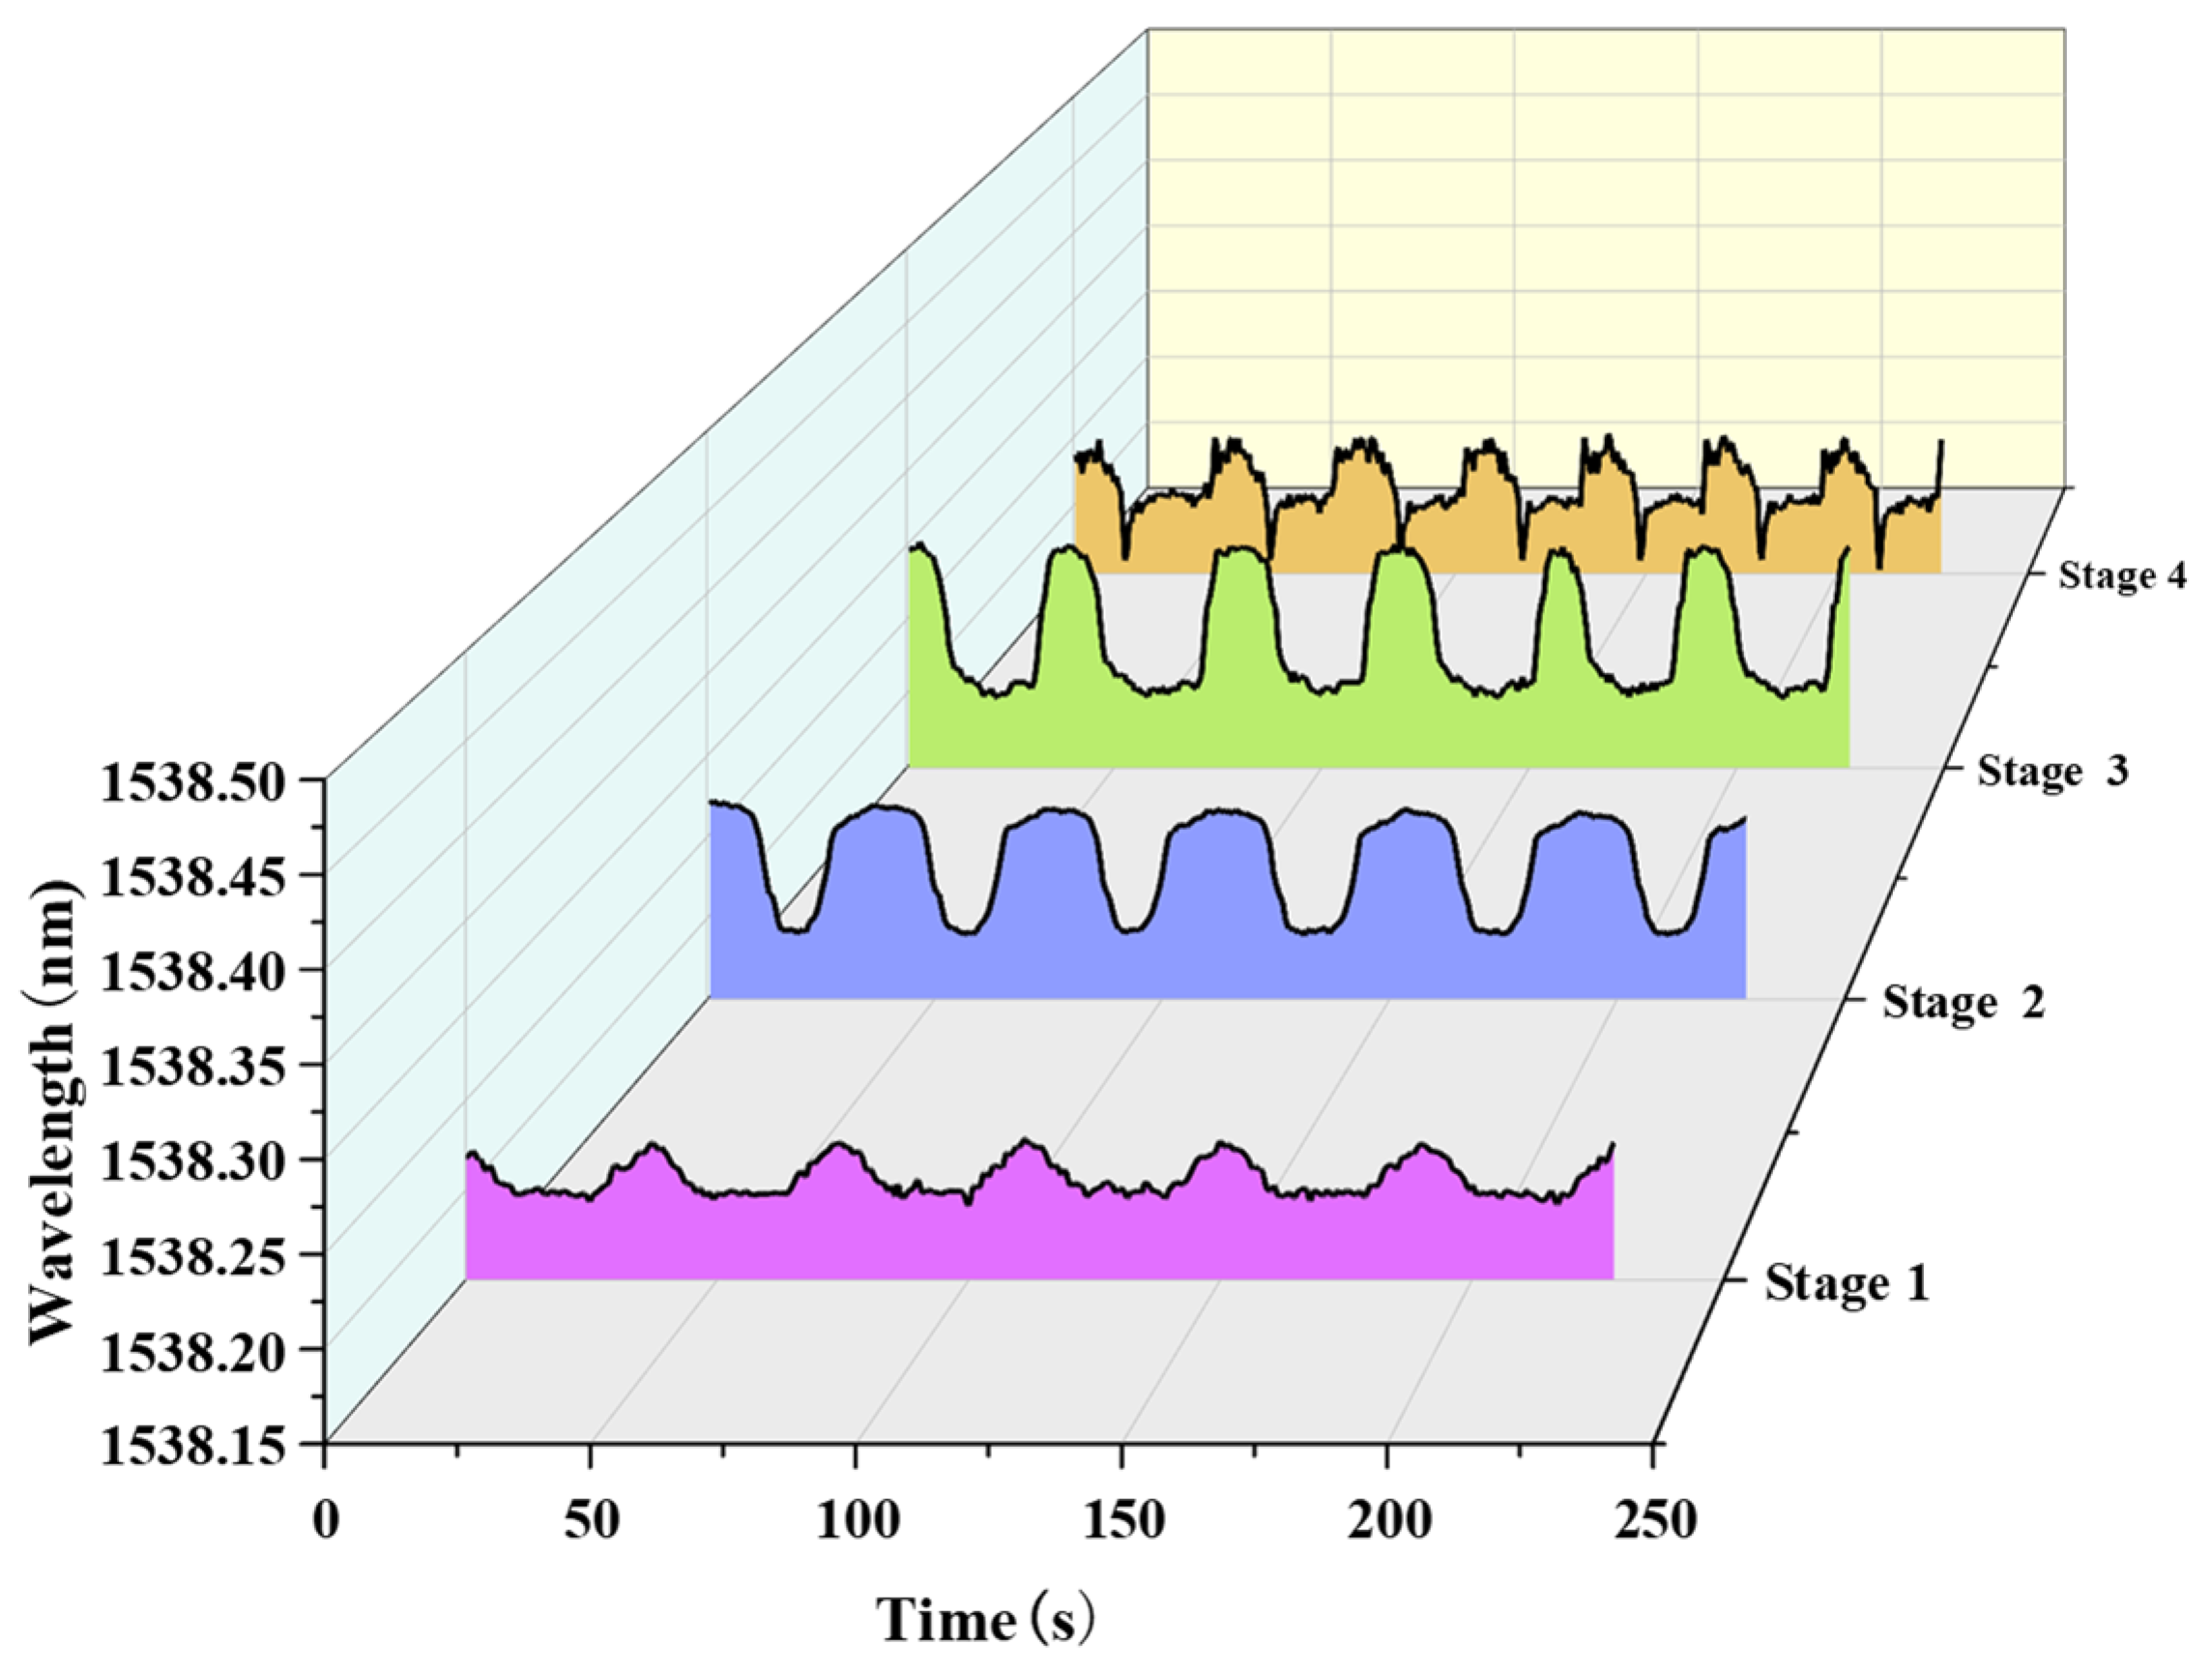
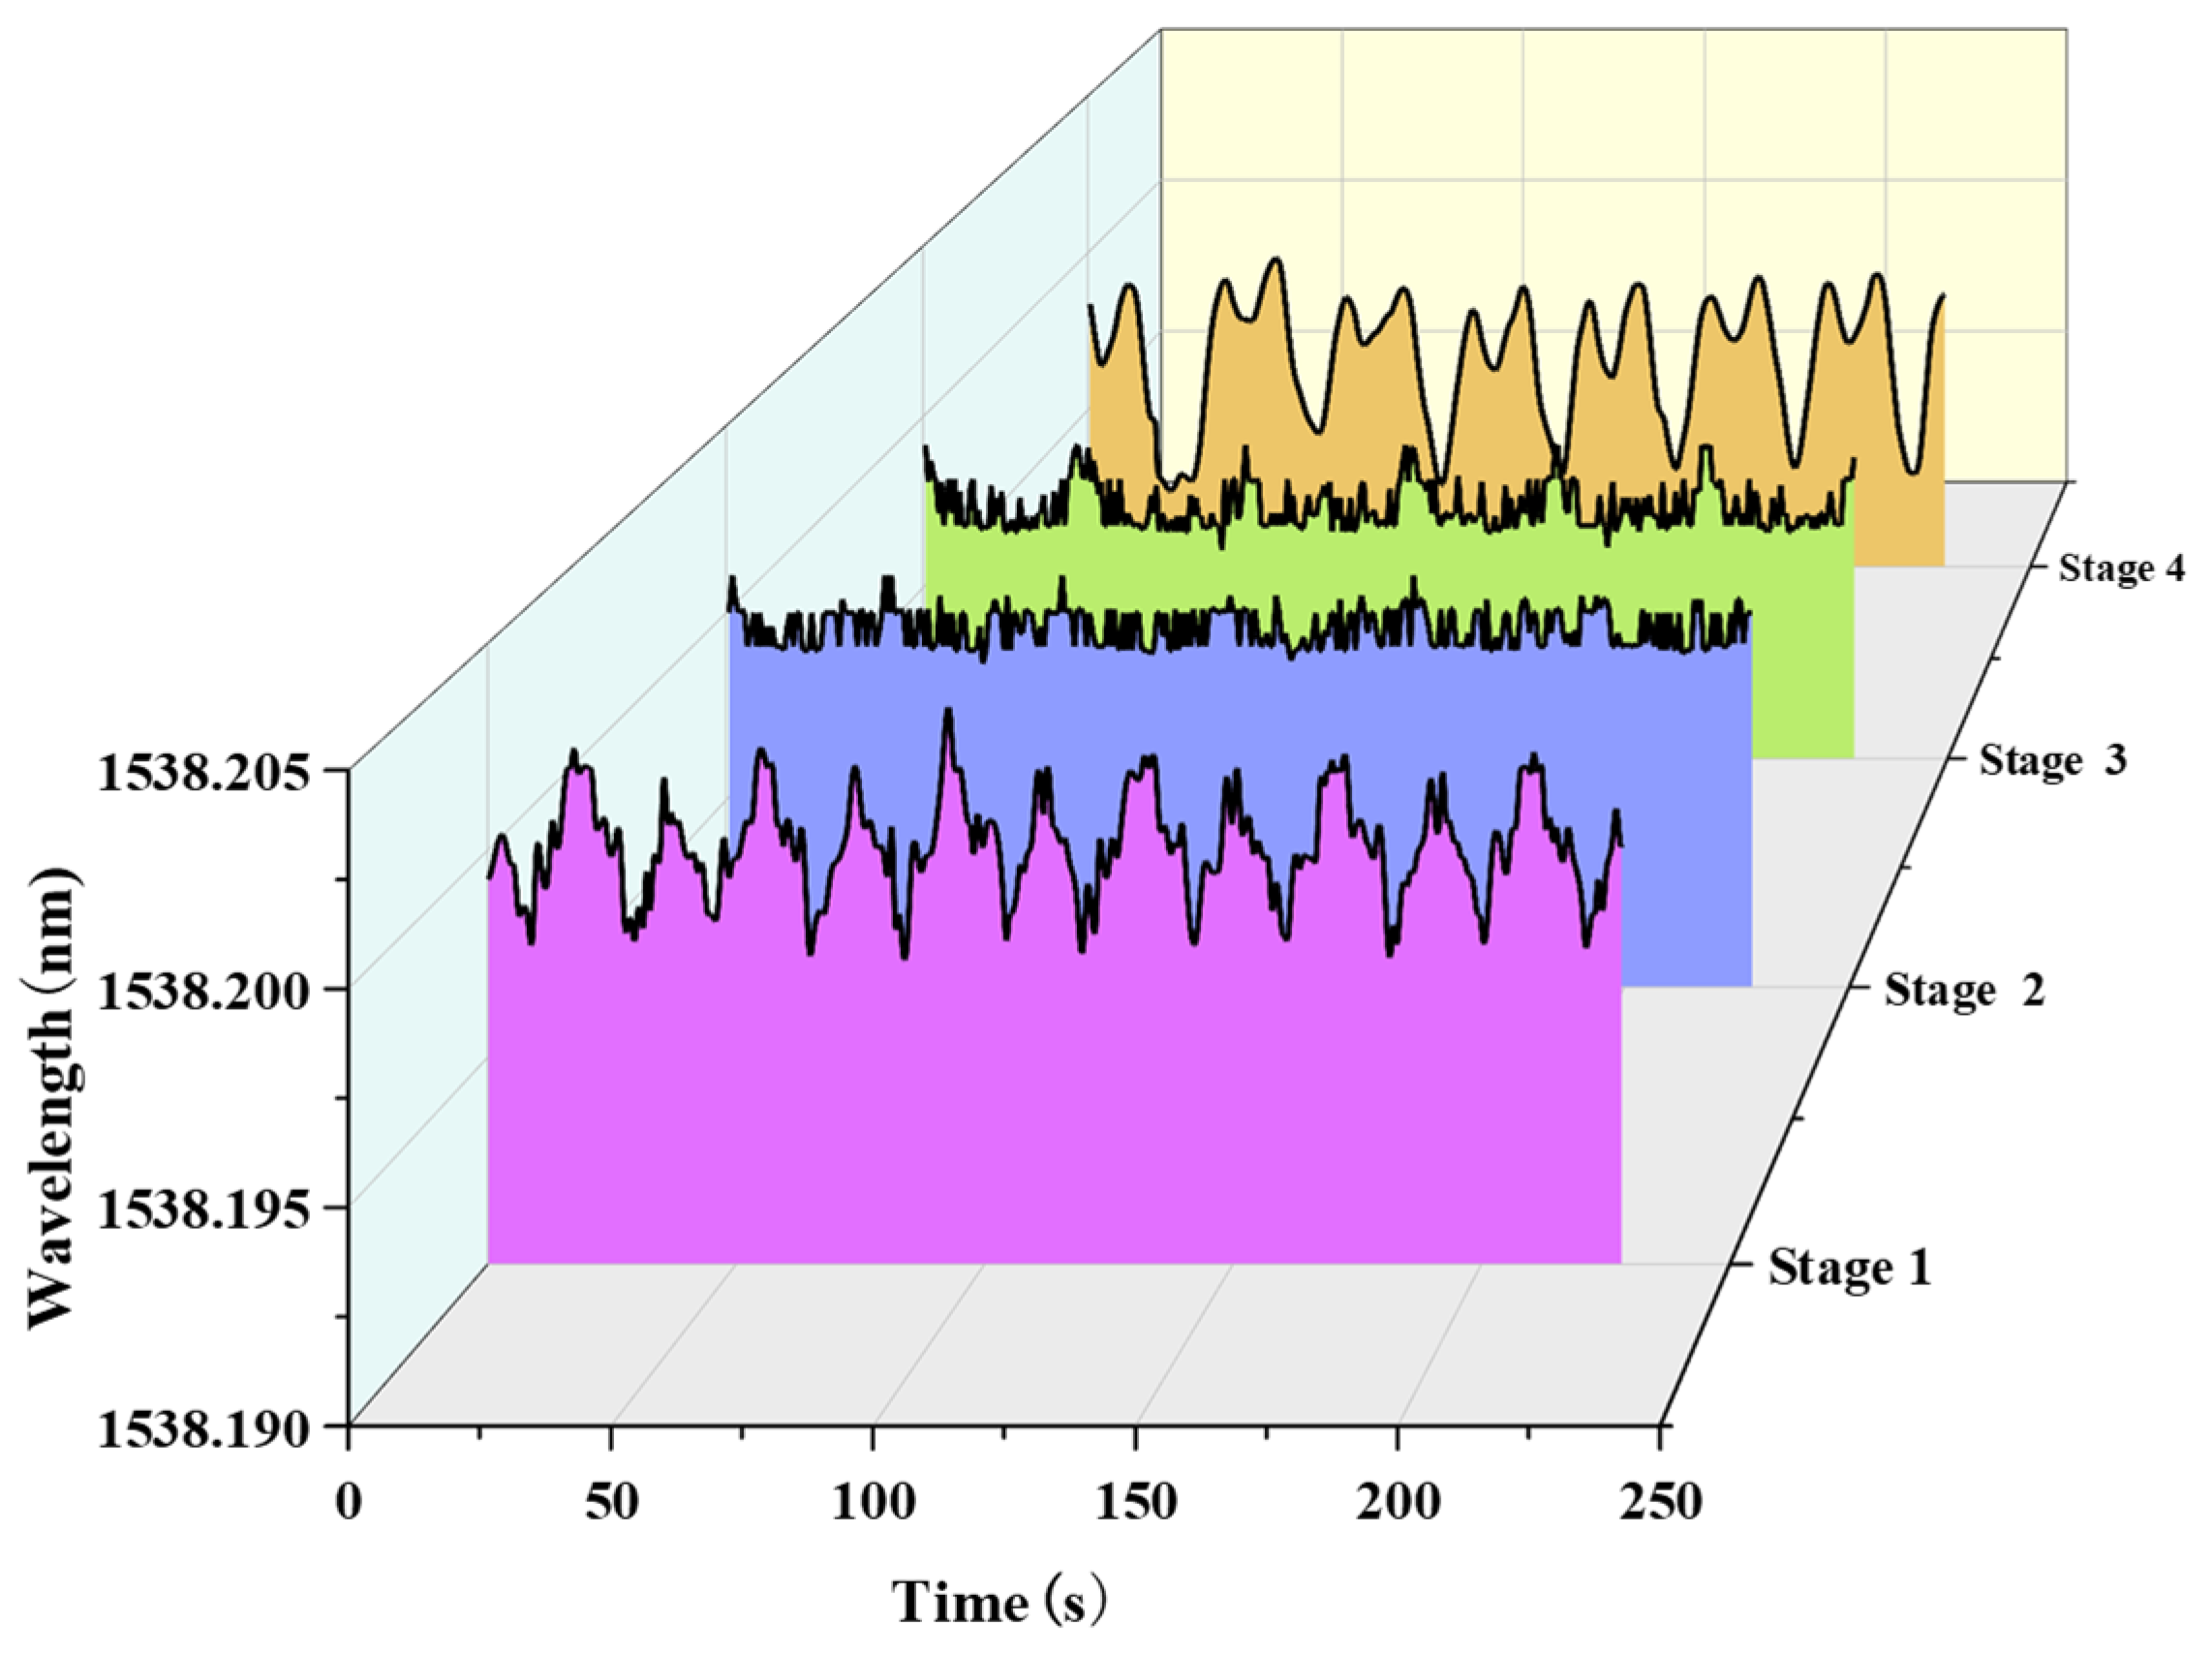
Based on the temperature influence elimination method presented in Section 4.2, this study used the wavelength variation in the temperature compensation grating inside the spindle-shaped FBG pressure sensor to determine the extent of temperature influence. Pressure-induced data were extracted by subtracting the central wavelength variation in the temperature compensation grating from that of the temperature-measuring grating. After eliminating temperature effects from the wavelength variations in the variations of the measuring gratings in the spindle-type FBG pressure sensors at the leeward side, windward side, and neutral axis, the monitoring data of these sensors under pressure influence were plotted in Figure 14, Figure 15, Figure 16 and Figure 17. Since the wavelength variations in the pressure sensors at the neutral axis were nearly identical, only the wavelength variation trend of the sensor at the positive neutral axis is presented herein.
Figure 13. Layout plan for pressure sensors: (a) Lateral view schematic diagram; (b) Top view schematic diagram; (c) On-site physical picture.
Photonics 12 01139 g013
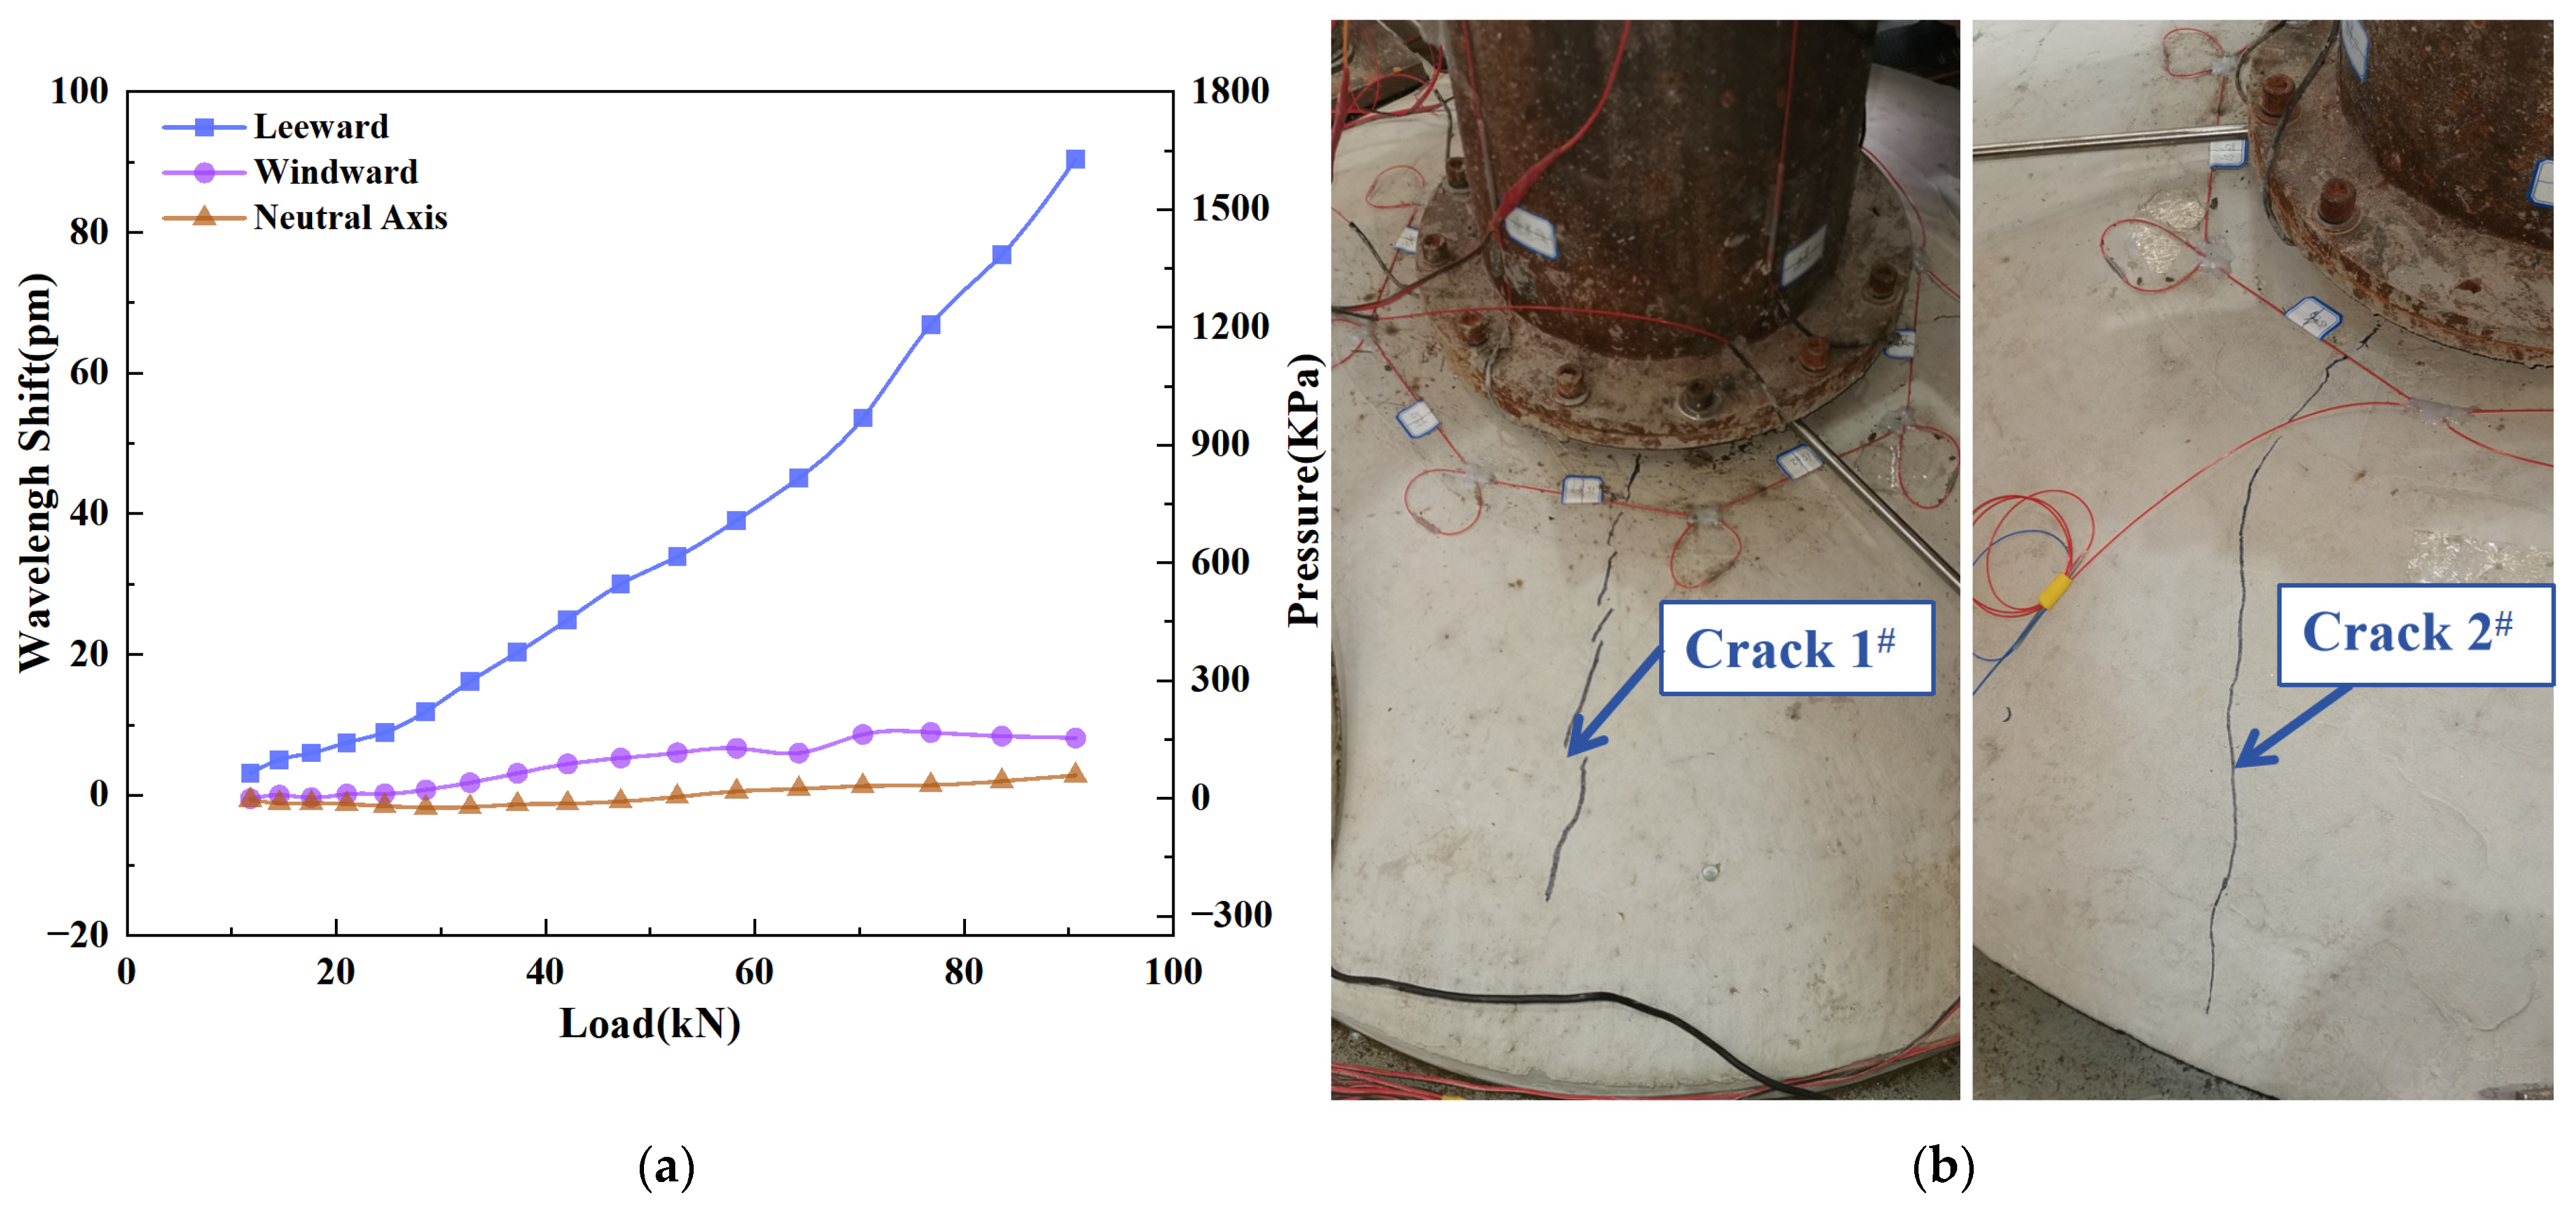
Figure 14. Results of the wind turbine foundation in static loading stage: (a) Monitoring data of FBG pressure sensors; (b) Cracks at the concrete platform.
Photonics 12 01139 g014
Figure 15. FBG pressure sensor monitoring data of leeward side at each stage.
Photonics 12 01139 g015
Figure 16. FBG pressure sensor monitoring data of windward side at each stage.
Photonics 12 01139 g016
Figure 17. FBG pressure sensor monitoring data of neutral axis at each stage.
Photonics 12 01139 g017
Figure 14a shows the FBG pressure sensor monitoring data under different load levels during the static loading stage. Using Equation (3) and the FBG pressure sensor sensitivity of 55.01 pm/MPa, the monitoring data were processed to obtain the pressure values at the interface between the foundation ring and concrete at each stage. The wavelength of the FBG pressure sensor on the leeward side of the foundation ring increased linearly with the increment of load. This phenomenon indicates that the pressure at the interface between the foundation ring and concrete on the leeward side of the foundation ring-type wind turbine is positively correlated with wind load. When the horizontal load reached 90.67 kN, the monitoring data of the FBG pressure sensor increased to 1.64 MPa. According to the theoretical bearing capacity of the foundation ring-type wind turbine, cracks should have appeared in the concrete cap at this point.
As shown in Figure 14b, when the horizontal load reached 64.23 kN, visible cracks occurred at the 210° and 305° positions of the concrete cap. With the increase in load, Crack 1# at 210° and Crack 2# at 305° of the concrete cap propagated until radial cracks formed. During the static loading test stage, the monitoring data of the pressure sensors at the windward side and neutral axis remained approximately around 0 kPa. This data characteristic confirms that the wind turbine foundation did not twist during the static loading stage, and displacement only occurred in the direction of wind load application. The above results demonstrate that the spindle-type FBG pressure sensor proposed in this study can effectively monitor the pressure variation law at the interface between the foundation ring and concrete under static load.
By applying low-cycle reciprocating fatigue loads to the wind turbine model and filling the formed cracks in the concrete bearing platform with water, the entire debonding process at the interface between the foundation ring and concrete was simulated. Due to the long duration of low-cycle fatigue load application, only representative data from 6 cycles (approximately 240 s) were selected for analysis in each stage.
As shown in Figure 15, at the initial stage of the fatigue load application, the wavelength increment of the pressure sensor at the leeward foundation ring–concrete interface exhibited a sawtooth-like variation. When the load reached the maximum value, the wavelength increased to a peak accordingly; when the load decreased to the minimum value, the pressure sensor was no longer subjected to pressure, and the monitoring data gradually returned to the initial value. When the debonding at the leeward foundation ring–concrete interface further progressed, the fatigue test entered the second stage. At this point, an obvious harmonic phenomenon appeared in the wavelength of the pressure sensor at the leeward foundation ring–concrete interface. With the increase in horizontal load, the pressure sensor first squeezed with the mud to form a small wave peak. Subsequently, the mud at the interface between the pressure sensor and concrete was squeezed out of the concrete bearing platform along the damage cracks from bottom to top inside the concrete, and the wavelength of the pressure sensor began to decrease. When the foundation ring came into contact with the concrete interface, there was no mud left at the interface, and the wavelength of the pressure sensor returned to the initial value. As the pressure sensor squeezed against the concrete interface, the wavelength of the pressure sensor reached a large wave peak; then, the pressure sensor debonded from the concrete interface, and the wavelength returned to the initial value again. When the foundation ring separated from the concrete interface, mud refilled the cavity, and the pressure value rose to a small wave peak. During the process of horizontal load changing from 0 kN to −20.93 kN, the wavelength of the pressure sensor remained around the initial value.
After the second stage lasted for 526 reciprocating load cycles, a plateau appeared in the peak wavelength of the leeward pressure sensor, and the foundation damage of the foundation ring-type wind turbine entered the third stage. In this stage, the peak wavelength of the leeward pressure sensor only showed a small wave peak when the foundation ring separated from the concrete interface. This phenomenon indicates that the mud formed by the mixture of broken concrete on the leeward side and rainwater had filled the entire crack cavity.
After the third stage lasted for 1200 fatigue load cycles, there was no longer a small wave peak in the leeward pressure signal, and the foundation damage entered the fourth stage. The wavelength variation trend of the leeward pressure sensor was “rising-flattening-falling”. This is because the increase in cracks led to more internal mud, and the mud played a wear role when squeezed, resulting in complete debonding at the leeward foundation ring–concrete interface.
In Figure 16, the wavelength variation trend of the pressure sensor at the windward side was similar to that at the leeward side in the first stage, both showing a sawtooth pattern. In the second stage, a short plateau appeared in the wavelength of the windward pressure sensor during the peak phase. In the third stage, the wavelength variation trend of the windward pressure sensor was consistent with that in the second stage, but the peak value was larger than that in the second stage. In the fourth stage, the peak wavelength of the windward pressure sensor decreased; combined with the analysis of Figure 15, this indicates that the extrusion effect at the interface between the windward foundation ring and the concrete foundation was weakened. According to the “lever principle”, the wind turbine as a whole tilted toward the leeward direction at this point. During the fatigue test, the wavelength variation in the pressure sensor at the neutral axis was small, which indicates that the wind turbine foundation still did not twist during the fatigue test (see Figure 17).
After calculating the pressure sensor wavelength data in Figure 15, Figure 16 and Figure 17, the maximum pressure values at the interface between the foundation ring and concrete on the leeward side, windward side, and neutral axis at each stage of the fatigue test were obtained (see Table 4).The maximum pressure at the leeward side shows a continuous upward trend across all stages, increasing from 451.88 kPa in Stage 1 to 3158.91 kPa in Stage 4. This significant growth (nearly 7-fold increase) indicates that the leeward foundation ring–concrete interface bears the main load during the fatigue test. With the progression of stages (from initial loading to complete interface debonding), the interface undergoes gradual damage (such as crack expansion and mud extrusion), and the stress concentration effect is continuously enhanced—hence the steady rise in maximum pressure.
The windward maximum pressure exhibits a “rise first, then fall” trend: it increases from 244.46 kPa (Stage 1) to 1808.36 kPa (Stage 3), then decreases to 905.45 kPa in Stage 4. The initial rise is consistent with the leeward side, as the windward interface also bears partial load during the early fatigue stage. The subsequent decline in Stage 4 is closely related to the “leeward tilt” of the wind turbine: as the overall structure tilts leeward, the stress on the windward interface is relieved, leading to a significant drop in maximum pressure.
The neutral axis maximum pressure is consistently low and shows a slight downward trend, even turning negative in later stages: it starts at 36.91 kPa (Stage 1), decreases to 8.36 kPa (Stage 2), and further drops to −14.91 kPa (Stage 3) and −18.91 kPa (Stage 4). The low pressure values confirm that the neutral axis is not a main stress-bearing area of the foundation, which aligns with the earlier observation that “the wind turbine foundation does not twist during the fatigue test.” The negative pressure in Stages 3 and 4 may be attributed to the slight tensile stress generated at the neutral axis interface as the foundation tilts leeward, but the magnitude is negligible and does not affect the overall stress distribution.
After the fourth stage lasted for 560 fatigue load cycles, the tilt degree of the wind turbine tower reached 16.9 mm/m. At this point, the overall structure of the wind turbine failed. The above phenomena indicate that the spindle-type FBG pressure sensing proposed in this study can effectively identify the entire process of debonding at the foundation ring–concrete interface inside the wind turbine foundation, providing a new idea for the internal structural health monitoring of the wind turbine foundation.
6. Conclusions

Aiming at the pressure monitoring requirement of the wind turbine foundation ring–concrete interface, this study proposes a spindle-type FBG pressure sensor optimized based on the NSGA-II algorithm, which effectively solves the problems of low survival rate and insufficient monitoring accuracy of traditional sensors in the harsh environment of wind turbines. With sensitivity and measuring range as the optimization objectives, the key parameters of the sensor (upper inner radius r of the spindle, inner radius R of the upper cover plate, thickness t of the upper cover plate, and elastic modulus E of the structural material) are optimized through the NSGA-II algorithm. The finally determined sensor parameters achieve a theoretical sensitivity of 70 pm/MPa and a measuring range of 11 MPa, meeting the core index requirements for wind turbine foundation monitoring.
Linearity tests verify that the actual sensitivity of the sensor with these parameters is 55.01 pm/MPa. Although this value is lower than the theoretical one, it is much higher than the minimum threshold of 10 pm/MPa. The linear correlation coefficient reaches 0.999, and the sensor structure remains intact and reusable, which proves that it has excellent linearity, repeatability and stability. Finally, in the static load and fatigue load experiments on the wind turbine foundation scale model, the sensor successfully captures the pressure change law of the foundation ring–concrete interface, verifying the effectiveness of the spindle-shaped FBG pressure sensor proposed in this paper for the full-process monitoring of internal damage in wind turbine foundations.

Author Contributions

Conceptualization, X.C., W.W. and Z.Y.; methodology, W.W., S.Z. and H.W.; software, Z.Y.; validation, W.W., Z.Y., X.C. and S.Z.; formal analysis, W.W., Z.Y., S.Z. and H.W.; investigation, Z.Y., X.C. and W.W.; resources, W.W. and H.W.; data curation, W.W. and Z.Y.; writing—original draft preparation, X.C., Z.Y. and W.W.; writing—review and editing, W.W. and H.W.; visualization, W.W., Z.Y. and X.C.; supervision, H.W. All authors have read and agreed to the published version of the manuscript.

Funding

This research was funded by The Growth of Young Scientific and Technological Talents of Guizhou Educational Commission: Qian Jiao Ji [2022] 370; Research Center for the Coordinated Development of the New Urbanization Construction of Qiandongnan Miao and Dong Autonomous Prefecture: YTH-PT202405.

Data Availability Statement

The raw data supporting the conclusions of this article will be made available by the authors on request.

Conflicts of Interest

The authors declare no conflicts of interest.

References

  1. Malekimoghadam, R.; Krause, S.; Czichon, S. A Critical Review on the Structural Health Monitoring Methods of the Composite Wind Turbine Blades. Springer 2021, 110, 409–438. [Google Scholar]
  2. Bado, M.F.; Casas, J.R. A Review of Recent Distributed Optical Fiber Sensors Applications for Civil Engineering Structural Health Monitoring. Sensors 2021, 21, 1818. [Google Scholar] [CrossRef] [PubMed]
  3. Chen, B.K.; Zhu, Z.R.; Su, Z.T.; Yao, W.; Zheng, S.J.; Wang, P. Optical fiber sensors in infrastructure monitoring: A comprehensive review. Intell. Transp. Infrastruct. 2023, 2, 18. [Google Scholar] [CrossRef]
  4. Malik, K.; Okan, E. Highly sensitive fiber optic pressure sensors for wind turbine applications. Turk. J. Electr. Eng. Comput. Sci. 2021, 28, 2789–2796. [Google Scholar]
  5. Zhu, P.Y.; Feng, X.B.; Liu, Z. Reliable packaging of optical fiber Bragg grating sensors for carbon fiber composite wind turbine blades. Compos. Sci. Technol. 2021, 213, 108933. [Google Scholar] [CrossRef]
  6. Bang, H.J.; Jang, M.; Shin, H. Structural health monitoring of wind turbines using fiber Bragg grating based sensing system. Int. Soc. Opt. Photonics 2011, 7981, 716–723. [Google Scholar]
  7. McAlorum, J.; Perry, M.; Fusiek, G. Deterioration of cracks in onshore wind turbine foundations. Eng. Struct. 2018, 167, 121–131. [Google Scholar] [CrossRef]
  8. João, P.; Francisco, P.; Silvina, G. Experimental evaluation of fatigue in wind turbine blades with wake effects. Eng. Struct. 2024, 300, 117140. [Google Scholar]
  9. Awada, A.; Younes, R.; Ilinca, A. Review of Vibration Control Methods for Wind Turbines. Energies 2021, 14, 3058. [Google Scholar] [CrossRef]
  10. Perry, M.; McAlorum, J.; Fusiek, G. Crack Monitoring of Operational Wind Turbine Foundations. Sensors 2017, 17, 1925. [Google Scholar] [CrossRef] [PubMed]
  11. Burhanuddin, W.A.F.W.; Ahmad, H.; Alias, M.A. Multiparameter Fiber Bragg Grating (FBG)-Based Sensor Fabricated Using 3-D Printing Technology for Precise Measurement of Vertical Earth and Pore Pressure. IEEE Sens. J. 2024, 24, 25793–25801. [Google Scholar] [CrossRef]
  12. Zhou, H.J.; Yu, S.J.; Chen, J.Y. An Optical Fiber Soil Pressure Sensor with Double Sensitive Surfaces. Acta Armamentarii 2023, 44, 132–137. [Google Scholar]
  13. Delyová, I.; Frankovský, P.; Bocko, J. Sizing and Topology Optimization of Trusses Using Genetic Algorithm. Materials 2021, 14, 715. [Google Scholar] [CrossRef] [PubMed]
  14. Kociecki, M.; Adeli, H. Two-phase genetic algorithm for topology optimization of free-form steel space-frame roof structures with complex curvatures. Eng. Appl. Artif. Intell. 2014, 32, 218–227. [Google Scholar] [CrossRef]
  15. Stankovic, T.; Storga, M.; Marjanovic, D. Synthesis of Truss Structure Designs by NSGA-II and NodeSort Algorithm. J. Mech. Eng. 2012, 58, 204–212. [Google Scholar] [CrossRef]
  16. Wu, W.J.; Sun, B.; Chen, S.Y. Membrane-based optical fiber Bragg grating pressure sensor for health monitoring of pile foundations. Appl. Opt. 2024, 63, 3039–3045. [Google Scholar] [CrossRef] [PubMed]
  17. Rebello, C.M.; Martins, M.A.F.; Santana, D.D.; Rodrigues, A.E.; Loureiro, J.M.; Ribeiro, A.M.; Nogueira, I.B.R. From a Pareto Front to Pareto Regions: A Novel Standpoint for Multiobjective Optimization. Mathematics 2021, 9, 3152. [Google Scholar] [CrossRef]
  18. Ma, H.; Zhang, Y.; Sun, S. A comprehensive survey on NSGA-II for multi-objective optimization and applications. Artif. Intell. Rev. 2023, 56, 15217–15270. [Google Scholar] [CrossRef]
  19. Addis, B. Past, current and future use of physical models in civil engineering design. Proc. Inst. Civ. Eng. Civ. Eng. 2021, 174, 61–70. [Google Scholar] [CrossRef]
Figure 1. Principle of FBG sensing.
Photonics 12 01139 g001
Figure 2. Spindle-type FBG pressure sensor structural.
Photonics 12 01139 g002
Figure 3. Finite element model.
Photonics 12 01139 g003
Figure 4. Relationship between structural dimensions of FBG pressure sensors and sensitivity as well as measurement range: (a) Inner radius R and spindle’s diameter d, (b) Thickness t, and (c) Upper inner radius r.
Photonics 12 01139 g004
Figure 5. Relationship between structural material performance for FBG pressure sensors and sensitivity as well as measurement range.
Photonics 12 01139 g005
Figure 6. Flowchart for structural optimization of spindle-type FBG pressure sensors.
Photonics 12 01139 g006
Figure 7. Spindle-type FBG pressure sensor.
Photonics 12 01139 g007
Figure 8. The linearity experimental setup.
Photonics 12 01139 g008
Figure 9. Spectral diagram of spindle-type FBG pressure sensor.
Photonics 12 01139 g009
Figure 10. The variation in the center wavelength under pressure.
Photonics 12 01139 g010
Figure 11. The influence of pressure on the FBG center wavelength shift.
Photonics 12 01139 g011
Figure 12. Schematic diagram of scaled model experiment.
Photonics 12 01139 g012
Table 1. Structural parameters of FBG pressure sensor finite element analysis model.
θRtdhE
48°32 mm4 mm50 mm16 mm70 GPa
Table 2. Wind turbine prototype and model structure dimensions.
θPrototype Structure of Wind TurbineScale Model Structure of Wind Turbine
Tower height (m)770.5
Tower bottom diameter (m)4.30.22
Tower wall thickness (mm)18~4010
Foundation bottom diameter (m)18.90.945
Foundation height (m)4.20.21
Concrete thickness (mm)1508
Embedded steel ring height (m)2.190.11
Table 3. Equivalent value of horizontal load under different wind speeds.
Wind speed (m/s)48121620
Equivalent horizontal load (kN)11.7924.6342.1264.2390.67
Table 4. Maximum pressure at foundation ring–concrete interface in each stage.
Stage1234
Leeward (kPa)451.882188.362439.643158.91
Windward (kPa)244.461269.461808.36905.45
Neutral Axis (kPa)36.918.36−14.91−18.91
Disclaimer/Publisher’s Note: The statements, opinions and data contained in all publications are solely those of the individual author(s) and contributor(s) and not of MDPI and/or the editor(s). MDPI and/or the editor(s) disclaim responsibility for any injury to people or property resulting from any ideas, methods, instructions or products referred to in the content.