Abstract
Optically pumped magnetometers (OPMs) present a promising opportunity to advance magnetoencephalography (MEG), enhancing the accuracy of neuronal activity recordings due to their high spatiotemporal resolution. However, to fully realize the potential of OPM-MEG as an emerging brain functional imaging technology, it is essential to measure key indicators of neural dynamics, particularly phase–amplitude coupling (PAC). PAC is a fundamental mechanism for integrating information across different frequency bands and plays an important role in various cognitive functions and neurological disorders. Therefore, measuring PAC with OPM-MEG is a crucial step toward expanding its applications. In this study, brain signals under pitch sequence stimulation were recorded using OPM-MEG to analyze the PAC effect in the primary auditory cortex (Aud) and the inferior frontal gyrus (IFG), as well as the functional connectivity between brain regions. The findings were validated through EEG control experiments. The results indicated that the PAC effect measured by OPM-MEG was largely consistent with that measured by EEG, with OPM-MEG appearing to detect PAC more prominently under the current experimental conditions. The PAC of Aud exhibited a trend of initially increasing and then decreasing centered on the target pitch, showing hemispheric symmetry. The PAC of IFG showed variations under different pitch conditions and displayed right hemisphere lateralization. Functional connectivity analysis provided convergent evidence for the mechanisms underlying the PAC effect and suggested the reliability of the OPM-MEG system in capturing cross-frequency neural dynamics. To our knowledge, this study provides the first task-based evidence that OPM-MEG can measure PAC effects in cortical regions, offering an initial foundation for future investigations of brain dynamics using this technology.
1. Introduction
In recent years, optically pumped magnetometer-based magnetoencephalography (OPM-MEG) has garnered increasing attention [1]. OPMs can operate through several modalities, including spin-exchange relaxation-free (SERF) [2], Mx/Mz (transverse and longitudinal radio-frequency resonance) [3], Bell–Bloom (intensity-modulated optical pumping) [4], and coherent population trapping (CPT) [5], among others. Among these, the SERF type is the most widely applied in current OPM-MEG systems. Compared with conventional cryogenic superconducting MEG systems, OPM-MEG provides several advantages. It does not require cryogenics, is wearable and lightweight, and allows sensors to be positioned close to the scalp. These features improve signal quality and enhance experimental flexibility, making the equipment suitable for a broader range of populations and dynamic task settings [6]. OPM-MEG has been successfully applied to auditory, visual, and somatosensory evoked responses [7]. It has also shown promise in clinical contexts such as detecting epileptic spikes [8] and monitoring pharmacological effects [9]. In auditory paradigms, OPM-MEG enables neural recordings not only during rest, but also during naturalistic behaviors involving head and body movements [10]. This flexibility pushes the boundaries of neuroimaging research.
Due to its high sensitivity and superior spatiotemporal resolution [11], OPM-MEG holds substantial potential for capturing key neurodynamic metrics such as phase–amplitude coupling (PAC). PAC describes a mechanism in which the phase of low-frequency oscillations modulates the amplitude of high-frequency oscillations. It is regarded as a fundamental process that links large-scale brain integration with localized computation [12]. Previous studies have demonstrated that PAC plays a role in various cognitive functions, including perception [13], attention [14], and memory [15]. Additionally, it may serve as a potential biomarker for neurological disorders such as Alzheimer’s disease [16], autism spectrum disorder [17], schizophrenia [18], obsessive–compulsive disorder [19], and Parkinson’s disease [20]. In the auditory system, PAC in the delta–beta frequency band has recently received particular attention. Evidence suggests that it contributes to encoding top-down temporal predictions from motor regions to sensory regions. This highlights a feedforward mechanism within the perception–action loop [21]. Consequently, the ability to measure PAC accurately and reliably in naturalistic task conditions is crucial for understanding neurodynamic processes in brain networks and for advancing both cognitive neuroscience and clinical diagnostics.
To date, a variety of traditional neuroimaging techniques have been used to study PAC [22]. Among these, electroencephalography (EEG) is widely used for measuring PAC in cognitive tasks [23] and clinical applications [24], owing to its straightforward operation and high temporal resolution. However, EEG signals are significantly affected by volume conduction due to their travel through the scalp and skull. This reduces spatial resolution and makes accurate source localization difficult [25], particularly in deep or marginal cortical regions [26]. To address these limitations, magnetoencephalography (MEG) has been introduced as a complementary technique. Superconducting quantum interference device-based magnetoencephalography (SQUID-MEG) can detect weak magnetic fields generated by neural activity. It provides higher spatial resolution and greater immunity to volume conduction than EEG [27]. SQUID-MEG has effectively identified PAC effects in various cortical regions during visual and motor tasks [28]. Nevertheless, the technology relies on bulky cryogenic equipment and fixed sensor arrays, and it is susceptible to head movements. These limitations restrict its use in naturalistic or complex cognitive tasks [29]. Therefore, despite the foundational progress achieved with existing technologies, a more flexible, low-interference, and high-precision modality is needed to improve PAC measurement.
OPM-MEG has the advantage of overcoming the limitations of SQUID-MEG in terms of technical principles and is regarded as an ideal tool for achieving high-precision PAC measurement in natural conditions. However, there remains a lack of research based on this technology to empirically measure the PAC effect and explore its formation mechanism. On the one hand, the OPM-MEG system still faces several challenges in practical applications, such as the limited number of sensors, incomplete spatial coverage, and susceptibility to external magnetic field interference [30]. These factors may affect the capture accuracy of high-frequency amplitude and the stable extraction of low-frequency phases, thereby interfering with the reliable estimation of PAC. On the other hand, achieving stable and repeatable PAC analysis in natural scenes is still restricted by multiple factors, such as paradigm design, preprocessing strategies, and source localization accuracy, and there are many challenges. Addressing these challenges is essential not only to validate the capacity of OPM-MEG in measuring neural dynamics but also to reveal coupling mechanisms that may be difficult to detect with traditional MEG in natural conditions. To address this gap, this study aimed to evaluate the ability of OPM-MEG to capture PAC effects under naturalistic conditions. Brain activity was recorded using a 32-channel OPM-MEG system during the classic pitch sequence perception task [31], with a 64-channel EEG system used as a reference. The analysis focused on PAC features and their dynamics in the auditory cortex (Aud) and inferior frontal gyrus (IFG).
This paper first uses principal component analysis to extract the time series of representative-source neural activity in the region of interest after source reconstruction. Then, based on the trial-averaged waveform of the representative source time series in the auditory region, it verifies whether fundamental pitch sequence stimulation can induce brain responses with the same frequency and consistency as the stimulation of the two measurement methods. This step confirms the effectiveness of the experimental paradigm design and data processing. Subsequently, the overall phase–amplitude coupling (PAC) effect and the time-varying PAC effect in the auditory region and inferior frontal gyrus (IFG) during the stimulation task are analyzed to assess the sensitivity and stability of PAC measured by OPM-MEG. In addition, the directional connection between brain regions is measured to investigate the formation mechanism of PAC, thereby providing support at the formation mechanism level for the OPM-MEG measurement of the PAC effect.
2. Materials and Methods
2.1. Subjects and Experiments
Seven healthy volunteers (six males and one female), aged between 24 and 29 years, were recruited for this study. All participants were right-handed native Chinese speakers with no congenital developmental, auditory, neurological, or psychiatric disorders. Each individual provided informed consent and willingly agreed to participate in the study. The study protocol was approved by the Ethics Committee of Beihang University and adhered to the ethical principles outlined in the Declaration of Helsinki.
In this study, the experimental paradigm adopted is illustrated in Figure 1. Each trial consisted of five pure tones. The first three pitches and the fifth pitch were all C6 (1047 Hz), which served as the standard tone. The fourth tone, known as the target tone, was randomly selected with deviations of 0, 25, 50, 100, or 200 cents from the standard tone (where 100 cents equals one semitone). Each tone lasted for 100 milliseconds, with a 350-millisecond interval between tones, resulting in a total duration of 1.5 s for each trial. Additionally, there was a 3.5 s interval between consecutive trials. The ratio of standard stimuli (0 cents deviation), small deviation stimuli (25 and 50 cents deviation), and large deviation stimuli (100 and 200 cents deviation) were set at 2:1:1.

Figure 1.
Experimental Paradigm of Pitch Sequences.
Before starting the experiment with the OPM-MEG system, participants underwent training to familiarize themselves with the task. They were instructed that upon hearing a deviant stimulus, they should tap a balloon with their left index finger after hearing the sequence tone, indicating that they had detected the abnormal pitch. Conversely, if they did not hear the deviant stimulus, they should tap the balloon with their right hand. In the EEG system experiment, a keyboard was used instead of the balloon to record tapping times synchronously. During the formal auditory experiment, both the OPM-MEG system and the OPM-MEG were scanned twice, with each scan consisting of 192 trials, resulting in a total of 384 trials. To minimize participant fatigue, a 10 min break was scheduled between the two scans.
2.2. Data Acquisition System
2.2.1. OPM-MEG System
The OPM-MEG recordings for the pitch sequence perception experiment were conducted using the OPM-MEG experimental system, as illustrated in Figure 2. This system employs 32 second-generation magnetometers (Quspin Inc., Louisville, CO, USA) to measure radial brain magnetic field signals from regions including the bilateral temporal, frontal, and parietal cortices. MEG signals were recorded using a PXI computer chassis (PXIC-7318C, ART Technology Inc., Beijing, China). The experimental system operated inside a magnetically shielded room (MSR), which consisted of two layers of high-permeability alloy and one layer of copper, and was equipped with degaussing coils to reduce the magnetization of the high-permeability layers. In the central region of the MSR, the residual magnetic field was below 10 nT, and the magnetic field gradient was less than 0.1 nT/cm [32].
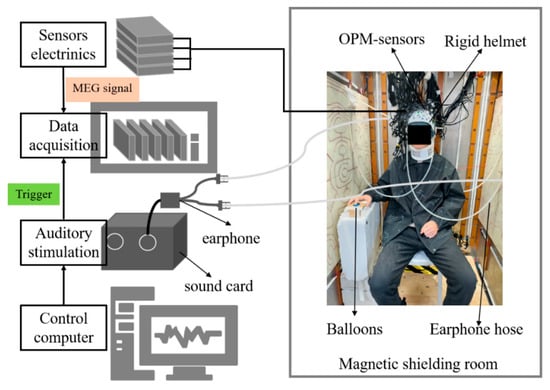
Figure 2.
OPM-MEG system.
All OPM sensors were automatically calibrated according to the manufacturer’s zero-field calibration procedure (Accurate Field Zeroing Instructions V1.0, Quspin Inc.) a few seconds before each experiment to ensure optimal performance during recording. Specifically, each OPM sensor head is integrated with three-axis compensation coils. During calibration, the system first automatically adjusts the coil currents along the x, y, and z axes to gradually cancel the residual environmental magnetic field, bringing it close to zero (<100 pT). The sensor is then calibrated, and sensors with a calibration value below 1.5 meet the manufacturer’s guidelines and are deemed suitable for data acquisition. Sensors exceeding this threshold must be replaced to ensure optimal overall performance of the OPM-MEG system.
During the experiment, the pitch sequences were generated and controlled by Psychology Toolbox software 3.0.18 installed on the stimulation system. The sounds were delivered via headphones and transmitted to the MSR through plastic tubing to minimize interference with the MEG recordings.
2.2.2. EEG System
In this paper, the BrainAmp MR EEG system with 64 channels was used for the control experiment, and the schematic diagram of the system is shown in Figure 3. The data of the EEG system were collected by BrainAmp MRplus EEG amplifier (Brain Products, Munich, Germany), with a sampling rate of 1 kHz and the frequency range of 0.06–250 Hz (30 dB roll-off at high frequency). The electrode layout followed the extended international 10–20 system layout. Before the experiment, a 63-channel EEG cap composed of Ag/AgCl electrodes and copper wire was installed on the subject’s head, and the other electrode was placed on the subject’s chest to record the subject’s ECG signal synchronously. During the experiment, the electrode impedance was kept below 10 kΩ (checked regularly between recordings).
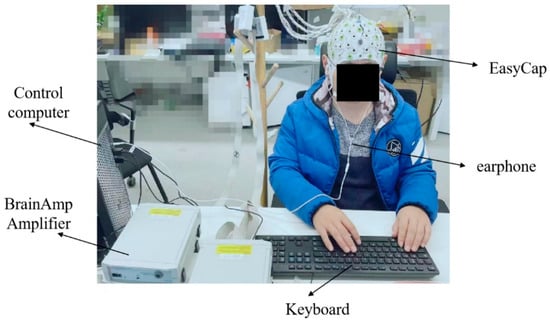
Figure 3.
EEG system.
2.3. Data Collection and Preprocessing
2.3.1. Data Collection
A total of 960 s of data were acquired per participant in each experimental session. All OPM channels were sampled at 16-bit resolution and 1000 Hz sampling rate, and the EEG system used the system’s default 1000 Hz sampling rate. A 120 s resting state measurement was performed before each recording to verify that the system was working properly. During the recording, the subjects were asked to look at the red cross-posted in front of them to reduce head movement and visual interference.
After collecting the EEG and OPM-MEG experimental data, 3D digital images of the participants’ heads were obtained using an optical imaging system (Einscan H, SHINING 3D, Hangzhou, China) for structural registration with the participants’ MRI scans. The MRI data were acquired prior to the experiment using the Siemens MAGNETOM Vida 3.0T BioMatrix system (Siemens, Munich, Germany). T1-weighted MRI scans of all subjects were acquired using the MPRAGE sequence (TR, 2200 ms, TE, 2.53 ms, TI, 1000 ms, FA, 8; field of view, 256 × 256 × 192 mm; voxel size = 1 × 1 × 0.8 mm3).
2.3.2. Preprocessing
The data preprocessing process is illustrated in Figure 4a. The preprocessing of EEG and OPM-MEG data differed in that EEG data was first processed using an electrode average reference, while the OPM-MEG data utilized uniform field correction, as described in the literature [33], to reduce interference from remote source noise in the spectrum. After this initial step, both data types underwent bandpass filtering, which filtered the data within the range of 1.5 to 70 Hz. Additionally, bad segments of the data were manually identified and removed. Independent component analysis was then employed to eliminate artifacts, such as those caused by heartbeats and blinking. Following this, the continuous data was divided into epochs; each epoch began 1.5 s before the stimulation and concluded 1.3 s after the presentation of the pitch sequences. Consequently, the total duration of each extracted epoch was 4.3 s.
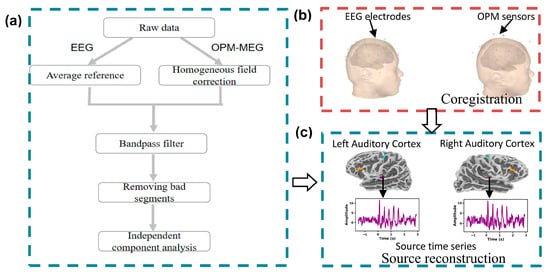
Figure 4.
Schematic diagram of the data analysis process. (a) Data preprocessing process; (b) sensor and brain MRI registration; (c) source signal reconstruction of the region of interest. In the figure, purple indicates the region of interest in the auditory cortex (Aud), orange indicates the region of interest in the inferior frontal gyrus (IFG), and cyan indicates the region of interest in the motor area (Mot).
To eliminate brief artifacts potentially caused by minor head movements or sensor drifts, we computed the per-trial signal standard deviation (STD) using a 0.7 s sliding window with 50% overlap. Trials were excluded if the STD within any sliding window during the stimulus period exceeded twice the mean STD across all trials for that window, effectively removing head-movement-related artifacts. Figure 5 shows an example of the remaining trials after this procedure. As illustrated, no large-amplitude abrupt changes were observed within the same window following trial removal.
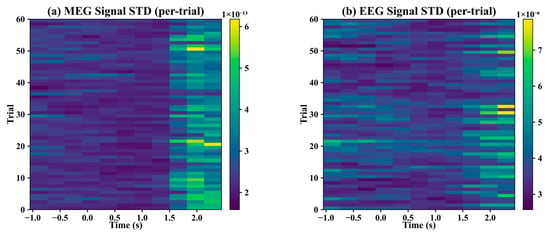
Figure 5.
Per-trial signal standard deviation.
2.4. Source Reconstruction
After the experiment, the 3D digital image was first used to align with the scalp surface extracted from the MRI to obtain the relative position and direction between the OPM sensor and the MRI, as well as the relative position between the EEG electrode sensor and the MRI (EEG has no direction, so only position alignment (i.e., only facial matching) is required). The alignment process uses the method presented in the literature [34] to obtain the transformation matrix that maps the sensor coordinates to the MRI space, thereby providing a unified spatial basis for subsequent forward modeling. The final position of the electrode and OPM sensor relative to the brain is shown in Figure 4b.
Subsequently, Cortical reconstruction was performed using FreeSurfer software v7.2.0 on T1-weighted MRI images. This process involved separating the scalp, skull, and brain tissue through the application of the watershed algorithm, which resulted in the creation of a three-layer boundary element model (BEM) [35]. The source space was defined within the MRI coordinate system, and the forward solution was computed by combining the transformation matrix with the BEM [36]. The noise covariance matrix was estimated from baseline data collected between −1.5 and 0.0 s. Finally, the source distribution was determined using depth-weighted minimum norm estimation [37], with a depth parameter set to 0.8 [38].
During source reconstruction, the results from all individuals were mapped to the “fsaverage” brain template [39] to ensure standardized alignment of the source space across subjects. Additionally, to enhance the accuracy of the source range, this study focused on limiting the source space to the functional regions covered by the sensors, which include the auditory cortex, inferior frontal gyrus, and primary motor region (see Figure 4c). All of these processes were implemented using MNE-Python software 1.8.0 [40,41].
2.5. Source-Level Time Series Extraction and Analysis
In order to effectively extract the representative time series of the brain region of interest from the source reconstruction results, this paper employs principal component analysis combined with sign flipping [42]. Specifically, suppose that a region of interest contains source vertices, with each vertex having a time series of length . These vertex signals can be combined to form a time series matrix . First, perform mean removal on the time series of each vertex to obtain a central matrix:
Among them, denotes the average value of each vertex time series, while is a one-dimensional column vector filled with instances of 1, denotes the transpose of a vector. Subsequently, calculate the covariance matrix between vertices and determine the first principal component direction:
Among them, is the eigenvector corresponding to the maximum eigenvalue , that is, the direction of the first principal component, which represents the dominant spatial pattern of activation of the brain region of interest. Then the concentrated data is projected along the direction of the first principal component to obtain a representative time series:
Finally, to ensure that the output time series is consistent with the activation direction of most vertices, calculate the Pearson correlation coefficient between each vertex signal and . If the sum of their signs is negative,
then a flip is performed, that is, , to ensure that the direction of the representative sequence is consistent with the direction of most vertices. All of the above operations are conducted on a single trial signal.
After extracting the representative time series from all trials in the region of interest, the evoked response effect at the source level of the auditory region was analyzed by trial average to verify the reliability of the experimental paradigm design. This step aimed to verify the reliability of the experimental design, preprocessing strategy, and source localization results. The experimental paradigm was designed primarily to induce the auditory response based on the timing of the sound sequence, specifically within a frequency band of 2–4 Hz. Therefore, the delta (2–4 Hz) frequency band was selected for further analysis of the evoked response at the source level in the auditory region. In the above analysis process, in order to objectively analyze the evoked response effect, the t-test for zero mean was conducted to determine the significance of the auditory evoked response, which occurred approximately 100 ms (M100) after the stimulus.
2.6. PAC Analysis
2.6.1. Calculation Method
After obtaining the representative time series for the region of interest, the time-varying tPAC algorithm developed by Samiee et al. [43] is used to calculate the phase–amplitude coupling (PAC). The process begins with bandpass filtering the representative time series signal, referred to as , to produce a high-frequency signal denoted as . Next, the standard Hilbert transform is applied to extract the amplitude envelope from the filtered signal. Subsequently, the power spectral density (PSD) of both the amplitude envelope and the original signal is calculated for each time window using a sliding window approach. The maximum coupled low frequency, denoted as , is identified as the frequency at which the PSD peaks of the amplitude envelope and the original signal coincide. Finally, the corresponding phase value is obtained through additional bandpass filtering and the Hilbert transform.
Finally, the amplitude and phase were expressed as polar vectors, and the Euclidean average of these vectors in the current time window was divided by the power of the amplitude envelope to obtain the coupling strength in this time window. As shown in Formula (5), the coupling phase is the phase of the normalized vector , and is the coupling amplitude.
represents the data length for averaging, which is equal to or shorter than the sliding window . is an integer used to determine the length of .
The analysis workflow for phase–amplitude coupling (PAC) was as follows. First, based on previous literature [44], the low-frequency band of interest was defined as 2–12 Hz, and the high-frequency band was set to 15–70 Hz. The robustness of the tPAC algorithm was then tested to determine the appropriate narrow-band filtering parameters. Subsequently, the overall PAC effect was evaluated in four regions of interest during the 0–1.5 s tone-sequence task. To investigate dynamic changes in PAC, the average PAC strength (expressed in Z scores) for each sequence node was calculated using a 700 ms sliding window with 50% overlap, centering each time window on its respective sequence node. Finally, the coupling effects between standard and deviant pitches were compared within the mutant pitch window, which spanned 0.7 to 1.4 s.
2.6.2. tPAC Statistical Analysis
When analyzing the dynamic changes in PAC, in order to evaluate the statistical significance of tPAC values, the non-parametric resampling technique is first used to perform Z-scores on the tPAC values of different pitch sequence time windows. Specifically, the non-parametric resampling technique follows the method described in reference [44], and each surrogate signal is generated by randomly selecting five time points in the trial period to subdivide the instantaneous phase signal into five blocks. These blocks are then randomly shuffled, and the resulting block shuffled phase signal and the original instantaneous amplitude time series are used to estimate the surrogate tPAC, which implements the assumption that the surrogate tPAC obtained from the surrogate data is at the chance level. For each trial, 500 surrogate datasets are generated using the above resampling technique. At this time, the surrogate tPAC values obtained from the alternative data are non-standard normal distributions. To measure the degree of deviation of the original data tPAC from the chance level, Formula (6) is used to standardize the original data tPAC value relative to the surrogate distribution by Z-scoring to evaluate the significance of the original data tPAC value.
In order to statistically assess whether the tPAC values for all time windows exceeded the mean chance-level tPAC, a multiple-comparison correction was applied to the significance p value. Differences in tPAC across windows were then evaluated using repeated measures analysis of variance (ANOVA) with Tukey’s post hoc test.
2.7. Connectivity Analysis
The generation of intra-regional phase–amplitude coupling results from the interconnected signaling in the brain. To provide evidence for this regional coupling, this study utilized phase transfer entropy (PTE) [45] to estimate the flow of information between regions of interest (ROIs). PTE is a measurement technique derived from transfer entropy (TE), which serves as a model-free implementation of the Wiener causal principle [46,47]. From the perspective of information theory, a source signal is considered to have a causal effect on a target signal if the uncertainty in predicting the current target signal with past target and source signals is less than the uncertainty in predicting it using only past target signals. The specific formula for this relationship is as follows:
where represents the transfer entropy from the source signal to the target signal , represents the interaction delay between and , and represents the discrete time step of the adopted signal.
Lobier et al. [45] introduced the concept of phase transfer entropy (PTE) based on the idea of transfer entropy (). They estimated the information transfer between two signals by analyzing the time series of the instantaneous phase of those signals. For clarity, the subscript is omitted. The formula is as follows:
Due to the lack of meaningful boundaries in PTE, for the convenience of analysis, this study normalized the results between −0.5 and 0.5, and the sign indicates the dominant direction of the functional connection:
When information flows from time series to time series , . Conversely, when information flows from time series to time series , . when there is no preferred direction of information flow, . In the statistical analysis of connectivity, the t-test was utilized to assess the information flow within a single state by comparing it to a mean of zero. To analyze hemispheric lateralization, phase–amplitude coupling (PAC) and information flow strength were compared between the left and right hemispheres using paired t-tests. At the same time, to ensure the validity of the statistical inferences, effect sizes, confidence intervals (CI), and observed power were reported following the approach described in [48]. Effect sizes were quantified using Cohen’s for paired-sample t-tests or partial eta squared (η2p) for analyses of variance (ANOVA).
3. Results
3.1. Results of the Source-Level Evoked Responses Analysis
Figure 6 illustrates the averaged source reconstruction results across all participants, with each response time corresponding to the M100 latency for each pitch. The strongest source responses in both MEG and EEG were localized to the temporal lobe regions, with additional activations observed in the inferior frontal gyrus and prefrontal cortex. These findings are consistent with source localization results reported in a previous study using a similar experimental paradigm [49], supporting the feasibility of the sensor placement, preprocessing, and source reconstruction procedures applied in the present study.
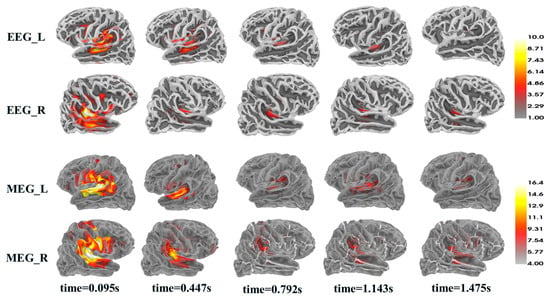
Figure 6.
Grand-average source reconstruction results.
Figure 7a shows the waveform of the evoked response following the averaging trial data of the representative time series from the auditory region source. The shaded area represents the error range between subjects. It can be seen that a strong M100 response appears after each pitch, which is consistent with the evoked response waveform described in the literature [50], indicating that the subjects’ response to the stimulus is in line with expectations. The vertical dotted line indicates the midpoint of all time points at which the M100 response after each pitch is significantly different from the zero mean (p < 0.001). The results of OPM-MEG and EEG are highly consistent, and the corresponding left and right significant time points are the same, that is, the M100 response time is not biased on the left and right hemispheres. Figure 7b shows the waveform of the evoked response after averaging the trial data of the representative time series of the 2–4 Hz source in the auditory region. Its M100 peak period is highly consistent with the stimulation rhythm frequency (2.85 Hz), which aligns with the typical cortical tracking effect described in the literature [51], indicating that the pitch sequence stimulation does induce a same-frequency response in the auditory cortex.
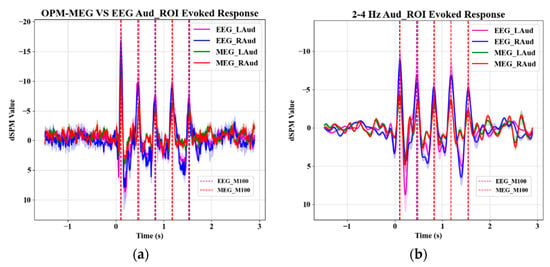
Figure 7.
Source-evoked response waveforms of auditory regions. (a) Comparison of source-level evoked responses in the full-band between OPM-MEG and EEG in auditory region; (b) comparison of source-level evoked responses in the 2–4 Hz frequency band between OPM-MEG and EEG in auditory region.
In conclusion, source-level evoked response analysis confirmed that the pitch sequences triggered the same frequency response in the auditory region, and the OPM-MEG and EEG measurements had good consistency, proving that the paradigm design, preprocessing strategy, and source localization results were reliable.
3.2. Results of the Algorithm Robustness Test
To verify the robustness of the tPAC method used in this study and to guide parameter selection, we first conducted parameter testing using OPM-MEG data from the left auditory cortex. We performed auxiliary validation using the mean vector length (MVL) method [52] for comparison. As shown in Figure 8, PAC was observed across all tested narrow-band filter settings, indicating its presence. When the high-frequency narrow-band filter width was fixed at 5 Hz, consistent coupling trends were observed across all low-frequency narrow-band filter widths, with the most substantial PAC effect occurring when the low-frequency narrow-band width was set to 2 Hz. Conversely, when the low-frequency narrow-band filter width was fixed at 2 Hz, consistent coupling patterns were observed across all high-frequency narrow-band filter widths, and the most substantial PAC effect was found when the high-frequency narrow-band width was set to 5 Hz. These results indicate that, although the choice of narrow-band filter parameters influences the measured coupling strength, the tPAC algorithm can reliably detect phase–amplitude coupling. Based on these findings, PAC calculations in this study were performed using a low-frequency narrow-band filter width of 2 Hz and a high-frequency narrow-band filter width of 5 Hz. To further confirm that the observed PAC was not specific to tPAC, the MVL algorithm was applied to assess the coupling effect. As illustrated in Figure 8, the MVL results were consistent with those obtained using tPAC, demonstrating the robustness of the tPAC method for phase–amplitude coupling analysis in this study.
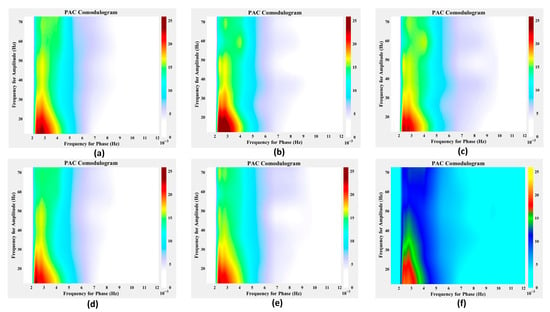
Figure 8.
Performance of the algorithm under robustness testing. (a–c) Results obtained when the high-frequency narrow-band width was fixed at 5 Hz, with low-frequency narrow-band widths set to 1 Hz, 2 Hz, and 3 Hz, respectively. (d,b,e) Results obtained when the low-frequency narrow-band width was fixed at 2 Hz, with high-frequency narrow-band widths set to 2.5 Hz, 5 Hz, and 7.5 Hz, respectively, where panel (b) is shared between the two parameter settings for comparison. (f) Corresponding results obtained using the MVL method.
3.3. Results of the PAC Analysis
Figure 9 shows the phase–amplitude coupling effect during the overall pitch sequence task (0–1.5 s). Figure 9a shows the trial-average PAC comodulograms for the auditory region, where the horizontal axis scale represents the low frequency, the vertical axis scale represents the high frequency, and the color represents the tPAC value. The results reveal a strong PAC effect between the low-frequency delta band (2–4 Hz) and the high-frequency beta band (15–35 Hz), which aligns with previously reported PAC phenomena in the literature [44]. Notably, there is no significant difference in PAC intensity between the left and right hemispheres of the auditory region. However, the PAC intensity measured by OPM-MEG is significantly higher than that obtained from EEG, indicating that OPM-MEG is not only capable of measuring the PAC effect in the auditory region but also has greater sensitivity compared to EEG. Figure 9b shows the trial-average PAC comodulograms for the inferior frontal gyrus region. Similarly to the findings in the auditory region, a strong PAC effect was observed between the low-frequency delta band and the high-frequency beta band. Once again, the PAC intensity measured by OPM-MEG was significantly higher than that of EEG. However, a significant difference was noted: the PAC intensity on the right hemisphere of the inferior frontal gyrus was considerably stronger than on the left. This supports the notion that the inferior frontal gyrus plays a role in pitch discrimination and demonstrates a right-hemisphere bias, as discussed in related literature [53,54].
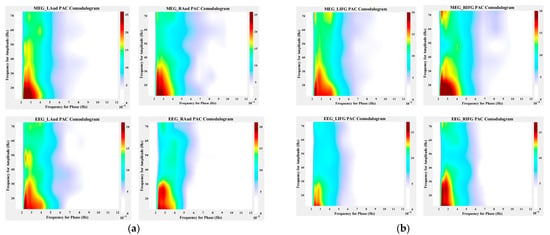
Figure 9.
Phase–amplitude coupling across the entire task period. (a) PAC comodulograms of auditory regions during the entire tone sequence task (0–1.5 s); (b) PAC comodulograms of the inferior frontal gyrus region during the entire tone sequence task (0–1.5 s).
Figure 10 shows the dynamic changes in tPAC values during the auditory task. Each data point in the figure represents the average PAC intensity (in Z-score units) of a 700 ms time window period centered on that time point. The first five data points report the tPAC values during the presentation of the five pitch stimuli, and the last two data points correspond to the tPAC values in the subsequent time windows without pitch presentation. Figure 10a shows the time-varying PAC effect in the auditory region. Statistical analysis of the time-varying PAC (tPAC) across all time windows revealed that the intensity of PAC in the auditory region was consistently above the chance level (z > 3.5, p_corrected < 0.01). The results of ANOVA analysis indicated a significant overall main effect of time in the auditory region (F(6) = 5.7, p < 0.001): post hoc analysis revealed that PAC increased after the first pitch (p < 0.01) and decreased after the target pitch appeared (p < 0.01 (fifth pitch), p < 0.001 (window without pitch presentation)). There was no significant lateralization between the left and right auditory region (t(6) = 4.63, p = 0.18). Figure 10b shows the time-varying PAC effect in the inferior frontal gyrus, where the PAC was also above chance level in all time windows (z > 2.52, p < 0.01). However, the overall main effect of time was not significant in the IFG (F(6) = 3.45, p = 0.13): post hoc analysis indicated that the PAC showed a significant decrease from the second to the third pitch (p < 0.05), and after the last stimulus pitch, the PAC first decreased and then increased (in the following two time windows: p < 0.05, p < 0.01). Additionally, the tPAC effect was significantly more substantial in the right IFG than in the left (t(6) = −3.21, p < 0.01, , 95% CI [−2.48, 0.06], observed power = 0.83). The effect size was relatively large (), and together with the adequate observed power (0.83), these results indicate that the right-lateralized tPAC enhancement is reliably detectable despite the limited sample size. In the above results, OPM-MEG and EEG exhibited the same trend. The PAC intensity measured by OPM-MEG was significantly higher than that of EEG (t(6) = −5.16, p < 0.01, , 95% CI [−3.61, −0.29], observed power = 0.99). The effect size was relatively large (). Together with the high observed power (0.99) and a confidence interval consistent in direction [−3.61, −0.29], these results indicate that, despite the limited sample size, the statistical evidence supports the notion that OPM-MEG likely provides a relatively more sensitive measurement of PAC compared with EEG.
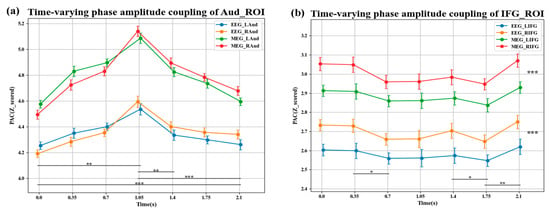
Figure 10.
Time-resolved dynamics of phase–amplitude coupling during the task. (a) Time-varying PAC effect in the auditory region; (b) time-varying PAC effect in the inferior frontal gyrus region. *, **, and *** indicate statistical significance at p < 0.05, p < 0.01, and p < 0.001, respectively.
This study further examined the coupling effect between the standard pitch and the deviant pitch within the variable pitch window (0.7–1.4 s). As illustrated in Figure 11a, there was no significant difference in phase–amplitude coupling (PAC) between standard and deviant pitches in the auditory region (F(1) = 1.21, p = 0.16), nor was there a difference in coupling between the left and right hemispheres (F(1) = 0.82, p = 0.24), but the overall coupling of OPM-MEG was significantly greater than that of EEG (F(1) = 12.6, p < 0.001, η2p = 0.67, 95% CI [0.034, 0.947], observed power = 0.839). Figure 11b shows that in the IFG region, the PAC of deviated pitch was significantly higher than that of standard pitch (F(1) = 23.27, p < 0.001, η2p = 0.795, 95% CI [0.178, 0.968], observed pow-er = 0.978), with the right IFG showing stronger coupling than the left (F(1) = 8.72, p < 0.001, η2p = 0.592, 95% CI [0.002, 0.929], observed power = 0.813). Additionally, the coupling measured by OPM-MEG was also better than that by EEG (F(1) = 11.53, p < 0.001, η2p = 0.658, 95% CI [0.022, 0.943], observed power = 0.806). The substantial effect sizes, consistent confidence intervals, and adequate observed power across these comparisons collectively indicate that, despite the limited sample size, these differences and lateralization effects are reliably detectable. OPM-MEG likely provides a relatively more sensitive measurement of PAC compared with EEG.
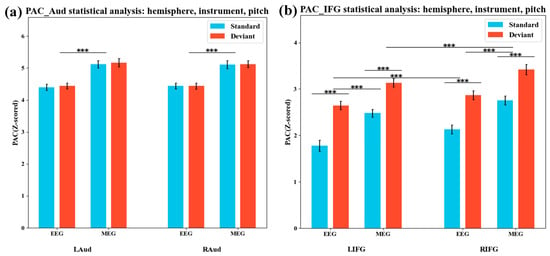
Figure 11.
Phase–amplitude coupling statistics in the target pitch window. (a) PAC statistics of the auditory region during the target tone window; (b) PAC statistics of the inferior frontal gyrus region during the target tone window. *** indicate statistically significant differences (p < 0.001).
In conclusion, the results of PAC analysis showed that the trends of PAC effects, as measured by OPM-MEG and EEG, were consistent, and OPM-MEG was more sensitive to PAC. In addition, the PAC in the Aud region showed a trend of first increasing and then decreasing with the target pitch time window at the center. The PAC in the IFG area showed significant differences under different pitch conditions and was lateralized to the right hemisphere.
3.4. Results of the Connectivity Analysis
Figure 12 shows the results of the connectivity analysis between the regions of interest in the left and right hemispheres. The findings indicated that during the auditory task, the connectivity measured by EEG and OPM-MEG was consistent. However, the connectivity measured by OPM-MEG was stronger than that measured by EEG. The t-test results of the zero-mean analysis based on OPM-MEG connectivity showed that during the auditory stimulation task, the delta-band activity was directed from the auditory cortex to the motor cortex (pre-target: left t(6) = −10.32, right t(6) = −9.84, p < 0.001, post-target: left t(6) = −7.98, right t(6) = −8.25, p < 0.01). It was also directed from the auditory cortex to the IFG (pre-target: left t(6) = 10.43, right t(6) = 13.16, p < 0.001, post-target: left t(6) = 7.69, right t(6) = 9.71, p < 0.01). Notably, there was no significant delta-band activity information flow direction (left t(6) = 5.76, right t(6)= 4.27, p > 0.05) in resting state. Furthermore, the connection strength between the delta-band activity of the auditory cortex and the IFG in the right hemisphere was significantly stronger than that in the left (t(6) = −6.48, p < 0.001, , 95% CI [−4.41, −0.49], observed power = 1.00). The effect size was very large (). Together with the perfect observed power (1.00) and a confidence interval consistent in direction [−4.41, −0.49], these results indicate that the right-lateralized delta–IFG connectivity is reliably detectable despite the limited sample size.
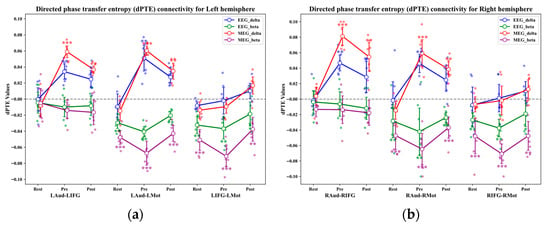
Figure 12.
Connectivity analysis in the left and right hemispheres. (a) Directed phase transfer entropy connectivity in the left hemisphere; (b) directed phase transfer entropy connectivity in the right hemisphere. *, **, and *** indicate statistical significance at p < 0.05, p < 0.01, and p < 0.001, respectively.
In all states, t-test results against zero mean analysis revealed significant beta band activity from motor cortex to auditory cortex (resting state: left t(6) = −6.81, right t(6) = −6.15, p < 0.001, pre-target: left t(6) = −13.51, right t(6) = −12.76, p < 0.001, post-target: left t(6) = 7.64, right t(6) = 7.93, p < 0.001) and motor cortex to IFG (resting state: left t(6) = −6.81, right t(6) = −6.15, p < 0.001, pre-target: left t(6) = −13.51, right t(6) = −12.76, p < 0.001, post-target: left t(6) = 7.64, right t(6) = 7.93, p < 0.001) was significant, but beta connectivity was stronger in the pre-target state. The results of the significance analysis of EEG-based connectivity were consistent with the above OPM-MEG analysis.
In conclusion, the connectivity analysis showed that during the task, there was a directional connectivity from the auditory cortex to the motor cortex and IFG in the delta band, and there was a lateralization of the connectivity from the auditory cortex to the IFG. In all states, there was directional connectivity from the motor cortex to the auditory cortex and IFG in the beta band.
4. Discussion
Reliably characterizing cross-frequency coupled neural dynamics is a key function of any magnetoencephalography (MEG) system, especially the PAC effect, which has been widely used in neuroscience research and clinical studies. Accurate measurement of PAC requires precise capture of high-frequency amplitude signals and stable extraction of low-frequency phases. These requirements impose strict demands on hardware stability, experimental design, preprocessing strategies, and source localization, posing significant challenges. In this study, the PAC characteristics and dynamic changes in the auditory area (Aud) and the inferior frontal gyrus (IFG) were analyzed using a 32-channel OPM-MEG system, assisted by a 64-channel EEG system. These findings suggest that OPM-MEG is capable of detecting PAC, and reveal, for the first time, preliminary evidence of PAC lateralization in the inferior frontal gyrus under pitch sequence stimulation.
Under the experimental conditions employed in this study, comparison between OPM-MEG and EEG revealed that both modalities exhibited similar overall trends in PAC, with OPM-MEG showing higher PAC amplitudes. This suggests that OPM-MEG may have advantages in capturing source-level PAC. Both OPM-MEG and EEG can noninvasively characterize cross-frequency coupled neural dynamics, but their measurement principles differ. EEG records scalp potentials induced by neural currents, which are affected by the heterogeneous conductivity and spatial distortions of the head, resulting in limited sensitivity and spatial resolution [55,56]. In contrast, OPM-MEG measures the extracranial magnetic fields generated by the same neural currents, which are less influenced by head conductivity and offer higher sensitivity and spatial resolution [57], potentially allowing a more accurate characterization of PAC within cross-frequency coupled dynamics. Furthermore, EEG is more susceptible to muscular artifacts, which predominantly affect signals above 20 Hz [58]. Since magnetic fields generated by muscle activity attenuate rapidly with distance, OPM-MEG is likely less affected by such artifacts, enabling more effective capture of high-frequency neural components [55].
In this study, δ–β phase–amplitude coupling (PAC) in the auditory cortex and inferior frontal gyrus (IFG) was measured in response to pitch-sequence stimuli using both OPM-MEG and EEG, consistent with previous findings [44]. This study analyzed PAC effects bilaterally for the first time. Based on our measurements, no hemispheric lateralization was observed in the auditory cortex, whereas PAC in the IFG tended to show higher values in the right hemisphere. The mechanisms underlying δ–β PAC in these regions correspond with previously described cortical tracking and temporal prediction processes [54,59,60,61]. Specifically, δ responses aligned with inter-stimulus intervals propagate along the ventral auditory pathway and interact with β oscillations from the lateral motor cortex in a top-down manner, contributing to the observed PAC patterns. Structural connectivity via the arcuate fasciculus further modulates encoding strength [53]. Within the target-pitch window, PAC differed between standard and deviant pitch conditions in the IFG, consistent with a previously reported right-hemispheric preference [62].
Connectivity analysis suggested consistent patterns between EEG and OPM-MEG, with connections in OPM-MEG suggested to have higher values. In the delta band, bottom-up connections from the auditory cortex to the motor cortex and inferior frontal gyrus were suggested, consistent with previous findings [49,54,59]. Directed β-band connections from the motor cortex to the auditory cortex and IFG were suggested across all conditions. These findings align with the observed PAC effects, reflecting interactions between β-band signals and stimulus-evoked δ-band activity within a temporal prediction context. Furthermore, delta-band connectivity analysis suggested lateralized connections from the auditory cortex to the IFG, corresponding to the right-hemisphere PAC tendency.
The findings of this study are supported by statistical significance, effect sizes, confidence intervals, and power analysis. However, a limitation was observed in the dynamic PAC estimation within the inferior frontal gyrus, where the 95% confidence interval slightly crossed zero. Although this introduces some uncertainty in the effect estimate, it does not substantially weaken the observation of lateralization, as hemispheric differences remained evident in the comparison between deviant and standard pitch conditions. To address this limitation, future studies plan to increase the sample size to improve the stability of effect size estimates. Additionally, there were procedural differences in the response devices: due to the lack of a magnetically silent button, the OPM-MEG experiment required the use of a balloon, whereas the EEG experiment primarily used a keyboard to map the motor ROI. These hardware-driven differences do not affect the main findings, as the primary results are based on PAC analysis during pitch-sequence stimulation in the auditory cortex and inferior frontal gyrus rather than on calculations during manual responses. As shown in Figure 5, the data during the stimulus task were not affected by behavioral responses during the motor response period.
Although OPM-MEG signals can effectively measure PAC, it is important to acknowledge certain limitations of the current system. First, the number of OPM sensors was limited to 32 channels. As shown in Figure 4b, this results in lower channel density compared with EEG. While our findings still support the efficacy of OPM-MEG for PAC measurement, increasing the number of channels could theoretically improve spatial resolution [63]. Second, due to hardware constraints, only single-axis measurements were employed. Triaxial sensors can reduce the influence of non-neural magnetic fields and better capture tangential field components; however, previous studies indicate that the amplitude of tangential components is relatively small [64], suggesting a minimal impact on the PAC results in the present study. Third, conventional SQUID-MEG systems employ hard-wired axial gradiometers to measure magnetic fields [65]. In contrast, our OPM-MEG system uses magnetometers. Although OPM-MEG benefits from higher signal quality due to proximity to the scalp, the gradiometer configuration in SQUID-MEG can effectively reduce environmental noise [66]. Future developments could implement arrays of compact OPM sensors arranged as gradiometers to further enhance the measurement capabilities of OPM-MEG systems.
5. Conclusions
In this paper, OPM-MEG was used to measure the evoked response of a 2.85 Hz rhythmic pitch sequence, and EEG recording was used as a control experiment for verification. Through source-level evoked response analysis, it was confirmed that both OPM-MEG and EEG could capture the same-frequency response evoked by rhythmic pitch sequence stimulation, proving the reliability of the experimental paradigm design and signal processing process. Then, by analyzing the phase–amplitude coupling (PAC) effect in the auditory region and the inferior frontal gyrus during the stimulation task, it was confirmed that OPM-MEG can measure the PAC effect of pitch sequence perception and is more sensitive to PAC than EEG. In addition, the study found that the auditory region exhibited hemispheric symmetry in the PAC effect, whereas the inferior frontal gyrus showed right-hemisphere lateralization in the PAC effect. According to the analysis of directional connections between brain regions, it was revealed that the brain information flow after pitch sequence stimulation is the reason for the nesting of signals in different frequency bands in this region, which leads to the PAC effect. The lateralization of the PAC effect in the inferior frontal gyrus may result from the enhanced connectivity of the delta response from the auditory region to the inferior frontal gyrus due to the greater sensitivity of the right hemisphere to pitch.
Author Contributions
Conceptualization, Y.L. (Yong Li) and H.L.; data curation, Y.L. (Yong Li) and C.W.; formal analysis, J.Y. and F.C.; funding acquisition, Y.L. (Ying Liu) and X.N.; investigation, H.L. and Y.L. (Yong Li); methodology, H.L. and Y.L. (Yong Li); project administration, Y.L. (Ying Liu) and X.N.; resources, X.N.; software, H.L. and Y.L. (Yong Li); supervision, J.Y. and F.C.; validation, Y.L. (Yong Li) and Y.L. (Ying Liu); visualization, Y.L. (Yong Li); writing—original draft, Y.L. (Yong Li); writing—review and editing, F.C. and B.S. All authors have read and agreed to the published version of the manuscript.
Funding
This research was funded by the Innovation Program for Quantum Science and Technology, Hefei National Laboratory, Hefei, 230088, China (No.2021ZD0300503). This study was also supported by the Key R&D Program of Shandong Province (No.2022ZLGX03).
Institutional Review Board Statement
The study was conducted in accordance with the Declaration of Helsinki and approved by the ethical Committee of Beihang University (Nr.BM20200175) for studies involving humans.
Informed Consent Statement
Informed consent was obtained from all subjects involved in the study.
Data Availability Statement
The data, aside from the data published in this manuscript, are not publicly available due to privacy restrictions. You can find the provided data at this link: https://zenodo.org/records/16749504 (accessed on 6 August 2025).
Acknowledgments
The authors have reviewed and edited the output and take full responsibility for the content of this publication.
Conflicts of Interest
The authors declare no conflicts of interest.
References
- Xu, W.; Liao, P.; Cao, M.; White, D.J.; Lyu, B.; Gao, J.-H. Facilitating cognitive neuroscience research with 80-sensor optically pumped magnetometer magnetoencephalography (OPM-MEG). NeuroImage 2025, 311, 121182. [Google Scholar] [CrossRef] [PubMed]
- Liu, Y.; Huang, B.; Li, J.; Li, R.; Zhai, Y. Flow Rate Estimation Based on Magnetic Particle Detection Using a Miniatured High-Sensitivity OPM. IEEE Trans. Instrum. Meas. 2025, 74, 9518010. [Google Scholar] [CrossRef]
- Oelsner, G.; IJsselsteijn, R.; Scholtes, T.; Krüger, A.; Schultze, V.; Seyffert, G.; Werner, G.; Jäger, M.; Chwala, A.; Stolz, R. Integrated optically pumped magnetometer for measurements within Earth’s magnetic field. Phys. Rev. Appl. 2022, 17, 024034. [Google Scholar] [CrossRef]
- Zhang, R. Influence of Atomic Magnetometer’s Orientation on Its Frequency Response. Sensors 2025, 25, 1364. [Google Scholar] [CrossRef]
- Lu, Y.; Zhao, T.; Zhu, W.; Liu, L.; Zhuang, X.; Fang, G.; Zhang, X. Recent progress of atomic magnetometers for geomagnetic applications. Sensors 2023, 23, 5318. [Google Scholar] [CrossRef]
- Borna, A.; Carter, T.R.; Colombo, A.P.; Jau, Y.-Y.; McKay, J.; Weisend, M.; Taulu, S.; Stephen, J.M.; Schwindt, P.D. Non-invasive functional-brain-imaging with an OPM-based magnetoencephalography system. PLoS ONE 2020, 15, e0227684. [Google Scholar] [CrossRef]
- Wang, C.; Cao, F.; Wang, W.; Xu, W.; Li, W.; Gao, Z.; An, N. Methods for improving movement compatibility of wearable OPM-MEG: A Review. IEEE Sens. J. 2023, 23, 30037–30050. [Google Scholar] [CrossRef]
- Pedersen, M.; Abbott, D.F.; Jackson, G.D. Wearable OPM-MEG: A changing landscape for epilepsy. Epilepsia 2022, 63, 2745–2753. [Google Scholar] [CrossRef] [PubMed]
- Ruan, Y.; He, X.; Ruan, L.; Liu, F.; Zhang, Z.; Weng, J.; Yan, Q.; Zhang, G.; Li, K.; Zheng, W. Drug monitoring by optically pumped atomic magnetometer. IEEE Photonics J. 2022, 14, 1–5. [Google Scholar] [CrossRef]
- Seymour, R.A.; Alexander, N.; Mellor, S.; O’Neill, G.C.; Tierney, T.M.; Barnes, G.R.; Maguire, E.A. Using OPMs to measure neural activity in standing, mobile participants. NeuroImage 2021, 244, 118604. [Google Scholar] [CrossRef]
- Rea, M.; Boto, E.; Holmes, N.; Hill, R.; Osborne, J.; Rhodes, N.; Leggett, J.; Rier, L.; Bowtell, R.; Shah, V. A 90-channel triaxial magnetoencephalography system using optically pumped magnetometers. Ann. N. Y. Acad. Sci. 2022, 1517, 107–124. [Google Scholar] [CrossRef]
- Daume, J.; Kamiński, J.; Schjetnan, A.G.; Salimpour, Y.; Khan, U.; Kyzar, M.; Reed, C.M.; Anderson, W.S.; Valiante, T.A.; Mamelak, A.N. Control of working memory by phase–amplitude coupling of human hippocampal neurons. Nature 2024, 629, 393–401. [Google Scholar] [CrossRef]
- Aliramezani, M.; Farrokhi, A.; Constantinidis, C.; Daliri, M.R. Delta-alpha/beta coupling as a signature of visual working memory in the prefrontal cortex. Iscience 2024, 27, 110453. [Google Scholar] [CrossRef]
- Tang, W.; Jiang, J.; Wang, H. Brain functional differences among ADHD subtypes in children revealed by phase-amplitude coupling analysis of resting-state EEG. Int. J. Psychophysiol. 2025, 215, 113222. [Google Scholar] [CrossRef]
- Borderie, A.; Caclin, A.; Lachaux, J.-P.; Perrone-Bertollotti, M.; Hoyer, R.S.; Kahane, P.; Catenoix, H.; Tillmann, B.; Albouy, P. Cross-frequency coupling in cortico-hippocampal networks supports the maintenance of sequential auditory information in short-term memory. PLoS Biol. 2024, 22, e3002512. [Google Scholar] [CrossRef]
- Fatemi, S.N.; Sedghizadeh, M.J.; Aghajan, H. Theta-gamma phase-amplitude coupling explains the advantage of auditory plus visual gamma entrainment in Alzheimer’s therapy. Alzheimer’s Dement. 2021, 17, e053451. [Google Scholar] [CrossRef]
- An, K.-m.; Ikeda, T.; Hasegawa, C.; Yoshimura, Y.; Tanaka, S.; Saito, D.N.; Yaoi, K.; Iwasaki, S.; Hirosawa, T.; Jensen, O. Aberrant brain oscillatory coupling from the primary motor cortex in children with autism spectrum disorders. NeuroImage Clin. 2021, 29, 102560. [Google Scholar] [CrossRef] [PubMed]
- Murphy, N.; Ramakrishnan, N.; Walker, C.P.; Polizzotto, N.R.; Cho, R.Y. Intact auditory cortical cross-frequency coupling in early and chronic schizophrenia. Front. Psychiatry 2020, 11, 507. [Google Scholar] [CrossRef]
- Treu, S.; Gonzalez-Rosa, J.J.; Soto-Leon, V.; Lozano-Soldevilla, D.; Oliviero, A.; Lopez-Sosa, F.; Reneses-Prieto, B.; Barcia, J.A.; Strange, B.A. A ventromedial prefrontal dysrhythmia in obsessive-compulsive disorder is attenuated by nucleus accumbens deep brain stimulation. Brain Stimul. 2021, 14, 761–770. [Google Scholar] [CrossRef] [PubMed]
- Karekal, A.; Miocinovic, S.; Swann, N.C. Novel approaches for quantifying beta synchrony in Parkinson’s disease. Exp. Brain Res. 2022, 240, 991–1004. [Google Scholar] [CrossRef]
- Zalta, A.; Large, E.W.; Schön, D.; Morillon, B. Neural dynamics of predictive timing and motor engagement in music listening. Sci. Adv. 2024, 10, eadi2525. [Google Scholar] [CrossRef]
- Yakubov, B.; Das, S.; Zomorrodi, R.; Blumberger, D.M.; Enticott, P.G.; Kirkovski, M.; Rajji, T.K.; Desarkar, P. Cross-frequency coupling in psychiatric disorders: A systematic review. Neurosci. Biobehav. Rev. 2022, 138, 104690. [Google Scholar] [CrossRef]
- Zhang, C.; Wang, Y.; Li, M.; Niu, P.; Li, S.; Hu, Z.; Shi, C.; Li, Y. Phase-Amplitude Coupling in Theta and Beta Bands: A Potential Electrophysiological Marker for Obstructive Sleep Apnea. Nat. Sci. Sleep 2024, 16, 1469–1482. [Google Scholar] [CrossRef] [PubMed]
- Hodnik, T.; Roytman, S.; Bohnen, N.I.; Marusic, U. Beta–Gamma Phase-Amplitude Coupling as a non-invasive biomarker for Parkinson’s Disease: Insights from Electroencephalography studies. Life 2024, 14, 391. [Google Scholar] [CrossRef] [PubMed]
- Vorwerk, J.; Wolters, C.H.; Baumgarten, D. Global sensitivity of EEG source analysis to tissue conductivity uncertainties. Front. Hum. Neurosci. 2024, 18, 1335212. [Google Scholar] [CrossRef]
- Ye, H.; Li, G.; Sheng, X.; Zhu, X. Phase-amplitude coupling between low-frequency scalp EEG and high-frequency intracranial EEG during working memory task. J. Neural Eng. 2022, 19, 026043. [Google Scholar] [CrossRef] [PubMed]
- Hegazy, M.; Gavvala, J. Magnetoencephalography in clinical practice. Arq. Neuro-Psiquiatr. 2022, 80, 523–529. [Google Scholar] [CrossRef]
- Seymour, R.A.; Rippon, G.; Kessler, K. The detection of phase amplitude coupling during sensory processing. Front. Neurosci. 2017, 11, 487. [Google Scholar] [CrossRef]
- Brookes, M.J.; Leggett, J.; Rea, M.; Hill, R.M.; Holmes, N.; Boto, E.; Bowtell, R. Magnetoencephalography with optically pumped magnetometers (OPM-MEG): The next generation of functional neuroimaging. Trends Neurosci. 2022, 45, 621–634. [Google Scholar] [CrossRef]
- Schofield, H.; Hill, R.M.; Feys, O.; Holmes, N.; Osborne, J.; Doyle, C.; Bobela, D.; Corvilain, P.; Wens, V.; Rier, L. A novel, robust, and portable platform for magnetoencephalography using optically-pumped magnetometers. Imaging Neurosci. 2024, 2, 1–22. [Google Scholar] [CrossRef]
- Hyde, K.L.; Peretz, I. Brains that are out of tune but in time. Psychol. Sci. 2004, 15, 356–360. [Google Scholar] [CrossRef]
- Tian, K.; Zhang, X.; Shi, M.; Yang, J.; Cao, F.; Wang, F.; Shi, Z.; Wang, K.; Zheng, S.; Liu, G. Design and optimization of biplanar coils for active magnetic compensation system inside the mini-magnetically shielded room. IEEE Trans. Ind. Electron. 2024, 72, 1065–1075. [Google Scholar] [CrossRef]
- Tierney, T.M.; Alexander, N.; Mellor, S.; Holmes, N.; Seymour, R.; O’Neill, G.C.; Maguire, E.A.; Barnes, G.R. Modelling optically pumped magnetometer interference in MEG as a spatially homogeneous magnetic field. NeuroImage 2021, 244, 118484. [Google Scholar] [CrossRef]
- Cao, F.; An, N.; Xu, W.; Wang, W.; Yang, Y.; Xiang, M.; Gao, Y.; Ning, X. Co-registration comparison of on-scalp magnetoencephalography and magnetic resonance imaging. Front. Neurosci. 2021, 15, 706785. [Google Scholar] [CrossRef] [PubMed]
- Fang, F.; Teixeira, A.L.; Li, R.; Zou, L.; Zhang, Y. The control patterns of affective processing and cognitive reappraisal: Insights from brain controllability analysis. Cereb. Cortex 2024, 34, bhad500. [Google Scholar] [CrossRef] [PubMed]
- Wartman, W.A.; Ponasso, G.N.; Qi, Z.; Haueisen, J.; Maess, B.; Knösche, T.R.; Weise, K.; Noetscher, G.M.; Raij, T.; Makaroff, S.N. Fast EEG/MEG BEM-based forward problem solution for high-resolution head models. NeuroImage 2025, 306, 120998. [Google Scholar] [CrossRef] [PubMed]
- Feng, Z.; Kakkos, I.; Matsopoulos, G.K.; Guan, C.; Sun, Y. Explaining E/MEG Source Imaging and Beyond: An Updated Review. IEEE J. Biomed. Health Inform. 2025, 1–16. [Google Scholar] [CrossRef]
- Afnan, J.; Cai, Z.; Lina, J.M.; Abdallah, C.; Delaire, E.; Avigdor, T.; Ros, V.; Hedrich, T.; von Ellenrieder, N.; Kobayashi, E. EEG/MEG source imaging of deep brain activity within the maximum entropy on the mean framework: Simulations and validation in epilepsy. Hum. Brain Mapp. 2024, 45, e26720. [Google Scholar] [CrossRef]
- Hietala, P.; Kurki, I.; Hyvärinen, A.; Parkkonen, L.; Henriksson, L. Improving source estimation of retinotopic MEG responses by combining data from multiple subjects. Imaging Neurosci. 2024, 2, 1–15. [Google Scholar] [CrossRef]
- Gramfort, A.; Luessi, M.; Larson, E.; Engemann, D.A.; Strohmeier, D.; Brodbeck, C.; Goj, R.; Jas, M.; Brooks, T.; Parkkonen, L. MEG and EEG data analysis with MNE-Python. Front. Neuroinformatics 2013, 7, 267. [Google Scholar] [CrossRef]
- Gramfort, A.; Luessi, M.; Larson, E.; Engemann, D.A.; Strohmeier, D.; Brodbeck, C.; Parkkonen, L.; Hämäläinen, M.S. MNE software for processing MEG and EEG data. Neuroimage 2014, 86, 446–460. [Google Scholar] [CrossRef]
- Mantegna, F.; Orpella, J.; Poeppel, D. Time-resolved hemispheric lateralization of audiomotor functional connectivity during covert speech production. Cell Rep. 2025, 44, 115137. [Google Scholar] [CrossRef]
- Samiee, S.; Baillet, S. Time-resolved phase-amplitude coupling in neural oscillations. NeuroImage 2017, 159, 270–279. [Google Scholar] [CrossRef]
- Samiee, S.; Vuvan, D.; Florin, E.; Albouy, P.; Peretz, I.; Baillet, S. Cross-frequency brain network dynamics support pitch change detection. J. Neurosci. 2022, 42, 3823–3835. [Google Scholar] [CrossRef]
- Lobier, M.; Siebenhühner, F.; Palva, S.; Palva, J.M. Phase transfer entropy: A novel phase-based measure for directed connectivity in networks coupled by oscillatory interactions. Neuroimage 2014, 85, 853–872. [Google Scholar] [CrossRef]
- Wiener, N. The theory of prediction. Modern mathematics for engineers. Mod. Math. Eng. 1956, 165, 6. [Google Scholar]
- Granger, C.W. Investigating causal relations by econometric models and cross-spectral methods. In Essays in Econometrics: Collected Papers of Clive WJ Granger; Cambridge University Press: New York, NY, USA, 2001; pp. 31–47. [Google Scholar]
- Lakens, D. Calculating and reporting effect sizes to facilitate cumulative science: A practical primer for t-tests and ANOVAs. Front. Psychol. 2013, 4, 863. [Google Scholar] [CrossRef]
- Florin, E.; Vuvan, D.; Peretz, I.; Baillet, S. Pre-target neural oscillations predict variability in the detection of small pitch changes. PLoS ONE 2017, 12, e0177836. [Google Scholar] [CrossRef] [PubMed]
- Andermann, M.; Günther, M.; Patterson, R.D.; Rupp, A. Early cortical processing of pitch height and the role of adaptation and musicality. Neuroimage 2021, 225, 117501. [Google Scholar] [CrossRef] [PubMed]
- Doelling, K.B.; Poeppel, D. Cortical entrainment to music and its modulation by expertise. Proc. Natl. Acad. Sci. USA 2015, 112, E6233–E6242. [Google Scholar] [CrossRef] [PubMed]
- Canolty, R.T.; Edwards, E.; Dalal, S.S.; Soltani, M.; Nagarajan, S.S.; Kirsch, H.E.; Berger, M.S.; Barbaro, N.M.; Knight, R.T. High gamma power is phase-locked to theta oscillations in human neocortex. Science 2006, 313, 1626–1628. [Google Scholar] [CrossRef] [PubMed]
- Royal, I.; Vuvan, D.T.; Zendel, B.R.; Robitaille, N.; Schönwiesner, M.; Peretz, I. Activation in the right inferior parietal lobule reflects the representation of musical structure beyond simple pitch discrimination. PLoS ONE 2016, 11, e0155291. [Google Scholar] [CrossRef]
- Peretz, I. Neurobiology of congenital amusia. Trends Cogn. Sci. 2016, 20, 857–867. [Google Scholar] [CrossRef]
- Seedat, Z.A.; Pier, K.S.; Holmes, N.; Rea, M.; Al-Hilaly, L.; Tierney, T.M.; Embury, C.M.; Pardington, R.; Mullinger, K.J.; Cross, J.H. Simultaneous whole-head electrophysiological recordings using EEG and OPM-MEG. Imaging Neurosci. 2024, 2, imag-2-00179. [Google Scholar] [CrossRef]
- Vorwerk, J.; Aydin, Ü.; Wolters, C.H.; Butson, C.R. Influence of head tissue conductivity uncertainties on EEG dipole reconstruction. Front. Neurosci. 2019, 13, 531. [Google Scholar] [CrossRef]
- Yeo, W.-J.; Larson, E.; Iivanainen, J.; Borna, A.; McKay, J.; Stephen, J.M.; Schwindt, P.D.; Taulu, S. Effects of head modeling errors on the spatial frequency representation of MEG. Phys. Med. Biol. 2023, 68, 095022. [Google Scholar] [CrossRef]
- Kołodziej, M.; Jurczak, M.; Majkowski, A.; Rysz, A.; Świderski, B. A Hybrid CNN-LSTM Approach for Muscle Artifact Removal from EEG Using Additional EMG Signal Recording. Appl. Sci. 2025, 15, 4953. [Google Scholar] [CrossRef]
- Morillon, B.; Baillet, S. Motor origin of temporal predictions in auditory attention. Proc. Natl. Acad. Sci. USA 2017, 114, E8913–E8921. [Google Scholar] [CrossRef]
- Gaab, N.; Gaser, C.; Zaehle, T.; Jancke, L.; Schlaug, G. Functional anatomy of pitch memory—An fMRI study with sparse temporal sampling. Neuroimage 2003, 19, 1417–1426. [Google Scholar] [CrossRef] [PubMed]
- Muñoz, V.; Muñoz-Caracuel, M.; Angulo-Ruiz, B.Y.; Gómez, C.M. Neurovascular coupling during auditory stimulation: Event-related potentials and fNIRS hemodynamic. Brain Struct. Funct. 2023, 228, 1943–1961. [Google Scholar] [CrossRef] [PubMed]
- Zatorre, R.J.; Evans, A.C.; Meyer, E.; Gjedde, A. Lateralization of phonetic and pitch discrimination in speech processing. Science 1992, 256, 846–849. [Google Scholar] [CrossRef]
- Yan, B.; Peng, Y.; Zhang, Y.; Zhang, Y.; Zhang, H.; Cao, Y.; Sun, C.; Ding, M. From Simulation to Clinic: Assessing the Required Channel Count for Effective Clinical Use of OPM-MEG Systems. NeuroImage 2025, 314, 121262. [Google Scholar] [CrossRef] [PubMed]
- Rier, L.; Michelmann, S.; Ritz, H.; Shah, V.; Hill, R.M.; Osborne, J.; Doyle, C.; Holmes, N.; Bowtell, R.; Brookes, M.J. Test-retest reliability of the human connectome: An OPM-MEG study. Imaging Neurosci. 2023, 1, 1–20. [Google Scholar] [CrossRef] [PubMed]
- Storm, J.-H.; Kieler, O.; Körber, R. Towards ultrasensitive SQUIDs based on submicrometer-sized Josephson junctions. IEEE Trans. Appl. Supercond. 2020, 30, 1–5. [Google Scholar] [CrossRef]
- Seymour, R.A.; Alexander, N.; Mellor, S.; O’Neill, G.C.; Tierney, T.M.; Barnes, G.R.; Maguire, E.A. Interference suppression techniques for OPM-based MEG: Opportunities and challenges. NeuroImage 2022, 247, 118834. [Google Scholar] [CrossRef]
Disclaimer/Publisher’s Note: The statements, opinions and data contained in all publications are solely those of the individual author(s) and contributor(s) and not of MDPI and/or the editor(s). MDPI and/or the editor(s) disclaim responsibility for any injury to people or property resulting from any ideas, methods, instructions or products referred to in the content. |
© 2025 by the authors. Licensee MDPI, Basel, Switzerland. This article is an open access article distributed under the terms and conditions of the Creative Commons Attribution (CC BY) license (https://creativecommons.org/licenses/by/4.0/).