Abstract
In free space optical (FSO) communications, signals are affected by turbulence when transmitted through the atmosphere. Fluctuations in intensity caused by atmospheric turbulence lead to an increase in the bit error rate of FSO systems. Deep learning (DL), as a current research hotspot, offers a promising approach to improve the accuracy of signal detection. In this paper, we propose a signal detection method based on a bidirectional gated recurrent unit (BiGRU) neural network for FSO communications. The proposed detection method considers the temporal correlation of received signals due to the properties of the BiGRU neural network, which is not available in existing detection methods based on DL. In addition, the proposed detection method does not require channel state information (CSI) for channel estimation, unlike maximum likelihood (ML) detection technology with perfect CSI. Numerical results demonstrate that the proposed BiGRU-based detector achieves significant improvements in bit error rate (BER) performance compared with a multilayer perceptron (MLP)-based detector. Specifically, under weak turbulence conditions, the BiGRU-based detector achieves an approximate 2 dB signal-to-noise ratio (SNR) gain at a target BER of compared to the MLP-based detector. Under moderate turbulence conditions, it achieves an approximate 6 dB SNR gain at the same target BER of . Under strong turbulence conditions, the proposed detector obtains a 6 dB SNR gain at a target BER of . Additionally, it outperforms conventional methods by more than one order of magnitude in BER under the same turbulence and SNR conditions.
1. Introduction
Although wireless radio frequency (RF) communication has advanced significantly over the past few decades, the widespread use of numerous RF devices has led to a scarcity of spectrum resources. Free space optical (FSO) communication, which utilizes light waves to transmit information through the atmosphere or a vacuum, has seen rapid development in recent years. It offers a vast and unlicensed spectrum range (spanning from infrared to ultraviolet), which enables high-capacity communication—a key advantage for alleviating spectrum scarcity [1]. Additionally, FSO boasts advantages such as low cost, high mobility, and ease of deployment, making it highly competitive.
However, when optical signals propagate through the atmosphere, they are affected not only by atmospheric absorption and scattering, but also by turbulence [2]. Turbulence causes random fluctuations in the refractive index over time and space, directly impacting the propagation characteristics of optical signals and leading to degradation in the bit error rate (BER) performance of FSO systems [3,4,5]. To mitigate the negative effects of atmospheric turbulence, various techniques, such as spatial diversity [6,7,8,9], aperture averaging [10,11], adaptive optics [12,13], and mixed RF/FSO links [14,15], are employed in FSO systems. However, these methods increase system complexity and implementation costs. Maximum likelihood (ML) detection has been studied for its ability to counteract the impact of atmospheric turbulence on optical signals. While ideal ML detection offers excellent BER performance for FSO systems, it requires perfect instantaneous channel state information (CSI), which is difficult to achieve in practical FSO systems.
To address the limitations of traditional detection methods, machine learning—a prominent research field in recent years—has been increasingly applied to signal detection in FSO systems. Zheng et al. [16] proposed a support vector machine (SVM)-based signal detector to mitigate the effects of channel fading in FSO links. Amirabadi et al. [17] introduced a deep learning (DL)-based signal detector, with simulation results showing that it achieves performance comparable to that of ideal ML detection while having lower computational complexity. Narasimha and Gurugopinath [18] conducted a comparative study of signal detection methods using various supervised learning techniques, such as logistic regression, decision trees, AdaBoost, k-nearest neighbors, and multilayer perceptron (MLP). The simulation results indicated that AdaBoost and MLP perform better under different turbulence conditions. However, these machine learning-based detection methods do not account for the temporal correlation of received signals, leaving room for improvement as the signals, which should be correlated, are treated as independent training samples.
GRU (gated recurrent unit) is a type of recurrent neural network (RNN) architecture designed for processing sequential data. It was proposed to address the issues of vanishing and exploding gradients that traditional RNNs face when handling long sequences [19]. By introducing gating mechanisms, GRU effectively controls the flow of information, enabling it to capture long-term dependencies within sequences. We utilized BiGRU to connect training samples in temporal order to learn the contextual features of received signals. Numerical results demonstrate that the proposed method outperforms existing approaches, including fixed-threshold detection, fast blind detection, ML detection, and MLP-based detection methods, under different turbulence conditions.
2. FSO System Model
In this paper, an FSO system employing on–off keying (OOK) intensity modulation and direct detection (IM/DD) is considered. As shown in Figure 1, the FSO system consists of three parts: a transmitter, a receiver, and an atmospheric turbulence channel. At the transmitter, the binary data sequence is modulated with OOK modulation. Then, the laser source converts electrical signal into an optical signal for propagation in the atmospheric channel. At the receiver, the received signal is converted from an optical signal to an electrical signal through the photodetector (PD), and is sampled at a certain rate by the sampler. Following that, the received signal is transformed into a binary sequence via the BiGRU-based detector. The received signal y is expressed as follows:
where x is the transmitted symbol, is the responsivity of the PD, I is the intensity fluctuation caused by atmospheric turbulence, and n is additive white Gaussian noise (AWGN) with zero mean. Therefore, the sampled received signal can be formulated as follows:
where is the k-th symbol information (the modulation order is 2), is the s-th sampling point in the k-th symbol period, and is the number of sampling points in each symbol period, where is the sample rate of the sampler and is the symbol rate of the transmitter.
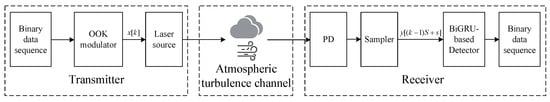
Figure 1.
Block diagram of FSO system with BiGRU-based detector.
3. BiGRU-Based Signal Detection
GRU is a specialized recurrent neural network (RNN) architecture that incorporates two gating mechanisms (update gate and reset gate) and uses a hidden state for information transmission—unlike LSTM, it does not require a separate cell state [20]. Its structure is simpler and computationally more efficient. BiGRU is a special GRU structure. There are two GRU layers in the BiGRU structure: one processes the sequence from front to back, and the other processes the sequence from back to front. In this way, the model can utilize both front and back information. While processing the sequence, the inputs of each time step are passed to the two GRU layers separately and then their outputs are merged. With BiGRU, we can obtain more comprehensive information about the sequence, which helps to improve the performance of the model in the sequence task.
Obviously, the sampled received signal can be thought of as sequence data and the signal detection can be regarded as a classification task. Therefore, we propose a BiGRU-based signal detector for an OOK IM/DD FSO system to mitigate the adverse effects of atmospheric turbulence. The structure of the BiGRU-based detector is shown in Figure 2. The input data of the neural network is a chronological vector representing the sampled received signal of K symbols, where is the vector composed of the sampling points in the k-th symbol period and in which is the s-th sampling point in the k-th symbol period. The output is a vector , where represents the predicted symbol.
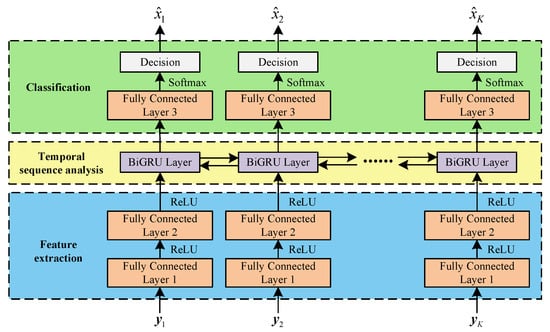
Figure 2.
Proposed BiGRU-based signal detection model.
This neural network consists of three fully connected layers and one BiGRU layer. At the time step k, the vector is fed into the first two fully connected layers. Fully connected layer 1 transforms the input into the dimensional space. Fully connected layer 2 further transforms the output of fully connected layer 1 into a dimension of , with its output serving as the input to the BiGRU layer. The ReLU function is employed in these two layers for nonlinear mapping. The output of fully connected layer 1 and the output of fully connected layer 2 are given by
where , , , and are learnable parameters of fully connected layer 1 and fully connected layer 2.
The computation process of the BiGRU at time step k is defined as follows [20,21]:
- Forward GRU:
- Backward GRU:
The hidden states and are then fed into fully connected layer 3 and transformed into a vector. The SoftMax function is applied in this layer to convert the raw output into a probability distribution. The output of fully connected layer 3 can be denoted as follows:
where and are learnable parameters of fully connected layer 3. The predicted symbol can be obtained through the following decision process:
4. Simulations and Numerical Results
In this section, we describe the simulations performed and present the numerical results to evaluate the performance of the proposed BiGRU-based signal detector for an FSO system. For this, we generated binary data sequences for training and testing. Figure 3 illustrates the data generation procedure. To ensure robust simulation outcomes, intensity fluctuation data were collected through experiments. The experimental setup comprised three main components: a transmitter, an atmospheric turbulence channel, and a receiver. The transmitter incorporated a power supply and an 850 nm infrared laser source, and the laser source featured a transmission power of 250 mW with a beam divergence of 1 mrad. The receiver assembly included a lens of 10 mm in diameter, a PIN PD with a responsivity of 0.59 mA/mW, an amplifier circuit, an analog-to-digital converter (ADC) module, and an interface circuit. The direct-current beam generated by the infrared laser propagated through the atmospheric turbulence channel. At the receiver, the lens concentrated the incoming beam onto the target PD, which transformed the optical signals into electrical signals. These signals were subsequently amplified before being digitized through the ADC module. The digitized data were finally transmitted to a personal computer (PC) via the interface circuit for further analysis.
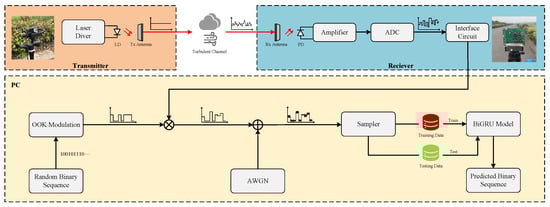
Figure 3.
The process of data generation.
Experimental measurements of intensity fluctuations were performed on a 500 m link under varying weather conditions. From the collected data, we selected specific datasets corresponding to weak, moderate, and strong turbulence conditions for analysis. The normalized intensity fluctuations and the density distributions are partly shown in Figure 4, Figure 5 and Figure 6. As shown in Figure 4b, Figure 5b and Figure 6b, the density distribution of channel 1 (weak turbulence) follows a lognormal distribution, while those of channel 2 (moderate turbulence) and channel 3 (strong turbulence) conform to the gamma–gamma distribution. Obviously, the intensity fluctuation of channel 3 is the most severe among the three, followed by that of channel 2, and that of channel 1 is the weakest.
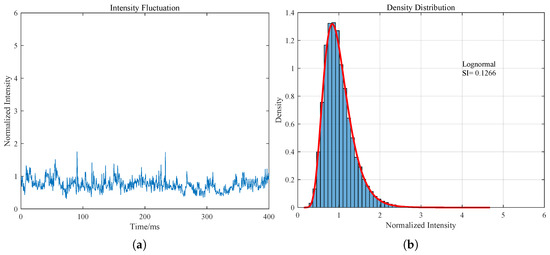
Figure 4.
(a) Normalized intensity and (b) density distribution of channel 1 (weak turbulence).
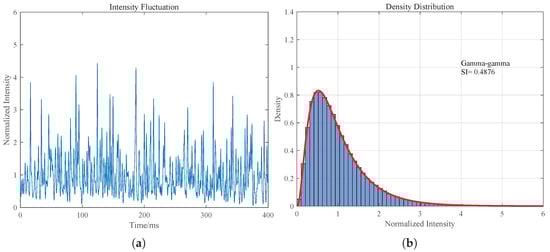
Figure 5.
(a) Normalized intensity and (b) density distribution of channel 2 (moderate turbulence).
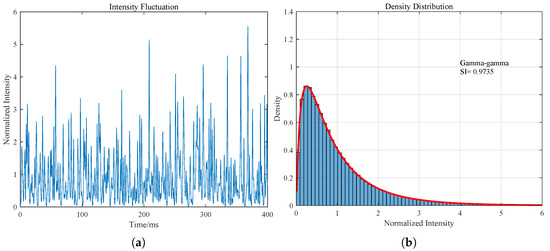
Figure 6.
(a) Normalized intensity and (b) density distribution of channel 3 (strong turbulence).
The strength of intensity fluctuations can be measured by the scintillation index (SI), a widely accepted indicator in FSO studies [22]. The SI can be calculated as follows:
where denotes the expectation of the variable. The calculated SIs of channel 1, channel 2, and channel 3 were 0.1266, 0.4876, and 0.9735 respectively. The stronger the intensity fluctuation, the larger the SI.
On the PC, we generated a random binary sequence with a size of bits and performed OOK modulation on it. The modulated signal was then processed with each of the three intensity fluctuation datasets to produce samples for model training and testing. This simulation was implemented within the PyTorch (version 1.13.1) framework. The key parameters utilized in the simulation are summarized in Table 1.

Table 1.
Main parameters of FSO system and BiGRU model.
To comprehensively evaluate the performance of the proposed BiGRU-based detector, we compare its BER performance with that of detection with a fixed threshold, fast blind detection [23], ML detection with perfect CSI, and MLP-based detection in three different turbulent channels with a symbol rate of 10 Mbps. To ensure a fair comparison, the MLP-based detector in this study adopts the same front-end feature extraction module as the BiGRU-based detector (i.e., two fully connected layers with 20 and 10 nodes, respectively, and ReLU activation functions), but replaces the BiGRU layer with a fully connected layer with 20 nodes (with ReLU activation function). Instead, it directly connects the output of the third fully connected layer to a fully connected layer (with SoftMax activation) for symbol classification. Due to the intensity fluctuation in channel 1 being the weakest among the three channels, the BER performance of the different detection methods in channel 1 is the best among the three channels. In contrast, the BER performance of the different detection methods in channel 3 is the worst. As shown in Figure 7, it is obvious that the BER performance of the MLP-based detection method and the proposed BiGRU-based detection method far exceeds that of the other three conventional detection methods. Compared to the MLP-based detector, the proposed BiGRU-based detector achieves an SNR gain of approximately 2 dB in channel 1 and 6 dB in channel 2 at a target BER of . Under the most severe turbulence conditions (Channel 3), it obtains an SNR gain of about 6 dB at a target BER of . As can be learned from the above results, the performance superiority of the proposed detection method over the MLP-based method can be attributed to BiGRU’s ability to effectively extract contextual features of received signal sequences.
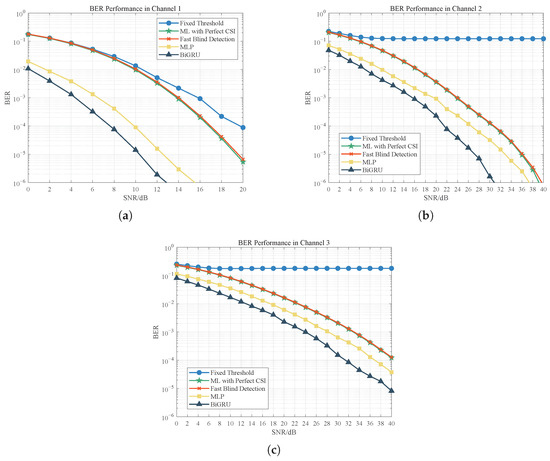
Figure 7.
BER performance of different detection methods at symbol rate of 10 Mbps in (a) channel 1, (b) channel 2, and (c) channel 3.
The BER performance of the different detection methods with symbol rates of 1 Mbps and 10 Mbps in the above three channels is also presented in Figure 8. Generally, higher symbol rates typically degrade BER performance in turbulence-free scenarios. However, under the three turbulence conditions mentioned above, as the SNR improves and the BER decreases, when the system operates at a higher symbol rate, it exhibits a lower BER. The reason lies in the fact that turbulence-induced fluctuations vary more slowly than the symbol rate. This implies that for a fixed size of the transmitted symbols, increasing the transmission rate reduces the impact of intensity fluctuations on symbols.
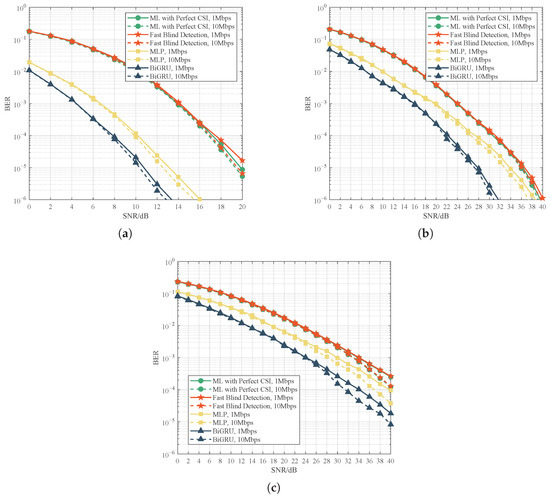
Figure 8.
BER performance of different detection methods at symbol rates of 1 Mbps and 10 Mbps in (a) channel 1, (b) channel 2, and (c) channel 3.
5. Conclusions
In this paper, we propose a signal detection method based on BiGRU for FSO communication that employs OOK intensity modulation to mitigate the adverse effects of atmospheric turbulence. This proposed detection method can learn the contextual features of received signal sequences due to the unique properties of the BiGRU neural network compared to existing DL-based detection methods. In order to obtain convincing results, we conducted experiments and collected three sets of data on intensity fluctuation for use as channel models in the simulation. The numerical results demonstrate that the proposed BiGRU-based detection method achieves a significant improvement in BER performance compared with detection with conventional detection methods, like fixed-threshold detection, fast blind detection, and ML detection. Moreover, it also performs better than the detection method based on MLP under different turbulence conditions.
Author Contributions
Z.Y.: methodology; software; writing—original draft. Z.X.: funding acquisition; project administration; resources; writing—review and editing. J.L.: funding acquisition; writing—review and editing. J.W.: funding acquisition; formal analysis; writing—review and editing. J.Z.: investigation; resources; supervision. Y.S.: investigation; resources; supervision. Y.W.: investigation; resources; supervision. All authors have read and agreed to the published version of the manuscript.
Funding
This work was supported by the National Natural Science Foundation of China (Grant No. 62271502 and No. 62171463) and the Natural Science Foundation of Jiangsu Province (Grant No. BK20231486).
Data Availability Statement
The data that support the findings of this study are available from the corresponding author upon reasonable request.
Conflicts of Interest
The authors declare no conflicts of interest.
References
- Ghassemlooy, Z.; Arnon, S.; Uysal, M.; Xu, Z.; Cheng, J. Emerging optical wireless communications-advances and challenges. IEEE J. Sel. Areas Commun. 2015, 33, 1738–1749. [Google Scholar] [CrossRef]
- Chaleshtory, Z.N.; Gholami, A.; Ghassemlooy, Z.; Sedghi, M. Experimental investigation of environment effects on the FSO link with turbulence. IEEE Photonics Technol. Lett. 2017, 29, 1435–1438. [Google Scholar] [CrossRef]
- Basudewa, M.; Bagaskara, Z.; Damita, S.; Putra, R.; Ahmadi, D. Bit error rate performance analysis for free space optic communication. In IOP Conference Series: Materials Science and Engineering; IOP Publishing: London, UK, 2020; Volume 850, p. 012056. [Google Scholar]
- Alnajjar, S.H.; Noori, A.A.; Moosa, A.A. Enhancement of FSO communications links under complex environment. Photonic Sens. 2017, 7, 113–122. [Google Scholar] [CrossRef]
- Akbari, M.; Olyaee, S. BER performance analysis in SISO and MIMO-FSO channels with pointing error and different models. Int. J. Electron. 2025, 1–21. [Google Scholar] [CrossRef]
- Navidpour, S.M.; Uysal, M.; Kavehrad, M. BER performance of free-space optical transmission with spatial diversity. IEEE Trans. Wirel. Commun. 2007, 6, 2813–2819. [Google Scholar] [CrossRef]
- Tsiftsis, T.A.; Sandalidis, H.G.; Karagiannidis, G.K.; Uysal, M. Optical wireless links with spatial diversity over strong atmospheric turbulence channels. IEEE Trans. Wirel. Commun. 2009, 8, 951–957. [Google Scholar] [CrossRef]
- Tsiftsis, T.A.; Sandalidis, H.G.; Karagiannidis, G.K.; Uysal, M. FSO links with spatial diversity over strong atmospheric turbulence channels. In Proceedings of the 2008 IEEE International Conference on Communications, Beijing, China, 19–23 May 2008; IEEE: Piscataway, NJ, USA, 2008; pp. 5379–5384. [Google Scholar]
- Abaza, M.; Mesleh, R.; Mansour, A.; Aggoune, E.H.M. Spatial diversity for FSO communication systems over atmospheric turbulence channels. In Proceedings of the 2014 IEEE Wireless Communications and Networking Conference (WCNC), Istanbul, Turkey, 6–9 April 2014; IEEE: Piscataway, NJ, USA, 2014; pp. 382–387. [Google Scholar]
- Aarthi, G.; Prabu, K.; Reddy, G.R. Aperture averaging effects on the average spectral efficiency of FSO links over turbulence channel with pointing errors. Opt. Commun. 2017, 385, 136–142. [Google Scholar] [CrossRef]
- Viswanath, A.; Jain, V.K.; Kar, S. Aperture averaging and receiver diversity for FSO downlink in presence of atmospheric turbulence and weather conditions for OOK, M-PPM and M-DPPM schemes. Opt. Quantum Electron. 2016, 48, 435. [Google Scholar] [CrossRef]
- Li, M.; Cvijetic, M. Coherent free space optics communications over the maritime atmosphere with use of adaptive optics for beam wavefront correction. Appl. Opt. 2015, 54, 1453–1462. [Google Scholar] [CrossRef] [PubMed]
- Ata, Y.; Alouini, M.S. HAPS based FSO links performance analysis and improvement with adaptive optics correction. IEEE Trans. Wirel. Commun. 2022, 22, 4916–4929. [Google Scholar] [CrossRef]
- Yang, L.; Hasna, M.O.; Gao, X. Performance of mixed RF/FSO with variable gain over generalized atmospheric turbulence channels. IEEE J. Sel. Areas Commun. 2015, 33, 1913–1924. [Google Scholar] [CrossRef]
- Liu, X.; Lin, M.; Zhu, W.P.; Wang, J.Y.; Upadhyay, P.K. Outage performance for mixed FSO-RF transmission in satellite-aerial-terrestrial networks. IEEE Photonics Technol. Lett. 2020, 32, 1349–1352. [Google Scholar] [CrossRef]
- Zheng, C.; Yu, S.; Gu, W. A SVM-based processor for free-space optical communication. In Proceedings of the 2015 IEEE 5th International Conference on Electronics Information and Emergency Communication, Beijing, China, 14–16 May 2015; IEEE: Piscataway, NJ, USA, 2015; pp. 30–33. [Google Scholar]
- Amirabadi, M.A.; Kahaei, M.H.; Nezamalhosseini, S.A. Deep learning based detection technique for FSO communication systems. Phys. Commun. 2020, 43, 101229. [Google Scholar] [CrossRef]
- Narasimha, V.; Gurugopinath, S. Detection of On-Off Keying Signals in Free Space Optics: A Supervised Learning Approach. In Proceedings of the 2021 2nd International Conference for Emerging Technology (INCET), Belagavi, India, 21–23 May 2021; IEEE: Piscataway, NJ, USA, 2021; pp. 1–6. [Google Scholar]
- Cho, K.; Van Merriënboer, B.; Gulcehre, C.; Bahdanau, D.; Bougares, F.; Schwenk, H.; Bengio, Y. Learning phrase representations using RNN encoder-decoder for statistical machine translation. arXiv 2014, arXiv:1406.1078. [Google Scholar] [CrossRef]
- Chung, J.; Gulcehre, C.; Cho, K.; Bengio, Y. Empirical evaluation of gated recurrent neural networks on sequence modeling. arXiv 2014, arXiv:1412.3555. [Google Scholar] [CrossRef]
- Schuster, M.; Paliwal, K.K. Bidirectional recurrent neural networks. IEEE Trans. Signal Process. 1997, 45, 2673–2681. [Google Scholar] [CrossRef]
- Nguyen, M.T.; Mai, V.; Kim, H. Multiple-aperture direct-detection receiver based on maximal ratio combining for FSO communication. IEEE Photonics Technol. Lett. 2022, 34, 405–408. [Google Scholar] [CrossRef]
- Zhu, Y.J.; Sun, Z.G.; Zhang, J.K.; Zhang, Y.Y. A fast blind detection algorithm for outdoor visible light communications. IEEE Photonics J. 2015, 7, 7904808. [Google Scholar] [CrossRef]
Disclaimer/Publisher’s Note: The statements, opinions and data contained in all publications are solely those of the individual author(s) and contributor(s) and not of MDPI and/or the editor(s). MDPI and/or the editor(s) disclaim responsibility for any injury to people or property resulting from any ideas, methods, instructions or products referred to in the content. |
© 2025 by the authors. Licensee MDPI, Basel, Switzerland. This article is an open access article distributed under the terms and conditions of the Creative Commons Attribution (CC BY) license (https://creativecommons.org/licenses/by/4.0/).