Abstract
Optical-carried microwave interferometry (OCMI) has attracted increasing attention in recent years, as it combines the ease of phase extraction and manipulation of microwave techniques with the low-loss transfer of optical fibers. Conventional OCMI implementations typically employ broadband light sources and coherent photodetection, which inevitably suffer from dispersion, polarization fading, and phase drift, severely limiting the achievable sensing distance. In this work, we proposed an optimized OCMI architecture that adopts incoherent photodetection combined with electric-domain microwave interferometry. Comprehensive theoretical analysis and systematic experiments demonstrate that the proposed system enables robust, dynamic, and long-haul fiber transfer delay (FTD) measurements, no less than in 15 km length, with improved resolution and stability. It provides new insight for building long-haul FTD sensor networks.
1. Introduction
High-precision optical fiber transfer delay (FTD) measurements are a crucial component of ranging applications, including time–frequency transfer [1,2,3], phase array microwave systems [4,5,6,7], distributed acoustic and vibration sensing [8,9,10], and so on. In fiber optic sensing and communication systems, the capability to perform long-haul measurements with fine resolution is essential for ensuring system reliability and accuracy. For instance, in fiber optic time–frequency synchronization systems, precise delay measurement is critical for maintaining frequency stability and compensating clock offsets [11,12]. As a result, the development of techniques for measuring FTD that are simultaneously high in precision, capable of covering long distances, and robust against environmental perturbations has become a central focus in modern optical measurement research.
The core dilemmas the FTD technique currently faces include environmental sensitivity, limitations in measurement accuracy, and the difficulty of balancing high precision and large-range measurement. To address the diverse demands for high accuracy and extended measurement ranges across various application scenarios, a variety of fiber optic ranging methods have been developed in recent years, including optical time-domain reflectometry (OTDR), optical frequency-domain reflectometry (OFDR), direct interferometry, optical frequency comb ranging, and optical-carried microwave interferometry (OCMI). OTDR performs well in long-haul measurements, albeit with moderate resolution [13,14]; OFDR offers sub-millimeter precision, and its performance is typically optimized for shorter links [15]; and optical comb ranging combines high frequency stability with a high resolution [16], but its system complexity and cost are high. The traditional OCMI system combines the advantages of microwave photonics and optical interferometry to realize high-precision sensing and simple demodulation. The traditional OCMI ranging method provides high linearity and cost-effectiveness through frequency scanning and phase demodulation, emerging as a promising approach in practice [17].
On the basis of the abovementioned technology, OCMI has gradually established itself as a research trend for the next generation of fiber optic ranging technologies. In traditional OCMI, a broadband light source, e.g., amplified spontaneous emission (ASE), is usually used to provide optical carriers. Then, the phase change of the microwave interferometric signal is restored by a photodetector (PD) at the receiving end, so as to capture the optical path difference (OPD) and the corresponding distance information [18,19]. Some existing studies have laid a solid foundation for the FTD measurement of OCMI systems. For example, the time-domain Vernier effect effectively improves measurement sensitivity, and the dual-comb method enhances the resolution and accuracy of the system [20,21].
However, there are still some limitations that need to be improved upon in long-haul application scenarios. In practical applications, the OCMI system still faces problems such as polarization fading, phase drift, chromatic dispersion, etc. Especially in long-haul link measurement, these factors are prone to causing amplitude attenuation of the interferometric signals and phase instability, which affect the ranging accuracy and robustness of the system [22,23]. Targeting the abovementioned problems, this paper proposes a new type of OCMI ranging scheme, based on coherent superposition of microwave signals, which is designed to propose a new modulation structure and interferometric method, and not only improves the system immunity and ranging stability, but also shows the scheme’s potential popularity and application in long-haul and high-precision fiber optic link measurement scenarios. As shown in Table 1, we compared the measurement range, resolution, complexity, and robustness of the abovementioned technologies.

Table 1.
Comparison of different FTD measurement methods.
In long-haul measurement, OCMI has several significant advantages over conventional optical interferometric ranging [24,25]. Firstly, the microwave signal is insensitive to optical phase noise, which can effectively suppress the influence of light-source phase noise on the measurement [26,27]; secondly, the microwave frequency scanning can achieve high-precision absolute distance measurement, avoiding the phase ambiguity problem in traditional interferometric ranging [28,29,30].
This paper theoretically analyzes polarization fading and phase drift in OCMI system, experimentally investigates and evaluates dispersion effects, and proposes a novel electric-domain microwave structure. The effectiveness of the free spectral range (FSR) demodulation, inverse fast Fourier transform (IFFT) analysis, and phase shift amplification (PSA) methods is demonstrated, confirming the approach’s feasibility for high-accuracy long-haul fiber optic ranging. In this paper, Section 2 presents the theoretical foundations and mathematical modeling of the proposed electric-domain OCMI system, highlighting its advantages in overcoming challenges such as polarization fading and phase drift. Section 3 describes the experimental setup and methodology used to validate the theoretical claims, including details of the hardware configuration and measurement procedure. It discusses the experimental results, including a detailed analysis of the system’s performance in long-haul FTD measurements. Finally, Section 4 provides a conclusion and outlines potential future work to extend the system’s capabilities and explore its scalability.
2. Methods and Experimental Setups
Previous OCMI schemes utilizing broadband light sources have proved unable to measure long-haul FTD due to dispersion effects. This study investigates and evaluates the dispersion-induced power fading effect caused by a broadband light source through a combination of mathematical simulation and experimental validation.
The hardware configuration for both the dispersion-induced power simulation model and the experimental setup is illustrated in Figure 1. An ASE source was employed that delivers a broadband optical carrier spanning 1528–1563 nm and an output power of 3.9 dBm. This ensured sufficient optical energy for modulation while avoiding saturation in subsequent amplification stages. The optical carrier was intensity-modulated by a 10 GHz bandwidth electro-optical modulator (EOM) driven from port 1 of a vector network analyzer (VNA, Rohde & Schwarz ZNL14) at a microwave frequency from 5 kHz to 10 GHz. After modulation, the optical signal was boosted by an erbium-doped fiber amplifier (EDFA) operating at a 21 dB gain and clamped to a 10 dBm output. Thereby, the power launched into the fiber was normalized to 10 dBm for consistent measurements across different fiber lengths. The transfer path consisted of single-mode fiber spools (SMF28, YOSC) of different lengths, with the lengths being 0 m, 60 m, 1 km, and 10 km respectively. It had an attenuation coefficient of 0.19 dB/km and a dispersion of approximately 17 ps/(nm·km) at 1550 nm. At the receiver, a high-speed photodetector (PD) with a 10 GHz bandwidth and 0.85 A/W responsivity converted the optical signals into the electrical domain. The microwave signal was fed back to port 2 of the VNA. The system parameter settings remained unchanged in each group of experiments: the ASE output power, modulation index, launched power, were applied consistently in both the simulations and experiments, ensuring the credibility of the experimental results and enabling precise evaluation of ranging performance as a function of fiber length. It is worth noting that the initial powers of the signals in the simulation model and experimental measurement were different. The initial power of the simulation model was 0 dBm, while that of the experimental measurement signal was 10 dBm.
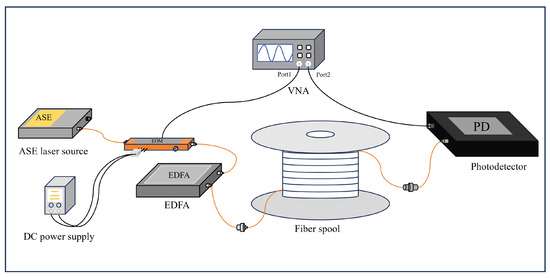
Figure 1.
A schematic of the proposed dispersion measurement method.
In the simulation of long-haul fiber optic transfer, the multi-wavelength components of a broadband ASE light source produced a frequency-dependent phase delay in the fiber due to group velocity differences. When the VNA has performed a frequency sweep, the frequency response measured by the system can be expressed as follows:
is the amplitude function, is the initial power considering fiber loss and gain (in ), and N is the number of wavelength sampling points. is the wavelength. and represent the upper and lower sidebands, respectively. Considering the fiber dispersion parameter D, length z, and group velocity , the phase term introduced by each wavelength component can be expressed as follows:
The form of the first term is . Here, is the propagation time of the optical carrier; f is the modulation frequency; is the group delay coefficient; and , where z is the transfer distance, is the length of the fiber under test (FUT), and is the asymmetric part of the lengths of the two paths of the microwave interferometer. The second term arises from frequency dispersion caused by the frequency difference between the upper and lower sidebands. Its form is . Here, is the delay value, D is the dispersion parameter, f is the modulation frequency, is the wavelength, and c is the speed of light. These two phase components jointly determine the interference pattern of the signal at the receiver. By summing over the sampled wavelengths, the result can be obtained. The dispersion expression based on group velocity is as follows: . Here, D is the dispersion parameter, is the wavelength, is the reference wavelength of the optical fiber material, and c is the speed of light. The output power in the frequency domain is obtained by superimposing the interference results of all wavelength components.
The experimental results are generally consistent with the simulation results, as shown in Figure 2, which compares simulation and experimental data on dispersion-induced power fading. As the fiber length increases, the attenuation grows nonlinearly from low to high frequencies. This behavior arises because microwave signals carried by different wavelength components experience dispersion-induced phase delays at the receiver. The resulting phase differences lead to destructive interference, producing periodic power fluctuations, observed as dispersion-induced pseudo-interference fringe fading. Due to this limitation, traditional OCMI systems that adopt ASE light sources are simply unable to achieve long-haul measurement. The measurable distance can hardly exceed the scale of one hundred meters [31].
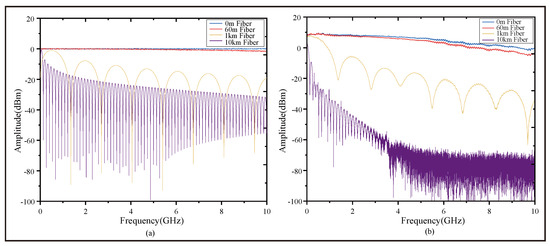
Figure 2.
Comparison of simulation and experimental results of dispersion-induced power fading. (a) Simulation results of dispersion-induced power fading when optical fibers of different lengths were used. (b) Experimental results of dispersion-induced power fading when optical fibers of different lengths were used, measured by a VNA.
The hardware configuration for the experimental setup is illustrated in Figure 3. An electric-domain OCMI system was constructed to validate the ability of the proposed method to extract distance information in long-haul fiber optic sensing. The setup employed a VNA as the microwave signal source. The VNA was configured to sweep within multiple frequency bands, including 5.3900–5.3905 GHz and so on, corresponding to different demodulation schemes. This ensured an optimal signal-to-noise ratio (SNR) for each measurement scenario. The overall interference loop was designed to maintain phase coherence between the reference and sensing arms. The output from port 1 of the VNA was firstly split by a 50:50 microwave power splitter.
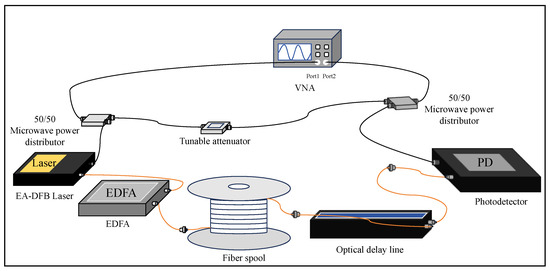
Figure 3.
A schematic of the proposed FTD measurement method.
The sensing path started from one output port of the power splitter. The microwave signal was connected as a modulation signal to an electro-absorption distributed feedback (EA-DFB) laser operating at a wavelength of 1550.12 nm, producing a modulated optical carrier. This optical signal was amplified by an EDFA to a launched power of 10 dBm before entering the FUT. After propagating through the FUT, the optical signal passed through a fiber optic delay line (ODL, Suzhou, China, iXunPhoton, YXOLD-1550SM-0-60-0-FA) with an adjustable delay range of 0–600 ps and a minimum resolution of 0.001 ps. The ODL enabled precise verification of the system’s ranging resolution by introducing controlled path length variations. Its delay was tuned under multiple resolution settings to assess performance stability and measurement repeatability. Finally, the delayed optical signal was detected by a PD, converting it back to an electrical signal. The reference path started from the other output port of the power splitter and was subsequently connected to a tunable attenuator. This can be used to provide the reference microwave signal involved in the interference. The electrical signal from the PD of the sensing path and the attenuated reference signal from the tunable attenuator were then combined using a second 50:50 microwave power splitter. This generated the desired microwave interference signal, which was fed into port 2 of the VNA for analysis. The entire experimental platform was temperature-controlled by an incubator throughout the process, with a temperature control accuracy of ±0.1 ℃, to offset the influence of temperature differences. The typical parameters of the measurement system are shown in Table 2.

Table 2.
Typical measurement system parameters.
The system employs intensity modulation, and the optical field of the system can be expressed as follows:
In the equation, denotes the total optical field, represents the amplitude of the carrier signal, is the angular frequency of the optical carrier, t is the time, signifies the amplitude of the microwave signal, is the angular frequency of the microwave signal, is the propagation coefficient of the optical carrier, is the group delay coefficient, and is the dispersion coefficient.
In traditional coherent OCMI sensing systems, polarization fading and phase drift are two key factors that affect system performance. Polarization fading mainly refers to the fluctuation of signal intensity caused by random changes in the polarization state of light waves during transmission. Phase drift refers to the unanticipated disturbance of the phase of light waves resulting from changes over time and environmental factors. These two phenomena can significantly reduce the SNR during coherent detection, thereby affecting the accuracy and reliability of the measurements.
To conduct an in-depth analysis and verification of the proposed new structure, we have performed mathematical modeling of the optical signal. First, we define the polarized optical field signal as follows:
where t is the time, and and are electric fields in the x and y directions, respectively. The amplitudes of the components are and , and their phases are and , respectively. is the angular optical frequency, and and are the unit vectors along x and y directions, respectively.
The microwave modulation term becomes
where is the modulation index in the x and y direction, respectively. Note that the microwave modulations may be different in the x and y directions. represents the signal generated by the signal source, and M is the modulation depth constant, indicating the amplitude modulation intensity of the signal. is the angular frequency of the modulation signal, is the angular frequency of the carrier signal, z is the transmission distance, and is the effective refractive index of the optical fiber. The microwave envelopes include two delay terms. The first is the delay associated with the common electrical length (W) of the microwave system, and this delay is the same for all the paths. The second delay term is the contributions from the optical propagation delays along the different optical paths. The polarization phase contributions are reduced by a factor of , becoming negligible because is at least 5 orders of magnitude larger than W. As such, the variations in optical polarization have very little influence on the microwave signals [26].
The microwave electric-domain structure performs demodulation entirely in the electrical field, effectively eliminating the dependence on optical interference. This avoids the problem of polarization mismatch and demonstrates strong anti-polarization degradation capability. From Equations (3)–(5), in the electric-domain architecture proposed in this paper, the incoherent detection converts the optical signal into an intensity signal, which subsequently forms electric-domain interference. As a result, the interference output is independent of the polarization state of the input optical field. Random polarization variations do not cause amplitude fluctuations that reduce the visibility of interference fringes, thereby effectively suppressing polarization fading. Moreover, as indicated by Equation (5), the microwave phase at the receiving end depends solely on the propagation delay rather than the instantaneous phase of the optical carrier. Consequently, optical phase drift induced by environmental perturbations is not transferred to the microwave electric domain, endowing the phase measurement with intrinsic immunity and ensuring high stability and robustness in long-haul measurements.
In this paper, building on the research foundation of the traditional OCMI ranging system, we optimize the microwave photonic link design by adopting an incoherent detection scheme. This approach introduces an incoherent structure, paired with a narrow-linewidth EA-DFB laser as the carrier light source, which significantly enhances the system’s capability to suppress polarization fading and phase drift. By eliminating reliance on external optical interference paths and instead utilizing microwave combination in the electrical domain to generate microwave interferometry, the system effectively overcomes the polarization fading, phase drift, and dispersion inherent in conventional OCMI systems.
3. Experimental Results and Discussion
The specific fiber optic path sections were chosen based on their representative characteristics of typical long-haul measurement, allowing for a realistic assessment of the system’s performance in FTD measurements. Additionally, these sections provided a controlled environment for testing various factors, such as signal attenuation and dispersion over extended distances. After completing the system setup, the capability of the electric-domain OCMI system can be demonstrated by analyzing the recorded original A-F and phase-frequency (P-F) data. A comprehensive analysis was conducted on the system using the FSR, complex IFFT, and P-F characteristics near the destructive interference points. Four picosecond-scale delays were implemented via an ODL, with the delay increasing as the group number rose. The amplitude and phase shift performance of the electric-domain OCMI was consistent with that of traditional OCMI, verifying the system’s demodulation capability.
As shown in Figure 4, the electric-domain OCMI system can form clear interference fringes. Meanwhile, the centroid averaging method is introduced to improve the extraction accuracy of the destructive interference peaks. Figure 4 illustrates that electric-domain OCMI can fully replace the traditional OCMI scheme; this was demonstrated using the FSR, IFFT, and PSA demodulation techniques as follows.

Figure 4.
Measurement results of FSR corresponding to FUTs with different lengths in different frequency ranges. (a) FSR when FUT is a fiber 60 m in length. (b) FSR when FUT is a fiber 1.2 km in length. (c) FSR when FUT is a fiber 15 km in length.
FSR ranging determines distance by converting the FTD of reflected signals into spectral shifts according to the interferometer’s FSR. Its formula is , where represents the path difference, c is the speed of light, and FSR denotes the free spectral range. The interferometer enables the system to detect the phase difference caused by the path difference. directly affects the FSR of the interferometer [26]. The formula describes the relationship between the phase difference and spectral response, providing a method to convert frequency variations into FTD.
The results of FTD using the FSR method are shown in Table 3. As verified by experimental data, this electric-domain OCMI system achieves all the abilities of traditional OCMI. The FSR method measures the path difference between the sensing path and the reference path. For example, although a 60 m long optical fiber was specifically used in the experiment, the actual FTD value corresponds to the transfer delay resulting from the path difference between the two paths. The measurement results are as follows: for the 60 m long optical fiber, the result is 112,809.52 ps; for the 1.2 km long optical fiber, the result is 3,990,024.9 ps; and for the 15 km long optical fiber, the result is 49,925,112 ps.

Table 3.
The results of the FSR ranging method.
For the electric-domain OCMI system constructed in this paper, its ranging capability is one of its core performance indicators. In the experiment, single-mode optical fibers of different lengths were used as the transfer medium. The A-F and P-F data were transformed to the time domain by complex IFFT. The frequency-domain-synthesized reconstructed response signal was processed as follows: the amplitude and phase corresponding to each frequency component were converted into complex exponential form, then superimposed in the time domain, and the time delay characteristics were extracted. Figure 5, Figure 6 and Figure 7 correspond to the time domain of the response signals at various distances. It can be observed from these figures that the peaks of the response signals gradually shift backward as the transfer distance increases, exhibiting time delay variations that can be accurately demodulated via IFFT. The time-domain positions of the two peaks correspond to the lengths of the reference path and the measurement path, respectively. This characteristic verifies that the system can stably extract the target response information of FUT with different lengths and exhibits excellent dynamic distance measurement capability.
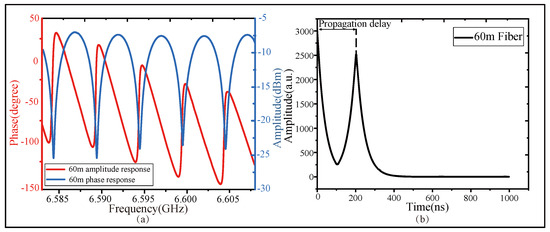
Figure 5.
The measurement results of the system when the FUT is 60 m long. (a) The A-F and P-F response, in the form of dual Y-axis graph, of the 60 m long fiber. (b) The time-domain response propagation delay derived by the IFFT method.
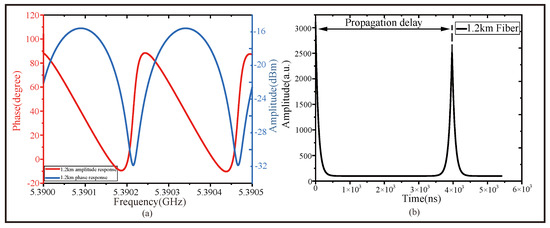
Figure 6.
The measurement results of the system when the FUT is 1.2 km long. (a) The A-F and P-F response, in the form of a dual Y-axis graph, of the 1.2 km long fiber. (b) The time-domain response propagation delay derived by the IFFT method.
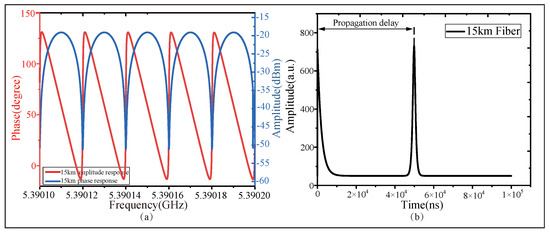
Figure 7.
The measurement results of the system when the FUT is 15 km long. (a) The A-F and P-F response, in the form of dual Y-axis graph, of the 15 km long fiber. (b) The time-domain response propagation delay derived by the IFFT method.
As shown in Figure 5, the experimental results exhibit a sharp and narrow impulse response with high signal strength and low noise, indicating strong noise suppression capability when using the 60-m optical fiber.
As shown in Figure 6, the waveform contrast remains stable, which confirms the reliability of the system when using the 1.2 km fiber.
As shown in Figure 7, even with a 15 km long optical fiber, the waveform can still form a clearly visible response peak in the time domain. From the A-F and P-F responses in the dual Y-axis comparison graph of the 60 m long optical fiber and 1.2 km long optical fiber, it can be observed that the central frequencies of the A-F and P-F characteristics at the destructive interference points exhibit good consistency. Notably, even at a distance of 15 km, the reconstructed signal still retains a clear and sharp main response peak without significant broadening or distortion, which confirms the robustness of the microwave interferometry and demodulation in the electric-domain OCMI against dispersion and phase noise.
Furthermore, to conduct an in-depth analysis of the system’s resolution capability in long-haul scenarios, this paper uses the experimental results in the 15 km long optical fiber scenario as the basis for evaluating and verifying the resolution performance.
Time-domain signal interpolation was achieved through zero-padding of the acquired frequency spectrum data in the IFFT. The actual measurement resolution was also affected by factors such as noise and external interference. Through multiple tests, the fiber transfer delay measurement resolution of the developed prototype could reach 1 ps after introducing frequency-domain zero-padding.
In the 15 km long-haul transmission scenario, the system introduces additional delays of 1 picosecond and 3 picoseconds due to the ODL. The system clearly demonstrates A-F and P-F characteristics with different delay values in Figure 8a,b. Both the A-F and P-F characteristics clearly indicate that as the delay value increases, regular frequency shifts occur in both the A-F and P-F characteristics. After transforming the A-F and P-F responses into the time domain via IFFT, as shown in Figure 8c, the system can still accurately capture the response signal of the main reflection peak. To facilitate a comparison of how the main response peak varies with delay values, a 3D frequency–time delay diagram, as shown in Figure 8d, was constructed, in which a clear multi-peak structure is still maintained. Such performance is rarely achieved in traditional optical interferometry. Experimental results show that, compared with traditional OCMI, the delay peak after inverse transformation does not exhibit broadening or drift phenomena. In the 15 km fiber optic measurements, temperature variations were carefully controlled to minimize their impact on the fiber transfer delay. However, due to the limited volume of the incubator, it cannot accommodate fiber spools of longer lengths. This is a physical limitation of the experimental equipment and does not imply the system’s incompatibility with longer distances.
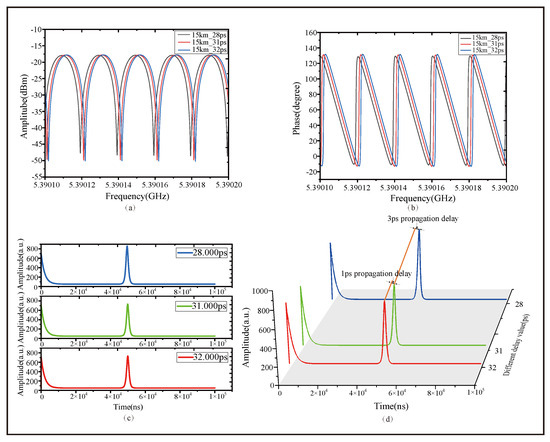
Figure 8.
The measurement results of different delay values when the FUT is 15 km long. (a) The A-F characteristics near the destructive interference points. (b) The P-F characteristics. (c) The time-domain response signals derived by the IFFT method. (d) The time-domain responses signals derived by the IFFT method in 3D form.
As shown in Figure 9, in the 15 km long fiber scale, multiple sets of extremely small delay values were introduced using ODL to rigorously verify the electric-domain OCMI system’s ability. refers to the phase change at the position of destructive interference.
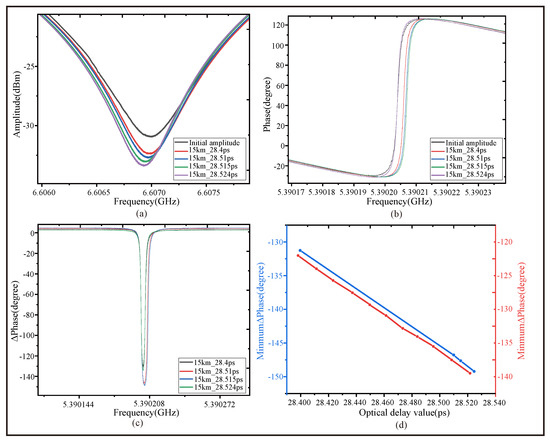
Figure 9.
Different displacement variations induced by an ODL when connected to a 15 km long FUT. (a) The A-F near the destructive interference. (b) The phase shift near the destructive interference. (c) at the destructive interference. (d) The linear relationship between and the corresponding delay values.
Figure 9a,b show the A-F characteristics and P-F characteristics near the destructive interference points. From the interference fringes, it can be clearly observed that near the destructive interference points, the frequency shift of the A-F characteristics and P-F characteristics changes with an increase in the introduced transfer delay. As shown in Figure 9c, refers to the phase change at the position of destructive interference. This indicates that changes with the delay value, and the phase can be quantitatively determined using techniques such as PSA. The PSA method achieves high-precision distance measurement and minimal displacement determination by detecting extremely small phase changes, which are amplified into more obvious intensity or frequency responses in the interference output. Meanwhile, Figure 9d reveals the linear relationship between and its corresponding delay value. Since the corresponding experiment is based on data from the same group of experiments, we conducted more repetitive experiments to verify its linear relationship more thoroughly. This demonstrated the capability of the proposed OCMI system to achieve PSA for applications such as phase measurement and minimal distance determination. Using the PSA method to process data can resolve FTD changes on the order of ps. After applying the PSA method, minimal displacements could be distinguished.
In summary, the experimental results demonstrate that the electric-domain OCMI system achieves high resolution and stability in long-haul measurements. The system exhibits consistently high sensitivity and repeatability in the face of path changes, benefiting from its inherent capabilities of phase noise suppression, dispersion, and polarization drift elimination. It is particularly suitable for precision measurements in harsh environments. These advantages enable it to show broad application prospects in the fields of optical fiber sensing and high-precision long-haul sensing.
4. Conclusions
We propose and demonstrate an electric-domain OCMI system for long-haul, high-resolution fiber sensing with optical incoherent detection. By shifting interference to the microwave electrical domain, the system overcomes challenges in traditional optical interferometry, such as polarization fading, phase drift, and chromatic dispersion-induced power fading, improving signal fidelity and measurement accuracy over long fibers.
Experimental results obtained using different length single-mode optical fibers demonstrate that the system possesses an ultra-strong ranging capability rarely seen in traditional optical systems. The system’s strong anti-dispersion and anti-drift capabilities are confirmed through frequency-domain measurements and time-domain reconstruction. The system systematically verifies the methods of FSR, IFFT, and PSA demodulation through comprehensive experiments and data analysis. This system decouples distance measurement from environmental instability, making it ideal for ranges up to 15 km and dynamic sensing applications. It provides a robust solution for FTD and ranging applications.
In conclusion, the electric-domain OCMI system establishes a novel and high-performance pathway for next-generation fiber optic sensing, especially in scenarios demanding long-haul, high-resolution, and interference-resilient measurements. The demonstrated system is particularly promising.
Author Contributions
Conceptualization, Y.Y. (Yiguang Yang), Y.Y. (Yibo Yuan), and X.L.; methodology, H.L. (Hengrui Liu); software, Z.W.; validation, H.L. (Hongyu Li), Y.Y. (Yibo Yuan) and H.L. (Hengrui Liu); formal analysis, H.Z.; investigation, H.L. (Hengrui Liu) and Z.W.; resources, Y.Y. (Yibo Yuan), Y.Y., (Yiguang Yang) and X.L.; data curation, H.Z.; writing—original draft preparation, H.L. (Hengrui Liu); writing—review and editing, X.L., Y.Y. (Yibo Yuan), and H.L. (Hengrui Liu); visualization, H.L. (Hengrui Liu) and H.Z.; supervision, X.L., Y.Y. (Yibo Yuan), and Y.Y. (Yiguang Yang); project administration, X.L., Y.Y. (Yibo Yuan), and Y.Y. (Yiguang Yang); funding acquisition, Y.Y. (Yibo Yuan) and H.L. (Hongyu Li). All authors have read and agreed to the published version of the manuscript.
Funding
This research was funded by the National Natural Science Foundation of China (Grant No. 42106187); the National Key Research and Development Program of China (No. 2022YFF0705700); the Opening Funding of Laoshan Laboratory Science and Technology Innovation Project (No. LSKJ202200801).
Institutional Review Board Statement
Not applicable.
Informed Consent Statement
Not applicable.
Data Availability Statement
The data presented in this study are available on request from the corresponding author.
Conflicts of Interest
The authors declare no conflicts of interest.
Abbreviations
The following abbreviations are used in this manuscript:
| A-F | Amplitude–frequency |
| ASE | Amplified spontaneous emission |
| EA-DFB | Electro-absorption distributed feedback laser |
| EDFA | Erbium-doped fiber amplifier |
| EOM | Electro-optical modulator |
| FSR | Free spectral range |
| FUT | Fiber under test |
| FTD | Fiber transfer delay |
| IFFT | Inverse fast Fourier transform |
| OCMI | Optical-carried microwave interferometry |
| ODL | Optical delay line |
| OFDR | Optical frequency-domain reflectometry |
| OPD | Optical path difference |
| OTDR | Optical time-domain reflectometry |
| PD | Photodetector |
| PSA | Phase shift amplification |
| P-F | Phase–frequency |
| SMF | Single-mode fiber |
| SNR | Signal-to-noise ratio |
| VNA | Vector network analyzer |
References
- Guo, X.; Hou, B.; Liu, B.; Yang, F.; Kong, W.; Liu, T.; Dong, R.; Zhang, S. Time transfer in a 1839-km telecommunication fiber link demonstrating a picosecond-scale stability. Chin. Phys. Lett. 2024, 41, 064202. [Google Scholar] [CrossRef]
- Guan, Z.; Shi, J.; Zhu, J.; Luo, J.; Zuo, C.; Guang, D.; Wang, H.; Wu, X.; Lu, L.; Wang, R.; et al. Time-delay measurement method based on the frequency-spectrum distribution of laser intensity or phase noise signal. IEEE Sens. J. 2025, 25, 618–624. [Google Scholar] [CrossRef]
- Xu, Z.; Sun, X.; Zhang, Y.; Qiu, B.; Yang, Y.; Wang, X.; Pan, S. Absolute Time Delay Measurement Over an Existing Radio Over Free-Space Optical Link with Sub-Picosecond Precision. Laser Photonics Rev. 2023, 17, 2200835. [Google Scholar] [CrossRef]
- Luan, Y.; Yang, T.; Ren, J.; Li, R.; Zhang, Z. Broadband beam-scanning phased array based on microwave photonics. Electronics 2024, 13, 1278. [Google Scholar] [CrossRef]
- Pan, S.; Ye, X.; Zhang, Y.; Zhang, F. Microwave photonic array radars. IEEE J. Microwaves 2021, 1, 176–190. [Google Scholar] [CrossRef]
- Dong, J.; Zhang, F.; Jiao, Z.; Sun, Q.; Li, W. Microwave photonic radar with a fiber-distributed antenna array for three-dimensional imaging. Opt. Express 2020, 28, 19113–19125. [Google Scholar] [CrossRef]
- Dong, J.; Sun, Q.; Jiao, Z.; Zhang, L.; Yin, Z.; Huang, J.; Yu, J.; Wang, S.; Li, S.; Zheng, X.; et al. Photonics-enabled distributed MIMO radar for high-resolution 3D imaging. Photonics Res. 2022, 10, 1679–1688. [Google Scholar] [CrossRef]
- Wang, G.; Song, D.; Pang, Z.; Wang, F.; Dai, H.; Li, W.; Wang, B. Laser interferometry for high-speed railway health inspection using telecom fiber along the line. Nat. Commun. 2025, 16, 4129. [Google Scholar] [CrossRef] [PubMed]
- Kong, W.; Liu, F.; Zhu, G.; Yan, Y.; Zhou, X. Localization enhancement of forward-transmission distributed vibration sensors using phase differentiation endpoint amplification. IEEE Sens. J. 2024, 24, 17669–17676. [Google Scholar] [CrossRef]
- Shao, L.; Zhang, J.; Chen, X.; Xu, D.; Gu, H.; Mu, Q.; Yu, F.; Liu, S.; Shi, X.; Sun, J.; et al. Artificial intelligence-driven distributed acoustic sensing technology and engineering application. PhotoniX 2025, 6, 4. [Google Scholar] [CrossRef]
- Chen, Z.; Yu, D.; Lu, G.; Zhang, Y.; Yu, S.; Luo, B.; Guo, H. Dual-comb-enhanced microwave clock synchronization over commercial fiber. Optica 2024, 11, 1268–1276. [Google Scholar] [CrossRef]
- Xu, Z.; Sun, X.; Yu, F.; Chen, K.; Pan, S. Frequency-modulated continuous-wave laser ranging using low-duty-cycle signals for the applications of real-time super-resolved ranging. Opt. Lett. 2021, 46, 258–261. [Google Scholar]
- Nanni, J.; Lenzi, E.; Perini, F.; Monari, J.; Mattana, A.; Caputo, F.; Maccaferri, G.; Orfei, A.; Kenney, D.; Wu, A.; et al. Accurate, cost-efficient microwave photonic fiber-transfer-delay measurement system. J. Light. Technol. 2024, 42, 7612–7618. [Google Scholar] [CrossRef]
- Zhu, G.; Liu, F.; Liu, X.; Kumar, S.; Zhou, X. Noise Performance Analysis and Optimization of Downsampling Heterodyne Φ-OTDR. IEEE Sens. J. 2024, 24, 14093–14100. [Google Scholar]
- Lv, T.; Shu, D.; Zhang, Y.; Zhou, D.-P.; Peng, W.; Chen, L.; Bao, X. Dispersion-induced delay deviation and its influence on distributed strain measurement using ofdr. J. Light. Technol. 2025, 43, 2379–2385. [Google Scholar]
- Meng, Y.; Shi, Y.; Zou, K.; Song, Y.; Hu, X. Long-distance and high-precision ranging with dual-comb nonlinear asynchronous optical sampling. Opt. Express 2024, 32, 20166–20174. [Google Scholar] [CrossRef] [PubMed]
- Ben Ayun, M.; Rosenberg, S.; Gotliv, D.; Sternklar, S. Fundamental limits of photonic RF phase-shift amplification by RF interferometry. J. Light. Technol. 2017, 35, 1906–1913. [Google Scholar] [CrossRef]
- Huang, J.; Lan, X.; Wang, H.; Yuan, L.; Xiao, H. Optical carrier-based microwave interferometers for sensing application. In Proceedings of the Fiber Optic Sensors and Applications XI, Baltimore, MD, USA, 8–9 May 2014; Volume 9098, pp. 94–99. [Google Scholar]
- Hua, L.; Zhu, X.; DeWolf, S.; Lei, J.; Zhang, Q.; Murdoch, L.; Xiao, H. Phase Demodulation by Frequency Chirping in Coherence Microwave Photonic Interferometry. IEEE J. Sel. Top. Quantum Electron. 2021, 27, 1–9. [Google Scholar] [CrossRef]
- Xiao, Y.; Wang, Y.; Zhu, D.; Liu, Q.; Shi, J. Low cross-sensitivity and sensitivity-enhanced fbg sensor interrogated by an ocmi-based three-arm interferometer. Opt. Express 2023, 31, 14119–14127. [Google Scholar] [CrossRef]
- Newbury, N.R.; Coddington, I.; Swann, W. Sensitivity of coherent dual-comb spectroscopy. Opt. Express 2010, 18, 7929–7945. [Google Scholar] [CrossRef]
- Benítez, J.; Mora, J. Sensitivity Enhancement for Low-Coherence Interferometry. IEEE Photonics Technol. Lett. 2017, 29, 1735–1738. [Google Scholar] [CrossRef]
- Heng, L.; Yang, K.; Zhu, B.; Xue, M.; Pan, S. High-resolution polarization-dependent loss measurement using microwave photonics. In Proceedings of the Semiconductor Lasers and Applications XIV, Nantong, China, 12–15 October 2024; Volume 13233, pp. 23–26. [Google Scholar]
- Lucas, E.; Brochard, P.; Bouchand, R.; Schilt, S.; Südmeyer, T.; Kippenberg, T.J. Ultralow-noise photonic microwave synthesis using a soliton microcomb-based transfer oscillator. Nat. Commun. 2020, 11, 374. [Google Scholar] [CrossRef]
- Li, R.; Liu, X.; Chen, Y.; Lv, S.; Lei, X.; Zhang, P.; Zhang, J. Ultra-high sensitivity microwave-photonic sapphire fiber Fabry-Perot interferometry based on the Vernier effect. Opt. Express 2023, 31, 25047–25057. [Google Scholar] [CrossRef]
- Huang, J. Optical Fiber Based Microwave-Photonic Interferometric Sensors. Ph.D. Thesis, Clemson University, Clemson, SC, USA, 2015. [Google Scholar]
- Li, H.; Kang, J.; Feng, L.; Yue, J.; Hou, Y.; Wu, B. Phase extraction of optical carrier-based microwave interferometry with all-phase fast Fourier transform for distance measurement. Opt. Lasers Eng. 2022, 156, 107090. [Google Scholar] [CrossRef]
- Li, S.; Qing, T.; Fu, J.; Wang, X.; Pan, S. High-accuracy optical fiber transfer delay measurement using fiber-optic microwave interferometry. J. Light. Technol. 2020, 39, 627–632. [Google Scholar] [CrossRef]
- Li, Z.; Gu, S.; Feng, D.; Nan, X.; Deng, M.; Zhu, T. Large-range and highly sensitive displacement measurement with an optical carrier-based microwave interferometry. IEEE Sens. J. 2024, 24, 6792–6798. [Google Scholar] [CrossRef]
- Wang, L.; Yang, Y.; Sang, Q.; Wang, J.; Wang, X.; Pan, S. Time-domain vernier effect for ultra-fast and ambiguity-free optical transfer delay measurement. J. Light. Technol. 2025, 43, 4538–4545. [Google Scholar] [CrossRef]
- Gliese, U.; Norskov, S.; Nielsen, T. Chromatic dispersion in fiber-optic microwave and millimeter-wave links. IEEE Trans. Microw. Theory Tech. 2002, 44, 1716–1724. [Google Scholar] [CrossRef]
Disclaimer/Publisher’s Note: The statements, opinions and data contained in all publications are solely those of the individual author(s) and contributor(s) and not of MDPI and/or the editor(s). MDPI and/or the editor(s) disclaim responsibility for any injury to people or property resulting from any ideas, methods, instructions or products referred to in the content. |
© 2025 by the authors. Licensee MDPI, Basel, Switzerland. This article is an open access article distributed under the terms and conditions of the Creative Commons Attribution (CC BY) license (https://creativecommons.org/licenses/by/4.0/).