Article

Enhanced Nanoparticle Detection Using Momentum-Space Filtering for Interferometric Scattering Microscopy (iSCAT)

1
School of Mechatronics Engineering, Harbin Institute of Technology, Harbin 150001, China
2
School of Microelectronics, Southern University of Science and Technology, Shenzhen 518055, China
*
Author to whom correspondence should be addressed.
Photonics 2025, 12(10), 945; https://doi.org/10.3390/photonics12100945
Submission received: 20 August 2025 / Revised: 19 September 2025 / Accepted: 22 September 2025 / Published: 23 September 2025
(This article belongs to the Special Issue Research, Development and Application of Raman Scattering Technology)

Abstract

Interferometric scattering microscopy (iSCAT) is a powerful tool for single-particle detection. However, the detection sensitivity is significantly limited by high-frequency noise. In this paper, we have proposed a novel method leveraging frequency component analysis in the Fourier domain to enhance interference patterns, thus efficiently improving the detection accuracy. The bright–dark rings momentum feather has been effectively restored by a combined filter for high-frequency noise and aperture attenuation. The value of the structural similarity index measure has been improved from 0.73 to 0.98. We validate this method on gold nanoparticle samples. The results demonstrate its great potential to advance single-particle tracking by enhancing background suppression in iSCAT applications.

Graphical Abstract

1. Introduction

The detection of single particles is a fundamental prerequisite for tracking and analyzing the dynamics of single nano-scale matter under microscopy. This technique has garnered significant attention in intracellular imaging applications, including the monitoring of biomolecular interactions [1], lipid diffusion [2,3], and protein tracking [4,5,6]. While fluorescent microscopy remains widely employed in bioimaging due to its advantages in selectively exciting and detecting fluorescence through distinct optical pathways, the fluorescence targeting process is complex and usually requires the targeting of multiple fluorescent molecules through the connection of primary and secondary antibodies [7,8,9]; the instability of fluorescent molecules can adversely affect imaging, leading to unstable phenomena such as saturation [10,11], bleaching [12], quenching bleaching [13,14], and fluorescence blinking [15]. These limitations hinder reliable particle detection, particularly for a single nanoparticle. Interferometric scattering microscopy (iSCAT) and coherent bright field microscopy provide significant advantages over fluorescence microscopy for monitoring nanoparticles, providing direct observation but achieving high signal-to-noise ratio (SNR) for very small particles is still challenging due to the unselected reflection of the reference. These techniques achieve high sensitivity [16] and exceptional spatiotemporal resolution [17]. Unlike fluorescence microscopy, iSCAT generates its signal through the interference of illumination and scattered light, thereby circumventing the instability caused by photo-bleaching and quenching. Furthermore, compared with the relatively low quantum efficiency in fluorescence microscopy, scattering-based techniques inherently produce higher intensity signals. The contrast in iSCAT is significantly enhanced due to the interference of light, enabling the direct observation of single nanoparticles as small as 5 nm [18].
However, challenges remain in background extraction and sensitivity enhancement. The inability to exclude reference light leads to uniformity issues arising from imperfect illumination, complicating background removal. Additionally, shot noise poses a fundamental limitation to particle detection sensitivity. In the spatial domain, several approaches have been developed to address background noise. For instance, static backgrounds can be estimated using the median intensity of each pixel over a defined temporal window and subsequently subtracted [19] or divided [20]. Another method involves treating the previous frame as the background, exploiting differences in consecutive frames caused by moving particles. These algorithms effectively mitigate spatial inhomogeneities stemming from illumination or reflection. A more advanced approach leverages the correlated signal information encoded in neighboring pixels, governed by the point spread function (PSF), to enable PSF-based background estimation [21]. This method facilitates accurate background extraction even when particle displacement is subdiffraction-limited. Despite these advancements, sensitivity remains constrained by shot noise. Shot noise is typically characterized as randomly distributed in both space and time. To overcome this limitation, higher sensitivity has been achieved through temporal averaging of shot noise variations. Notable techniques include the differential rolling average algorithm [22] and ratiometric methods [23], which can be regarded as normalized differential rolling averages. These approaches have enabled the direct observation of single proteins. Mass photometry has emerged as a powerful tool for measuring the mass of individual nanoparticles [24]. When combined with self-supervised machine learning, sensitivity has been further enhanced to levels below 10 kDa [25]. Additionally, low-pass filters in the frequency domain have been employed to suppress extraneous noise sources, such as camera read-out noise [26]. The image of a single nanoparticle is typically described by its PSF [27], which is often approximated by a Gaussian function [28,29,30]. Particle detection is generally achieved by identifying Gaussian profiles, with the contrast and SNR of these functions serving as key metrics for evaluating imaging quality. Bright–dark rings are a defining feature of interferometric scattering-based microscopy, which was modeled as an interferometric point spread function (iPSF) [31]. These iPSF-shaped features encode critical particle information, including contrast, localization [32], and orientation [33]. However, few algorithms currently exploit both noise distribution characteristics and interferometric features in the frequency domain. PSF-engineering-based matched filters are widely applied in microscopy [34,35,36], and matched filters for the iPSF model have the potential to improve the detection sensitivity.
In this study, we have established the effective interferometric optical transfer function (iOTF) within iSCAT microscopy, identifying that only a limited set of frequency components originate from the signal. Frequencies beyond this limited boundary contribute to noise, resulting in particles in noise-dominated images. The aperture attenuation also contributes to the distortion. To address these distortions, we developed a particle detection approach incorporating low-pass and notch filters within the frequency domain. Additionally, we introduced a threshold-restrained radial variance transfer (RVT) [22] technique for nanoparticle identification. The algorithm’s effectiveness was assessed through comparative analysis of noise-dominated images, derived from both simulations and experiments. Results demonstrate that the intensity profiles in noise-dominated images exhibit greater similarity to theoretical predictions than their counterparts in the raw image, underscoring the method’s ability to enhance signal extraction from noise in coherent brightfield microscopy (COBRI). Furthermore, our approach successfully identified gold nanoparticles whose peak intensities were initially below the noise threshold in the raw images, showcasing its capability for robust nanoparticle detection. The momentum feather in iSCAT found its application both in single-particle tracking and precise axial localization. We believe our concept to enhance this kind of momentum feather would help with further studies.
In iSCAT, achieving high sensitivity while maintaining temporal resolution is a significant challenge. The assumption that efficient frames are available in iSCAT enables it to obtain shot-noise-limited detection results. However, iteration or averaging-based algorithms, commonly employed for nano-sized particle detection, exhibit high sensitivity at the expense of relatively low temporal resolution. While these methods are reliable and convenient, they underscore the persistent challenge of simultaneously achieving high sensitivity and temporal resolution. The sensitivity of interferometric scattering-based detection is fundamentally limited by shot noise, characterized as randomly distributed intensity in isolated pixels. Due to the low continuity in intensity among neighboring pixels, high-frequency components are generated beyond the iOTF. Theoretically, restricting this type of noise in the frequency domain could address these challenges. Our hypothesis involves enhancing the signal of each frame from background noise and reference light within the frequency domain. Specifically, high-frequency noise can be filtered based on the effective boundary of iOTF, while simultaneously enhancing the bright–dark rings feature by reweighting the frequency components within this boundary.

2. Materials and Methods

2.1. Samples

Gold nanoparticles with a diameter of 20 nm, which were functionalized with streptavidin (Streptavidin—20 nm Gold Conjugate, cytodiagnostics, Burlington, ON, Canada), were diluted to a concentration of 100 nM using phosphate-buffered saline. Cover glasses (CG15KH1, Thorlabs, Shanghai, China) were cleaned by immersing them in isopropanol and DI water successively in an ultrasonic cleaner 3 times. After being removed from the cleaner, the cover glasses were left to dry naturally in a vertical orientation in a box. Subsequently, these cover glasses were subjected to plasma cleaning for a duration of 10 min. Finally, a drop of Biotin-PEG-silane solution (0.1 ng/mol) was applied to the cover glasses, then these cover glasses were incubated for one hour to get ready for streptavidin functionalized Gold nanoparticle (GNP).

2.2. Setup

The experimental data of a GNP was obtained using a home-built COBRI microscopy. To briefly describe the experimental setup, an LED with a center wavelength of 520 nm was coupled into a multi-mode fiber with a core diameter of 600 µm. Then, the light from the fiber was collimated by a lens (f = 1.45 mm, NA = 0.58, OLSM0015001-T2, JCOPTIX, Nanjing Jingcui Optical Technology Co., Ltd., Nanjing, China) to illuminate the GNP sample. This illumination configuration resulted in an illumination power density of approximately 0.15 W/cm2. The detection path consisted of an objective (Plan Apo 100x, NA1.45, Nikon, Tokyo, Japan), an imaging lens (AC254-150-A, Thorlabs, Shanghai, China), and a CMOS (acA1920-155um, Basler, Arnsberg, Germany) camera. The exposure time was set at 80 µs. The sample was placed on a 3-axis piezo system (TADC-652WSR25-M6PA, TDAC-653L25-M6PA, OptoSigma Corporation, Costa Mes, CA, USA; SLC-1730, SmarAct, Oldenburg, Germany) for precise focus control.

2.3. Imaging Processing

The raw images were normalized using the average sum intensity in each frame. Then, the temporal median intensity of each pixel was computed, which was considered as the spatial background noise for background division, and this was treated as the filtered image in this work. Following the workflow depicted in Figure S1, the resulting image was the filtered image. The temporal median of the normalized images was regarded as the ground truth image. Specifically, the iOTF boundary was determined by calculating the corresponding loss function values compared with the ground truth image. The simulated images were obtained by convoluting dots representing particles in an image with the introduced iPSF. The iPSF was generated using the Python code that is available through open access [31].

3. Results and Discussion

3.1. Boundary of iOTF and Frequency Components Reweighting

A typical COBRI setup is depicted in Figure 1a, where the objective lens and imaging lens share the same focal plane. With the sample placed at the objective’s focal plane, the camera sensor is positioned at the conjugate plane of the sample. The corresponding wave vectors are illustrated in Figure 1b. The core principle lies in the interference between spherical waves and plane waves under diffraction confinement, resulting in a limited spatial spectrum. Theoretically, the noise-free image of a nanoparticle can be described by an interferometric pattern characterized by a series of dark–bright rings, as shown in Figure 1c. This interference feature has been previously modeled as the iPSF. Consequently, the corresponding iOTF is obtained from the Fourier transform of iPSF, as depicted in Figure 1d. It is evident that the boundary of iOTF is significantly smaller compared with the OTF in wide-field imaging, as the dashed white circle, and much smaller than the entire spectrum range of the raw image. This implies that the majority of the frequency components from the signal are unable to pass through this imaging modality, with those beyond the boundary originating from noise. By applying a low-pass filter in the frequency domain, such noise can be excluded in each frame, thereby enabling detection with both high sensitivity and temporal resolution.
In Figure 1d, the red dashed peak represents the baseline intensity of the interference light, the bright–dark rings are intensity different from this baseline. The peak for zero frequency is generated from this baseline intensity in the iPSF model as well as in a Gaussian-shaped model. The bright–dark rings in the iPSF serve as a momentum feather in the detection of this work. Meanwhile, the interference part with relatively high frequency experiences attenuation due to aperture effects. Aperture attenuation in optical microscopy is typically approximated by a Gaussian-shaped model, whose cross-sectional profile is shown as a white solid line in Figure 1d. This profile can be utilized to model scattering light in iSCAT, contributing to the interference pattern. The final intensity distribution of nanoparticles comprises contributions from both reference and interference light. The persistent presence of reference light diminishes the contrast of the interference component; the contrast serves as a critical criterion for nanoparticle detection. Consequently, the contrast is weakened due to aperture attenuation, characterized by the majority of reference light remaining intact while interference features are attenuated. In conclusion, enhancing the contrast necessitates weakening the reference light and amplifying the interference features. This approach holds the potential to improve the sensitivity and temporal resolution in interferometric scattering-based detection systems.
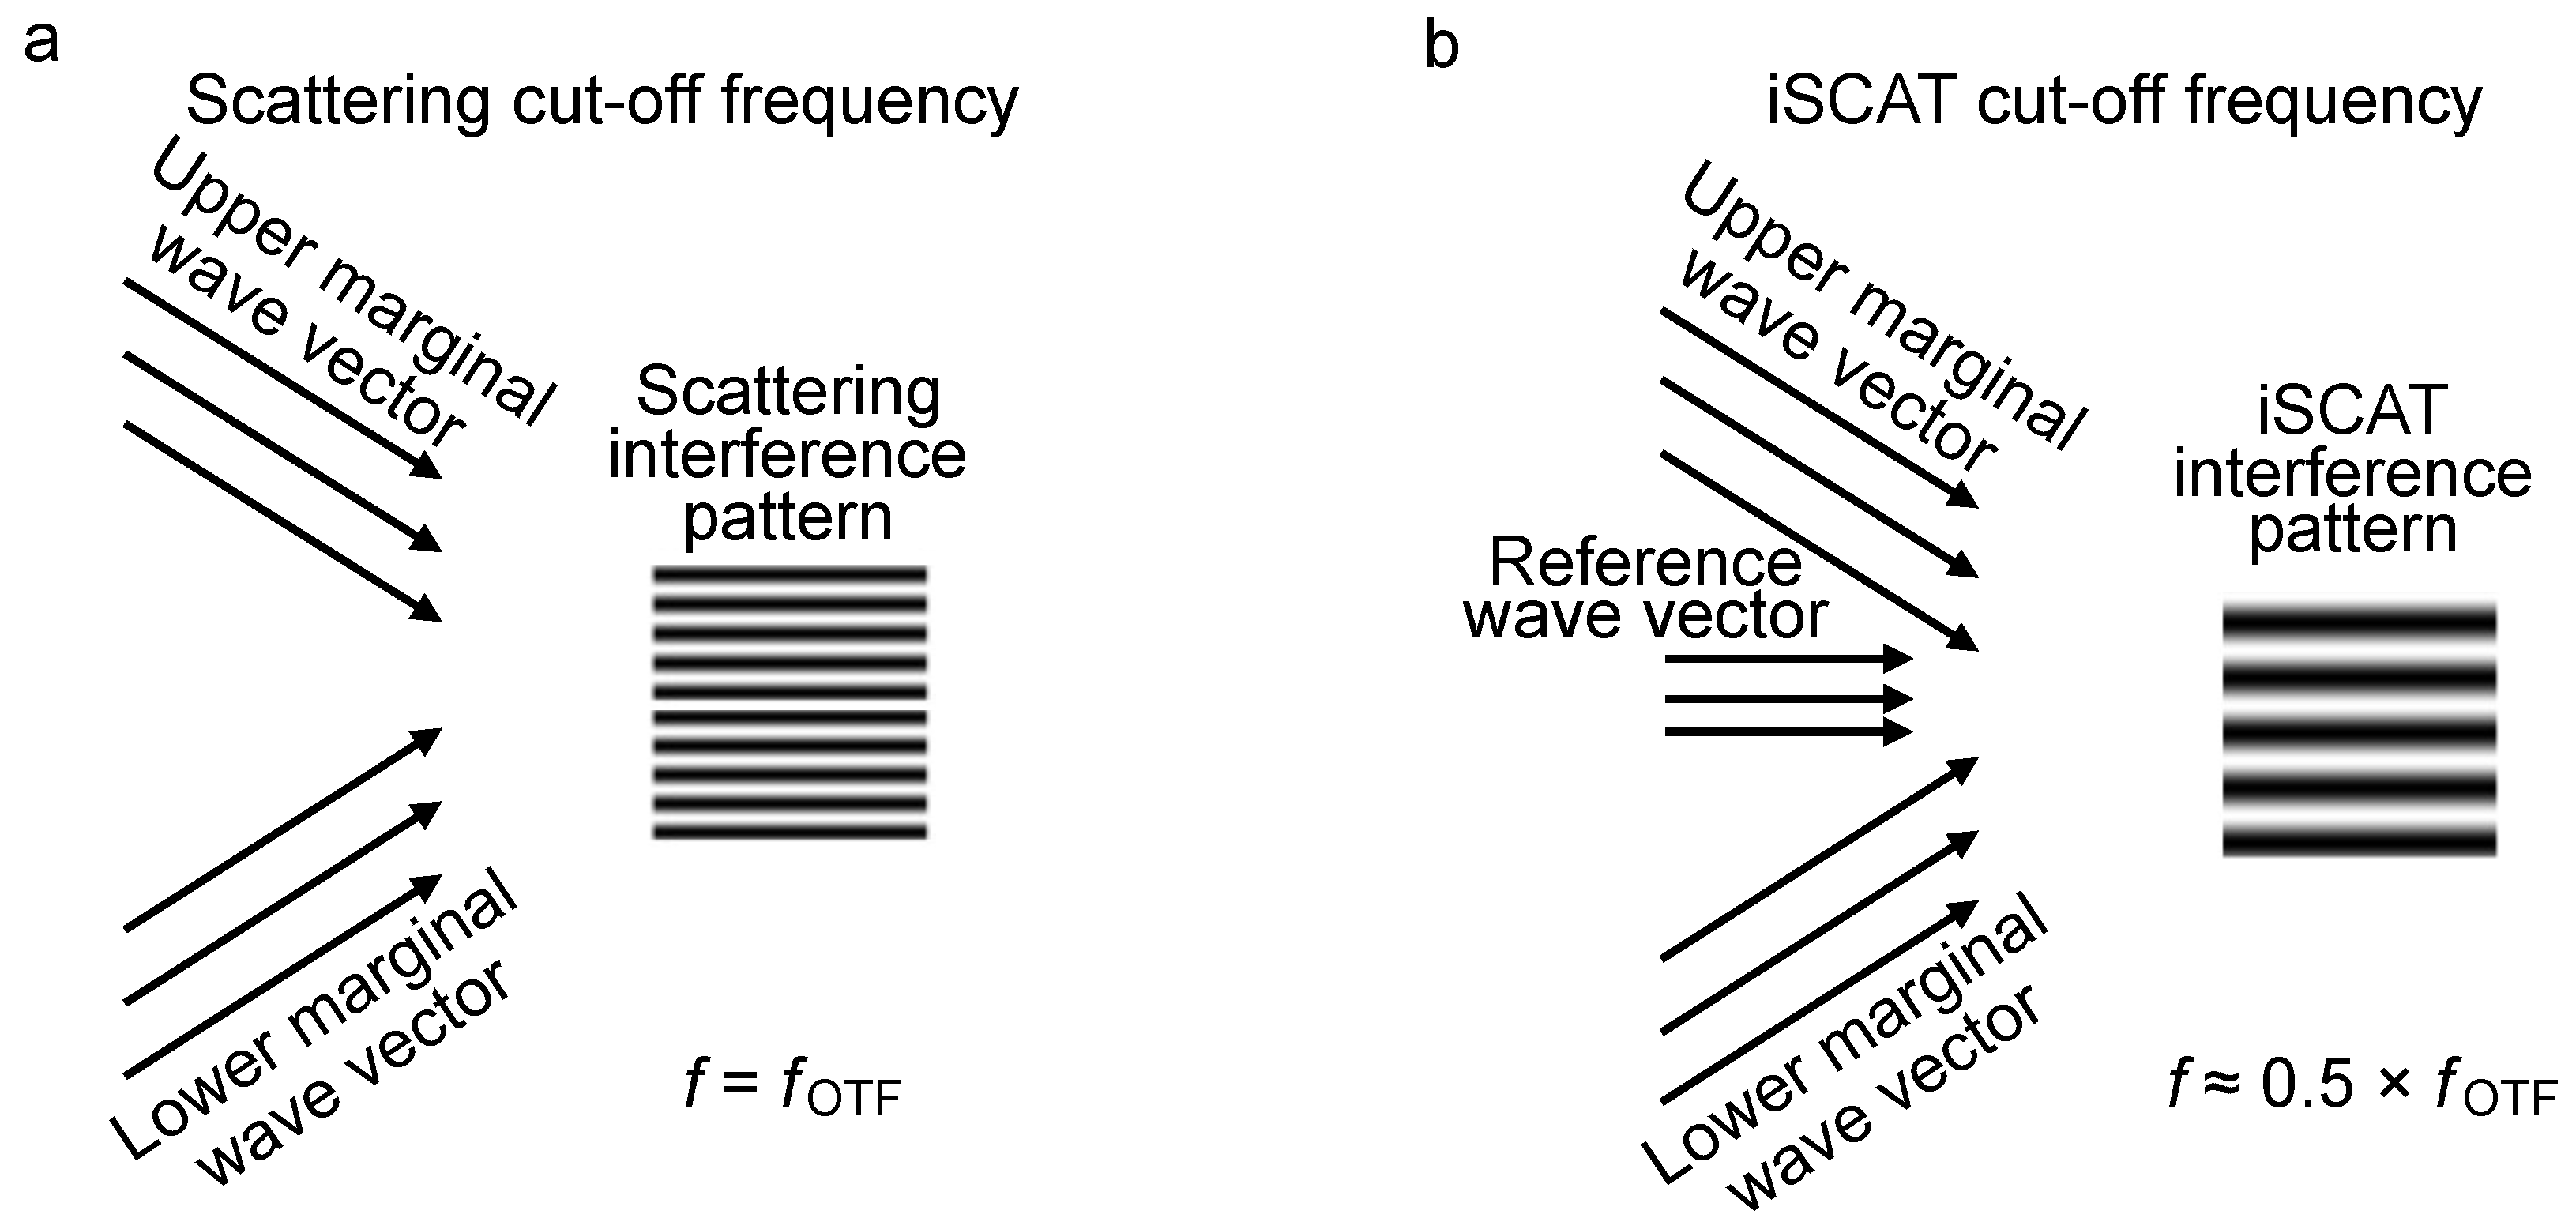
The cut-off frequency of iOTF is about half of that for OTF, as shown in Figure 1. That phenomenon is demonstrated in Figure 2 with an interference theorem. In a rotationally symmetrical optical imaging system, the three-dimensional wave vector interference phenomenon can be explained with a two-dimensional wave vector interference model. The scattering cut-off frequency equals to the OTF boundary, as shown in Figure 2a. The interferometric cut-off frequency is about half of the OTF boundary, as illustrated in Figure 2b.
For the pure scattering signal, the cut-off frequency is determined by the interference of marginal wave vectors with the maximum angle, resulting in the scattering interference pattern approaching the diffraction limit. However, under iSCAT, the pure scattering signal is too weak under the detection sensitivity, and it is thousands of times weaker than the interference signal. Consequently, the pure scattering light is usually unconsidered, and the detected signal consists of the interference light and the reference light. In the classic iSCAT physical model, the reference wave vector is parallel to the optical axis, contributing to the zero-frequency component. The cut-off frequency is generated from the interference light, the maximum frequency is determined by the interference angle of the marginal wave vectors and the reference wave vector, the interference angle is half of the angle in Figure 2a. Considering the relative oblique interference to the imaging plane, the frequency components under iSCAT is no larger than half the cut-off frequency for OTF.
This prior knowledge has long been neglected in this research field and answers the interference feather, as we defined it as the momentum feather in iSCAT. A detection sensitivity increasing approach has been established in this work.

Momentum-Enhanced Particle Detection

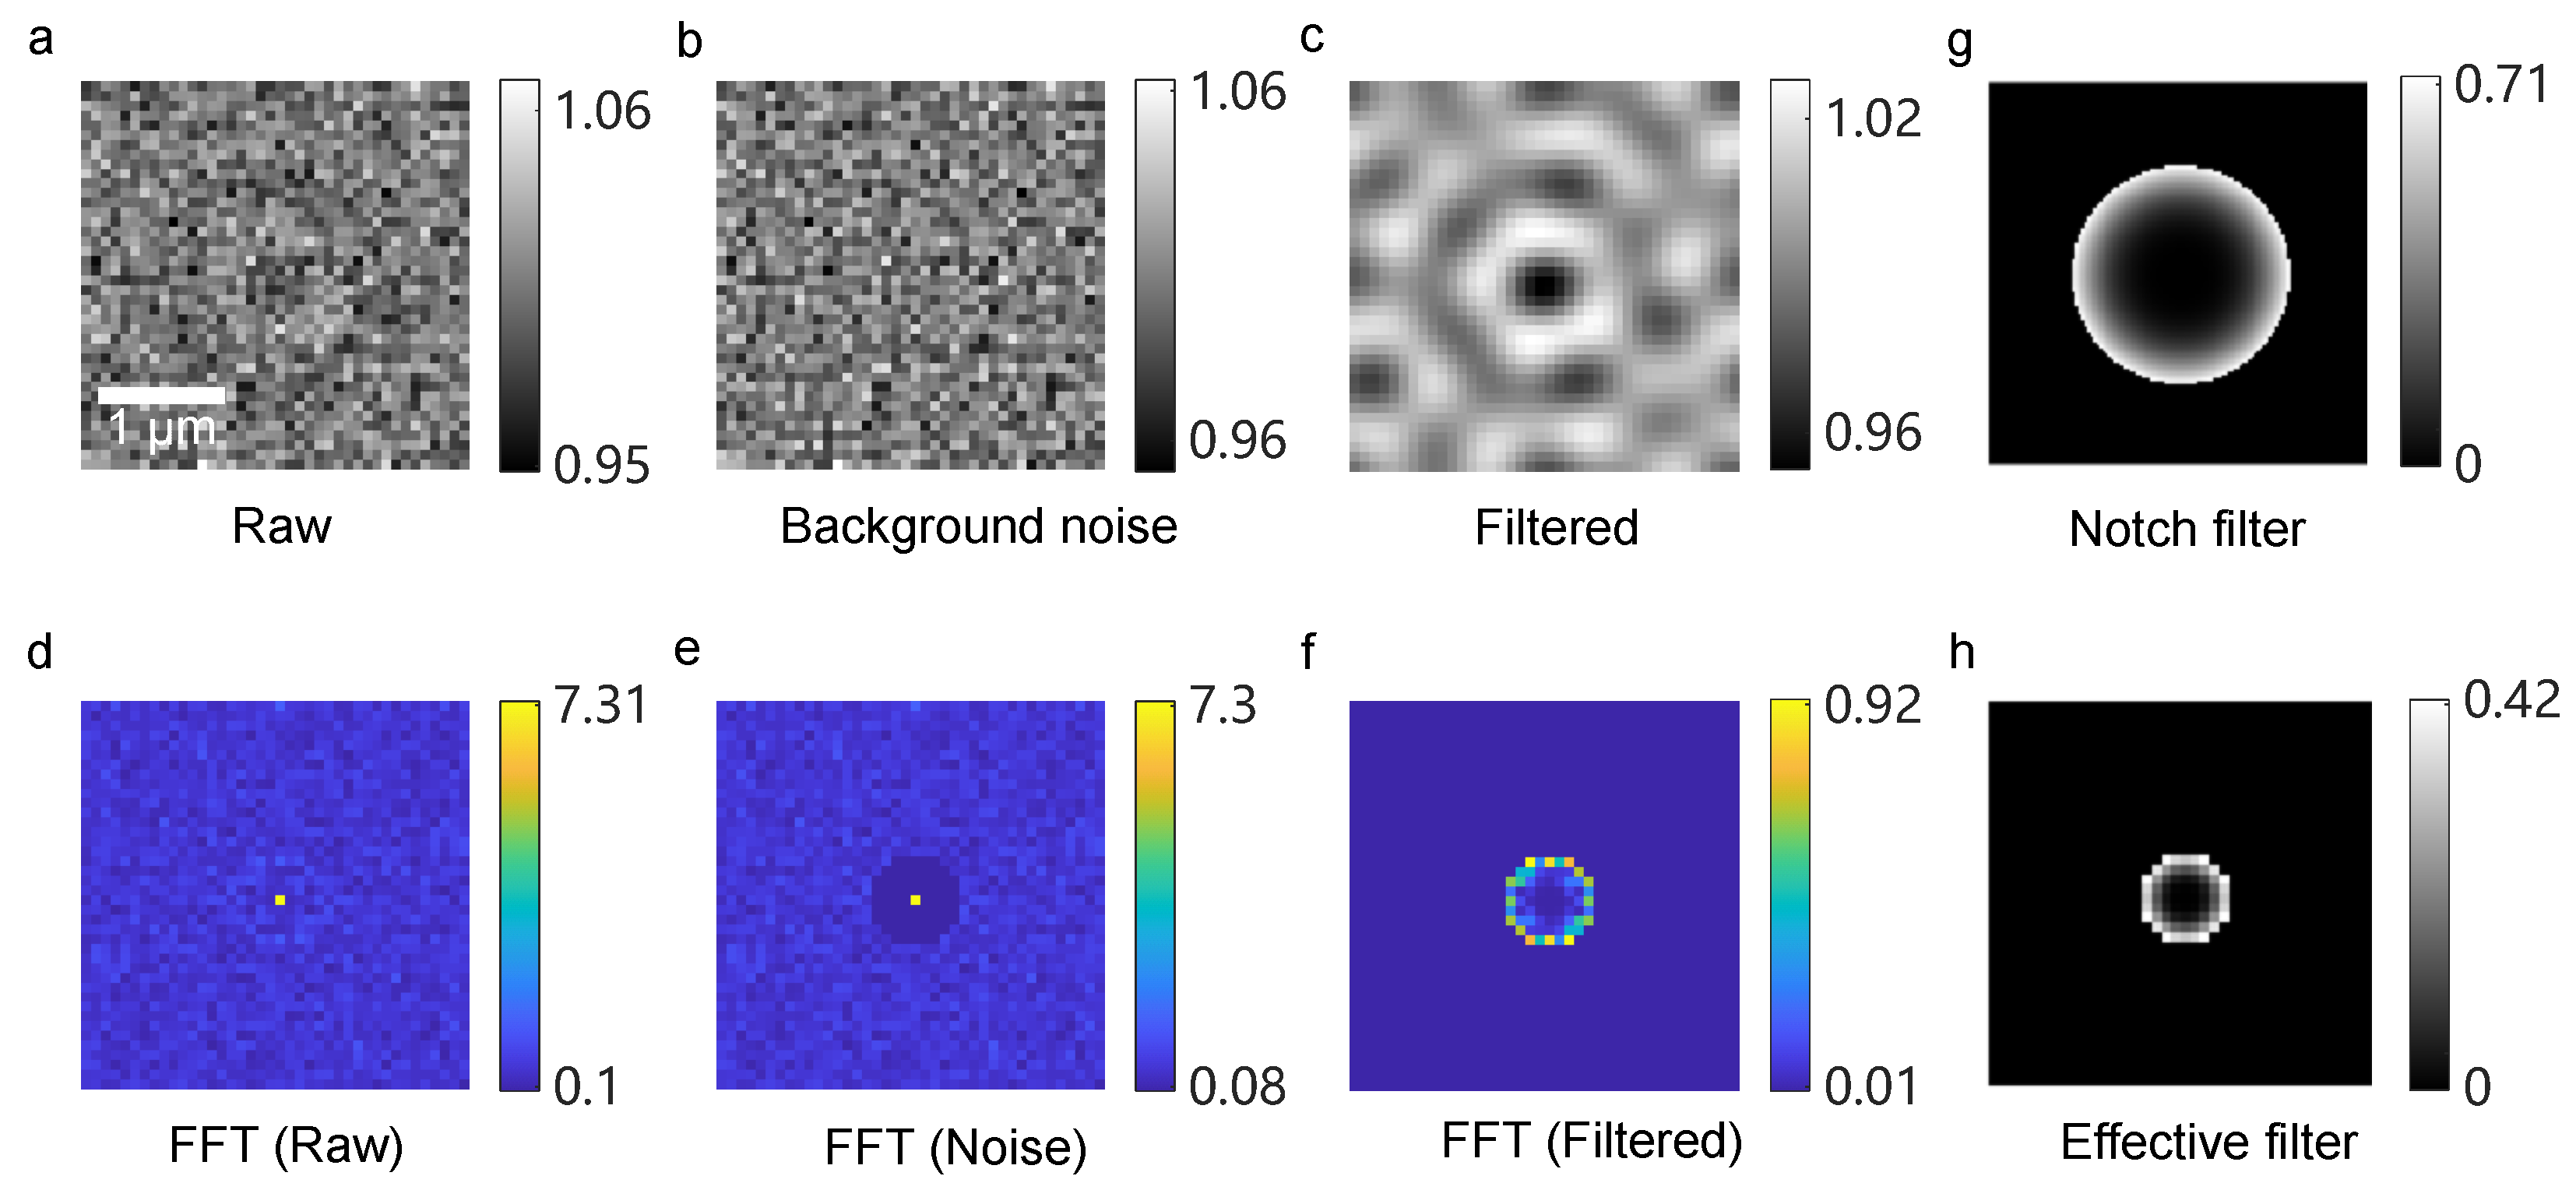
To evaluate the sensitivity of our background extraction algorithm, we conducted a filtering demonstration using an experimental image containing a noise-affected particle, as in Figure 3. The results demonstrate that iOTF-based background extraction can effectively detect particles obscured by noise. Frequency components beyond the cut-off frequency exist in the raw image; these components contribute to noise and can be easily filtered. In the former literature of iSCAT, noise suppression is typically performed in the spatial domain rather than in the frequency domain. While these approaches have been shown to be effective in previous studies, they generally fail to address shot noise, particularly high-frequency noise components beyond the iOTF. This limitation highlights the potential for further improvements in sensitivity enhancement.
As shown in Figure 3a, a particle with a contrast of approximately 0.147 in the noise-dominated image is barely detectable. By eliminating this type of noise in the frequency domain, as illustrated in Figure 3b, we obtained a feather-enhanced particle, as demonstrated in Figure 3c. The corresponding frequency components are presented in Figure 3d–f. Specifically, the spatial spectrum image shown in Figure 3d was obtained by applying a fast Fourier transform (FFT) to Figure 3a. The background noise spectrum in Figure 3e was derived by subtracting the particle signal from the total spectrum, while Figure 3f displays the spectrum within the iOTF boundary. Notably, the bright–dark ring feature characteristic of interferometric-based microscopy is significantly enhanced by our approach.
It should be emphasized that the central spot observed in Figure 3d,e corresponds to a constant intensity component in the spatial domain (Figure 3a,b), primarily arising from the reference light. As mentioned before, the contrast of the nanoparticle demonstrates an inverse relationship with the intensity of the reference light. To address this, we reweight the frequency components to compensate for aperture attenuation, thereby suppressing the reference light, as shown in Figure 3f and enhancing the bright–dark ring feature, as shown in Figure 3c. The reweighting filter is designed based on a Gaussian-shaped OTF aperture attenuation model, where higher-frequency components are amplified while lower-frequency components are attenuated, resulting in a balanced frequency distribution. A notch filter (Figure 3g) is introduced to reweight the frequency components, and a low-pass filter (Figure 3h) determined by the iOTF cut-off frequency is applied to extract noise as explained in Figure S2. The effective filter is the multiple result of the reweighting notch filter and the low-pass filter, as shown in Figure S3. The intensities in pixels of an image will not be increased but decrease with the effective filter applied. To compensate this kind of intensity decrease, a compensation parameter was introduced resulting a compensated image as in Figure S3f. The optimal compensation parameter was determined by reaching the highest structure similarity index measure (SSIM) score with the ground truth, as we noted in the source code.
Different from conventional spatial-domain background removal techniques, we propose an innovative strategy for extracting the background from noise-dominated images by leveraging the characteristics of the iOTF. Specifically, our method involves applying a tailored low-pass filter and a notch filter [37] in the frequency domain to exclude background noise beyond the effective iOTF boundary. Unlike averaging-based approaches, which often require multiple frames to suppress noise, our method enables high-sensitivity detection in individual frames, thereby improving temporal resolution and adaptability for dynamic imaging applications.
In previous studies, signals were typically approximated using a Gaussian function characterized by a single peak or valley in intensity. However, our research focuses on interferometric patterns distinguished by alternating dark and bright rings of the iPSF. Consequently, techniques that can successfully differentiate these iPSF-structured feathers are desperately needed. Our approach leverages the effective boundary of the iOTF, where we reweight frequency components to enhance signal features within the frequency domain. This process results in an iPSF-shaped pattern, thereby preserving and enhancing interferometric features while simultaneously removing noise.

3.2. Signal Feature Enhancing Verification in Simulation

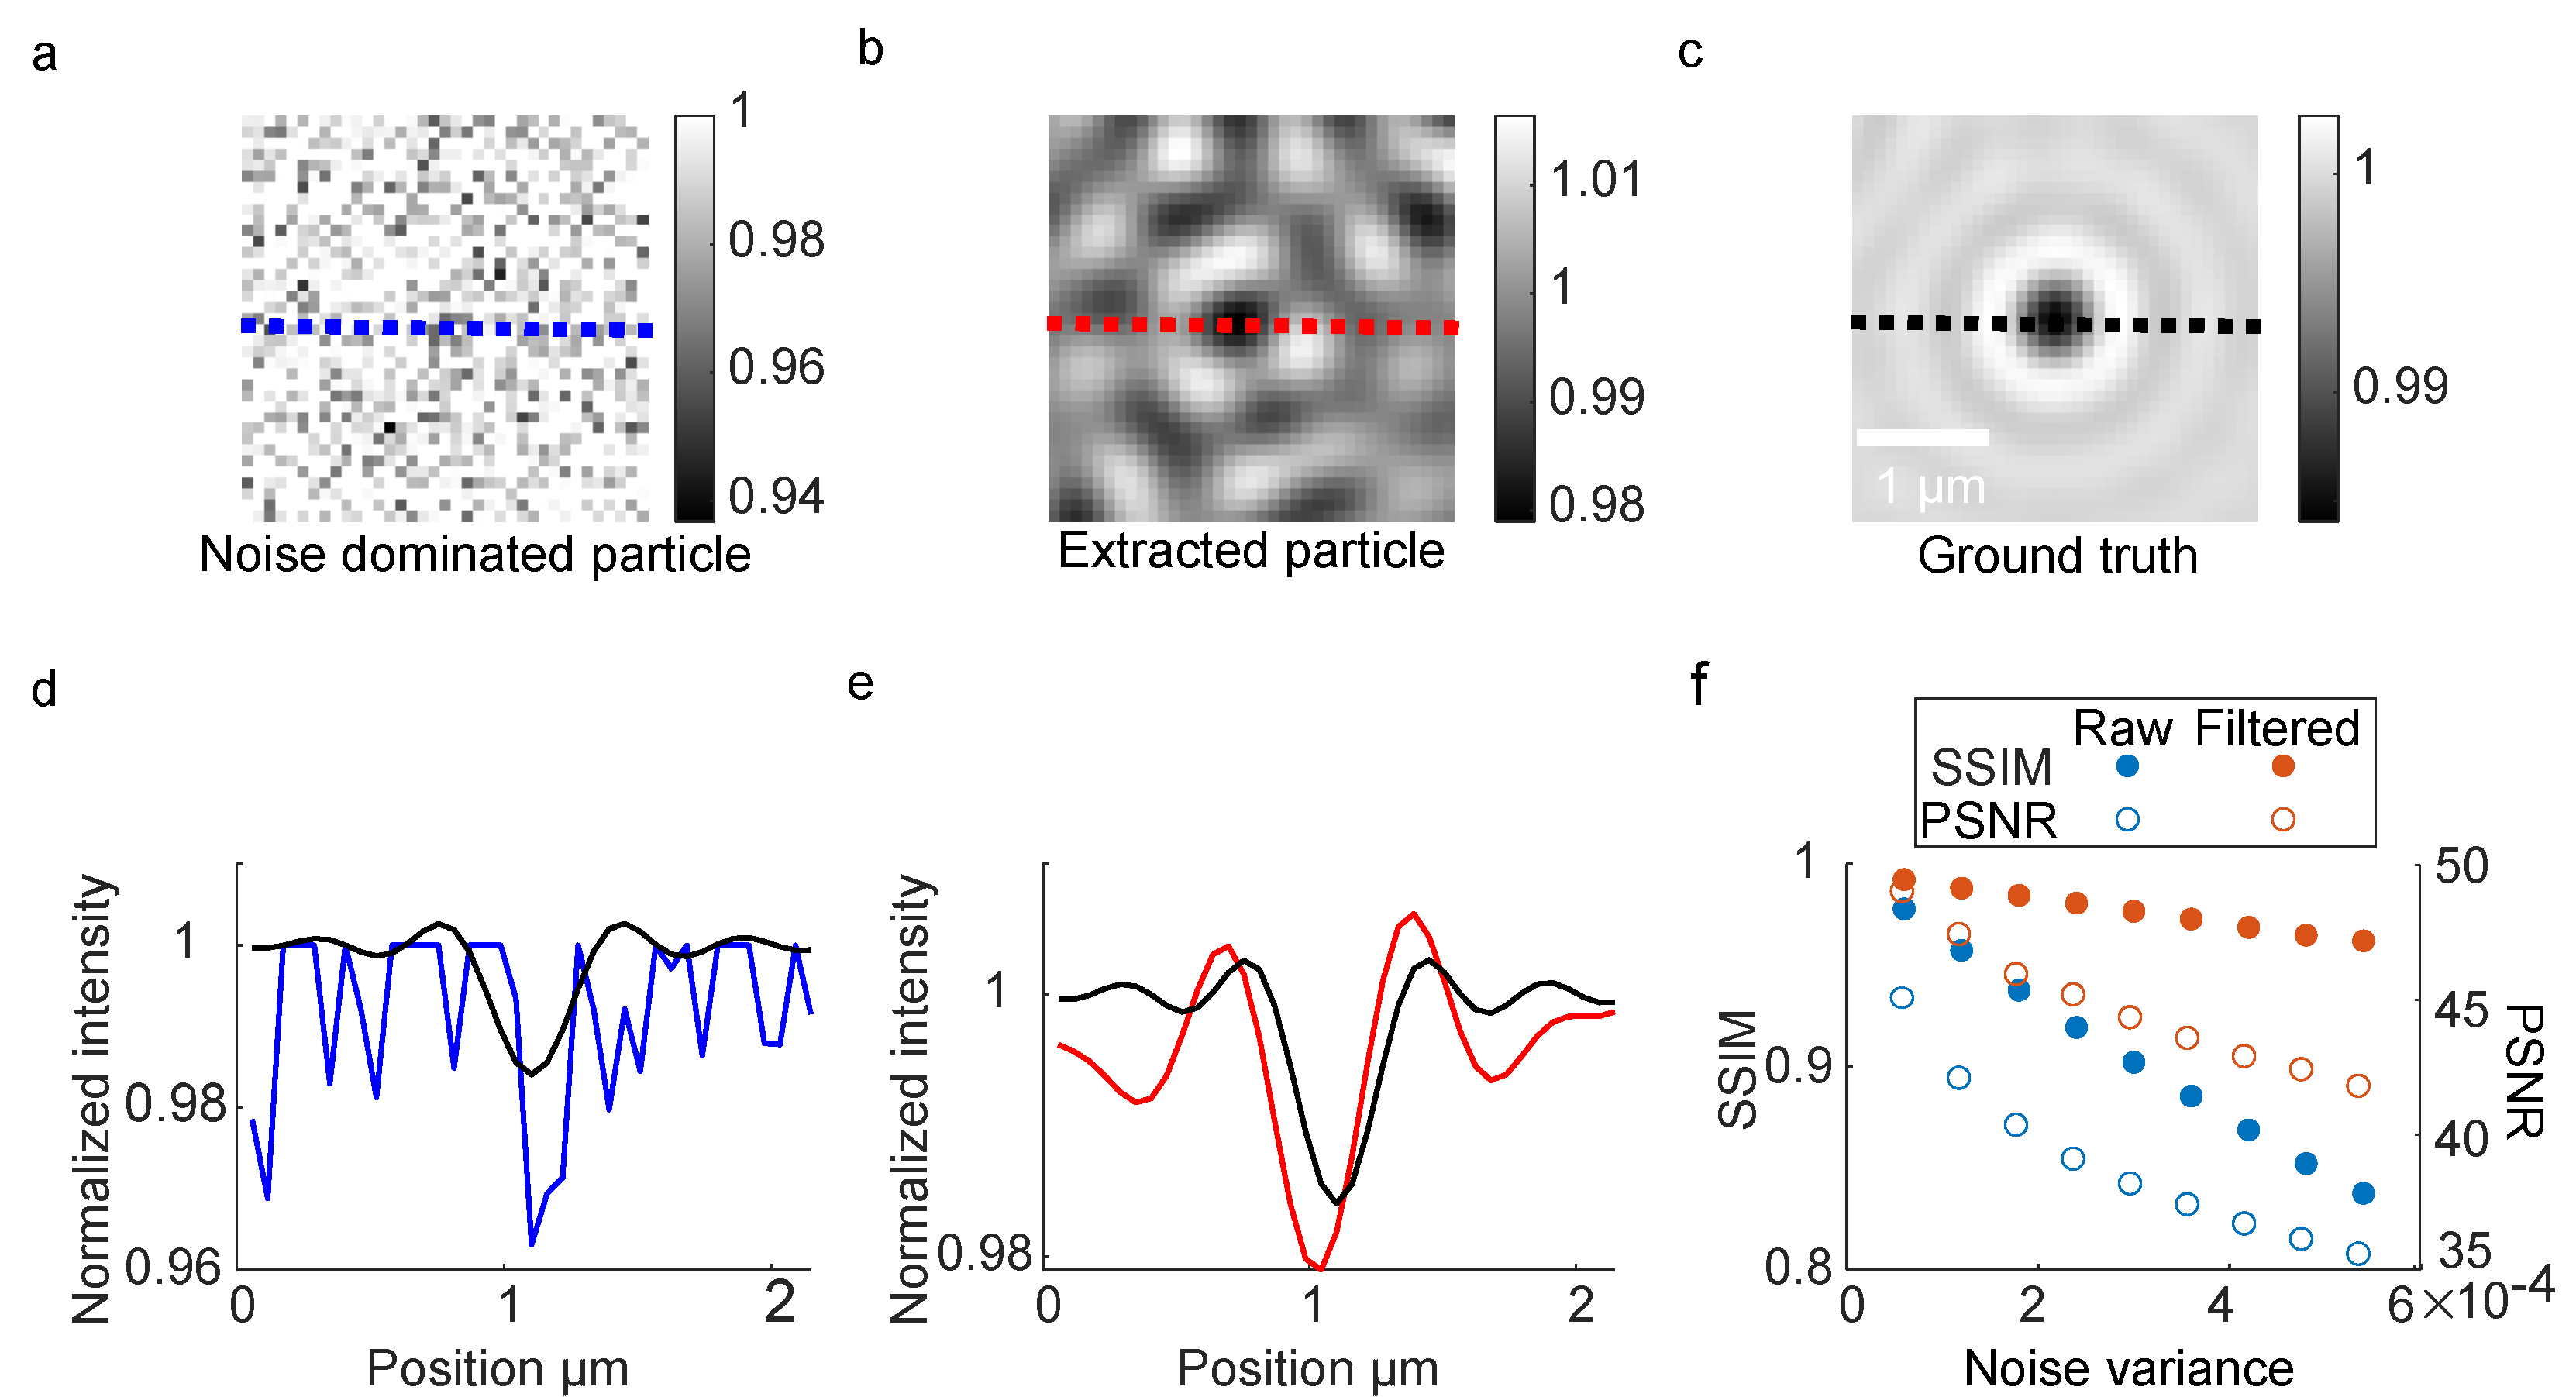
To validate our method’s consistency with the theoretical iPSF model, we conducted evaluations using simulated data of a noise-dominated particle frame. Comparisons between the spot image (Figure 4a) and the processed dark–bright rings structure (Figure 4b) demonstrated greater similarity of the iPSF model in the ground truth in Figure 4c. Further verification involved analyzing cross-sectional intensity profiles, as shown in Figure 4d,e.
The solid dots in Figure 4f compare the simulated structure similarity index measure (SSIM) values between the noise-dominated image (blue solid dots) and the filtered image with our approach (red solid dots). Both SSIM values decrease as the noise variance increases, while the SSIM values of the noise-dominated images (blue solid dots) decrease more sharply than those of the filtered image with our approach (red solid dots). The hollow dots in Figure 4f compare the simulated peak signal-to-noise (PSNR) values between the noise-dominated image (blue hollow dots) and the filtered image with our approach (red hollow dots). Both PSNR values decrease as the noise variance increases, while the PSNR values of the noise-dominated images (blue hollow dots) decrease more sharply than those of the filtered image with our approach (red hollow dots). These analyses revealed that our method produces intensity profiles more closely aligned with the theoretical iPSF model, proving effective noise removal and preservation of interferometric features.
To assess temporal resolution advantages, we evaluated the performance of signal averaging from consecutive frames. Simulated particle images were generated by convolutions of localized signals with the iPSF. Background noise level was represented by the noise variance σ , which served as a detectability criterion; particles below this threshold were considered undetectable.
Our results reveal that an image with superior resistance to noise compared with the raw image can be obtained with our method. The enhanced sensitivity of our method in preserving interferometric features and achieving higher resistance to noise underscores its effectiveness in dynamic imaging applications. In conclusion, our methodology successfully enhances signal preservation while effectively removing noise. This results in a significant improvement in sensitivity and resistance to noise, making it an optimal choice for high-speed interferometric imaging applications.
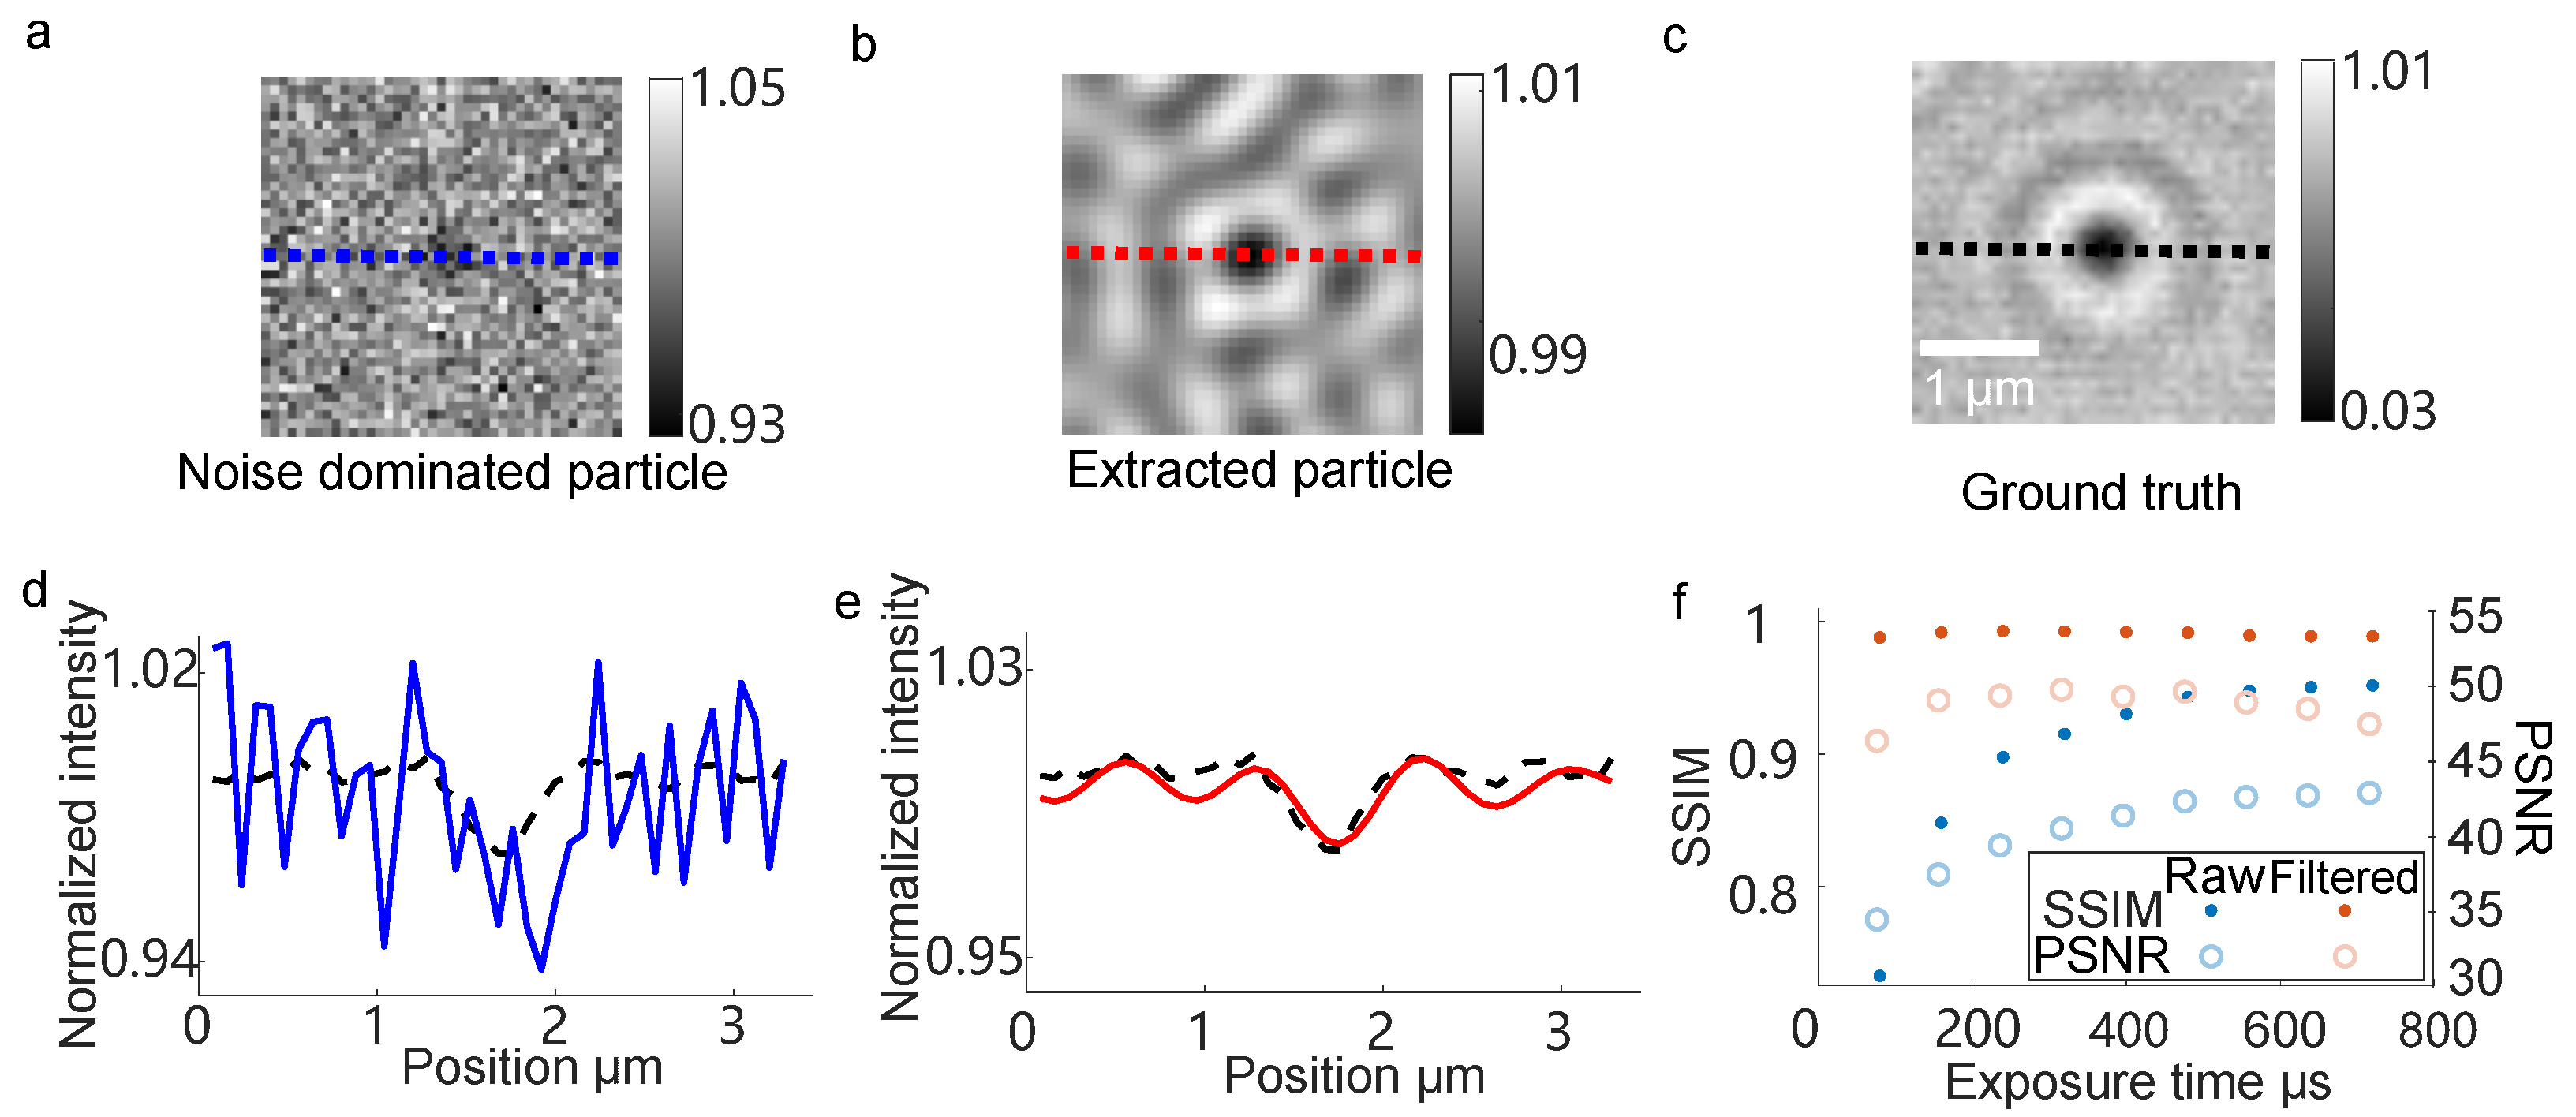
To evaluate the consistency of our background extraction algorithm with experimental ground truth data, we utilized the experimental image depicted in Figure 5. The particle profile averaged across 100 frames served as our reference (ground truth), establishing its cross-sectional intensity as the baseline.

3.3. Signal Feature Enhancing Verification in Experiment

As demonstrated in Figure 5a, a particle can be hardly detected under a noise-dominated background, resulting in a distorted intensity profile illustrated in Figure 5d. In contrast, Figure 5b,e showcase the effectiveness of our filtering process, significantly reducing deviation from the baseline. The experimental ground truth image was approximated with the averaged image of a fixed particle in 100 noise-dominated frames. The filtered image was then obtained under our approach. These results highlight the high consistency of our method in accurately detecting particles.
The solid dots in Figure 5f compare the experimental SSIM values between the noise-dominated image (blue solid dots) and the filtered image with our approach (red solid dots). Both SSIM values decrease as the noise variance increases, while the SSIM values of the noise-dominated images (blue solid dots) decrease more sharply than those of the filtered image with our approach (red solid dots). The hollow dots in Figure 5f compare the experimental peak signal-to-noise (PSNR) values between the noise-dominated image (blue hollow dots) and the filtered image with our approach (red hollow dots). Both PSNR values decrease as the noise variance increases, while the PSNR values of the noise-dominated images (blue hollow dots) decrease more sharply than those of the filtered image with our approach (red hollow dots).
Furthermore, to assess temporal resolution benefits, we conducted experiments analogous to those shown in Figure 4, comparing our approach with conventional methods. Our method achieved a temporal resolution superior to 100 μ s, outperforming the raw image (at approximately 240 μ s). This experimental validation aligns with our earlier simulation results, underscoring the robustness and reliability of our approach in dynamic imaging applications.

3.4. Detection Comparison of Particles with Different Contrasts

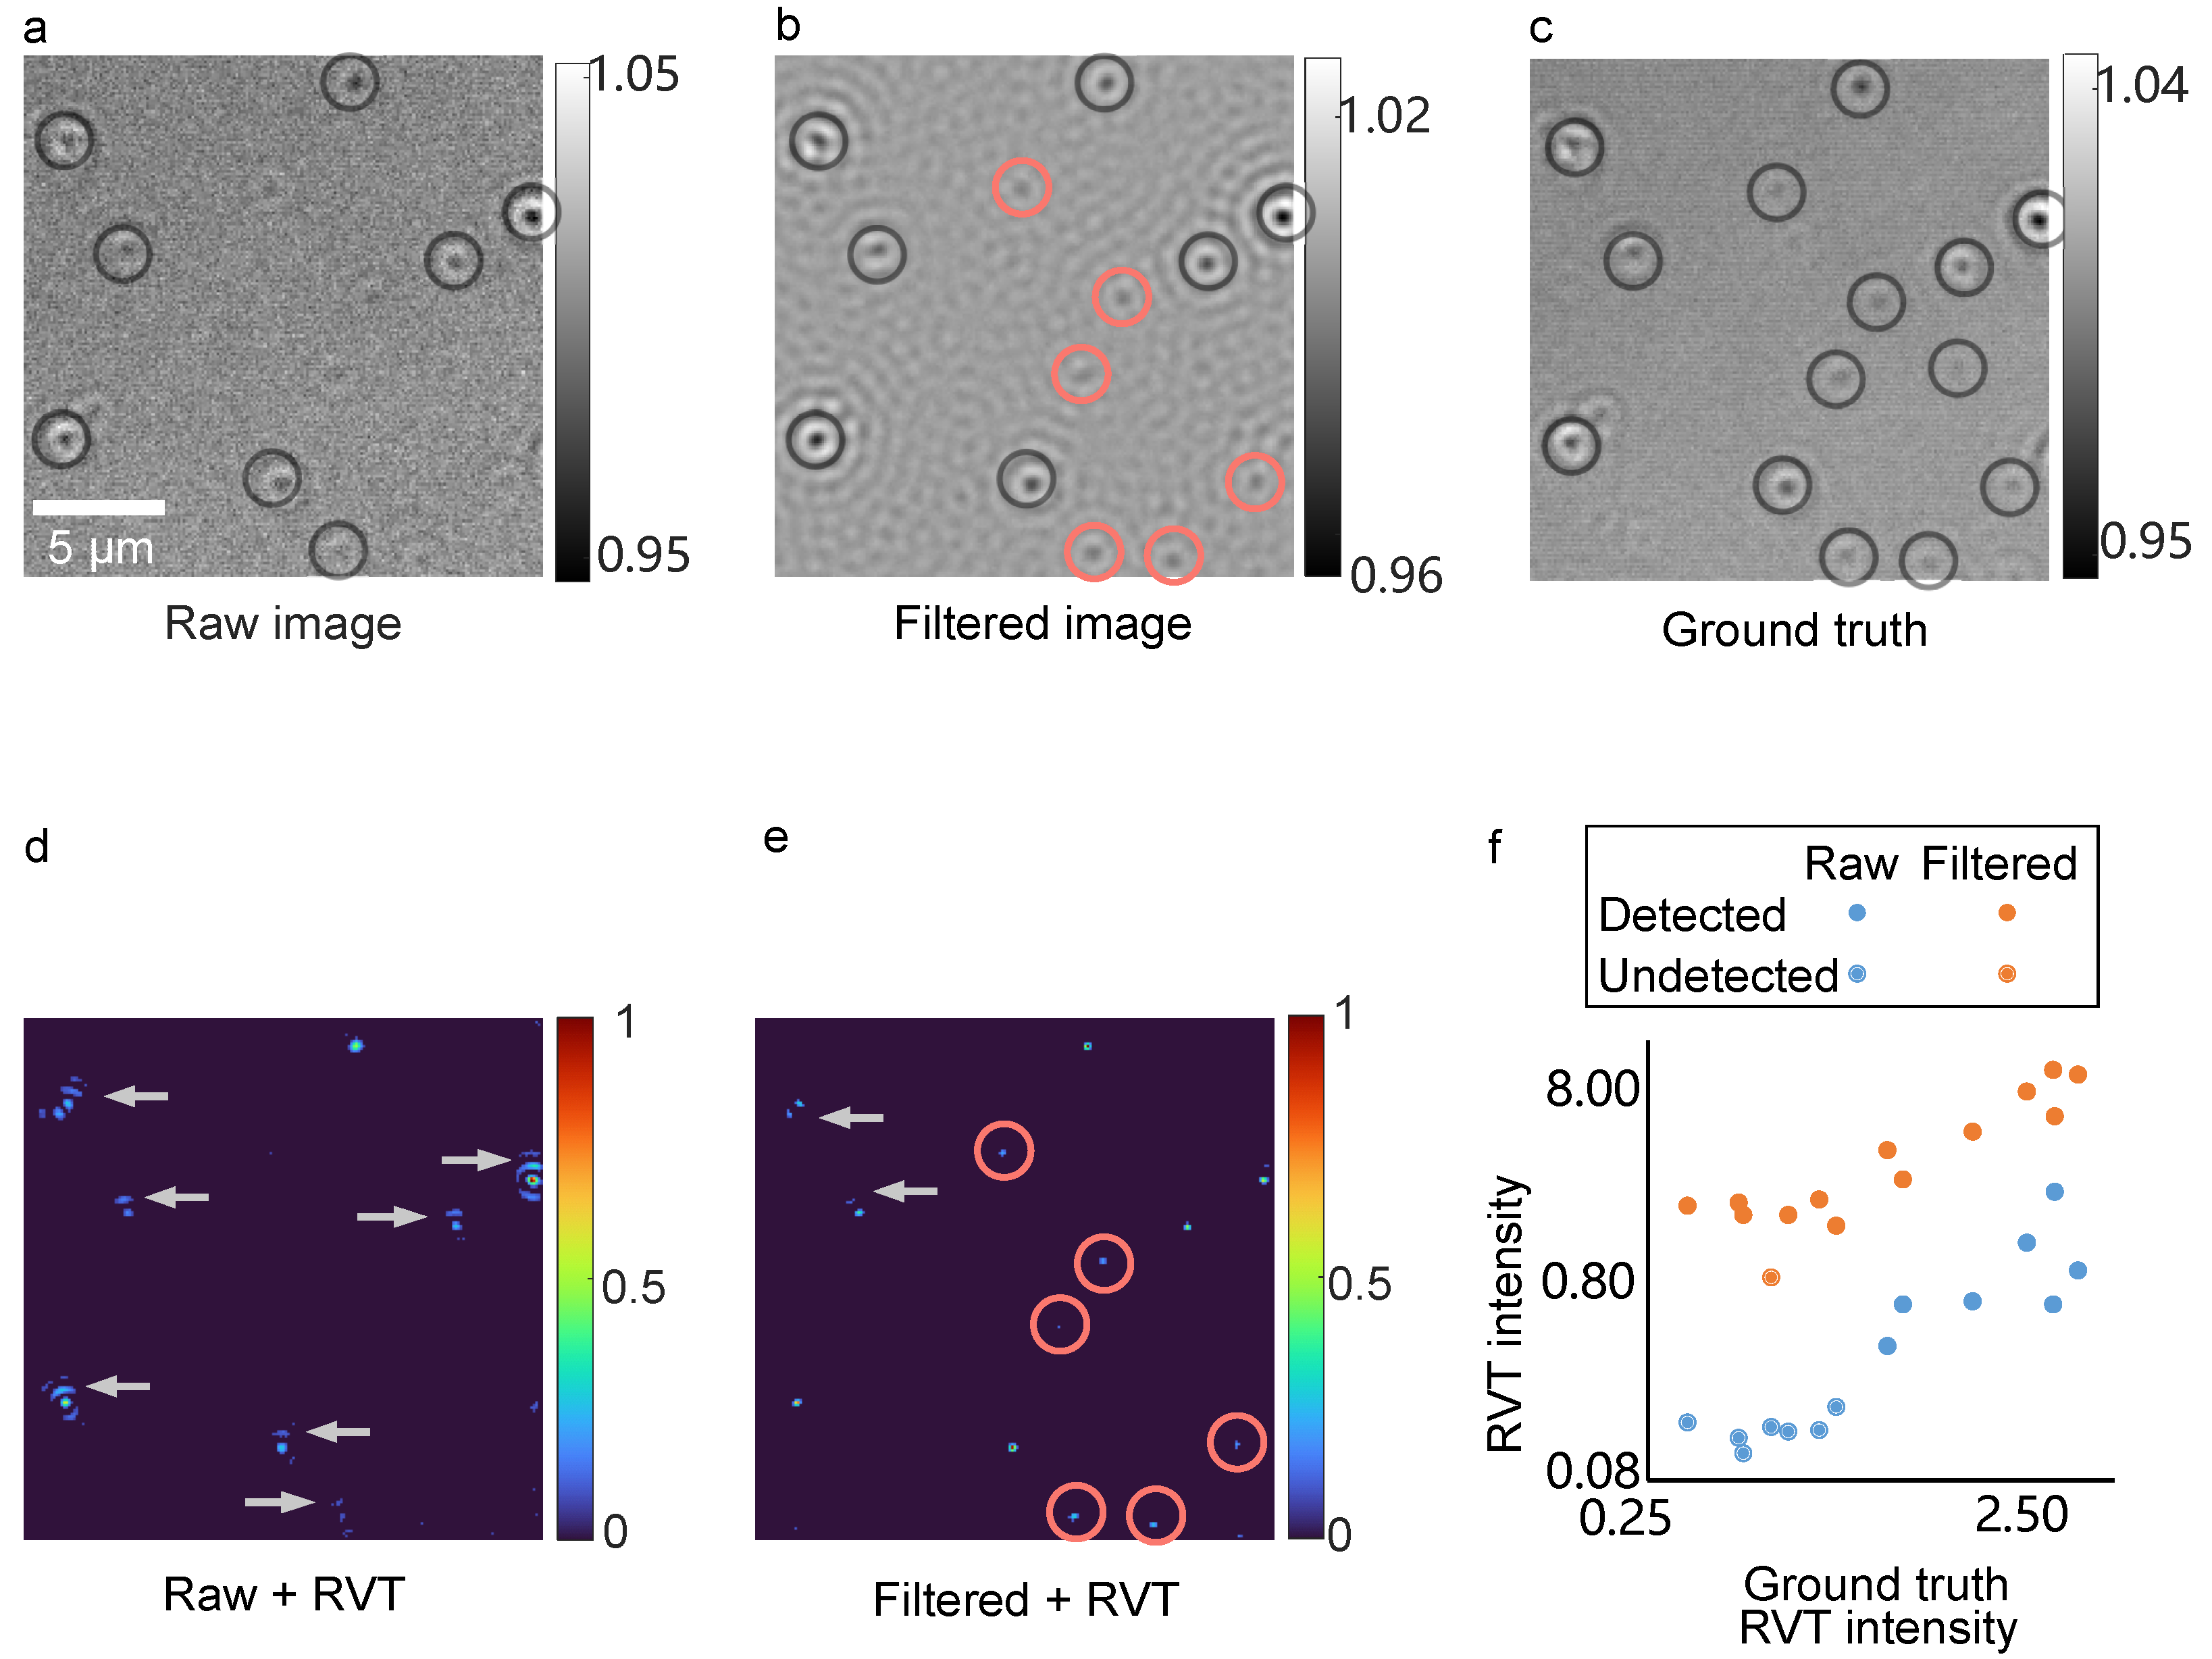
To examine the sensitivity of our approach, a detection comparison between a noise-dominated image and the filtered image obtained using our method is conducted, as shown in Figure 6. Functionalized streptavidin GNPs were selected as the fixed sample in our experiment. There were still some unfixed GNPs floating near the focus plane in the solution, which can be detected at a lower contrast. Here is a field of view that contains particles with contrast ranges from 7.00 × 10⁻⁵ to 6.02 × 10⁻² in Figure 6. The exposure time was 80 μ s, which is rapid enough for nanoparticle tracking, including proteins. The σ of Figure 5a is 0.0193, and several particles with contrast below this value were not detected. We note that RVT is an approach based on the symmetric feature of the particle’s image. When combined with threshold-assisted RVT, particles with contrast above the noise level can be detected, with residual dots in the image filtered by the threshold.
It is found that particles with contrast lower than 0.0133 are under noise and remain undetected in the noise-dominated image, as shown in Figure 6a. Meanwhile, the bright–dark rings feature has been enhanced, as shown in Figure 6b, resulting in the successful detection of those previously undetected particles, which are labeled in red circles in Figure 6b. The ground truth image in Figure 6c was obtained by averaging 100 static frames. The corresponding σ -restrained RVT images of Figure 5a and Figure 6b are as shown in Figure 6d,e. There exist side lobes (marked with gray arrows) around particles in the RVT result of the filtered image in Figure 6d, which were extinguished except for 2 particles of 13 in Figure 6e. Side lobes might introduce errors in the particle’s tracking and localization. Statistically, it shows an improved peak intensity after RVT, as shown in Figure 6d compared with that in Figure 6c. As a result, our approach shows high detection sensitivity to noise-dominated particles even in a single frame with an exposure time of less than 100 μ s.
The orange dots in Figure 6f are particles’ RVT peak intensities, the horizontal coordinates represent the RVT peak intensity in the averaged image and the vertical coordinates are that in the image filtered with our approach. The corresponding RVT peak intensities in both the averaged image and the raw image are presented with blue dots in Figure 6f. The blue dots are particles’ RVT peak intensities, the horizontal coordinates represent the RVT peak intensity in the averaged image, and the vertical coordinates are that in the image filtered with our approach. The intensities have not been increased. There are 8 of the 14 particles undetected in the raw image; the corresponding dots are labeled by edge disks and light blue color. The intensities have been increased by about threefold, which implies that the detection sensitivity has been increased. There also exist drawbacks for our approach: 1 of the 14 particles detected in the averaged image was not detected in the filtered image; the corresponding dots are labeled by an edge disk and light orange color. To conclude, the time resolution has been increased tens of times (as shown in Figure S3), and the sensitivity has been improved with our approach applied. While the cost is that some weak particles (compared with those in the averaged image) might be undetected, the combination of the averaging method and our approach can handle this drawback.
To deal with the noise-limited images, averaging strategies have been introduced, but at the cost of reducing the temporal resolution. Our new approach filters the noise beyond the iOTF boundary in each frame, enhancing the signal from high-frequency background noise without imposing a limit on temporal resolution. It should be noted that our method can serve as a predetection approach for cursory localization; the linear contrast can be approximated with a two-dimensional Gaussian fitting, as in previous literature. Due to the nature of interference, the iPSF pattern is larger than that of a Gaussian-shaped PSF, resulting in a larger overlapping area in the spatial domain. So, this is a trade-off to enhance the momentum feature with a compromise to miss some weak particles overlapped by nearby strong signals. In situations of detecting dynamic moving particles, this kind of overlapping would be avoided by isolating and distributing in the spatial-temporal domain, as in single-molecule localization microscopy.

Supplementary Materials

The following supporting information can be downloaded at https://www.mdpi.com/article/10.3390/photonics12100945/s1, Figure S1: Workflow and intermediate results of the background extraction. Figure S2: Workflow of the momentum enhancing approach and noise extraction. Figure S3: Effective filter generated from reweighting notch filter and iOTF cut-off frequency. Figure S4: Noise STD comparison between the filtered and averaged images. Figure S5: Momentum enhancing comparison among BM3D, averaging and our method. References [21,37,38,39] are cited in the Supplementary File.

Author Contributions

Conceptualization, X.Z. and Y.Y.; methodology, X.Z. and Y.Y.; software, X.Z.; validation, X.Z.; formal analysis, X.Z.; investigation, X.Z.; resources, X.Z.; data curation, X.Z.; writing—original draft preparation, X.Z.; writing—review and editing, X.Z.; visualization, X.Z.; supervision, X.Z.; project administration, X.Z.; funding acquisition, X.Z. All authors have read and agreed to the published version of the manuscript.

Funding

This research received no external funding.

Data Availability Statement

The workflow and comparison among denoising approaches are in the Supporting Information File. The data and Matlab scripts for figures in the manuscript are available at https://github.com/superres/iSCAT (accessed on 15 August 2025).

Acknowledgments

The authors thank the Center for Computational Science and Engineering at Southern University of Science and Technology.

Conflicts of Interest

The authors declare no conflicts of interest.

Abbreviations

The following abbreviations are used in this manuscript:
SFSpatial-frequency domian deconvolution
iSCATInterferometric Scattering Microscopy
SNRSignal-to-noise ratios
PSFPoint spread function
iPSFInterferometric point spread function
OTFOptical transfer function
iOTFInterferometric optical transfer function
RVTRadial variance transfer
COBRICoherent brightfield microscopy
GNPsGold nanoparticle
LEDLight-Emitting Diode
CLcollimation lens
OBJobjective
CMOSComplementary Metal Oxide Semiconductor camera
NANumerical aperture
FFTfast Fourier transform

References

  1. Asor, R.; Kukura, P. Characterising biomolecular interactions and dynamics with mass photometry. Curr. Opin. Chem. Biol. 2022, 68, 102132. [Google Scholar] [CrossRef]
  2. Spindler, S.; Ehrig, J.; König, K.; Nowak, T.; Piliarik, M.; Stein, H.E.; Taylor, R.W.; Garanger, E.; Lecommandoux, S.; Alves, I.D.; et al. Visualization of lipids and proteins at high spatial and temporal resolution via interferometric scattering (iSCAT) microscopy. J. Phys. Appl. Phys. 2016, 49, 274002. [Google Scholar] [CrossRef]
  3. Chai, Y.J.; Cheng, C.Y.; Liao, Y.H.; Lin, C.H.; Hsieh, C.L. Heterogeneous nanoscopic lipid diffusion in the live cell membrane and its dependency on cholesterol. Biophys. J. 2022, 121, 3146–3161. [Google Scholar] [CrossRef] [PubMed]
  4. Ortega Arroyo, J.; Andrecka, J.; Spillane, K.M.; Billington, N.; Takagi, Y.; Sellers, J.R.; Kukura, P. Label-Free, All-Optical Detection, Imaging, and Tracking of a Single Protein. Nano Lett. 2014, 14, 2065–2070. [Google Scholar] [CrossRef] [PubMed]
  5. Ma, G.; Wan, Z.; Yang, Y.; Zhang, P.; Wang, S.; Tao, N. Optical imaging of single-protein size, charge, mobility, and binding. Nat. Commun. 2020, 11, 4768. [Google Scholar] [CrossRef]
  6. Zhang, P.; Ma, G.; Dong, W.; Wan, Z.; Wang, S.; Tao, N. Plasmonic scattering imaging of single proteins and binding kinetics. Nat. Methods 2020, 17, 1010–1017. [Google Scholar] [CrossRef]
  7. Liu, Y.; Sundah, N.R.; Ho, N.R.Y.; Shen, W.X.; Xu, Y.; Natalia, A.; Yu, Z.; Seet, J.E.; Chan, C.W.; Loh, T.P.; et al. Bidirectional linkage of DNA barcodes for the multiplexed mapping of higher-order protein interactions in cells. Nat. Biomed. Eng. 2024, 8, 909–923. [Google Scholar] [CrossRef]
  8. Ali, M.S.; Rainville, C.; Pedroza, J.; Sterner, D.E.; Wang, H.; Suresh, K.; Butt, T.R. Unraveling chain specific ubiquitination in cells using tandem ubiquitin binding entities. Sci. Rep. 2025, 15, 22961. [Google Scholar] [CrossRef]
  9. Gierten, J.; Welz, B.; Fitzgerald, T.; Thumberger, T.; Agarwal, R.; Hummel, O.; Leger, A.; Weber, P.; Naruse, K.; Hassel, D.; et al. Natural genetic variation quantitatively regulates heart rate and dimension. Nat. Commun. 2025, 16, 4062. [Google Scholar] [CrossRef]
  10. Visscher, K.; Brakenhoff, G.J.; Visser, T.D. Fluorescence saturation in confocal microscopy. J. Microsc. 1994, 175, 162–165. [Google Scholar] [CrossRef]
  11. Chaze, W.; Caballina, O.; Castanet, G.; Lemoine, F. The saturation of the fluorescence and its consequences for laser-induced fluorescence thermometry in liquid flows. Exp. Fluids 2016, 57, 58. [Google Scholar] [CrossRef]
  12. Wüstner, D. Image segmentation and separation of spectrally similar dyes in fluorescence microscopy by dynamic mode decomposition of photobleaching kinetics. Bmc Bioinform. 2022, 23, 334. [Google Scholar]
  13. Samantha Priyadarshani, D.M.; Stevens, A.L. Concentration-dependent nonradiative decay mechanisms in fluorescence self-quenching: Insights from azulene and 1,3-dichloroazulene. Can. J. Chem. 2025, 103, 246–251. [Google Scholar]
  14. Laisk, A.; Peterson, R.B.; Oja, V. Excitation transfer and quenching in photosystem II, enlightened by carotenoid triplet state in leaves. Photosynth. Res. 2024, 160, 31–44. [Google Scholar] [CrossRef]
  15. Fan, S.; Xu, J.; Osakada, Y.; Hashimoto, K.; Takayama, K.; Natsume, A.; Hirano, M.; Maruyama, A.; Fujitsuka, M.; Kawai, K.; et al. Electron-transfer kinetics through nucleic acids untangled by single-molecular fluorescence blinking. Chem 2022, 8, 3109–3119. [Google Scholar]
  16. Špačková, B.; Klein Moberg, H.; Fritzsche, J.; Tenghamn, J.; Sjösten, G.; Šípová-Jungová, H.; Albinsson, D.; Lubart, Q.; van Leeuwen, D.; Westerlund, F.; et al. Label-free nanofluidic scattering microscopy of size and mass of single diffusing molecules and nanoparticles. Nat. Methods 2022, 19, 751–758. [Google Scholar] [CrossRef]
  17. Huang, Y.F.; Zhuo, G.Y.; Chou, C.Y.; Lin, C.H.; Chang, W.; Hsieh, C.L. Coherent Brightfield Microscopy Provides the Spatiotemporal Resolution To Study Early Stage Viral Infection in Live Cells. ACS Nano 2017, 11, 2575–2585. [Google Scholar] [CrossRef]
  18. Jacobsen, V.; Stoller, P.; Brunner, C.; Vogel, V.; Sandoghdar, V. Interferometric optical detection and tracking of very small gold nanoparticles at a water-glass interface. Opt. Express 2006, 14, 405. [Google Scholar] [CrossRef]
  19. Piliarik, M.; Sandoghdar, V. Direct optical sensing of single unlabelled proteins and super-resolution imaging of their binding sites. Nat. Commun. 2014, 5, 4495. [Google Scholar] [CrossRef]
  20. Ortega Arroyo, J.; Cole, D.; Kukura, P. Interferometric scattering microscopy and its combination with single-molecule fluorescence imaging. Nat. Protoc. 2016, 11, 617–633. [Google Scholar] [CrossRef]
  21. Cheng, C.Y.; Hsieh, C.L. Background Estimation and Correction for High-Precision Localization Microscopy. ACS Photonics 2017, 4, 1730–1739. [Google Scholar] [CrossRef]
  22. Dastjerdi, H.M.; Dahmardeh, M.; Gemeinhardt, A.; Gholami Mahmoodabadi, R.; Köstler, H.; Sandoghdar, V. Optimized analysis for sensitive detection and analysis of single proteins via interferometric scattering microscopy. J. Phys. Appl. Phys. 2021, 55, 054002. [Google Scholar] [CrossRef]
  23. Cole, D.; Young, G.; Weigel, A.; Sebesta, A.; Kukura, P. Label-Free Single-Molecule Imaging with Numerical-Aperture-Shaped Interferometric Scattering Microscopy. Acs Photonics 2017, 4, 211–216. [Google Scholar] [CrossRef] [PubMed]
  24. Young, G.; Hundt, N.; Cole, D.; Fineberg, A.; Andrecka, J.; Tyler, A.; Olerinyova, A.; Ansari, A.; Marklund, E.G.; Collier, M.P.; et al. Quantitative mass imaging of single biological macromolecules. Science 2018, 360, 423–427. [Google Scholar] [CrossRef]
  25. Dahmardeh, M.; Mirzaalian Dastjerdi, H.; Mazal, H.; Köstler, H.; Sandoghdar, V. Self-supervised machine learning pushes the sensitivity limit in label-free detection of single proteins below 10 kDa. Nat. Methods 2023, 20, 442–447. [Google Scholar] [CrossRef]
  26. McDonald, M.P.; Gemeinhardt, A.; König, K.; Piliarik, M.; Schaffer, S.; Völkl, S.; Aigner, M.; Mackensen, A.; Sandoghdar, V. Visualizing Single-Cell Secretion Dynamics with Single-Protein Sensitivity. Nano Lett. 2017, 18, 513–519. [Google Scholar] [CrossRef]
  27. Stallinga, S.; Rieger, B. Accuracy of the Gaussian Point Spread Function model in 2D localization microscopy. Optics Express 2010, 18, 24461. [Google Scholar] [CrossRef]
  28. Liao, Y.H.; Lin, C.H.; Cheng, C.Y.; Wong, W.C.; Juo, J.Y.; Hsieh, C.L. Monovalent and Oriented Labeling of Gold Nanoprobes for the High-Resolution Tracking of a Single-Membrane Molecule. ACS Nano 2019, 13, 10918–10928. [Google Scholar] [CrossRef]
  29. Robert, H.M.L.; Holanová, K.; Bujak, L.; Vala, M.; Henrichs, V.; Lánský, Z.; Piliarik, M. Fast photothermal spatial light modulation for quantitative phase imaging at the nanoscale. Nat. Commun. 2021, 12, 2921. [Google Scholar] [CrossRef]
  30. Hsiao, Y.T.; Tsai, C.N.; Chen, T.H.; Hsieh, C.L. Label-Free Dynamic Imaging of Chromatin in Live Cell Nuclei by High-Speed Scattering-Based Interference Microscopy. ACS Nano 2021, 16, 2774–2788. [Google Scholar] [CrossRef]
  31. Gholami Mahmoodabadi, R.; Taylor, R.W.; Kaller, M.; Spindler, S.; Mazaheri, M.; Kasaian, K.; Sandoghdar, V. Point spread function in interferometric scattering microscopy (iSCAT). Part I: Aberrations in defocusing and axial localization. Opt. Express 2020, 28, 25969. [Google Scholar] [CrossRef]
  32. Kasaian, K.; Mazaheri, M.; Sandoghdar, V. Long-Range Three-Dimensional Tracking of Nanoparticles Using Interferometric Scattering Microscopy. ACS Nano 2024, 18, 30463–30472. [Google Scholar] [CrossRef]
  33. Huang, M.; Chen, Q.; Liu, Y.; Zhang, C.; Zhang, R.; Yuan, J.; Zhang, D. One-dimensional photonic crystal enhancing spin-to-orbital angular momentum conversion for single-particle tracking. Light. Sci. Appl. 2024, 13, 268. [Google Scholar] [CrossRef] [PubMed]
  34. Van den Eynde, R.; Leutenegger, M.; Lidke, D.S.; Jungmann, R.; Vandenberg, W.; Dedecker, P. Simultaneous multicolor single-molecule imaging and tracking using duplication-based PSF engineering. Biophys. J. 2024, 123, 434a. [Google Scholar] [CrossRef]
  35. Jouchet, P.; Roy, A.R.; Moerner, W.E. Simultaneous position and orientation measurements of single molecules using deep learning and PSF engineering approaches. Biophys. J. 2022, 121, 412a–413a. [Google Scholar] [CrossRef]
  36. Opatovski, N.; Nehme, E.; Zoref, N.; Barzilai, I.; Orange Kedem, R.; Ferdman, B.; Keselman, P.; Alalouf, O.; Shechtman, Y. Depth-enhanced high-throughput microscopy by compact PSF engineering. Nat. Commun. 2024, 15, 4861. [Google Scholar] [CrossRef]
  37. Wen, G.; Li, S.; Wang, L.; Chen, X.; Sun, Z.; Liang, Y.; Jin, X.; Xing, Y.; Jiu, Y.; Tang, Y.; et al. High-fidelity structured illumination microscopy by point-spread-function engineering. Light. Sci. Appl. 2021, 10, 70. [Google Scholar]
  38. Kashkanova, A.D.; Shkarin, A.B.; Mahmoodabadi, R.G.; Blessing, M.; Tuna, Y.; Gemeinhardt, A.; Sandoghdar, V. Precision Single-Particle Localization Using Radial Variance Transform. Optics Express 2021, 29, 11070. [Google Scholar] [CrossRef]
  39. McFarlane, N.J.B.; Schofield, C.P. Segmentation and Tracking of Piglets in Images. Mach. Vis. Appl. 1995, 8, 187–193. [Google Scholar] [CrossRef]
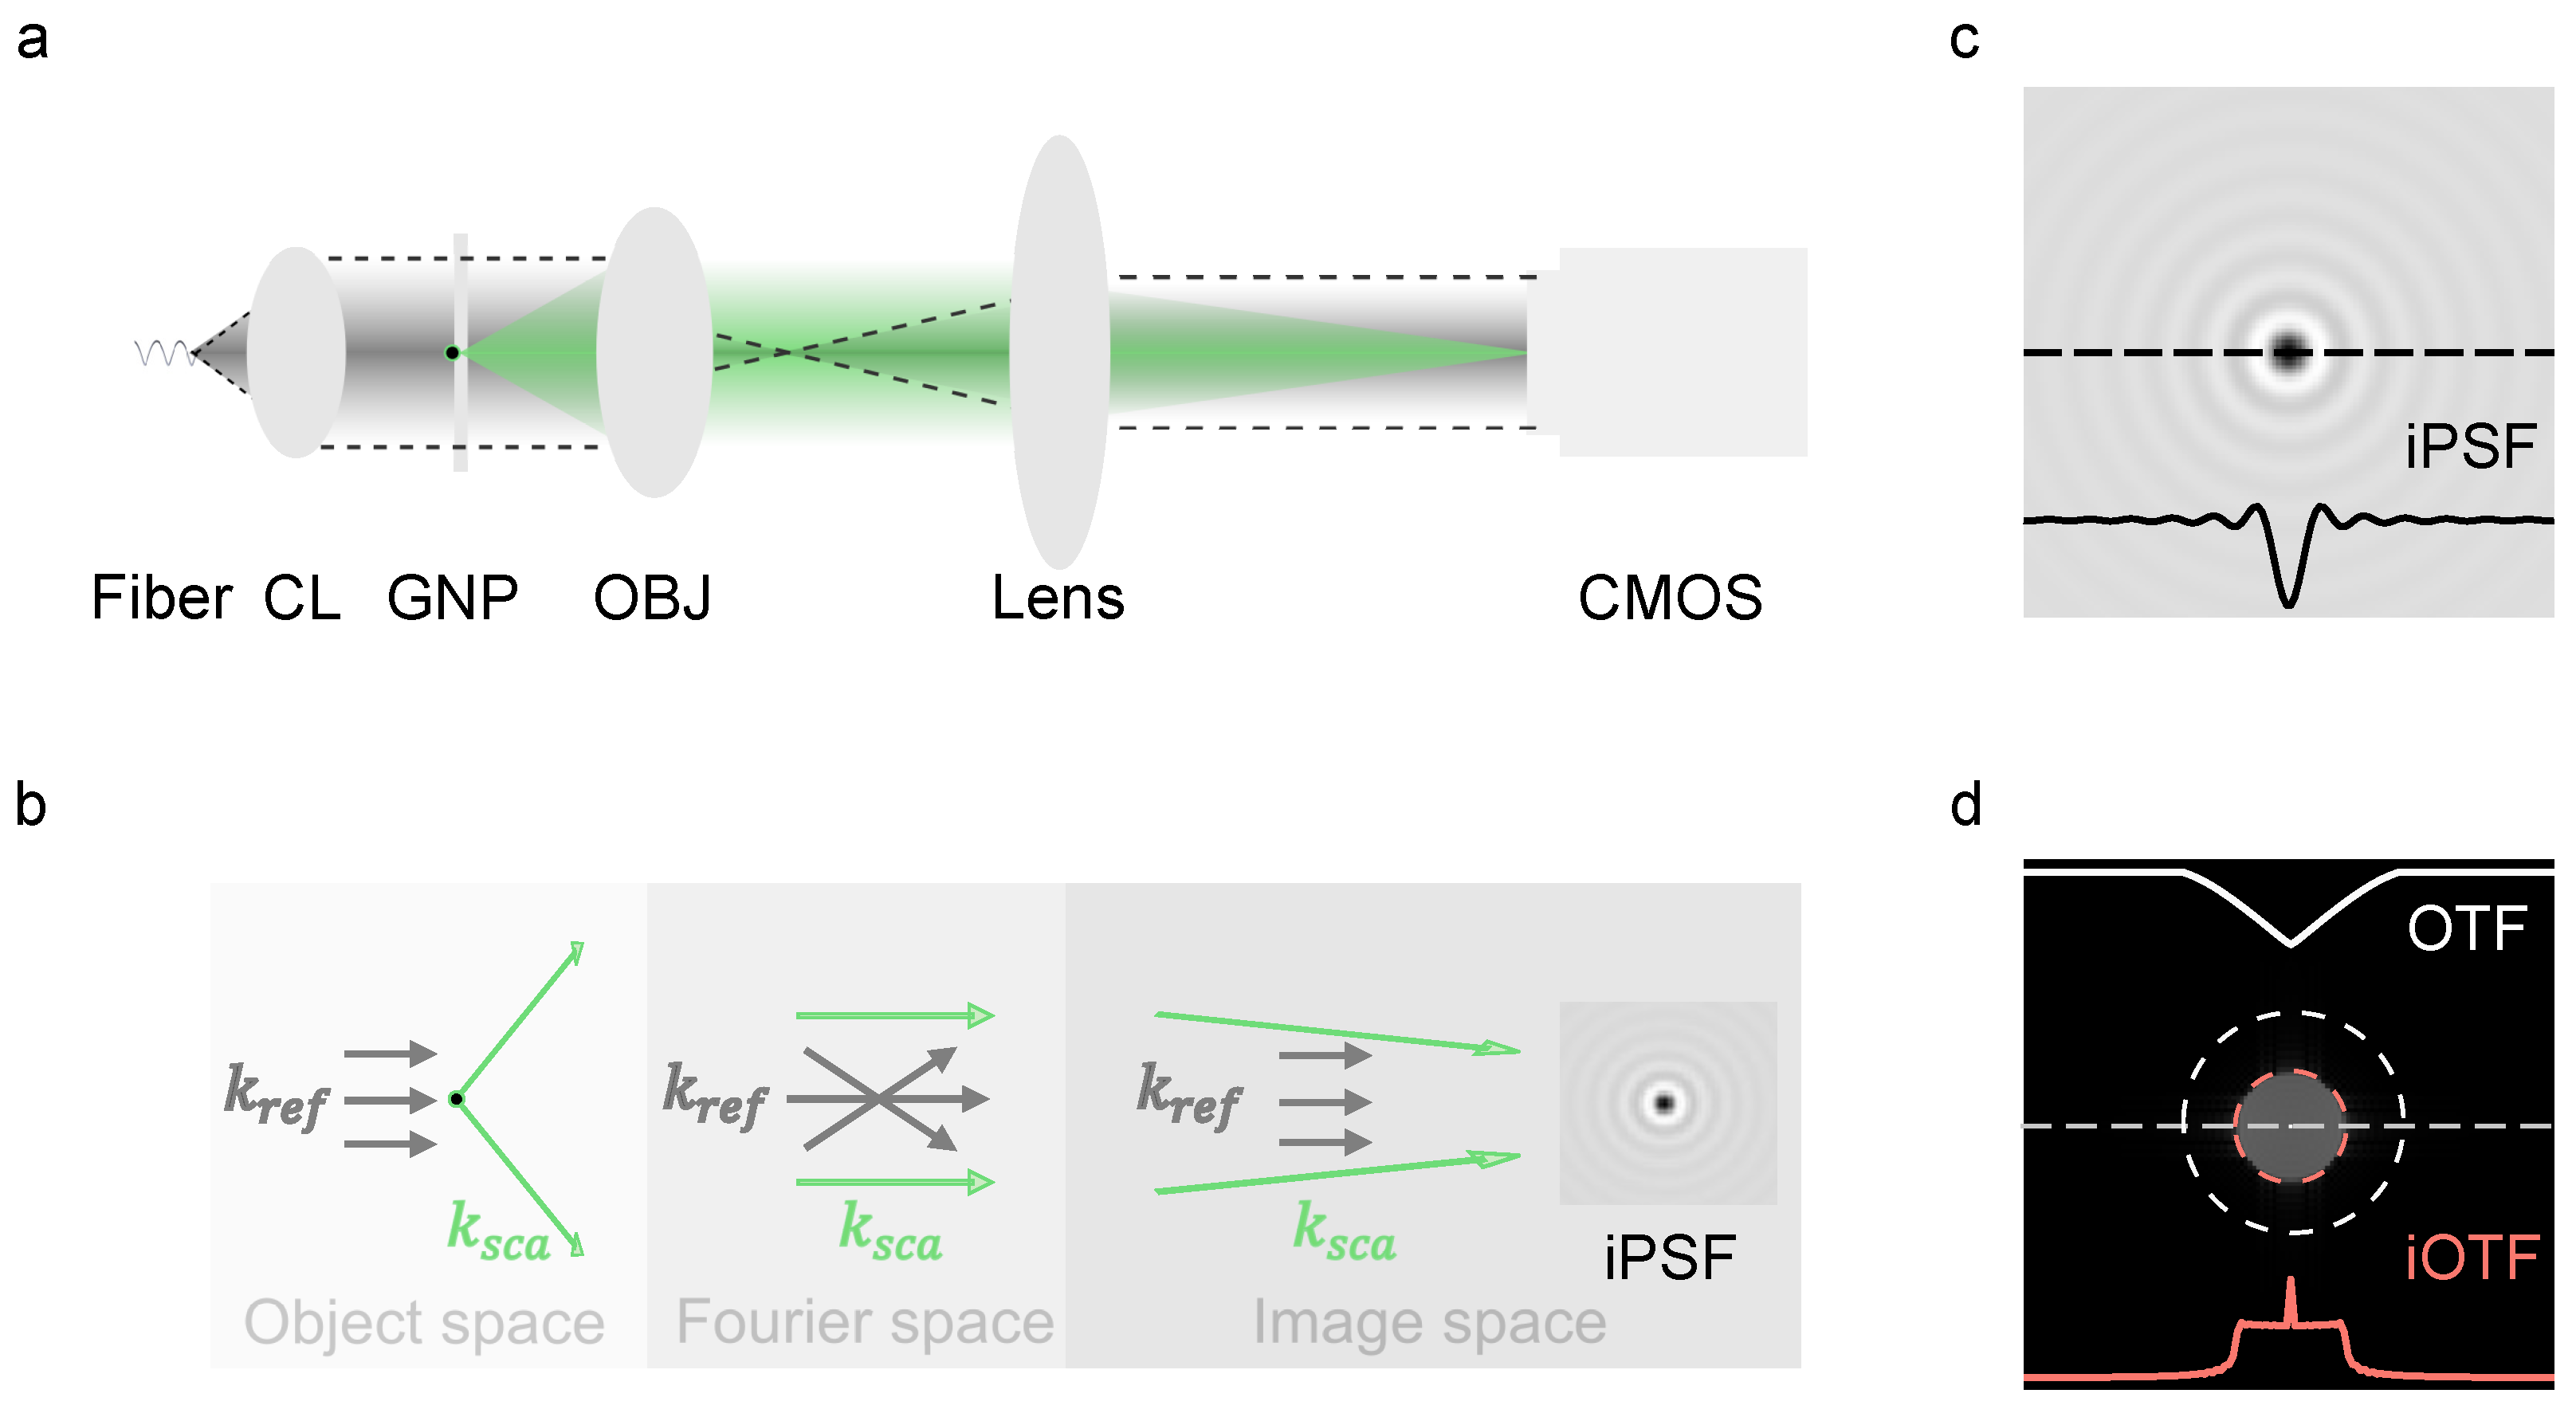
Figure 1. COBRI setup of wave vectors in the spatial κ space and images in the spatial and frequency domains: (a) Experimental setup based on a collimated fiber-coupling Light-Emitting Diode (LED) light source (CL, collimation lens; OBJ, objective; CMOS, Complementary Metal Oxide Semiconductor camera). The scattering light is marked with a green color and a continuous edge, and the reference light with a gray color and a dashed edge. The sample is GNPs of 20 nm in diameter. (b) Wave vectors in k-space correspond to (a); κ _ref is the reference light wave vector illuminated from the LED light source, marked with gray arrows; κ _sca is the scattering light wave vector from GNPs, marked with green arrows. The green arrows in the object space also represent the boundary of resolution governed by numerical aperture (NA). (c) The iPSF is generated from the interference of those wave vectors shown in (b). The solid line in dark is the cross-section intensity profile of the iPSF. (d) The corresponding iOTF to (c). The dashed circle in white represents the OTF boundary, which is mainly determined by NA. The upside of the solid curve in white is the cross-section intensity (log) of OTF. The dashed circle in red represents the iOTF boundary, which is governed not only by NA but also by the reference light. The downside of the solid curve in red is the cross-section intensity (log) of iOTF.
Photonics 12 00945 g001
Figure 2. Different cut-off frequencies between pure scattering imaging and iSCAT imaging: (a) Scattering cut-off frequency equals to the OTF boundary. The scattering interference pattern approaching the diffraction limit. (b) Interferometric cut-off frequency is about half of the OTF boundary. The cut-off frequency is determined by the interference of marginal wave vectors and the reference wave vector; the interference angle is half of that in (a), resulting in the scattering interference pattern approaching half of the diffraction limit.
Photonics 12 00945 g002
Figure 3. Enhancing the weak signal through background removal in the frequency domain: (a) Noise-dominated image, (b) background image, and (c) signal image. The corresponding images in Fourier space are shown in (df). The refraction-limited notch filter is shown in (g), and the effective filter limited by the iOTF boundary is shown in (h). All displayed images were normalized by their intensity boundaries. The signal, whose position is in the center of (a), is barely seen in the noise-dominated image (a). The background image (b) is available by applying an iOTF-based low-pass filter and a notch filter in the frequency domain. Thus, the background can be removed from the noise-dominated image, and the signal becomes visible, as shown in (c).
Photonics 12 00945 g003
Figure 4. Simulation comparison of a single particle in the noise-dominated and the filtered image: (a) An iPSF modeled particle with Gaussian noise under simulation. (b) The extracted particle from (a). (c) The simulated iPSF was taken as the ground truth. (d) The cutline intensity profile along the dashed blue line in (a). (e) The cutline intensity profile along the red dotted line in (b). An intensity profile along the dashed line in (c) was presented in black solid line in (d,e) as the ground truth intensity. The blue solid line in (d) represents the intensity alone the blue dotted line in (a); the red solid line in (e) represents the intensity alone the red dotted line in (b). (f) The SSIM and PSNR values vary with the noise level both in the noise-dominated image in (a) and the filtered image in (b).
Photonics 12 00945 g004
Figure 5. Experimental comparison between the raw image and the noise-dominated image: (a) A particle in the noise-dominated image captured under an exposure time of 80 μ s. (b) The same particle in the filtered image. (c) The particle from averaged frames was taken as the ground truth. (d) The cutline intensity profile along the dashed blue line in (a). (e) The cutline intensity profile along the dashed red line in (b). An intensity profile along the dashed line in (c) is presented in black dotted line in (d,e) as the ground truth intensity. The blue solid line in (d) represents the intensity alone the blue dotted line in (a); the red solid line in (e) represents the intensity alone the red dotted line in (b). (f) The SSIM and PSNR values vary with the exposure time, both in the noise-dominated image and the filtered image.
Photonics 12 00945 g005
Figure 6. Comparison of particles’ detection between the noise dominated and filtered image. (a) The particles’ detection in the noise dominated image, identified particles are marked with black circles; (b) The particles’ detection in the filtered image, the same identified particles with (a) are marked with black circles, 6 undetected particles in (a) are detected in (b,e) marked with red circles; (c) The particles’ detection in the ground truth image, the identified particles are marked with black circles; (d,e) The result under RVT of the corresponding image in (a,b); (f) The comparison of particles’ peak intensity in (a,b), undetected particles are marked with light colors and a ring.
Photonics 12 00945 g006
Disclaimer/Publisher’s Note: The statements, opinions and data contained in all publications are solely those of the individual author(s) and contributor(s) and not of MDPI and/or the editor(s). MDPI and/or the editor(s) disclaim responsibility for any injury to people or property resulting from any ideas, methods, instructions or products referred to in the content.