1. Introduction
The reason why digital holography technology has become a symbol of accurate measurement of three-dimensional information in the field of interferometry is that phase information is the most important part of three-dimensional information. Phase plays an important role in optical transmission, and different phases will produce different transmission states [
1,
2,
3]. Measuring phase information can accurately largely explain the basic three-dimensional condition of the object. The necessary technical step is the phase unwrapping algorithm in this important technical field.
A key step when conducting optical measurements is to calculate the arctangent function in processing and extracting optical field information from interference signals. Due to the characteristics of the arctangent function, the recovered phase data will be wrapped between −π and +π. When the phase change is greater than one wavelength, it will cause phase discontinuity, so the true distribution of measurement information cannot be directly obtained.
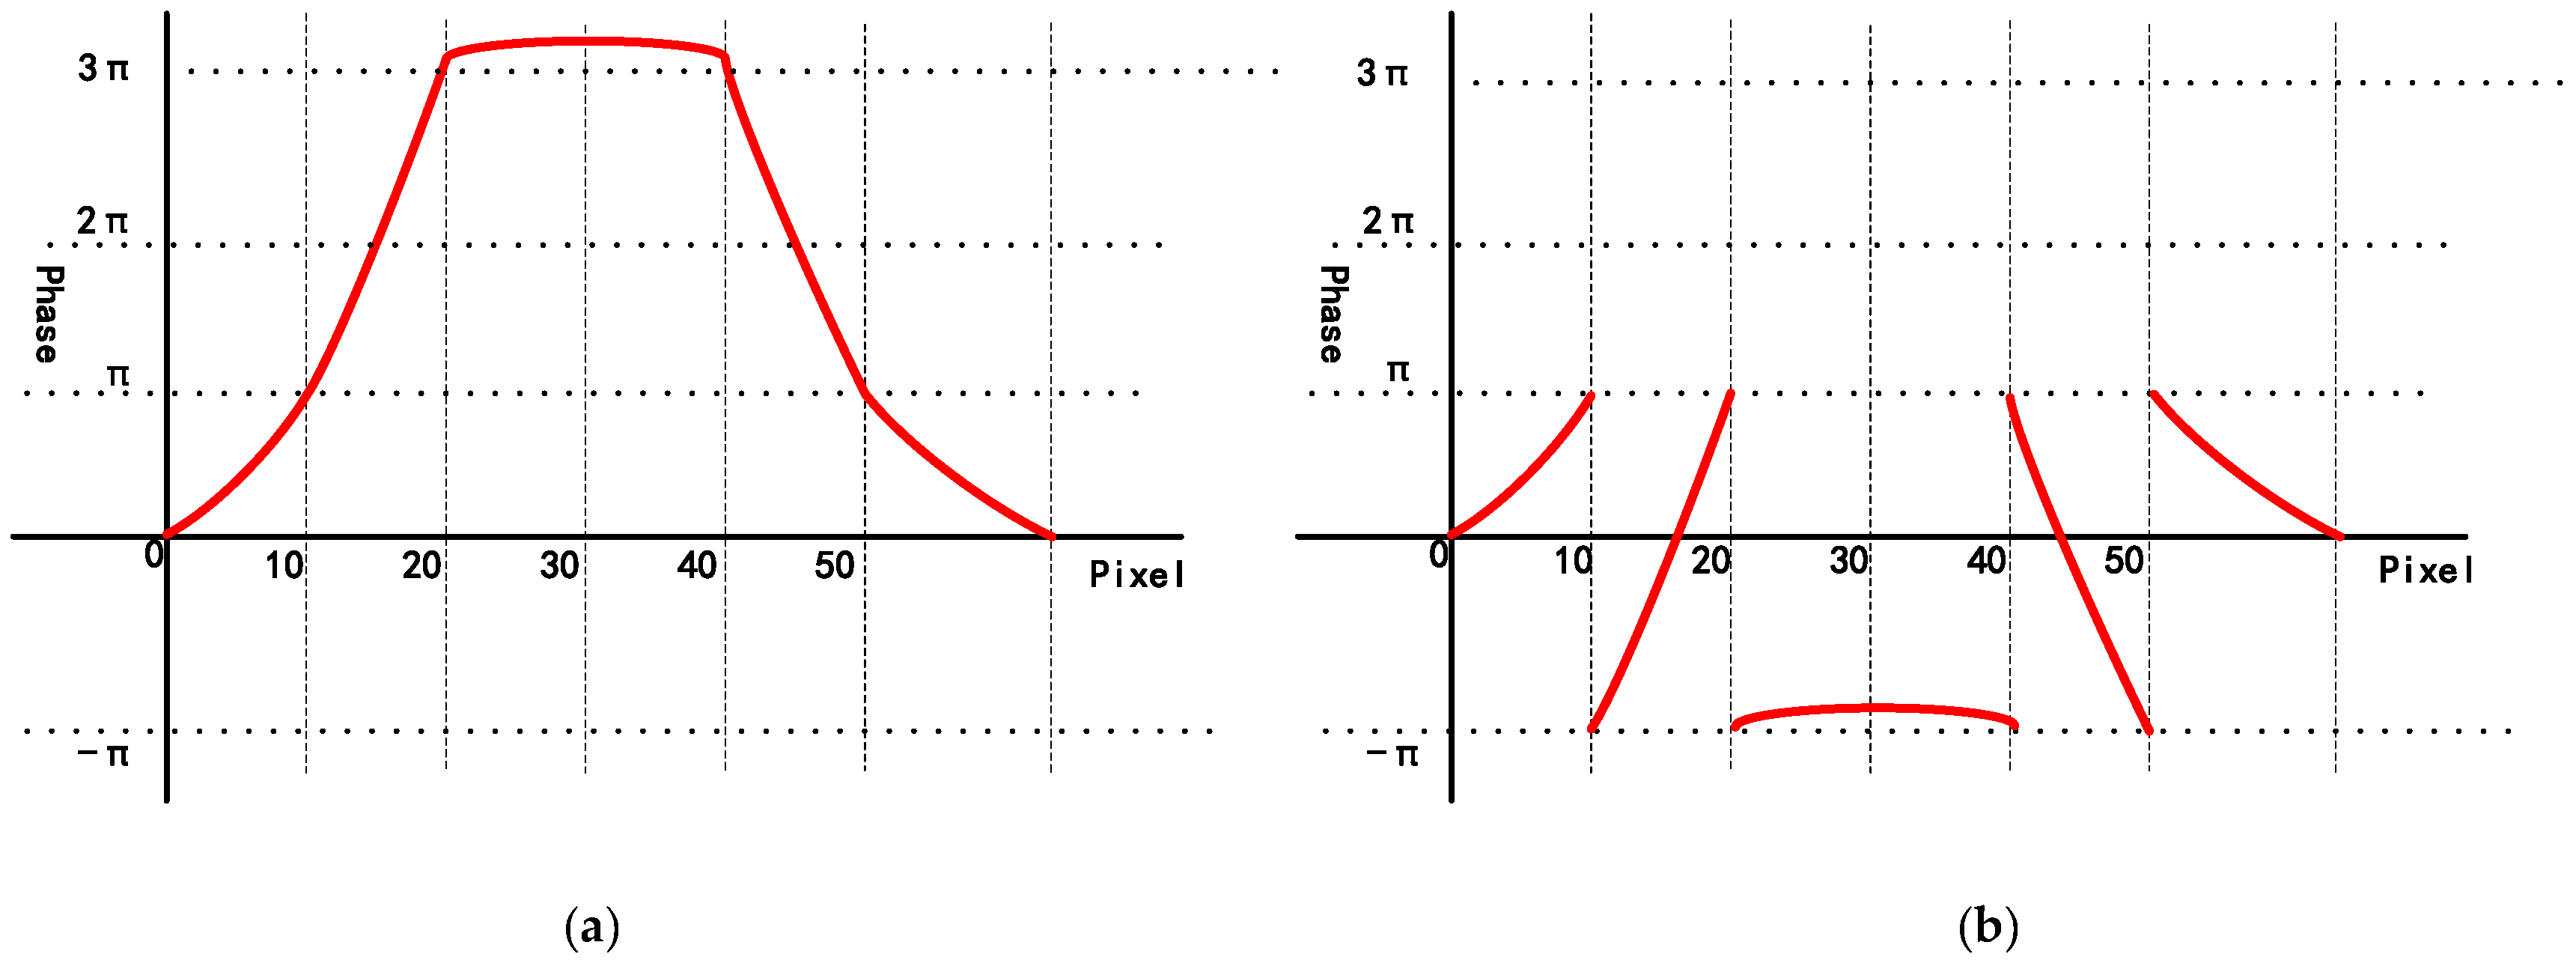
Figure 1 shows a schematic diagram of unwrapping phase. The truncated wrapped phases must be connected during the actual measurement in order to obtain the true phase distribution. This process is called phase unwrapping [
4].
The two-dimensional phase unwrapping can be expressed in mathematical models as:
In the formula, represents the true phase value of the data after unpacking; represents the phase value of the wrapped phase. n represents the number of wrapped phases.
Kazuyoshi Itoh conducted mathematical analysis on a one-dimensional phase unwrapping algorithm [
5]. Takeda extended this theoretical foundation to two-dimensional phase unwrapping and proposed a row and column point-by-point algorithm for the unwrapping phase [
6]. Goldstein proposed the Branch Cut phase unwrapping algorithm [
7]. Bone proposed the quality graph-oriented phase unwrapping algorithm [
8]. Ghiglia proposed a least squares phase unwrapping algorithm [
9]. Phase unwrapping technology has flourished in recent years. Qian Xiaofan et al. proposed a solution phase unwrapping algorithm based on mask and least squares iteration [
10]. Jin Guowang et al. from the University of Information Engineering proposed a novel phase unwrapping algorithm for instantaneous frequency estimation based on the relationship between a complex light field and the interference fringe frequency [
11]. Servin M proposed a network-planning-based algorithm that can effectively suppress error propagation without identifying residual points [
12]. These algorithms have emerged one after another, driving the further development of phase unwrapping technology.
Although many experts and scholars have proposed many algorithms at home and abroad, there is currently no algorithm that can completely solve all the problems faced in phase unwrapping. Therefore, it is necessary to conduct in-depth research on phase unwrapping algorithms and find the most optimal and suitable phase unwrapping algorithm for various complex situations in digital holographic microscopy measurements.
There are currently two mainstream research directions for phase unwrapping algorithms: the first is to improve the speed of unwrapping under ideal conditions, and the second is to improve the quality of unwrapping under strong noise conditions. The classic phase unwrapping algorithms can be divided into two categories: one consists of path integration algorithms, represented by the branch cutting method and the quality map guidance method, and the other consists of path-independent algorithms, represented by the least squares method. (1) Path integration algorithms use various strategies to find the optimal integration path and to integrate it to obtain the true phase after unwrapping. At the same time, they reduce or avoid the cumulative effect of error transmission during the phase unwrapping process by avoiding noise areas. (2) The most typical representative of path-independent algorithms is the minimum norm method. This algorithm will transform wrapped phases into objective optimization problems. The principle of the minimum norm method is based on the framework of the minimum norm criterion, which defines an equivalent function. This equivalent function can reflect the difference between the unwrapped phase gradient and the wrapped phase gradient. Then, a reasonable and effective mathematical method is used to find the solution that minimizes the cost function [
13,
14,
15].
Phase unwrapping seems to be a very simple problem from a theoretical principle, but there are often problems such as noise, local shadows, stripe pattern breaks, undersampling, and error propagation caused by the rapid spatial variation of the phase in practical situations, making phase unwrapping a very difficult problem.
In response to the above-mentioned issues, this paper uses phase unwrapping methods such as the residual point search method, the row and column point-by-point method, and the least squares method and combines them with the four-step phase-shift method, the Fourier transform method, and the diffraction calculation method to reconstruct the theoretical analysis of the optical field phase and to clarify the scope of use of the unwrapping phase.
In response to the problem of phase unwrapping in situations with high noise or steep gradients, this paper proposes an unwrapping algorithm based on multiple iterations of the least squares optimization. In order to minimize the difference between the partial derivative of the true phase and the wrapped phase difference, this algorithm proposes an optimization algorithm using the Poisson equation derived from differentiation, combining it with boundary conditions and an iterative least squares solution strategy. This algorithm transforms the solution wrapping problem into an equivalent continuous minimization problem, ultimately obtaining the optimal solution.
We used MATLAB software to simulate the reconstruction of the optical field phase and the unwrapping phase algorithm. The experimental results verify the correctness of the research method by combining a four-step phase-shift reconstruction of the optical field phase with the least squares method through multiple iterations of the unwrapping algorithm.
2. Theoretical Analysis
It is assumed that the object light field and the reference light field are, respectively,
and
at a certain point (
x,
y) in the process of holography. The interference between the reference light and the object light, resulting in the recording of the phase of the object light, can be expressed as:
If
,
, a bright stripe will appear at coordinates (
x,
y); if
,
, then a dark stripe will appear at coordinates (
x,
y). So, a hologram is actually an interference pattern, and the phase difference between the object light and the reference light produces interference fringes of light and dark, which are used to record the phase [
16]. There are three commonly used methods for reconstructing the phase of a light field through interferograms, which are introduced as follows:
- (1)
Reconstruction of the optical field phase by using the four-step phase-shifting method
This method is usually used in image plane holography, which requires placing the holographic recording surface on the image plane that is clearly imaged by the system. The phase-shift method requires accurately changing the phase of the reference light and taking at least two digital holograms to reconstruct the phase of the light field. Taking the typical four-step phase-shifting method as an example, make the reference light phase change
every time [
17]. The four reference light fields are:
Correspondingly, four different holograms are sequentially recorded:
The phase difference between the object light field and the reference light field can be calculated at coordinates (x, y) by the following equation:
- (2)
Reconstruction of the optical field phase by using the Fourier transform method
This method is also commonly used in image holography, which requires off-axis holography and sufficient carrier frequency [
18]. Assuming that the object light field and the reference light field are
and
, respectively, on the holographic recording surface, the recorded digital hologram
can be represented as:
In order to reconstruct the object light field
, the hologram can be first transformed from the spatial domain to the frequency domain through a Fourier transform step:
Similar to the spectrum of off-axis holography,
appears in the low-frequency region of the frequency domain, known as the “0” level spectrum. However,
and
symmetrically appear in the mid-frequency and high-frequency regions of the frequency domain, referred to as the “+1” and “−1” level spectra, respectively. If the carrier frequency is large enough, that is, if the angle between the reference and object light is large enough, then the frequency spectrums are fully separated at all levels, and a suitable filter
is selected in the frequency domain to filter out all other levels except for the “+1” level spectrum:
The light field containing the object light
and the conjugate reference light
can be reconstructed by performing an inverse Fourier transform on the filtered spectrum.
represents the inverse Fourier transform. The phase difference between the object light
and the reference light
can be reconstructed by using the following formula:
- (3)
Reconstructing the phase of the optical field by using diffraction calculation
This method is commonly used in Fresnel holography or Fourier transform holography, which require diffraction calculations to reconstruct the reconstructed light field [
19]. Assuming that the object light field and the reference light field are
and
, respectively, on the holographic recording surface, the hologram
is illuminated with coherent light with a complex amplitude of
. The reconstructed light field
can be expressed as:
If
represents the reconstruction operation of the reconstructed image, the light field on the image plane can be represented as:
The phase of the object light is included in the reconstructed phase of the following equation:
The wrapped phase cannot reflect the variation pattern of the phase to be measured; it is necessary to unpack the wrapped phase of digital holography in order to obtain the correct phase distribution. There are three commonly used unwrapping phase algorithms:
- (1)
Residual point search method for unwrapping phase
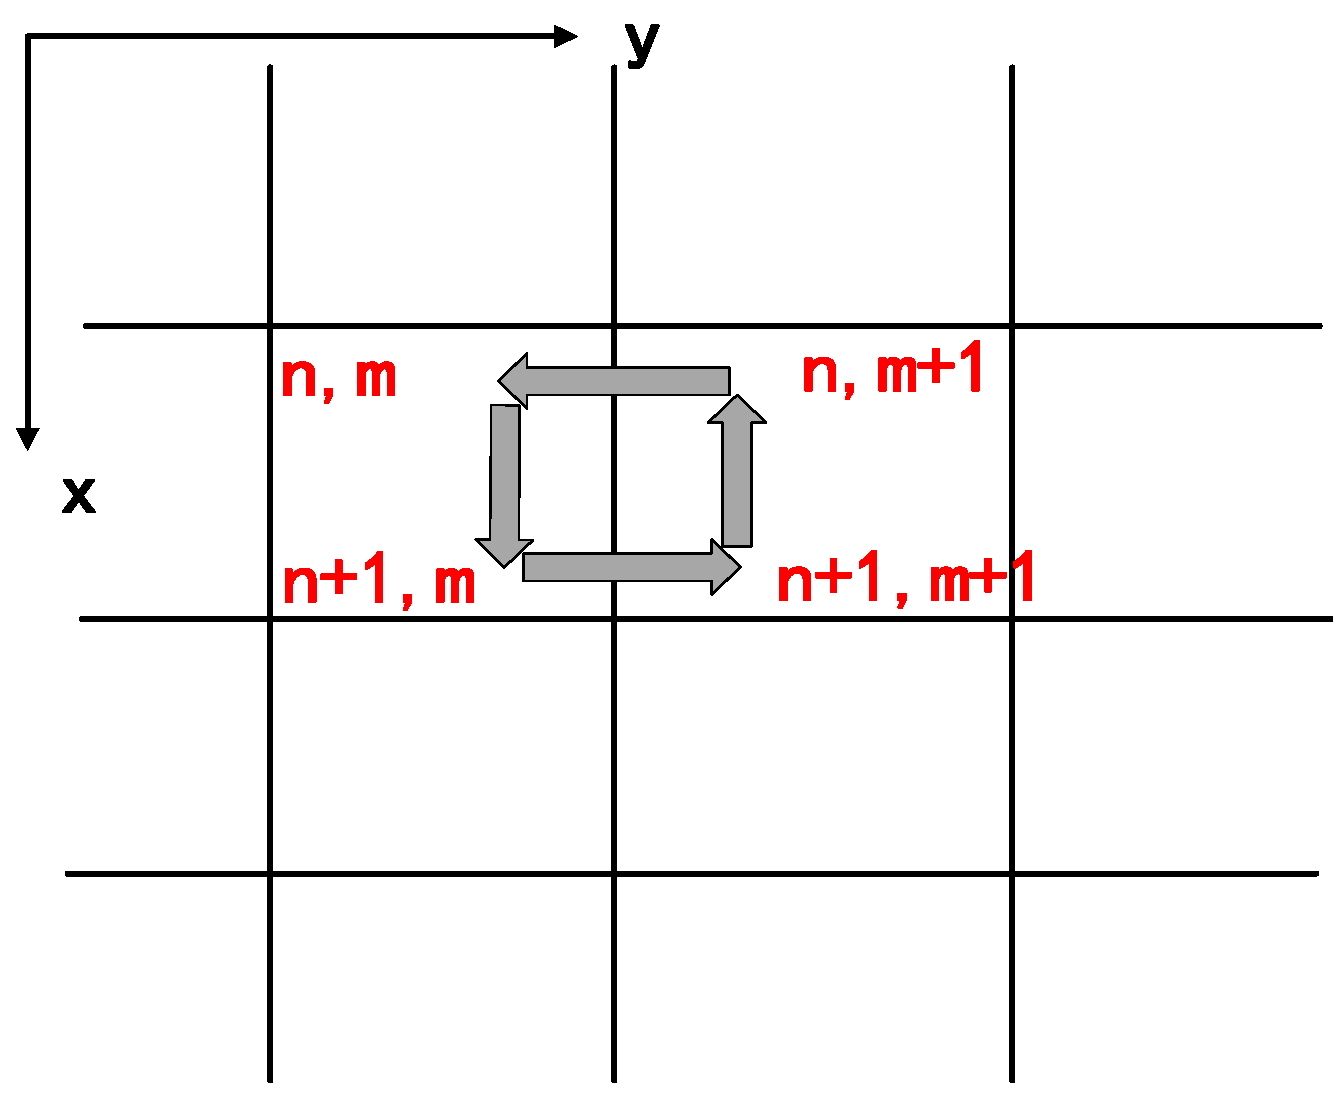
The schematic diagram of the residual point search is shown in
Figure 2. The method is as follows: perform a first-order derivative operation on the (n, m) coordinate points in the two-dimensional wrapped phase.
Summing the results of two derivative operations yields:
The residual points are determined by rounding the derivative operation:
represents the rounding operation in the formula. If
is not 0,
should be a residue; otherwise, it is not a residue.
The results obtained may not be unique by the path tracking algorithm for areas with residues, and special processing is necessary to obtain the correct unpacking results [
20].
- (2)
Row and column point-by-point algorithm for unwrapping phase
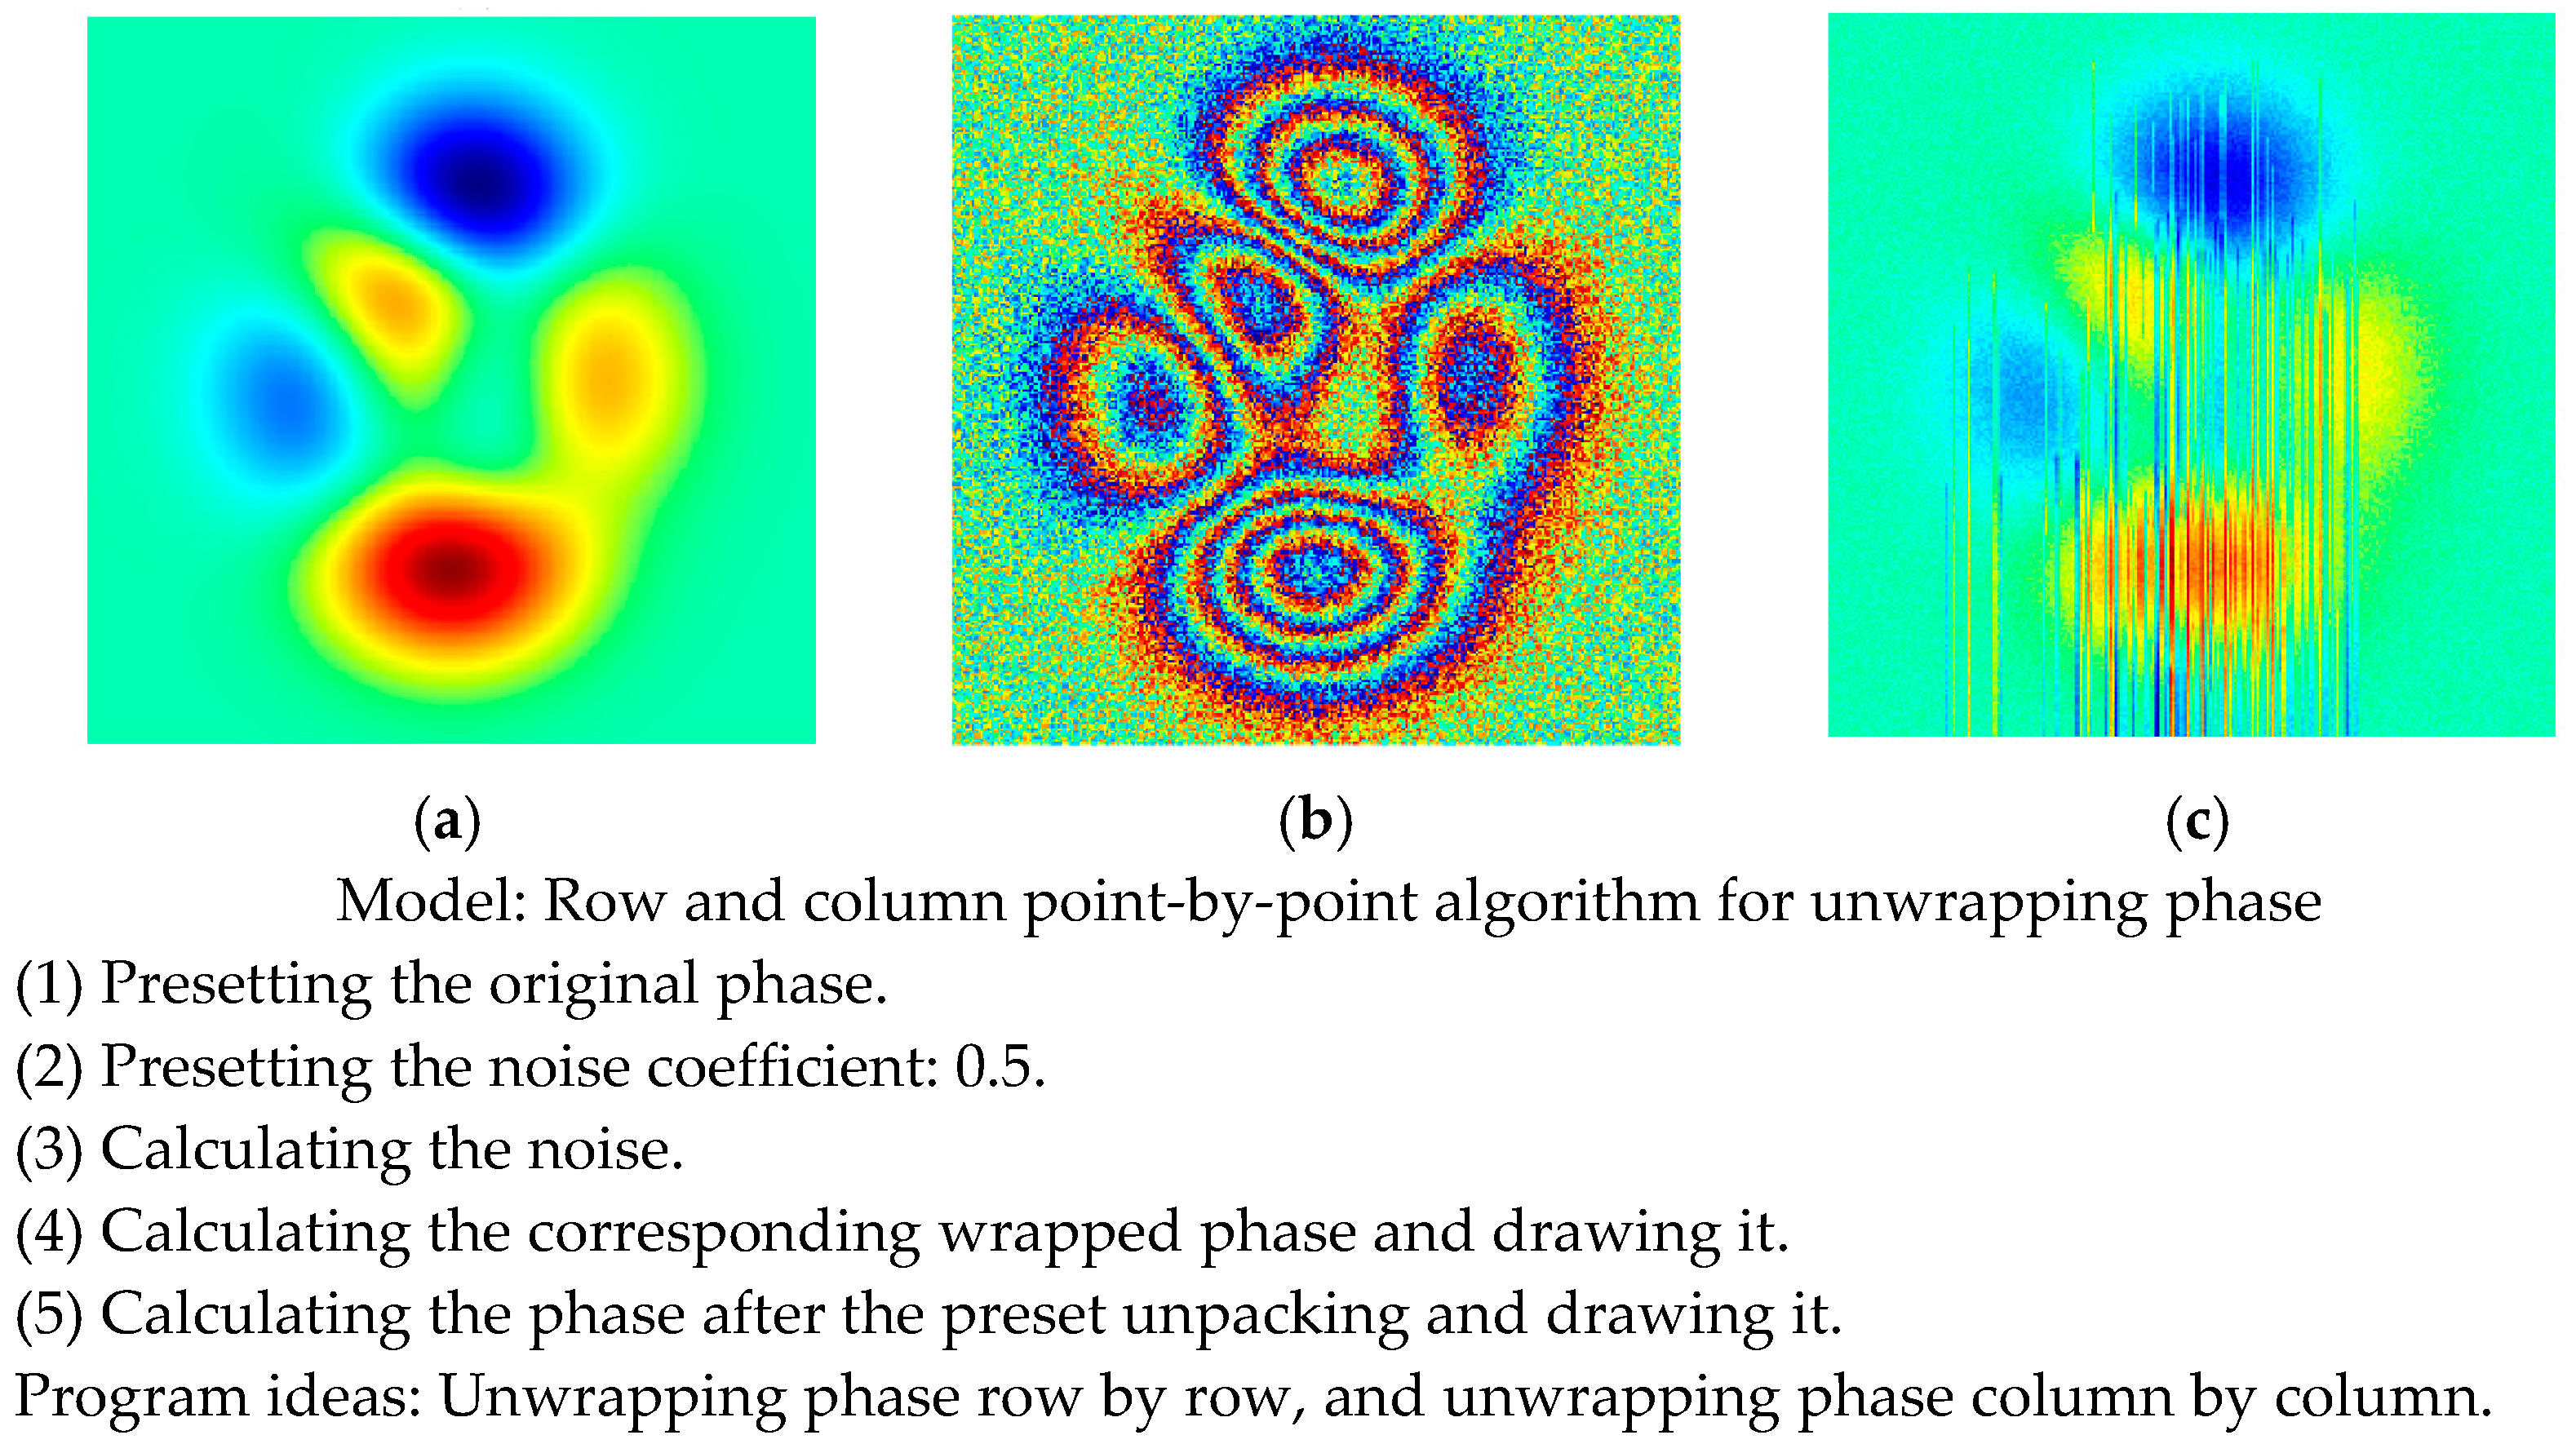
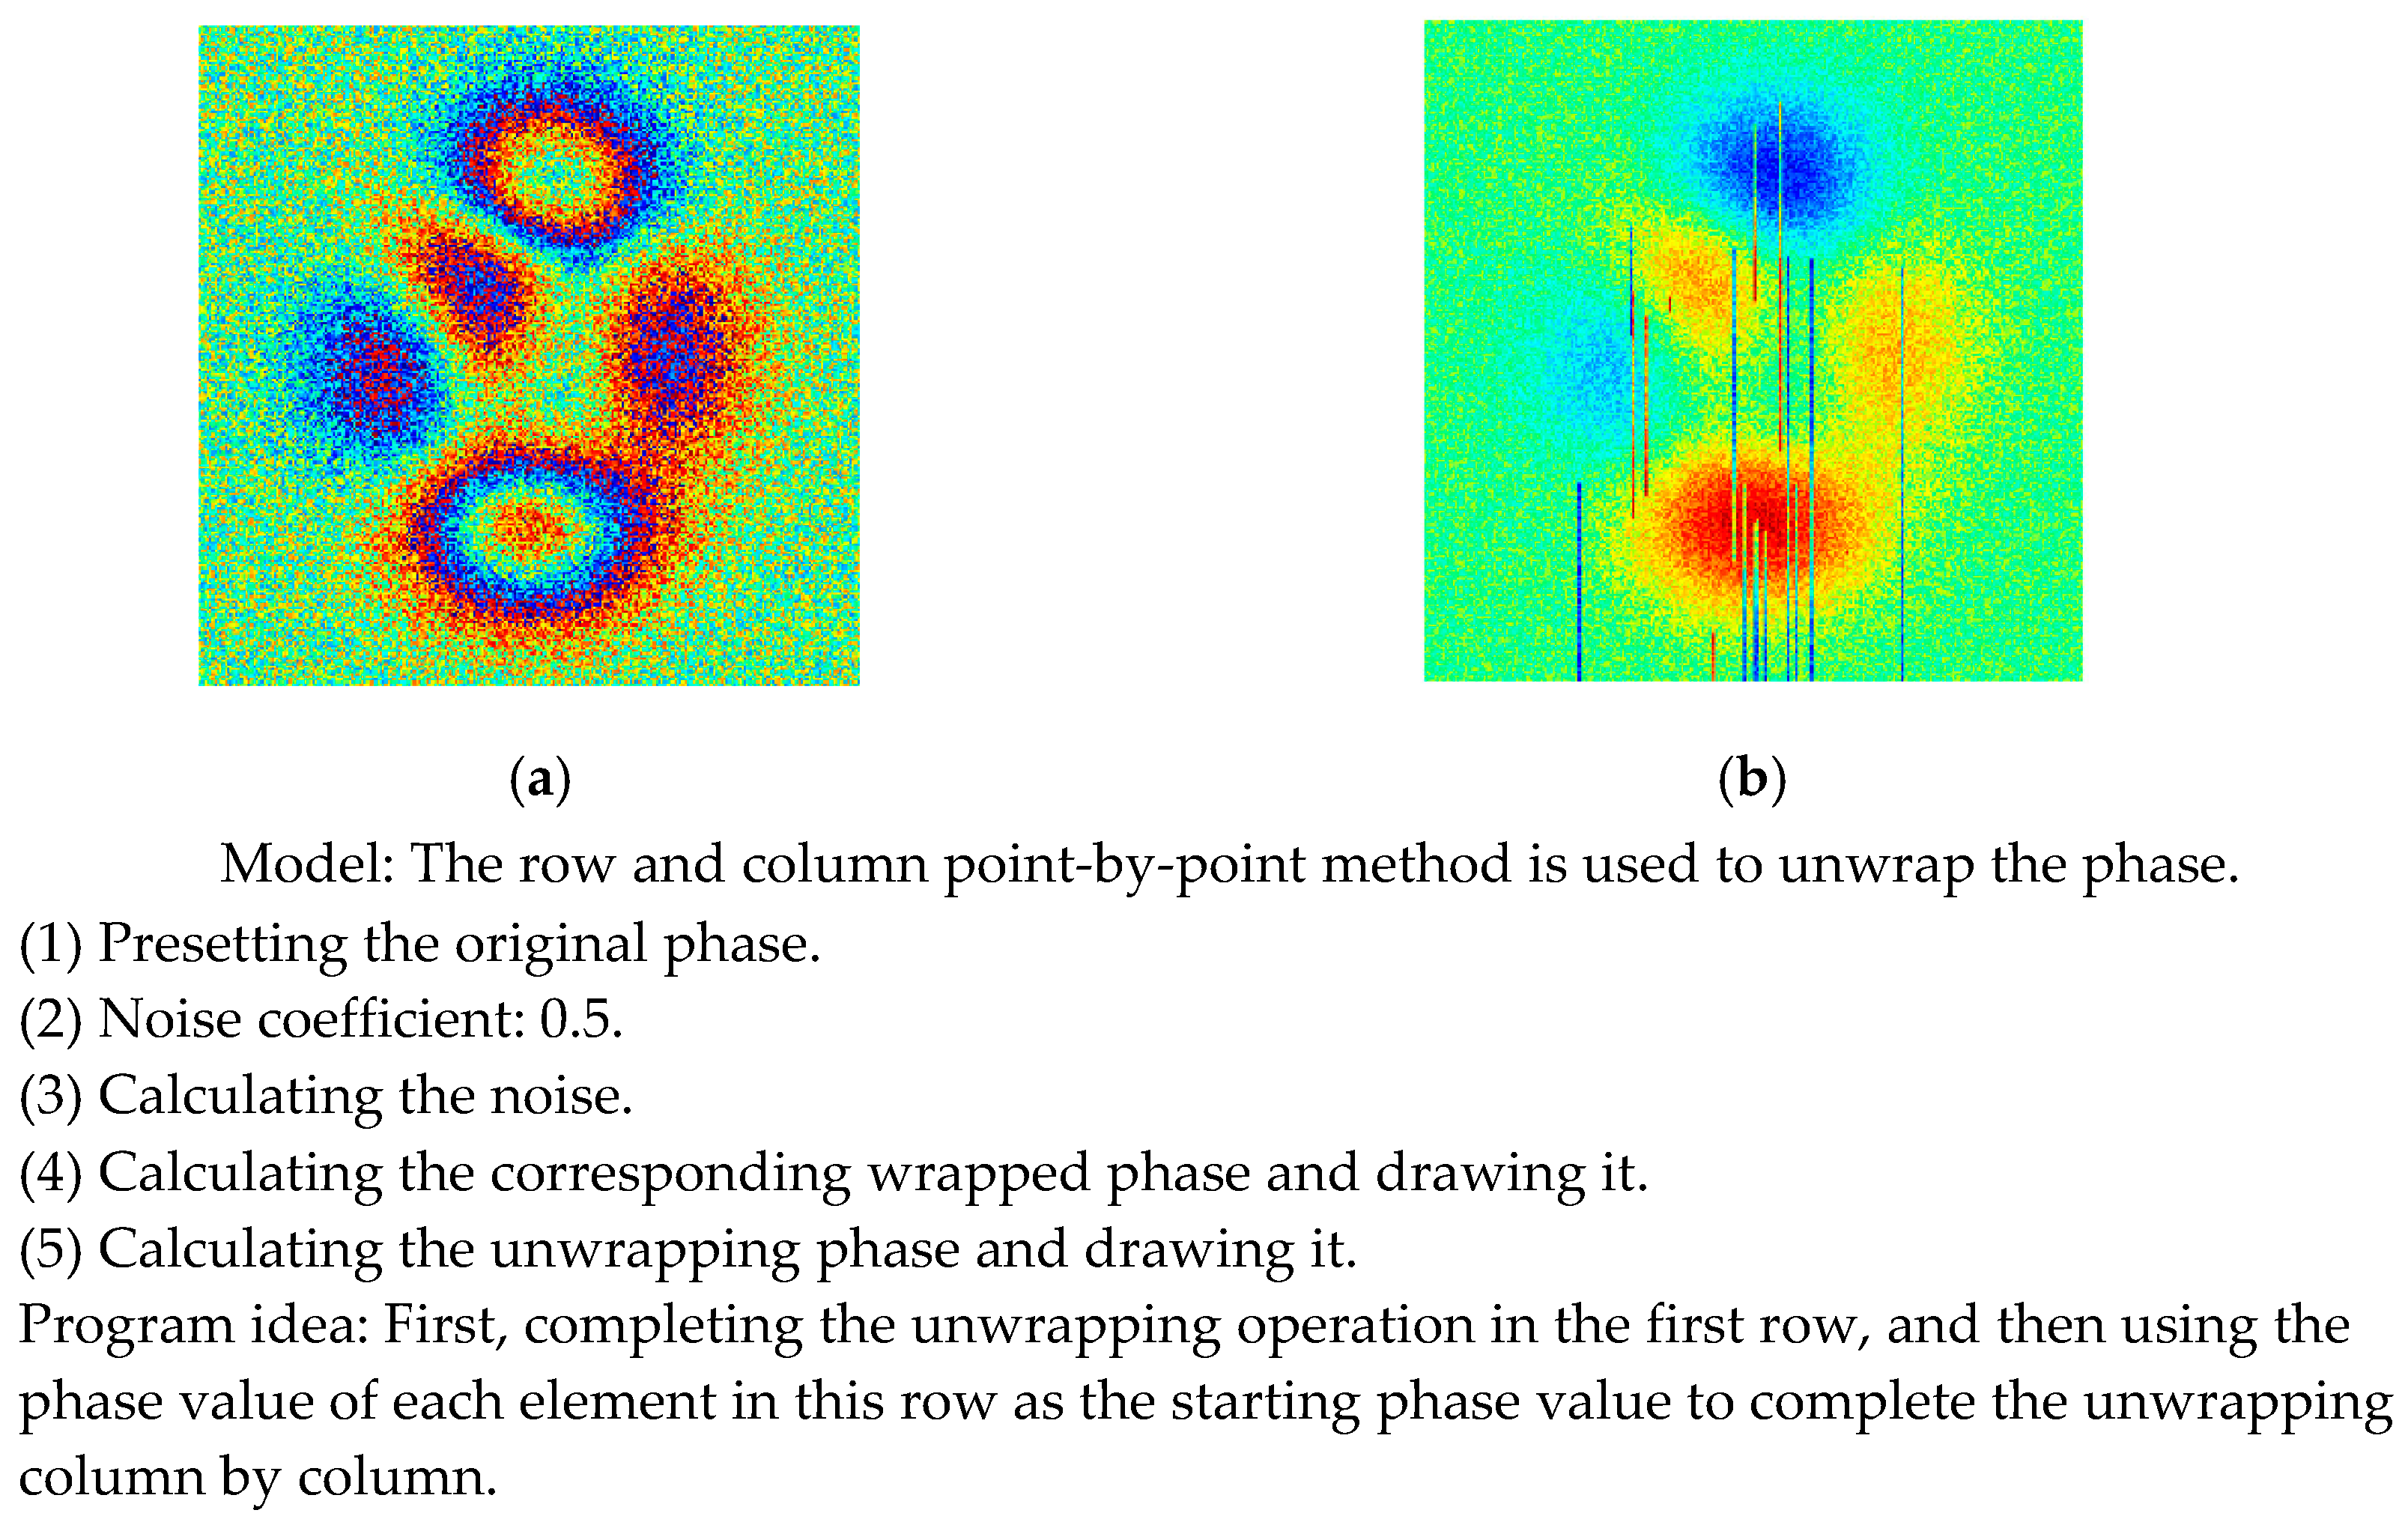
As shown in
Figure 3, the simulation experiment results of unwrapping phase are presented through using the row and column point-by-point algorithm. The basic idea is to first complete the unwrapping operation of a certain row or column and then to use the phase value of each element in this row or column as the starting phase value and unwrapping it column by column or row by row, thus completing the unwrapping operation of the entire two-dimensional unwrapping phase matrix [
21].
- (3)
Least squares method for unwrapping phase
Seeking the minimum norm of different orders is a commonly used algorithm in various path-independent algorithms, among which the least squares algorithm is the most commonly used. The gradients of the wrapping phase along the x and y directions are
Assuming that the phase value of the solution obtained is
by using the least squares method, i.e.,
is the least squares solution of
, the least squares (second-order norm) should be performed first:
The equation for solving the above least squares matrix can be expressed as
The identity relationship can be expressed as
In this relational expression,
can be directly obtained from the phase
of the wrapped phase. The above least squares matrix-solving equation is a discrete Poisson equation on a
rectangular network, namely:
The Neumann boundary conditions for the discrete Poisson equation are
So, the least squares solution of the phase unwrapping problem can mathematically solve the discrete Poisson equation with Neumann boundary conditions, and the discrete cosine transform (DCT) technique can be used to solve the discrete Poisson equation:
In the equation,
is the Laplace operator. Assuming that
is
in the DCT domain (i.e., DCT transformation of
), the exact solution of
in the DCT domain is
Performing a DCT inverse transformation on the previous equation, the least squares solution of the phase
can be obtained after unwrapping [
22].
Improving the classic iterative algorithm:
Assuming that
is the wrapped phase,
,
is the true phase and satisfies the following equation:
If the wrapped phase is respectively defined as
and
in the
x and
y directions, then
In the equation, W is the wrapping operator, which aims to add or subtract
to the wrapping phase to ensure that the values of
and
are within
. To minimize the difference between the partial derivative of the true phase and the wrapped phase difference,
By taking the derivative of
in the above equation and making it 0, the Poisson equation is obtained:
In the equation, is the value of the wrapped phase.
Substituting Equation (27) into Equation (30) yields
If the right-hand side of Equation (31) is equal to
, then
This algorithm can effectively obtain the unwrapped phase. The idea behind multiple iterations is the following: (1) To a certain extent, to reduce errors and improve the accuracy of unwrapping phase under noise. (2) To improve the quality of phase unwrapping while minimizing the difference between the partial derivative of the true phase and the phase difference of the wrapped phase, reducing computation time. (3) The boundary conditions are all integers during the iteration process, further improving the robustness of the wrapped algorithm.
3. Simulation Verification
- (1)
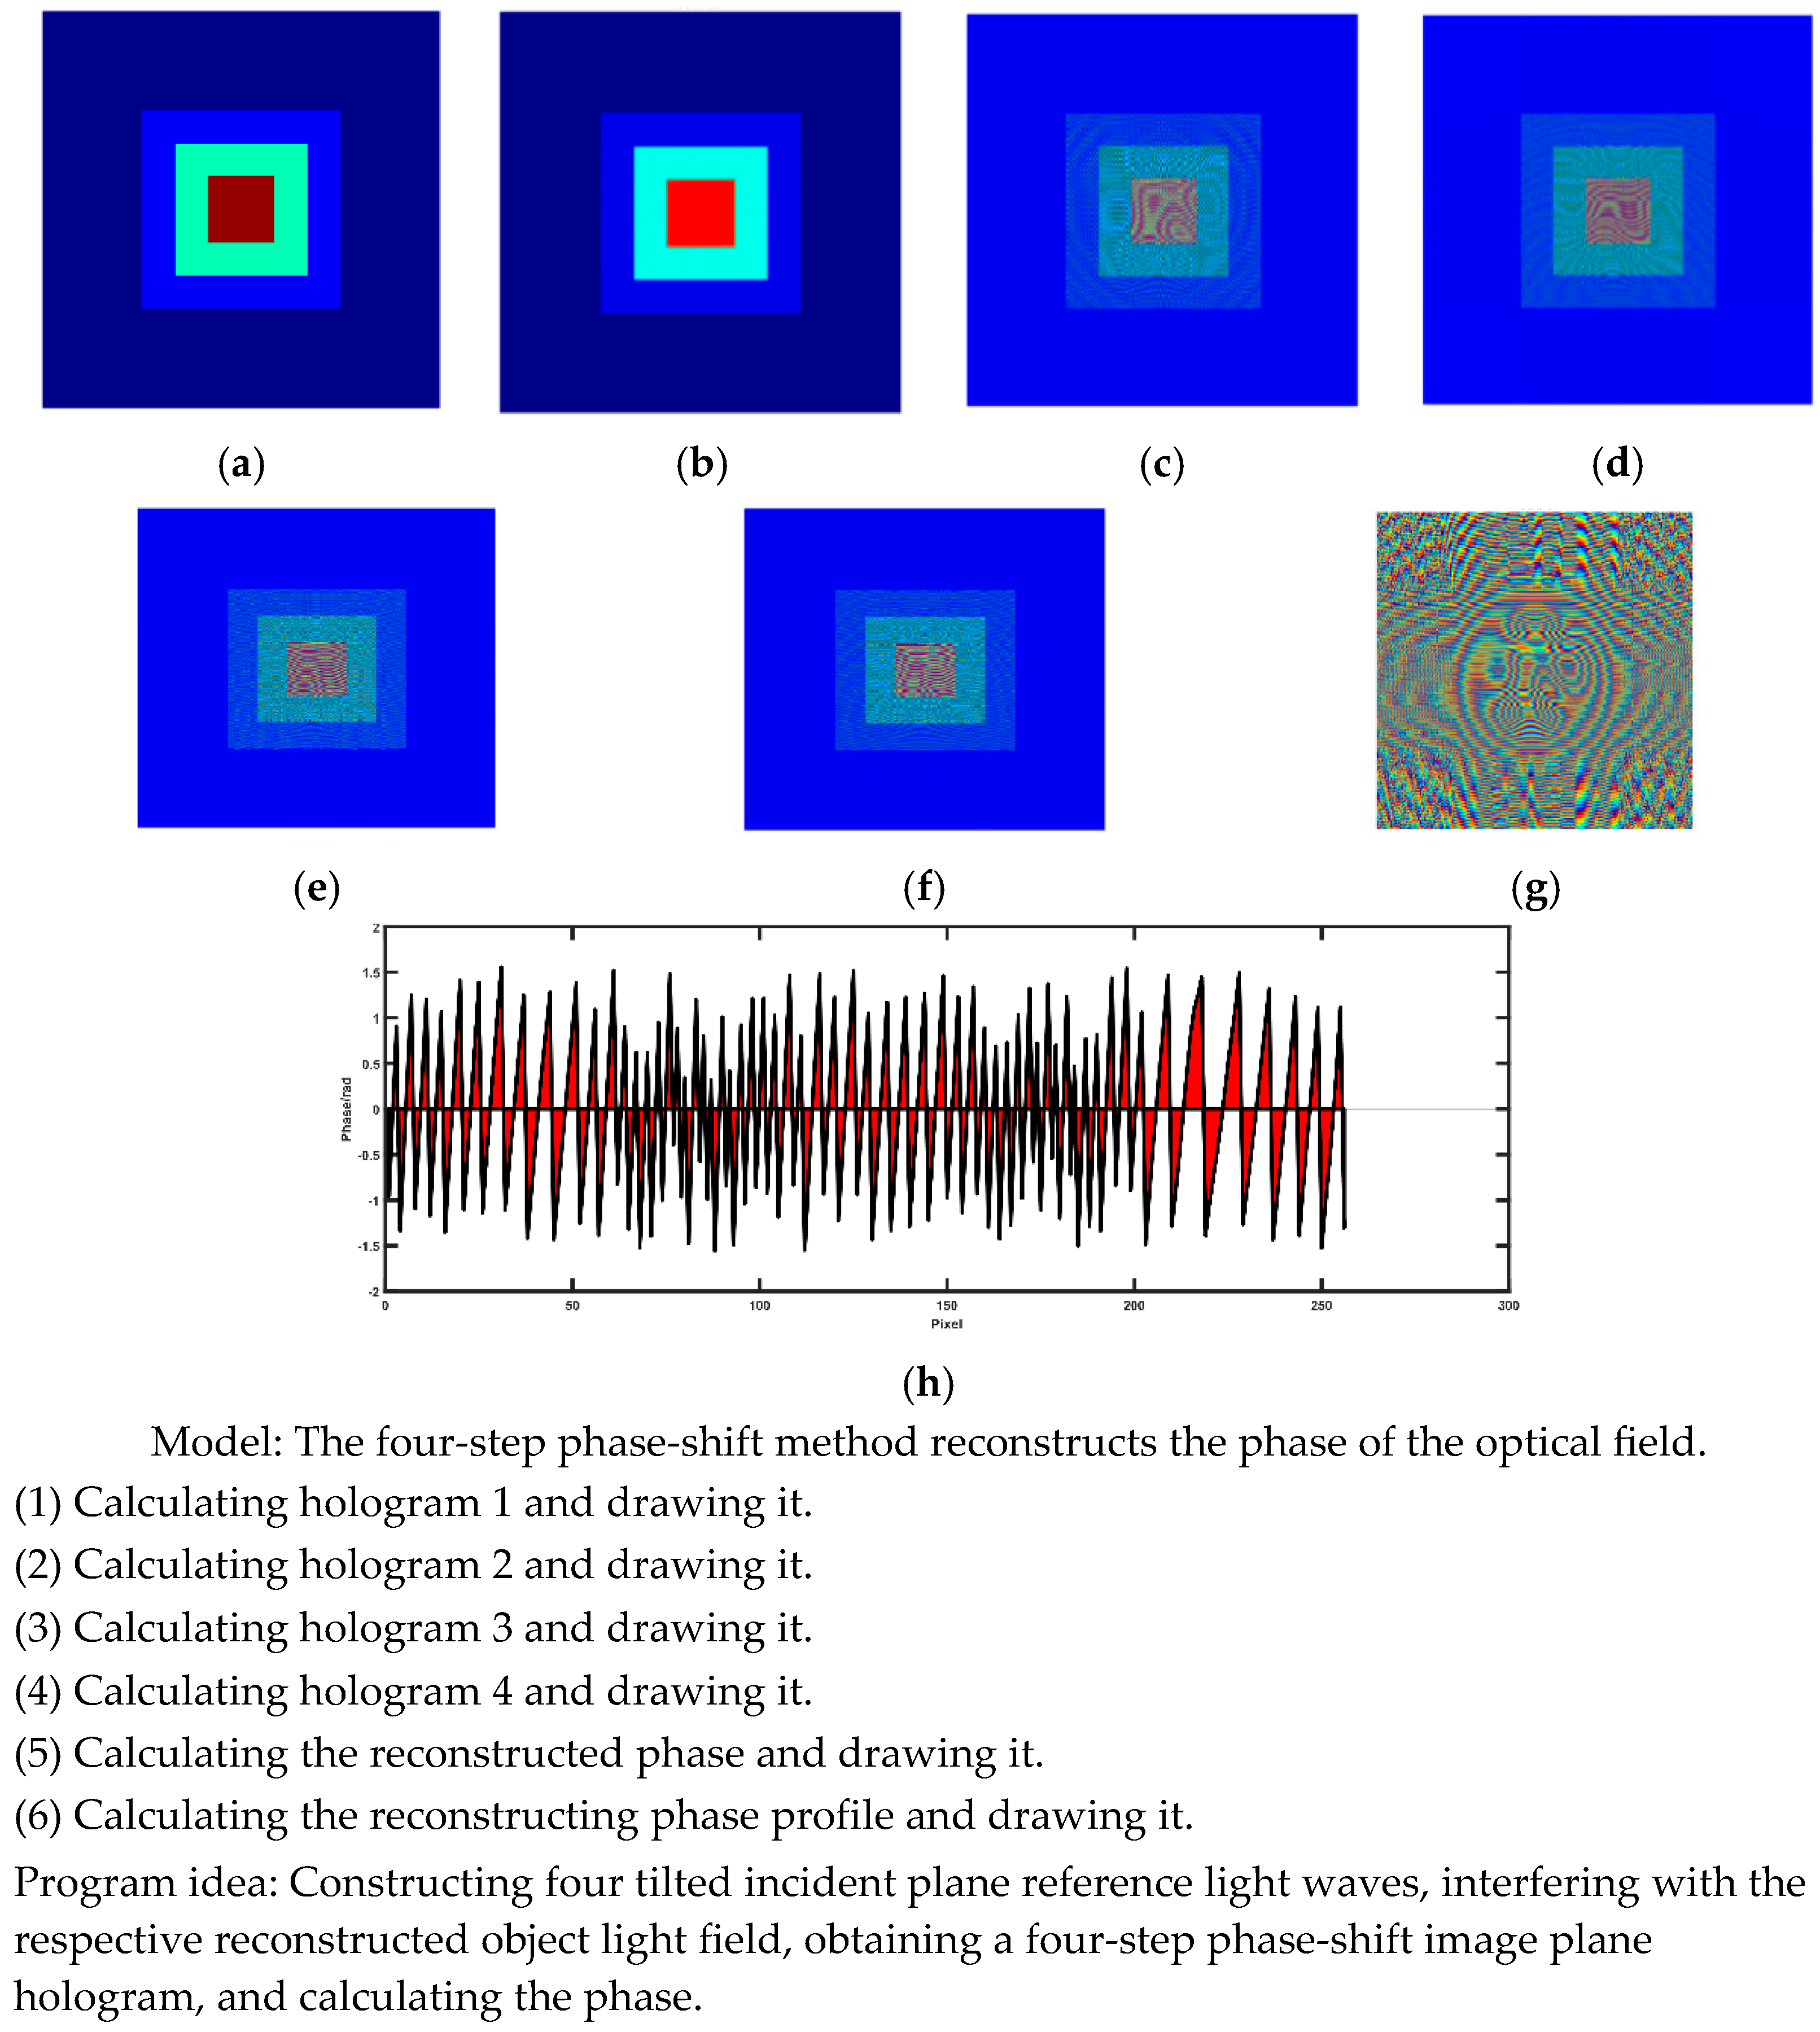
As shown in
Figure 4, the four-step phase-shift method reconstructs the phase of the optical field.
The simulation steps are as follows using MATLAB:
Step 1: Calculate the distribution of the object light field after it passes through the lens by using the single fast Fourier transform algorithm (S-FFT) algorithm (as shown in
Figure 4a);
Step 2: Complete the diffraction calculation of the light field reaching the clear imaging surface after passing through the lens, and obtain the reconstructed object light field on the image surface (as shown in
Figure 4b);
Step 3: Finally, construct four tilted incident plane reference light waves, and then interfere with the reconstructed object light field to obtain a four-step phase-shifting image plane hologram (as shown in
Figure 4c–f);
Step 4: Calculate the phase (as shown in
Figure 4g,h). As shown in
Figure 4h, the reconstructed phase profile is wrapped between
and
.
As shown in Formula (5), the wrapped phase is calculated by using the four-step phase-shifting method, which is transformed into an arctangent function. The four-step phase-shifting method usually obtains four holographic interferograms with phase shifts of 0, π/2, π, and 3π/2, respectively. The reconstruction can achieve the purpose of removing zero-order images and conjugate images after calculation.
- (2)
As shown in
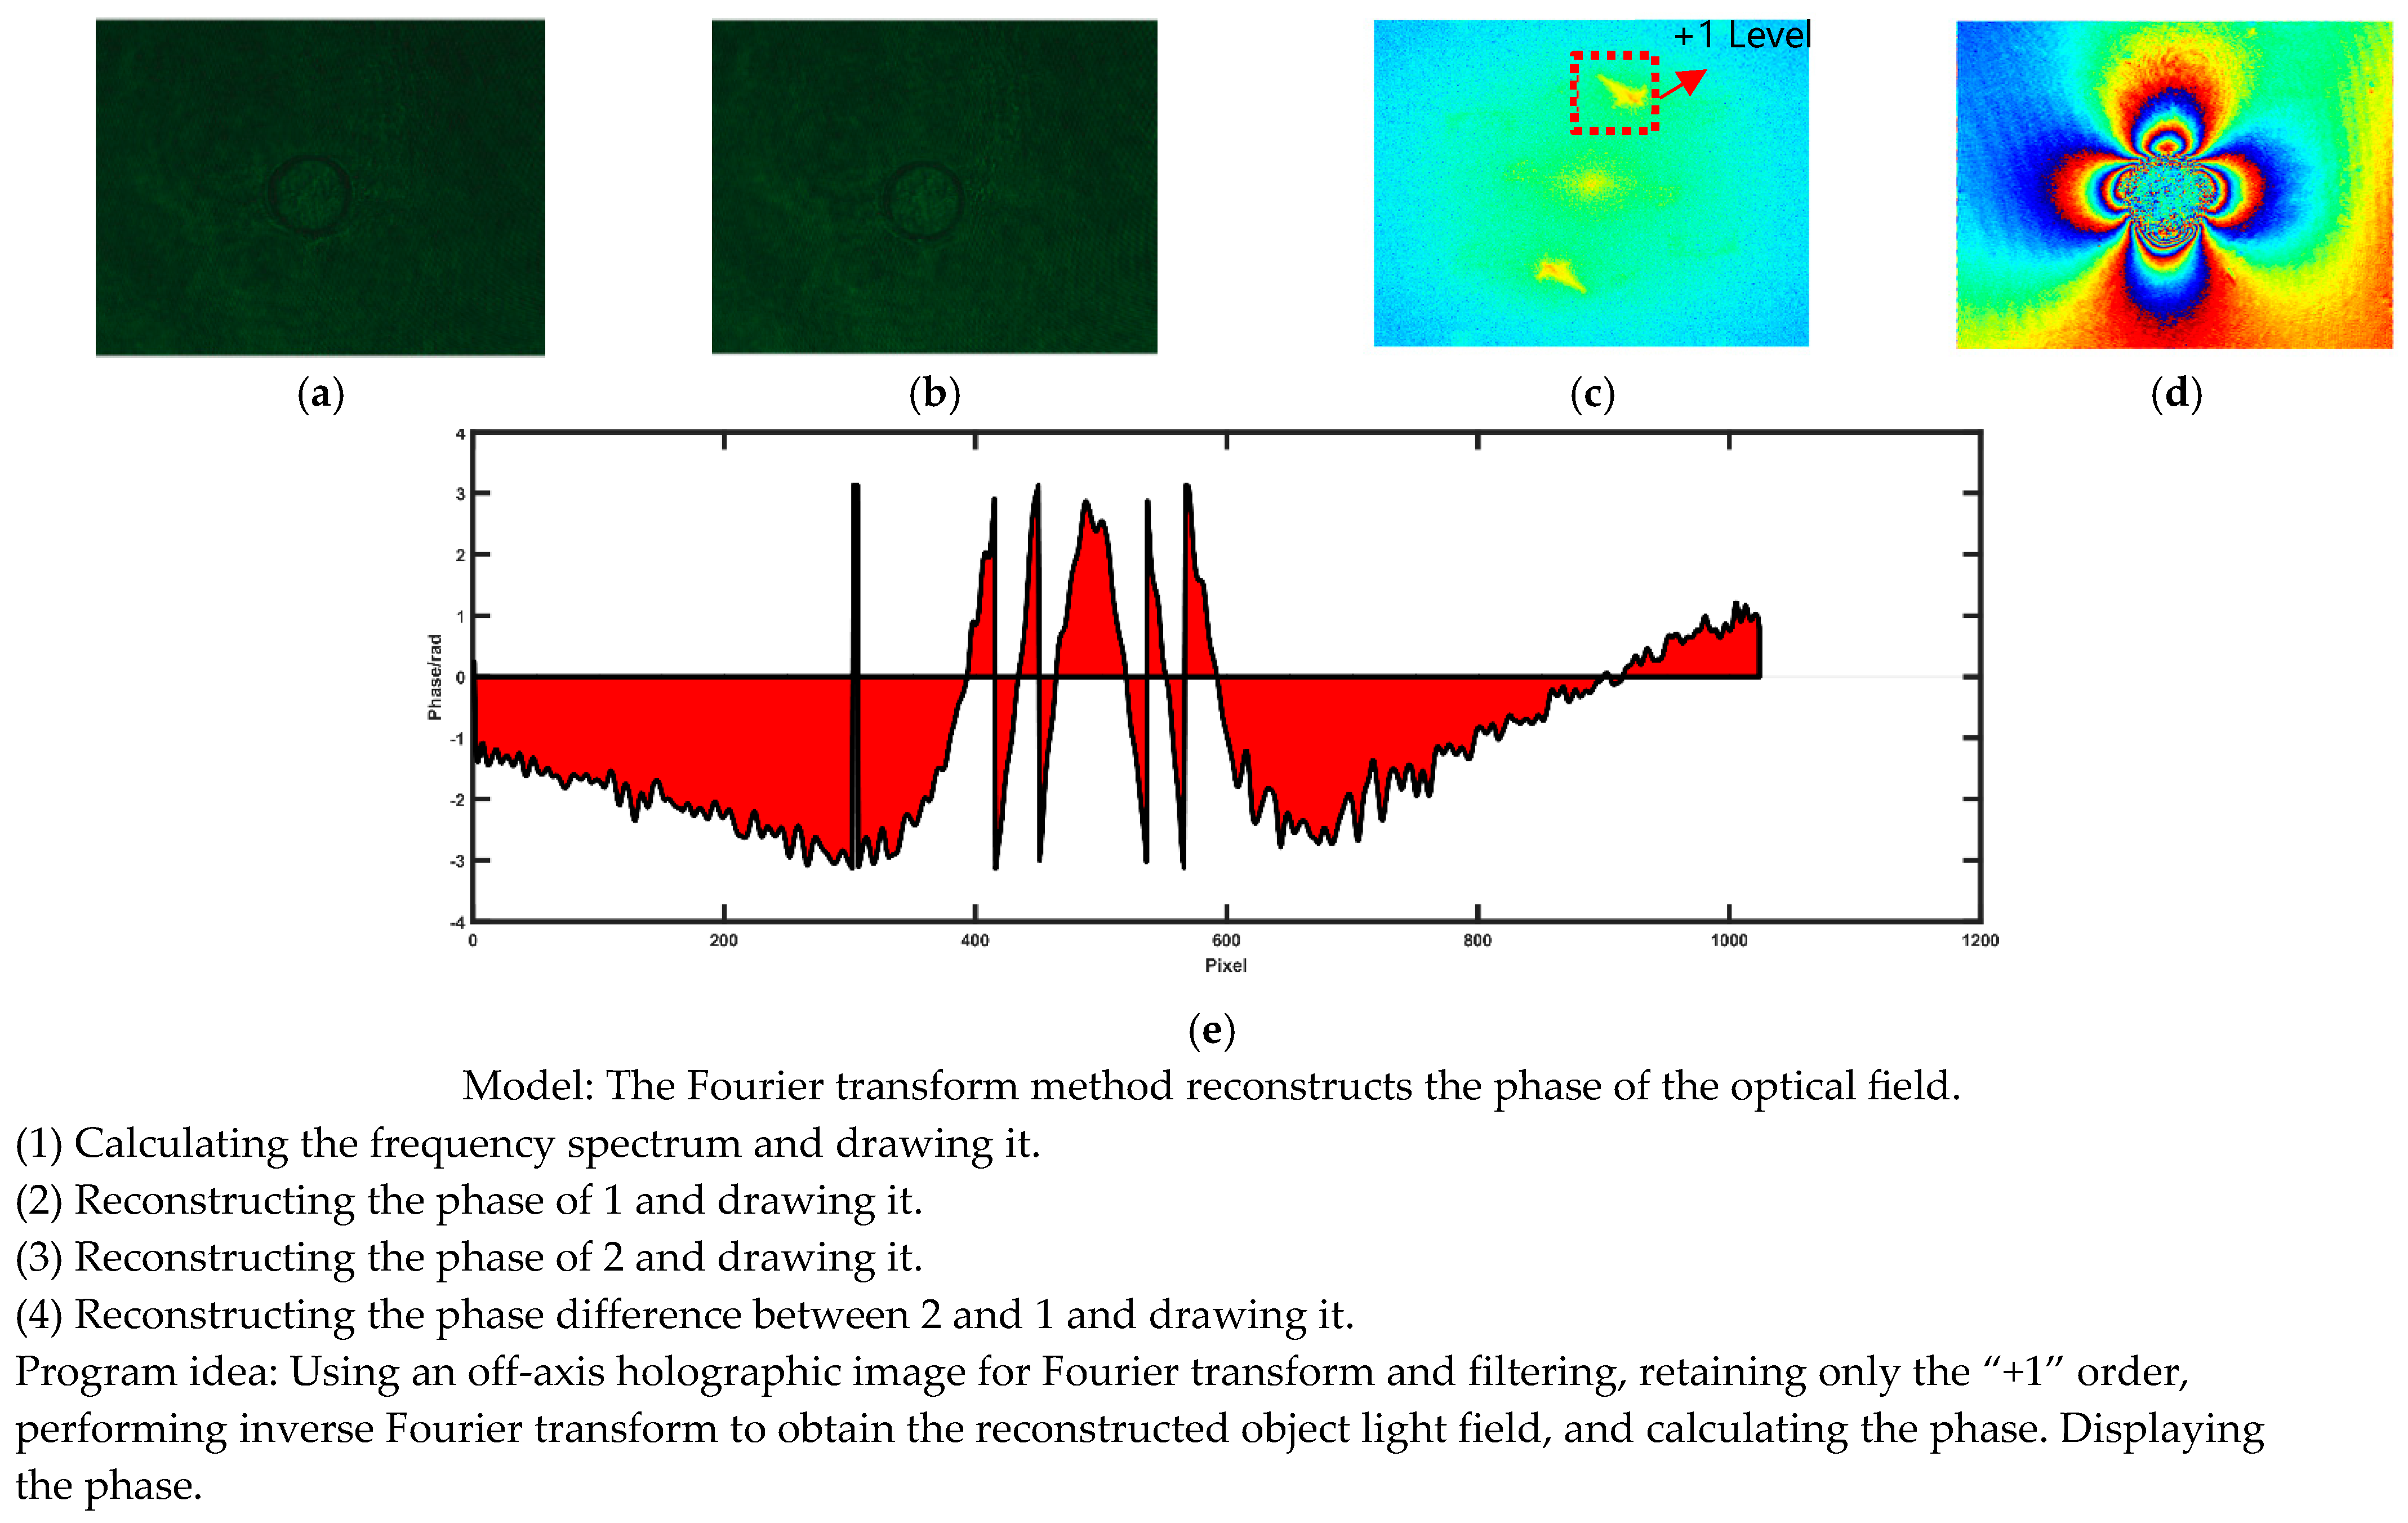
Figure 5, the Fourier transform method reconstructs the phase of the optical field.
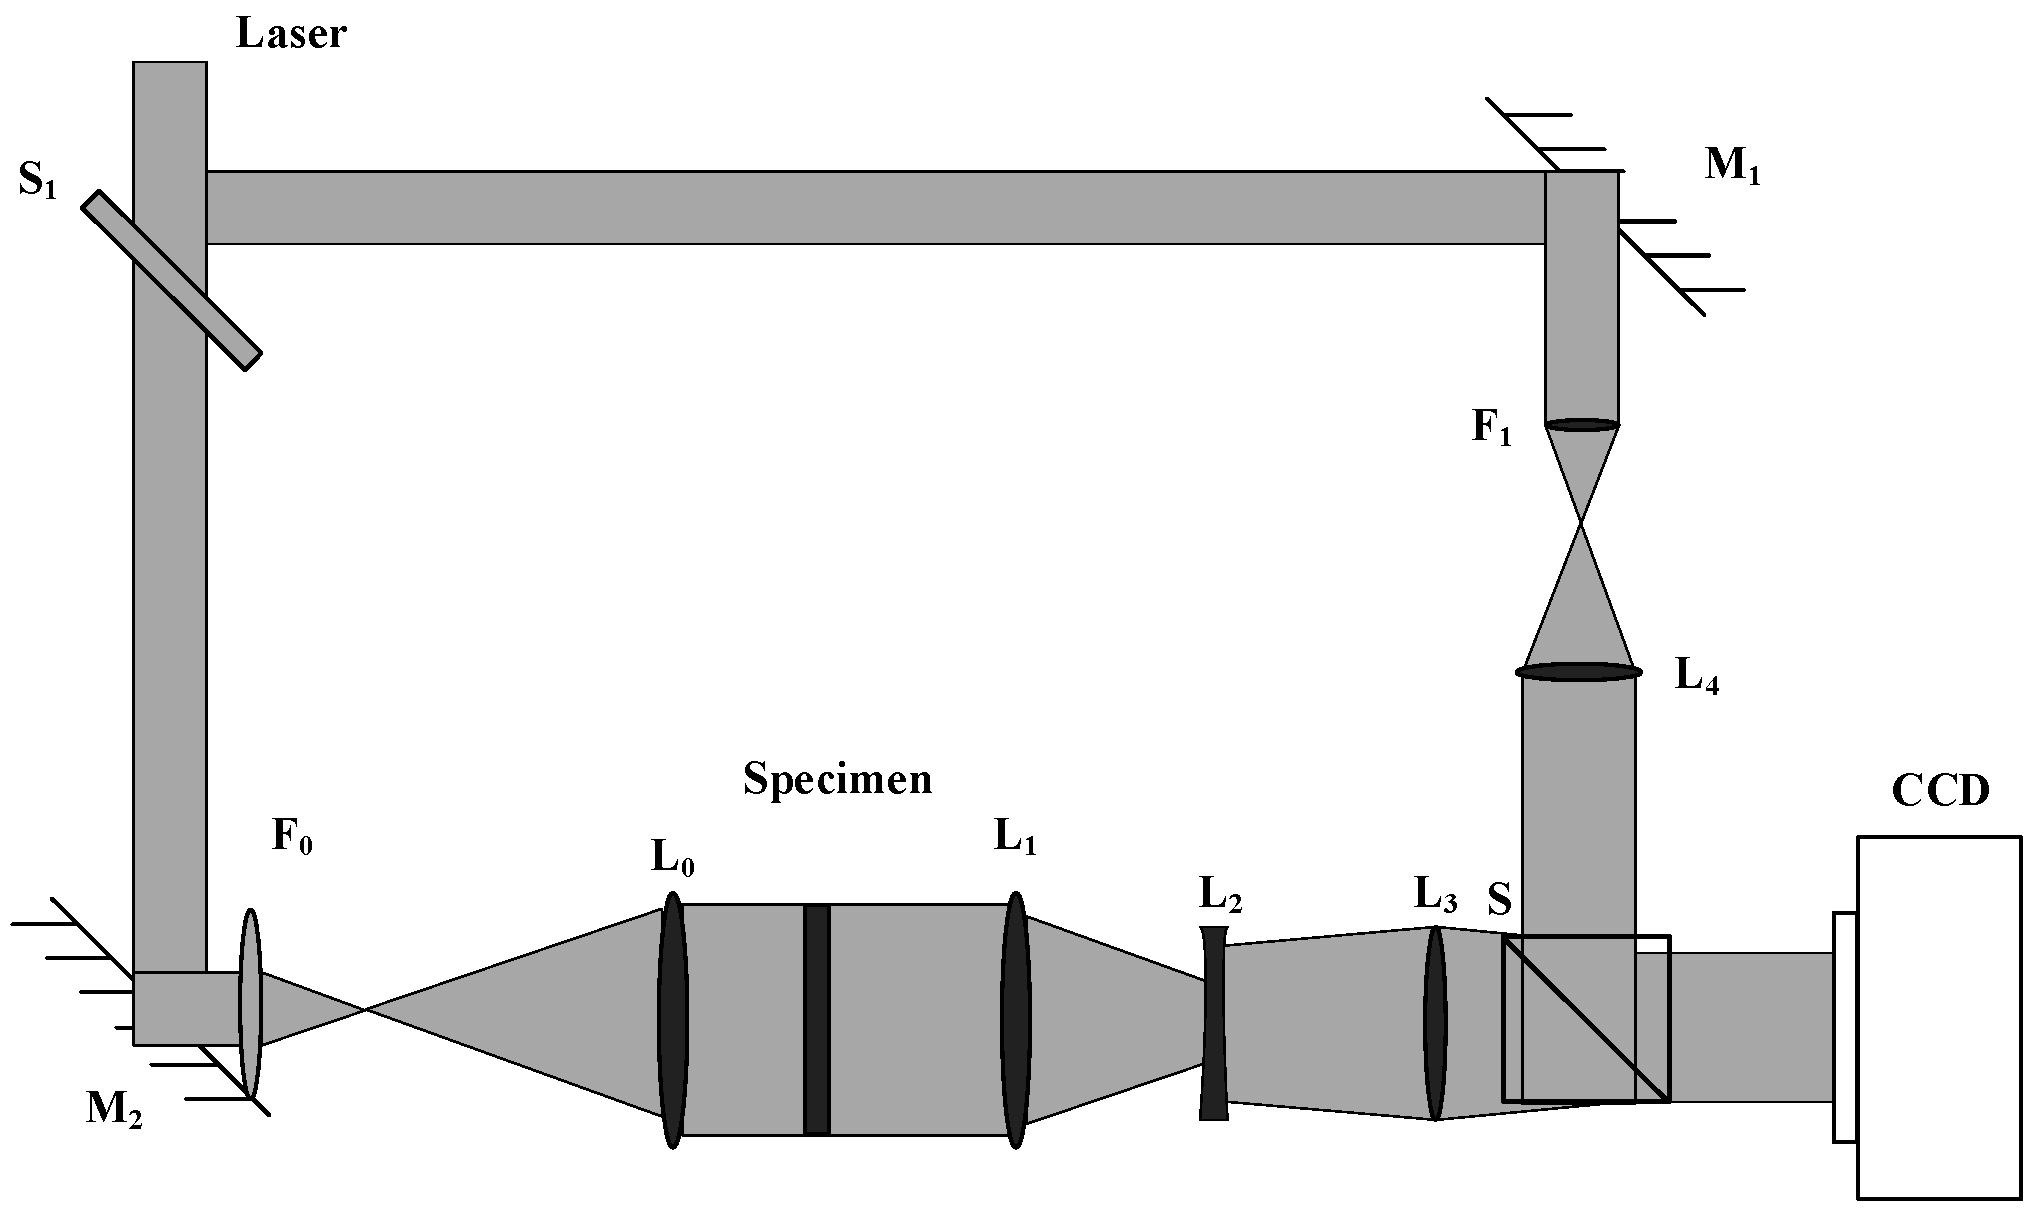
Figure 5 is a schematic diagram of the optical path for measuring the deformation of transparent objects by using a zoom system. The deformation of organic glass after being subjected to force is measured, and the experimental image is selected from the 6(a) “single-hole cavity image”. The laser beam (with a wavelength of
) is divided into an illuminating object light and a reference light through a beam splitter S
1. The illuminating object light is transformed into a plane light wave illuminating the object through a total reflection mirror M
2, lenses F
0 and L
0, and then after it passes through a zoom system composed of lenses L
1, L
2, and L
3 and a beam splitter prism S as the object light wave, it reaches the holographic recording surface. The reference light is transformed into a plane light wave through a beam-expanding system composed of lenses F
1 and L
4 after being reflected by M
1. It is used as the reference light to reach the holographic recording surface after being reflected by a beam splitting prism S. The reference light and object light interfere with each other and are captured by CCD as image plane digital holograms on the holographic recording surface. One hologram before loading and one hologram after loading were recorded separately in the experiment, and the deformation size was measured by reconstructing the phase change of the object light. After performing Fourier transform and filtering, only “+1” level images are preserved. An inverse Fourier transform is performed to obtain the reconstructed object light field, calculating the phase, and displaying the phase.
The experimental results are shown in
Figure 6.
Figure 6c shows the “+1” level image, and
Figure 6e shows the sine plot obtained by the Fourier transform method. The cross-section shows that the reconstructed phase is wrapped between
and
. As shown in Formula (10), the arctangent function is obtained through a Fourier transform. Frequency domain filtering is very important in Fourier transform phase reconstruction.
- (3)
As shown in
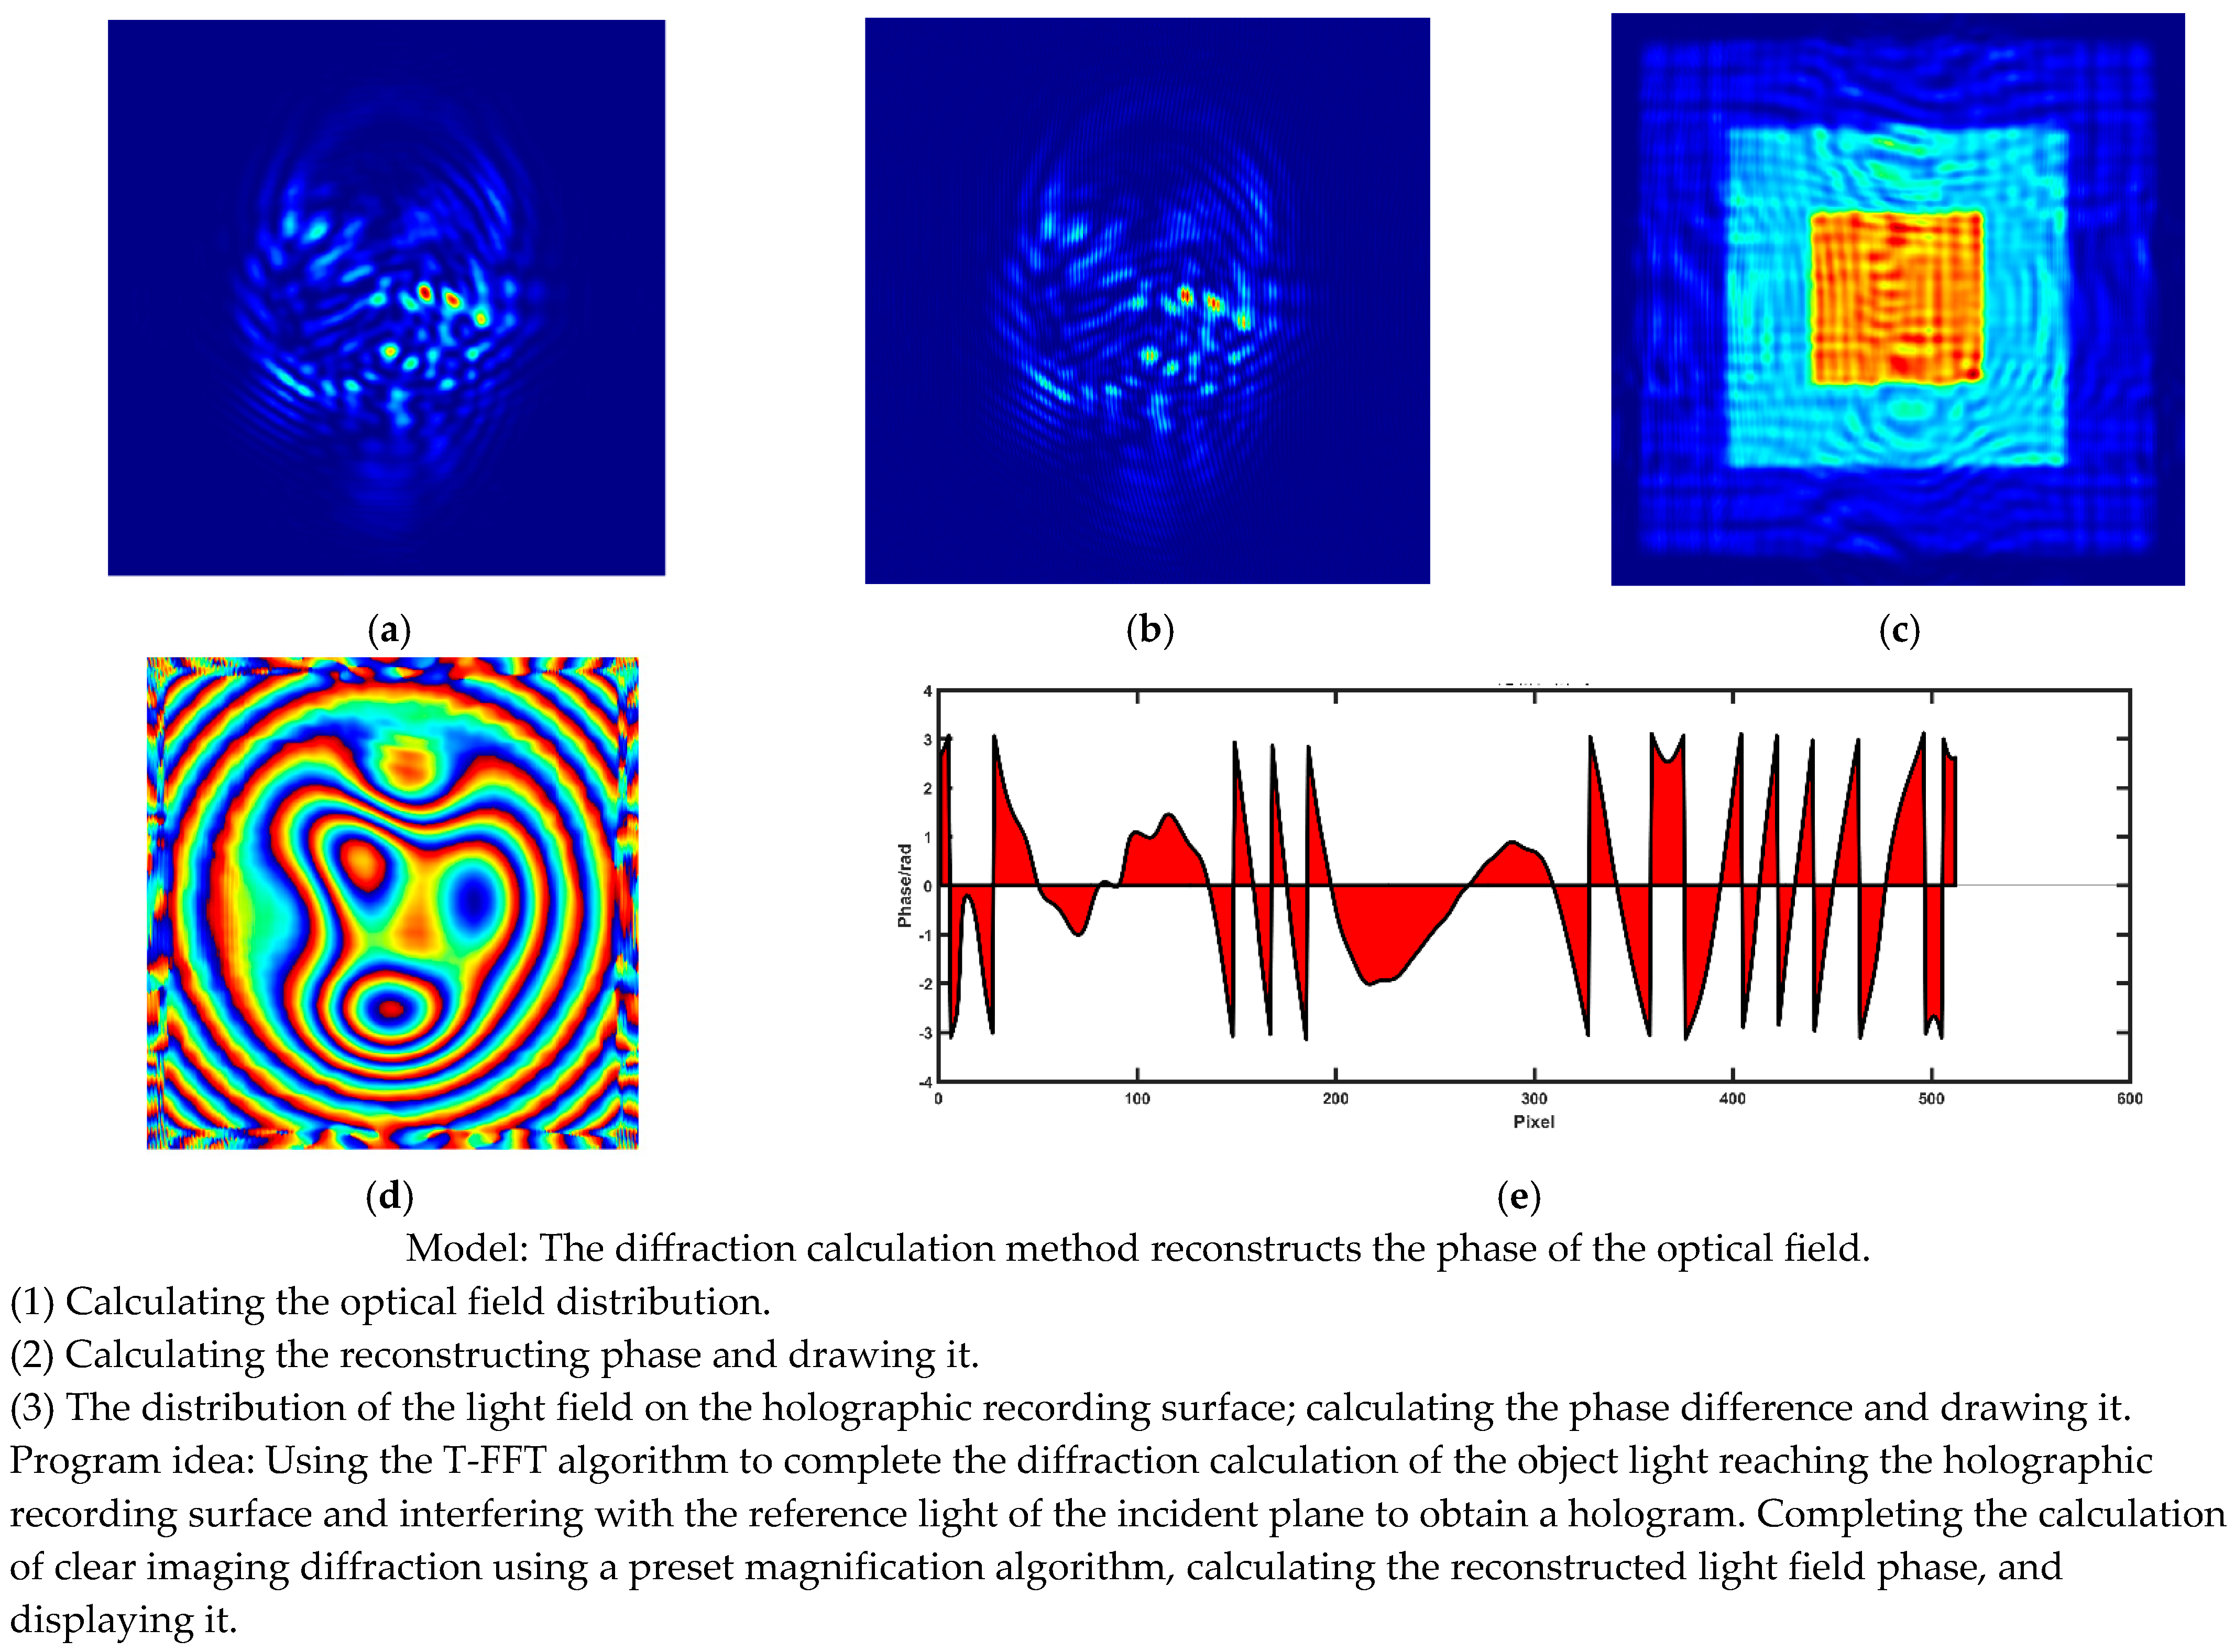
Figure 7, the diffraction calculation method reconstructs the phase of the optical field.
The simulation steps are as follows using the MATLAB software:
Step 1: Perform the diffraction calculation of the object light reaching the holographic recording surface by using the T-FFT(Triple Fast Fourier Transform) algorithm, and then interfere with the tilted incident plane reference light wave to obtain the hologram.
Step 2: Use the preset magnification algorithm to complete clear imaging diffraction calculations, then calculate the reconstructed object light field phase and display it.
Formula (13) shows the arctangent function transformed by the diffraction calculation method. The phase profile is reconstructed to display the phase wrapping between and .
There are many technologies that have applied phase unwrapping technology to a certain extent, such as computer technology, electronic imaging technology, interferometric metrology technology, holographic technology, stripe projection technology, three-dimensional contour technology, interferometric synthetic aperture radar technology, nuclear magnetic resonance imaging technology, and so on [
23,
24,
25]. The quality of the phase unwrapping algorithm directly determines whether a true phase can be obtained in digital holography. The common phase unwrapping algorithms are as follows:
- (1)
As shown in
Figure 8, the residual point search method is used to unwrap the phase.
The location of residual points is uncertain, and some areas may have a large number of residual points, while others may have fewer. The residual points are caused by noise in the simulation calculation. Its formation is partly due to the overlapping of multiple interference images during data image acquisition and partly due to the insufficient number of samples taken.
- (2)
As shown in
Figure 9, the row and column point-by-point method is used to unwrap the phase.
The noise coefficient is set to 0.5, thus adding random noise that varies from
to
in the original phase (following a uniform distribution). It can be seen that there are several black and white lines from
Figure 9b, which are caused by the influence of noise and other factors, resulting in the so-called “pulling phenomenon”. These wires form a strong contrast with the continuous phase after being unwrapped around them. The wires all occur at the residual points, causing the outline of the object to be blurry and affecting the quality of the unwrapped phase. The reason for the failure of the row and column point-by-point algorithm in the actual two-dimensional phase unwrapping process is the influence of residual points. When unpacking at this point and in nearby areas, it may result in non-uniqueness and inaccuracy of the results.
If the row unwrapping operation is completed first, then the phase unwrapping is performed column by column, and the onion cell image is reprocessed, as shown in
Figure 10; the phase obtained from holography is shown in
Figure 11.
The previous experiment was processed by first completing the columns and then unpacking the phase row by row. As shown in
Figure 12, the residual points are concentrated on the right side, and a better unwrapped phase can be obtained by comparing the experiments above.
Through
Figure 11 and
Figure 12, it is found that the calculation results are different due to the different choices of unwrapping phase by column and then by row, as well as by row and then by column.
- (3)
As shown in
Figure 13, the least squares method is used to unwrap the phase.
As shown in
Figure 13, the simulation experiment results of using the least squares algorithm were used to solve the wrapped phase.
Figure 13a,b show the wrapped phase without noise (noise coefficient equal to 0) and its unwrapping phase results, while
Figure 13c,d show the wrapped phase with noise (noise coefficient equal to 0.3) and its unwrapping phase results. Comparing the above two results, it can be seen that the least squares algorithm can obtain accurate results without noise; once there is noise, the result will be peak shaving and valley filling. The reason is that cosine or Fourier transform is required in the least squares algorithm. As long as there is noise at one point in the wrapped phase, it will inevitably propagate to other points in the two-dimensional space, resulting in errors in the unwrapping phase of all points. Therefore, accurate solutions are usually not obtained directly by using the least squares algorithm. However, because the least squares method is a global algorithm, there will be no discontinuity such as pulling wires in the phase solution. The least squares unwrapping algorithm obtains a smooth surface with continuous changes, which can effectively restore the original surface. But compared to the original surface, the vertical axis of the surface is smaller, so the surface is smoother, and the values of each point undergo a certain change, resulting in an overall smaller error. Although there are certain error points in the wrapped phase, compared with the other two methods, this algorithm can approximate the true phase value through multiple iterations and improve accuracy, as shown in
Figure 13e,f.
Compared with traditional iteration, the improved algorithm solves the following problems. During the process of unwrapping the phase, if it passes through an area of phase inconsistency, the phase error will not propagate throughout the entire space. This paper uses a data fusion algorithm to improve the least squares method iteration, and even when the noise is relatively high, the true unwrapped phase can still be obtained normally. The unwrapped phase can be compared with the true phase, which is close to the result when the external noise coefficient is 0.06, as shown in
Figure 13e,f. It can also smooth out defects in the real phase, which means that if there are spikes or steep slopes, corresponding smoothing effects can be applied. It has improved the stability and accuracy of the algorithm to some extent.
Different algorithms can only solve a certain type of problem, and the specific algorithm to be adopted should be determined based on the specific situation. Among the above algorithms, the residual point search method results in significant phase errors in unwrapping for noise, and the row and column search method will result in different results due to the difference in searching first row and then column or searching first column and then row. In the case of multiple iterations, the least squares method not only achieves simplicity and is not limited by phase quality, but it also maintains good phase continuity. When using the four-step phase-shift method for digital holographic reconstruction, not only can the accurate distribution of object light waves be obtained, but the influence of random errors and CCD noise can also be effectively eliminated. Therefore, the four-step phase-shift method is used to reconstruct the phase of the light field, and the least squares method is used with multiple iterations to solve the wrapped phase in the experimental verification stage.
4. Experimental Verification
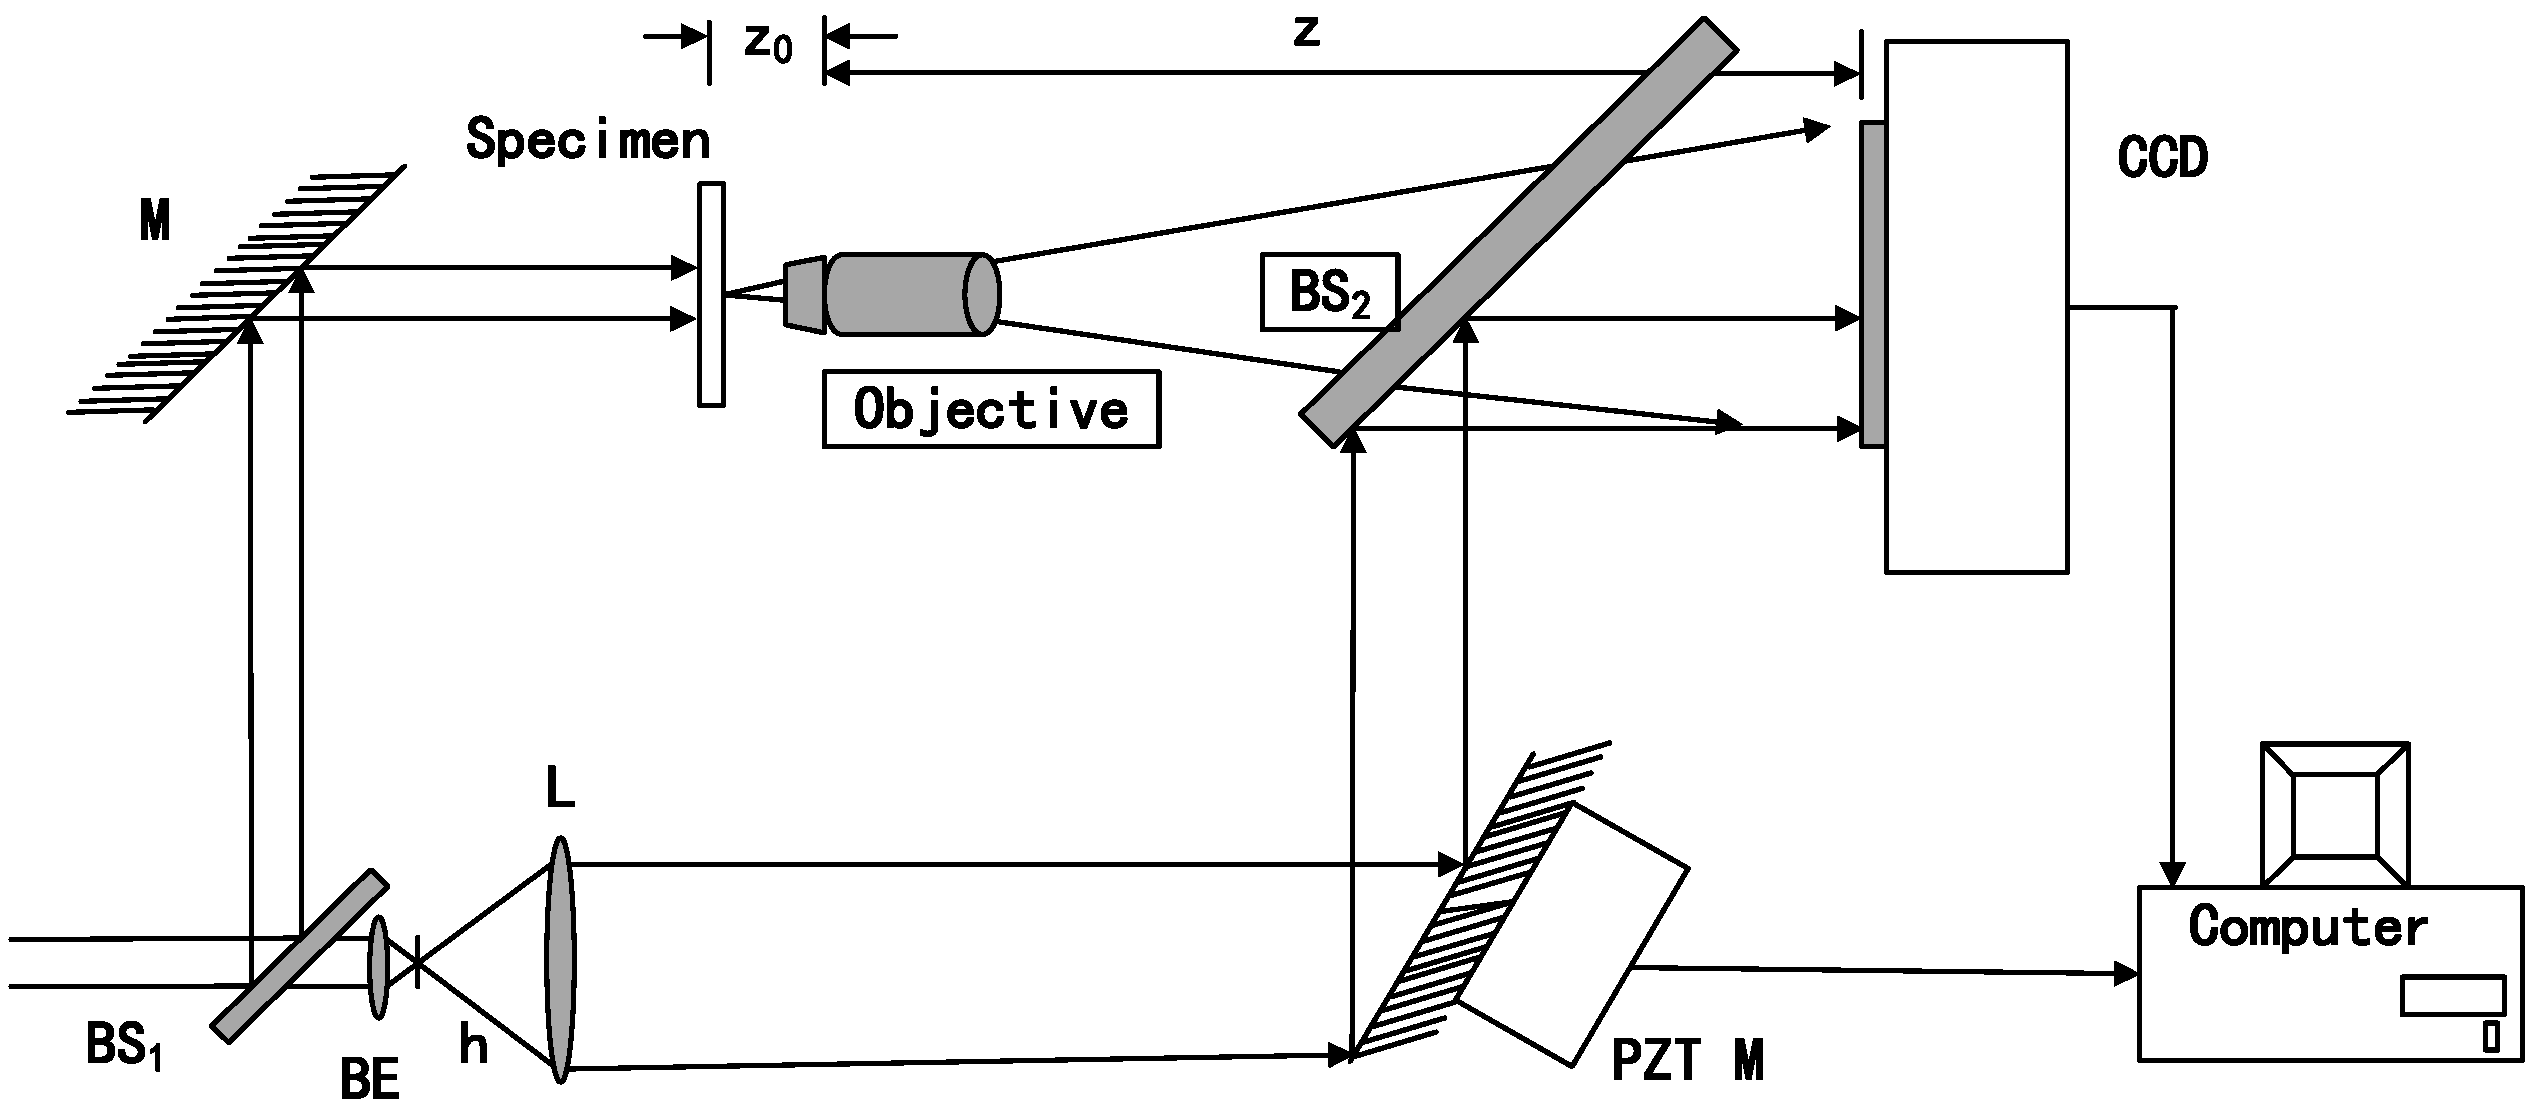
We will complete the data processing of the reconstructed object light field and reconstructed light field phase on the holographic images taken in the experiment. We will use the four-step phase-shift method for calculations. The optical path is shown in
Figure 14, which is a microscopic digital holographic optical path for observing onion cells. The He-Ne laser beam (wavelength
) is divided into two beams after passing through the beam splitter BS
1. One beam is irradiated onto the sample through the reflector M, and the microscope objective projects the transmitted light onto the optocoupler CCD. The other beam is transformed into a plane beam through the collimator L after passing through the beam expanding lens BE and the pinhole filter h. The reflection mirror PZT M and beam splitter BS
2 driven by piezoelectric ceramic tubes are reflected onto the CCD as the recording reference light. In the experiment, the precise phase of PZT was controlled by a computer, and four holograms were recorded. The reconstructed phase was calculated using Formula (5).
The hologram and reconstructed phase obtained through MATLAB simulation are shown in
Figure 15.
Figure 15a–d are four-step phase-shifting holograms, I1~I4;
Figure 15e represents the reconstructed phase; and
Figure 15f is the reconstructed phase profile showing that the reconstructed phase is wrapped between
and
.
From the simulation results in
Figure 15f, it can be seen that the four-step phase-shift method can effectively solve the phase information of the sinusoidal fringe pattern even in the presence of certain noise, thereby calculating the accurate absolute phase. By using the phase-shifting fringe patterns reflected by the reflection mirror PZT M and the beam splitter BS
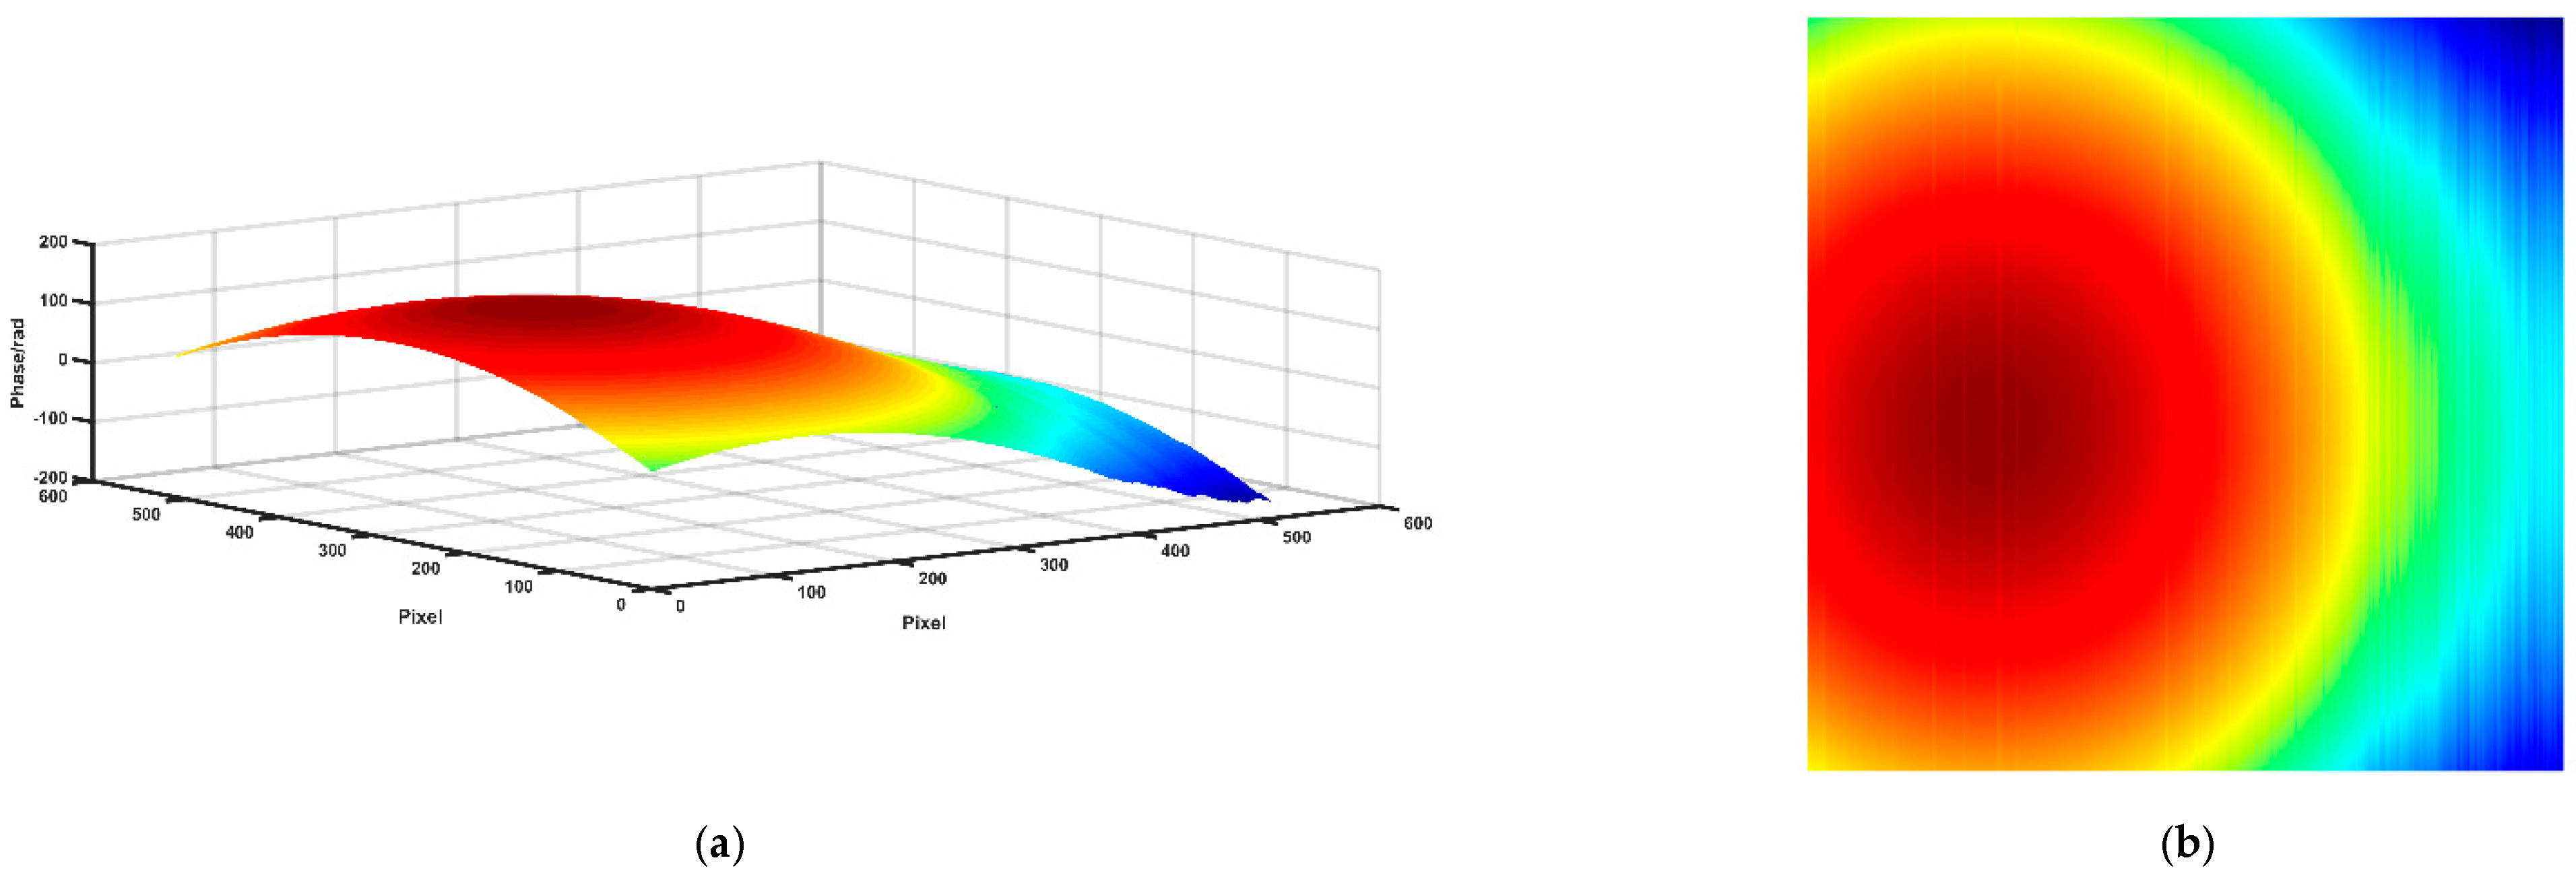
2 onto the CCD, it can be seen that by using the least squares method to iteratively unwrap the phase, only four phase-shifting fringe patterns are needed to unwrap the phase, and to finally obtain the three-dimensional phase information of the object, as shown in
Figure 16b. It can be seen that despite noise and undersampling, the obtained unwrapped phase is still continuous from
Figure 16b. By comparing
Figure 16b with
Figure 12, it can be seen that the least squares method has a significant smoothing effect after multiple iterations.
