Article

Bessel-Beam Single-Photon High-Resolution Imaging in Time and Space

1
State Key Laboratory of Precision Spectroscopy, East China Normal University, Shanghai 200241, China
2
Collaborative Innovation Center of Extreme Optics, Shanxi University, Taiyuan 030006, China
*
Author to whom correspondence should be addressed.
Photonics 2024, 11(8), 704; https://doi.org/10.3390/photonics11080704
Submission received: 17 June 2024 / Revised: 16 July 2024 / Accepted: 26 July 2024 / Published: 29 July 2024
(This article belongs to the Special Issue Photonics: 10th Anniversary)

Abstract

:
Synchronous laser beam scanning is a common technique used in single-photon imaging where the spatial resolution is primarily determined by the beam divergence angle. In this context, Bessel beams have been investigated as they can overcome the diffraction limit associated with traditional Gaussian beams. Notably, the central spot of a Bessel beam retains its size almost unchanged within a non-diffractive distance. However, the presence of sidelobes in the Bessel beam can negatively impact spatial resolution. To address this challenge, we have developed a single-photon imaging system with high-depth resolution, which allows for the suppression of echo photons from the sidelobe light in the depth image, particularly when their flight time differs from that of the central spot. In our LiDAR setup, we successfully achieved high-resolution scanning imaging with a spatial resolution of approximately 0.5 mm while also demonstrating a high-depth resolution of 12 mm.

1. Introduction

Laser detection and ranging based on single-photon detection (single-photon LiDAR) represents a valuable technique for capturing three-dimensional structure and reflectivity, particularly in scenarios involving a weak echo light with few photons per pixel. This approach finds significant applications across various fields, including terrain and geomorphology surveying [1,2,3], medical imaging [4,5,6], target detection and recognition [7,8,9], surface defect detection [10,11,12], and so on. Resolution stands as a crucial parameter influencing the effectiveness of these applications. Specifically, depth resolution is determined by the total time jitter of the system. Additionally, in scanning single-photon LiDAR, transverse resolution primarily hinges on the size of the laser spot on the target surface, while in staring single-photon LiDAR, it depends on the pixel pitch of the single-photon detector array.
Multi-sensor fusion, which integrates LiDAR and camera [13,14,15], is a widely utilized approach that leverages the complementary advantages of these two sensor types. Despite its benefits, this method necessitates precise calibration of the spatial coordinate system and is not applicable in low-light conditions. In long-distance applications, scanning collimated beams are commonly employed to minimize the size of the laser spot and enhance transverse resolution. However, current LiDARs generally use Gaussian beam lasers, and the inherent diffraction of Gaussian beams limits their transverse resolution. To address this limitation, various techniques have been developed to improve the transverse resolution of scanning LiDARs. Fine sub-pixel scanning [16,17] has been proven effective in enhancing resolution by precisely shifting the imager below the pixel scale to capture a series of low-resolution images. These images are then combined using computational methods to generate a high-resolution image. Reference [18] reported a transverse resolution of approximately 5.5 cm at a range of 8.2 km, roughly twice the system’s resolution achieved through fine sub-pixel scanning. Nevertheless, further enhancements in resolution require reducing the size of the laser spot on the target. An intriguing approach involves minimizing the spot size by replacing traditional Gaussian beams with approximately non-diffractive beams, a technique initially applied in microscopic imaging [19]. More recently, Bessel beams have been implemented in a single-photon LiDAR to enhance imaging signal-to-noise ratio and resolution, particularly in challenging environments such as dense fog or underwater scenarios [20,21].
These benefits are attributed to the fact that the central spot of the Bessel beam remains approximately unchanged within the non-diffractive range. However, the central spot is accompanied by multiple concentric ring sidelobe lights and is much larger in size than the central spot, making it difficult to fully utilize non-diffraction characteristics to improve imaging resolution. In this paper, we present a high-depth resolution single-photon LiDAR designed to eliminate echo signals of the sidelobe light, particularly when they exhibit small differences in flight time. Our approach aims to facilitate high-resolution single-photon imaging in three dimensions.

2. The Bessel-Beam Single-Photon Imaging System with Picosecond Resolution

The schematic diagram of the Bessel-beam single-photon imaging system is shown in Figure 1. A 532-nm picosecond pulsed laser with a single pulse energy of 0.78 nJ and a repetition frequency of 10 kHz is employed. The pulse width of the picosecond laser is 23.0 ps. The diameter of the laser beam is approximately 0.8 mm. The linear polarization ratio of the laser source is about 99%. The laser beam first passes through a half-wave plate to rotate the polarization direction to the horizontal polarization direction. Then a polarization beam splitter cube (PBS) with an extinction ratio of greater than 1000:1 is utilized to separate the outgoing laser and the echo light to achieve a coaxial optical structure. Subsequently, it undergoes expansion via a beam expander with a magnification factor of 20× and conversion from a Gaussian beam into a Bessel beam via a diffraction axicon. The total average power of the entire outgoing Bessel beam is 6.63 μW, with the central spot energy accounting for 17.5%. A small portion of the laser in vertical polarization is directed toward a pin photodiode to generate the synchronization signal for the laser pulses. This synchronization signal is connected to a time-to-digital converter (TDC) as the “start” signal for the time interval measurement. Then, a dual-axis galvanometer scanner is utilized to scan the laser beam. The laser beam irradiates the target surface and the echo light returns along the original path. As the diffuse light is randomly polarized, the echo light in horizontal polarization is transmitted through the PBS. Simultaneously, the echo light in vertical polarization is reflected through a narrowband filter and focused into a single-photon avalanche photodiode (SPAD)-based single-photon detector. The detection efficiency of the homebuilt SPAD is about 40% at 532 nm. The output signal of the SPAD is connected to the TDC as the “stop” signal to measure the time interval between the “start” signal and the “stop” signal.
The Bessel beam can be mathematically described using the nth-order Bessel function. It exhibits a central spot surrounded by concentric rings, resulting from the interference of plane waves with wavevectors derived from a conical surface. The central spot of the Bessel beam does not significantly spread out over long distances, while the sidelobes ensure that the light intensity remains well-distributed even if the beam is partially obstructed during propagation. In our experiment, a diffraction axicon [22], which is a type of diffraction optical element, was employed to transform a Gaussian beam into a Bessel beam. The surface of the DOE is etched with periodic micro/nano structures, designed to induce diffraction of incident light. The initial Gaussian beam has a diameter of approximately 16.1 mm. The diffraction axicon used in our setup possesses a tiny physical angle of 1 mrad, which is challenging to achieve with traditional axicons. The non-diffractive distance of the Bessel beam extends up to 17 m according to
z max d 2 ( n 1 ) γ
Here, d is the diameter of the incident Gaussian beam, n is the refractive index at 532 nm, and γ is the physical angle of the diffraction axicon.
The spatial distribution of the Bessel spot, shown in Figure 1b, illustrates equal intensity across the central spot and each concentric ring. The overall spot size of the outgoing Bessel beam is about 18 mm. At a distance of 14.3 m, the diameter of the central spot of the Bessel beam measures 0.5 mm, indicating an impressive spatial resolution of 35 µrad. The diameters of the first to fifth sidelobes are 1.66 mm, 2.95 mm, 4.2 mm, 5.45 mm, and 6.53 mm, respectively. The average power of the central spot is 1.16 μW. In comparison, the resolution of a Gaussian beam scanning system is only 0.43 mrad, determined by the minimal diameter of a collimated Gaussian laser beam ~ (16λL/π)1/2 where λ and L are the laser wavelength and the propagation distance, respectively. For the Gaussian beam with a beam diameter of 0.5 mm, excellent imaging effects can be obtained without interference from sidelobes. However, the Rayleigh distance of a 0.5 mm Gaussian beam is less than 1.5 m, which is not very suitable for LiDAR systems. Thus, compared with the traditional Gaussian beam scanning imaging system, the spatial resolution of the Bessel-beam scanning imaging system is significantly improved within the non-diffracting transmission distance range.
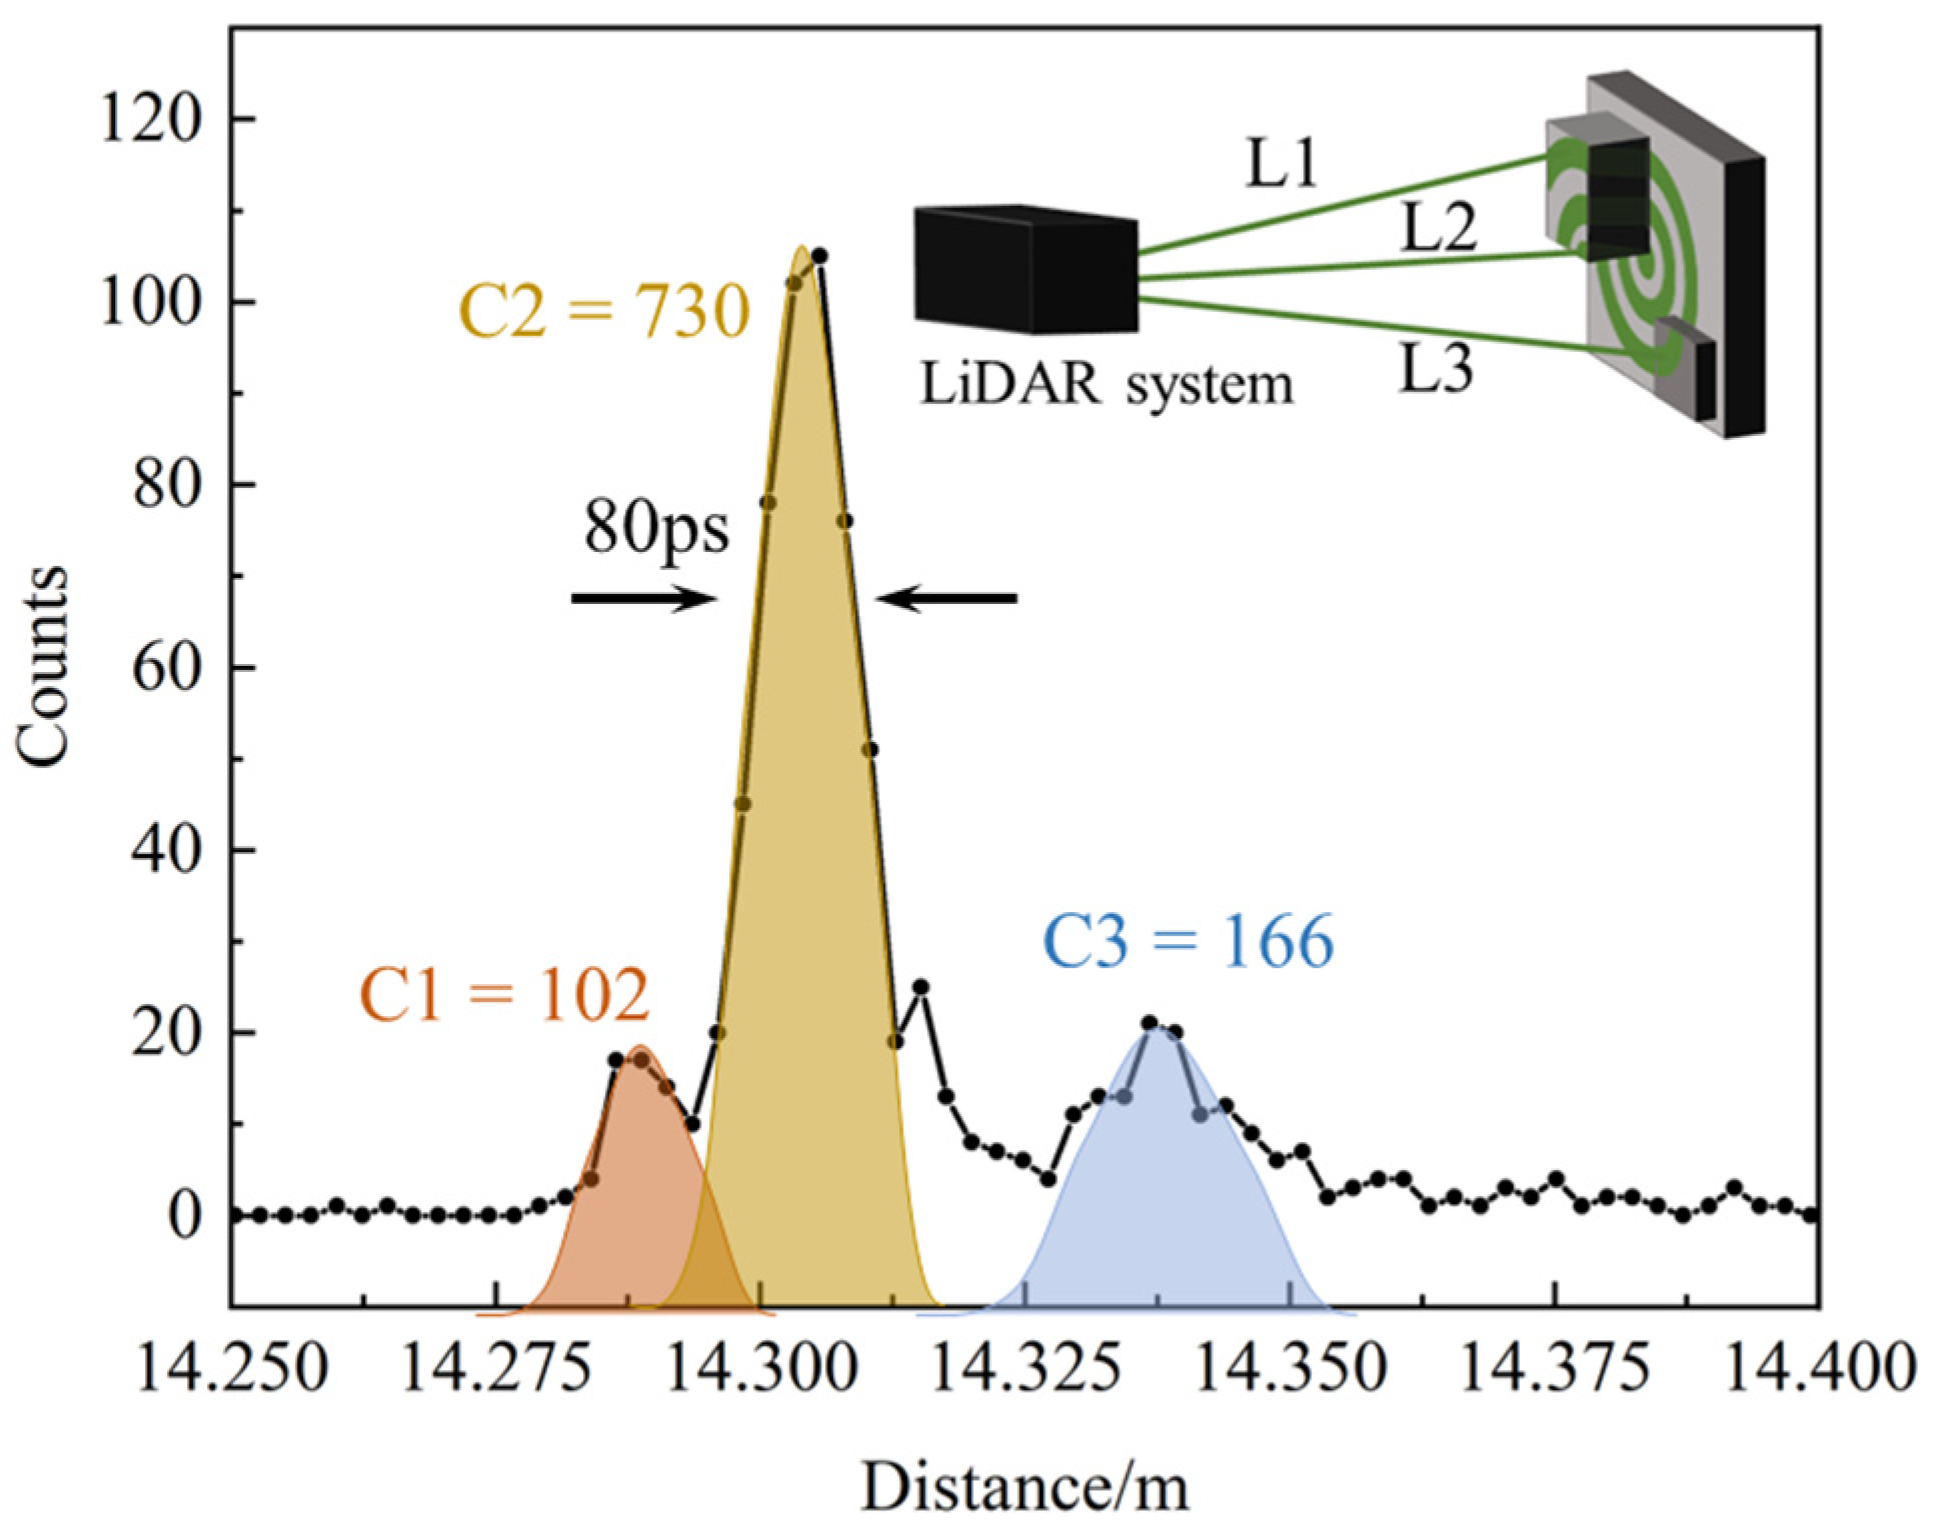
As shown in Figure 2, the total time jitter of the single-photon LiDAR is observed to be approximately 80.0 ps (FWHM, full width at half maximum), with a corresponding depth resolution of 12.0 mm. When the Bessel spot illuminates on a target surface exhibiting significant vertical depth variation, the echo light from the sidelobe light originates from different depths on the target surface. Although the energy of the central spot and the sidelobes of the Bessel beam are equal, the energy density of the central spot is higher. This results in a larger number of echo photons from the central spot compared with the sidelobes, as demonstrated in Figure 2. Figure 2 illustrates an optical path difference between the Bessel center spot and sidelobe laser ranging. This path difference between L1, L2, and L3 could be calculated precisely using a high-resolution laser ranging system. The minimum measurable optical path difference depends on the total time jitter of the system. By combining echo intensity information and optical path difference, echo signals from the center spot and the sidelobe can be distinguished, thereby eliminating sidelobe influence and improving imaging resolution. Consequently, for scanning single-photon imaging systems, particularly where the depth of the target surface varies substantially, the probability of echoes from the central spot is much higher than that of the sidelobe light. Therefore, the majority of echoes from the sidelobe light can be effectively eliminated over time by utilizing a high-resolution detection system. As a result, the transverse spatial resolution of the Bessel-beam scanning imaging system is primarily determined by the size of the central spot.

3. Results and Discussions

In the experiment, a dual-axis galvanometer scanner was employed to conduct continuous scanning of the Bessel beam. Specifically, the driving signal for the X-axis (GM-x) is a triangular wave signal with an amplitude of 21 mv and a frequency of 20 Hz, and for the Y-axis (GM-y), they are 21 mv, 500 mHz. Therefore, the scanning field of view covered an area of 20 mrad × 20 mrad, and the depth images with high point cloud density were obtained by conducting slow scanning.
Figure 3a shows the original depth image of the target acquired by the system, in which the color indicates the distance corresponding to the color map on the right. Although the outline of the target could be seen from the original depth image, for high-resolution imaging, noise in the image will affect the recognition resolution and interfere with the effective extraction of the size of the targets. Therefore, the original point cloud image was denoised using voxel-based spatial filtering [23]. By setting different denoising thresholds, the noise has been removed effectively, making the outline of the target clearer and more obvious. As shown in Figure 3b–f, as the threshold increases, noise becomes less but effective point clouds also decrease, which is not conducive to accurately obtaining the actual target size. Therefore, in subsequent data processing, we set the threshold to 20, which can both reduce noise and maximize the preservation of effective point cloud images.
Figure 4 shows the depth images with varying measurement times by adjusting the scanning frequency of GM-y, and the echo photon was approximately 4.25 photons per pulse. After voxel-based spatial filtering, these depth images exhibit a high spatial resolution. And the detailed structure of the target could be clearly distinguished when there are enough echo photons.
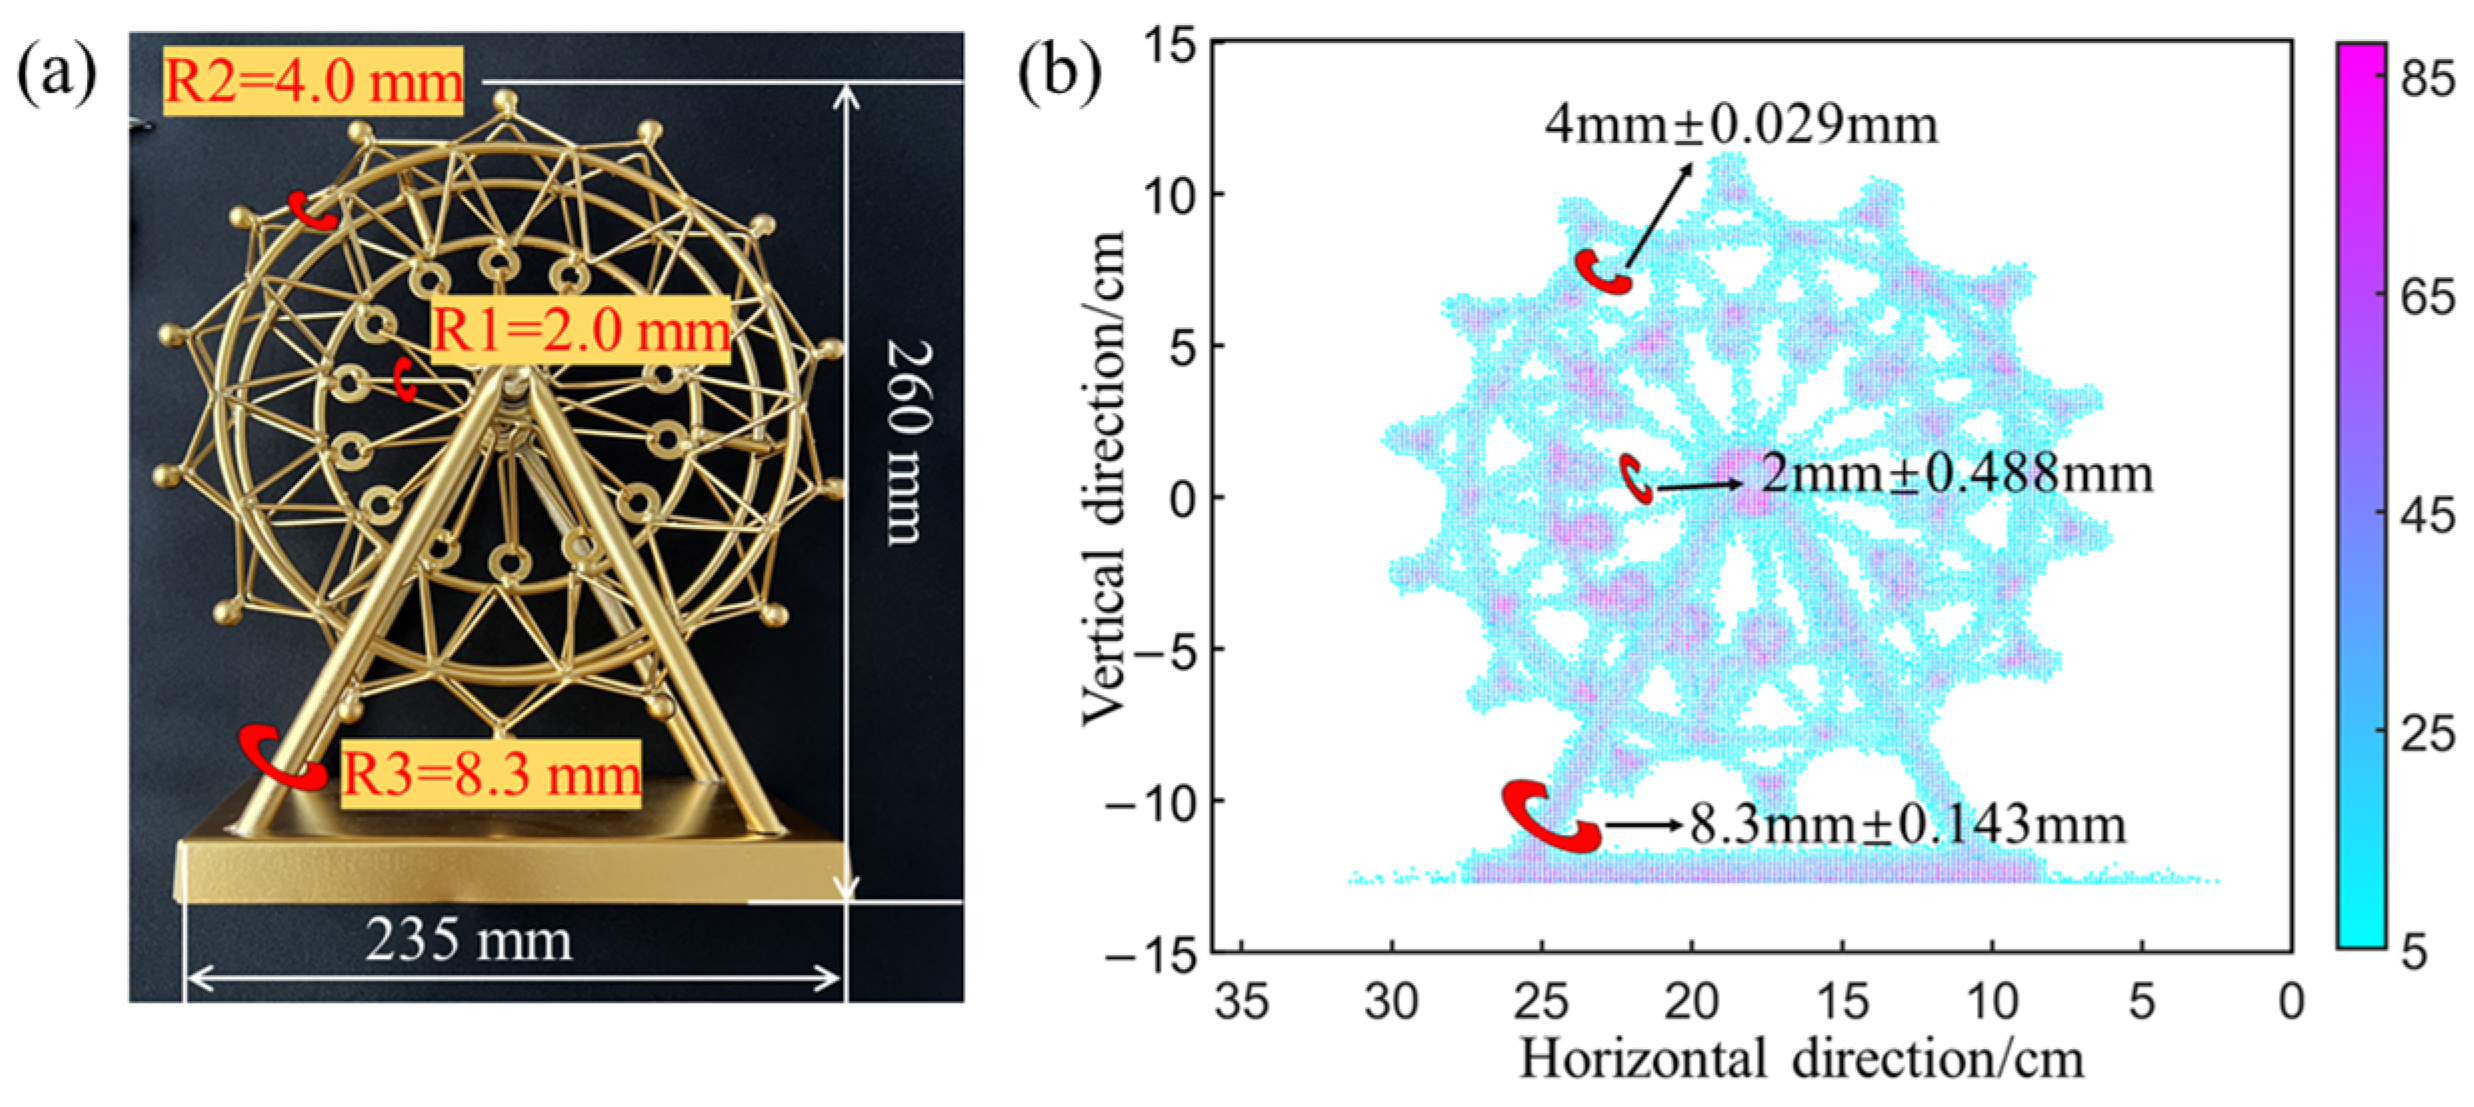
Figure 5 shows the grayscale image of the target with a measurement time of 1000 s, corresponding to the distance image in Figure 4a. In the grayscale image, brightness directly correlates to the variation in the strength of reflected light from each point on the target, significantly enhancing the clarity and recognition of target feature information. By reading the coordinates of contour edge points and using the distance formula between two points, key dimensional information of the target object was calculated, including diameters of concentric rings of iron wire, thinner iron wire, and pillar diameter. To reduce random error impact on the measurement, 10 independent data sets were read to ensure maximum accuracy and reliability of data. Figure 5 annotates the error between the true dimensions of certain critical structures and the target size read from the grayscale image. Structures with diameters of 2.0 mm, 4.0 mm, and 8.3 mm were selected for exhibition, with corresponding measurement errors of 0.488 mm, 0.029 mm, and 0.143 mm, respectively. Given the central spot diameter illuminated on the target surface is about 0.5 mm, spatial resolution is also at this level, consistent with the measurement results.
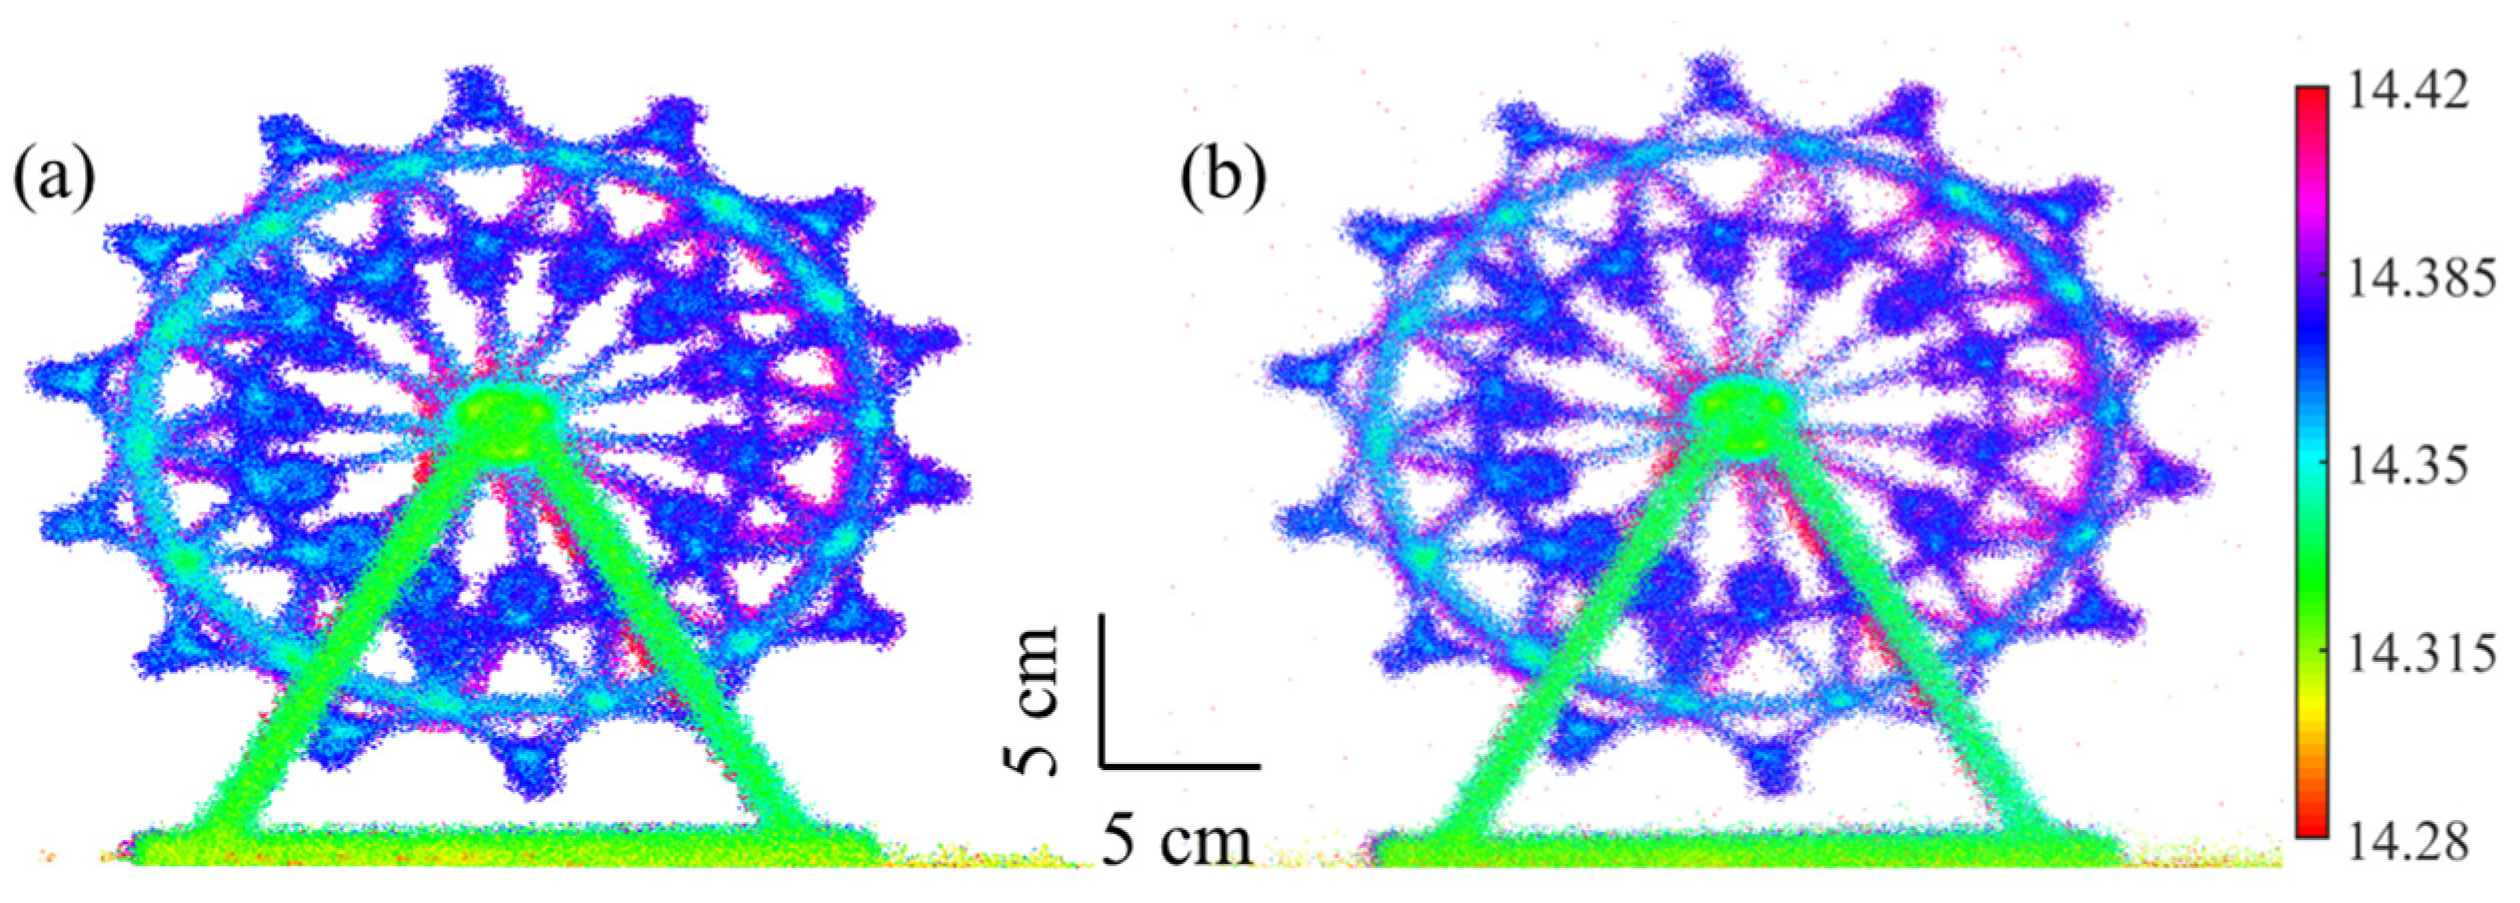
In order to verify the impact of the sidelobes of the Bessel beam on the imaging resolution, Figure 6 shows the depth images retaining and eliminating the sidelobes, in which a noticeable difference in size for corresponding positions is observed. To further highlight this distinction, we performed the same processing on the depth image with the sidelobes retained and collected 10 data points for error analysis per structural size. As shown in Figure 7, the error associated with retaining sidelobes is significantly higher compared with removing sidelobes. This indicates that the method elaborated in this thesis exhibits higher accuracy and reliability in describing the actual size of the target, which could better utilize the non-diffraction characteristics of the Bessel beam, thereby improving the spatial resolution of the LiDAR system.

4. Conclusions

In this paper, we have implemented a high-resolution single-photon imaging system based on the Bessel beam, as well as a single-photon ranging system with high-depth resolution. For three-dimensional structural targets featuring surface depth variations larger than the depth resolution of the system, the echo signal peak of the central spot significantly surpasses that of the sidelobe light in terms of time distribution. Consequently, the points in the depth image predominantly originate from the central spot, resulting in the spatial resolution of the depth image closely aligning with the size of the central spot. This characteristic fully capitalizes on the non-diffraction properties of the Bessel beam, thereby achieving single-photon 3D imaging with a spatial resolution of approximately 0.5 mm and a distance resolution of 12 mm.

Author Contributions

Conceptualization, H.Q. and Z.L.; validation, H.Q., Y.W. and X.C.; writing—original draft preparation, H.Q.; writing—review and editing, H.P. and E.W.; visualization, E.W.; supervision, G.W.; project administration, G.W.; funding acquisition, G.W. All authors have read and agreed to the published version of the manuscript.

Funding

This research was funded by the National Natural Science Foundation of China (Grant numbers 62075062 and 62175067) and the “Chenguang Program” supported by the Shanghai Education Development Foundation and Shanghai Municipal Education Commission (21CGA31).

Institutional Review Board Statement

Not applicable.

Informed Consent Statement

Not applicable.

Data Availability Statement

Data is contained within the article.

Conflicts of Interest

The authors declare no conflicts of interest.

References

  1. Notebaert, B.; Verstraeten, G.; Govers, G. Qualitative and quantitative applications of LiDAR imagery in fluvial geomorphology. Earth Surf. Proc. Land. 2009, 34, 217–231. [Google Scholar] [CrossRef]
  2. McKean, J.; Nagel, D.; Tonina, D. Remote sensing of channels and riparian zones with a narrow-beam aquatic-terrestrial LiDAR. Remote Sens. 2009, 1, 1065–1096. [Google Scholar] [CrossRef]
  3. Kinzel, P.J.; Legleiter, C.J.; Nelson, J.M. Mapping river bathymetry with a small footprint green LiDAR: Applications and challenges. J. Am. Water Resour. As. 2013, 49, 183–204. [Google Scholar] [CrossRef]
  4. Basak, K.; Manjunatha, M.; Dutta, P.K. Review of laser speckle-based analysis in medical imaging. Med. Biol. Eng. Comput. 2012, 50, 547–558. [Google Scholar] [CrossRef]
  5. Tabatabai, H.; Oliver, D.E.; Rohrbaugh, J.W. Novel applications of laser doppler vibration measurements to medical imaging. Sens. Imaging 2013, 14, 13–28. [Google Scholar] [CrossRef]
  6. Cole, J.M.; Wood, J.C.; Lopes, N.C. Laser-wakefield accelerators as hard x-ray sources for 3D medical imaging of human bone. Sci. Rep.-UK 2015, 5, 13244. [Google Scholar] [CrossRef] [PubMed]
  7. Chamseddine, M.; Rambach, J.; Stricker, D. Ghost target detection in 3d radar data using point cloud based deep neural network. In Proceedings of the 2020 25th International Conference on Pattern Recognition (ICPR), Milan, Italy, 10–15 January 2021; IEEE: Piscataway, NJ, USA, 2021. [Google Scholar]
  8. Ussyshkin, V.; Theriault, L. Airborne LiDAR: Advances in discrete return technology for 3D vegetation mapping. Remote Sens. 2011, 3, 416–434. [Google Scholar] [CrossRef]
  9. Oshio, H.; Asawa, T.; Hoyano, A. Estimation of the leaf area density distribution of individual trees using high-resolution and multi-return airborne LiDAR data. Remote Sens. Environ. 2015, 166, 116–125. [Google Scholar] [CrossRef]
  10. Liu, W.; Chen, S.; Hauser, E. LiDAR-based bridge structure defect defection. Exp. Tech. 2011, 35, 1. [Google Scholar] [CrossRef]
  11. Qiu, Q.; Lau, D. A novel approach for near-surface defect detection in FRP-bonded concrete systems using laser reflection and acoustic-laser techniques. Constr. Build Mater. 2017, 141, 553–564. [Google Scholar] [CrossRef]
  12. Bhatt, P.M.; Malhan, R.K.; Rajendran, P. Image-based surface defect detection using deep learning: A review. J. Comput. Inf. Sci. Eng. 2021, 21, 040801. [Google Scholar] [CrossRef]
  13. Melotti, G.; Premebida, C.; Gonçalves, N.M. Multimodal CNN pedestrian classification: A study on combining LiDAR and camera data. In Proceedings of the 2018 21st International Conference on Intelligent Transportation Systems (ITSC), Maui, HI, USA, 4–7 November 2018; IEEE: Piscataway, NJ, USA, 2018. [Google Scholar]
  14. Caltagirone, L.; Bellone, M.; Svensson, L. LiDAR–camera fusion for road detection using fully convolutional neural networks. Robot. Auton. Syst. 2019, 111, 125–131. [Google Scholar] [CrossRef]
  15. Asvadi, A.; Garrote, L.; Premebida, C. Multimodal vehicle detection: Fusing 3D-LiDAR and color camera data. Pattern. Recogn. Lett. 2018, 115, 20–29. [Google Scholar] [CrossRef]
  16. Xue, R.; Kang, Y.; Zhang, T. Sub-pixel scanning high-resolution panoramic 3D imaging based on a SPAD array. IEEE Photonics J. 2021, 13, 1–6. [Google Scholar] [CrossRef]
  17. Luo, W.; Zhang, Y.; Feizi, A. Pixel super-resolution using wavelength scanning. Light-Sci. Appl. 2016, 5, 16060. [Google Scholar] [CrossRef] [PubMed]
  18. Li, Z.P.; Huang, X.; Jiang, P.Y. Super-resolution single-photon imaging at 8.2 kilometers. Opt. Express 2020, 28, 4076–4087. [Google Scholar] [CrossRef]
  19. Fahrbach, F.O.; Simon, P.; Rohrbach, A. Microscopy with self-reconstructing beams. Nat. Photonics 2010, 4, 780–785. [Google Scholar] [CrossRef]
  20. Shi, H.T.; Qi, H.Y.; Shen, G.Y. High-resolution underwater single-photon imaging with Bessel beam illumination. IEEE J. Sel. Top. Quant. 2022, 28, 8300106. [Google Scholar] [CrossRef]
  21. Shi, H.T.; Shen, G.Y.; Qi, H.Y. Noise-tolerant Bessel-beam single-photon imaging in fog. Opt. Express 2022, 30, 12061–12068. [Google Scholar] [CrossRef]
  22. Niu, L.; Wang, K.; Yang, Y. Diffractive elements for zero-order Bessel beam generation with application in the terahertz reflection imaging. IEEE Photonics J. 2018, 11, 1–12. [Google Scholar] [CrossRef]
  23. Shen, G.Y.; Zheng, T.X.; Li, Z.H. High-speed airborne single-photon LiDAR with GHz-Gated single-photon detector at 1550 nm. Opt. Laser. Technol. 2021, 141, 107109. [Google Scholar] [CrossRef]
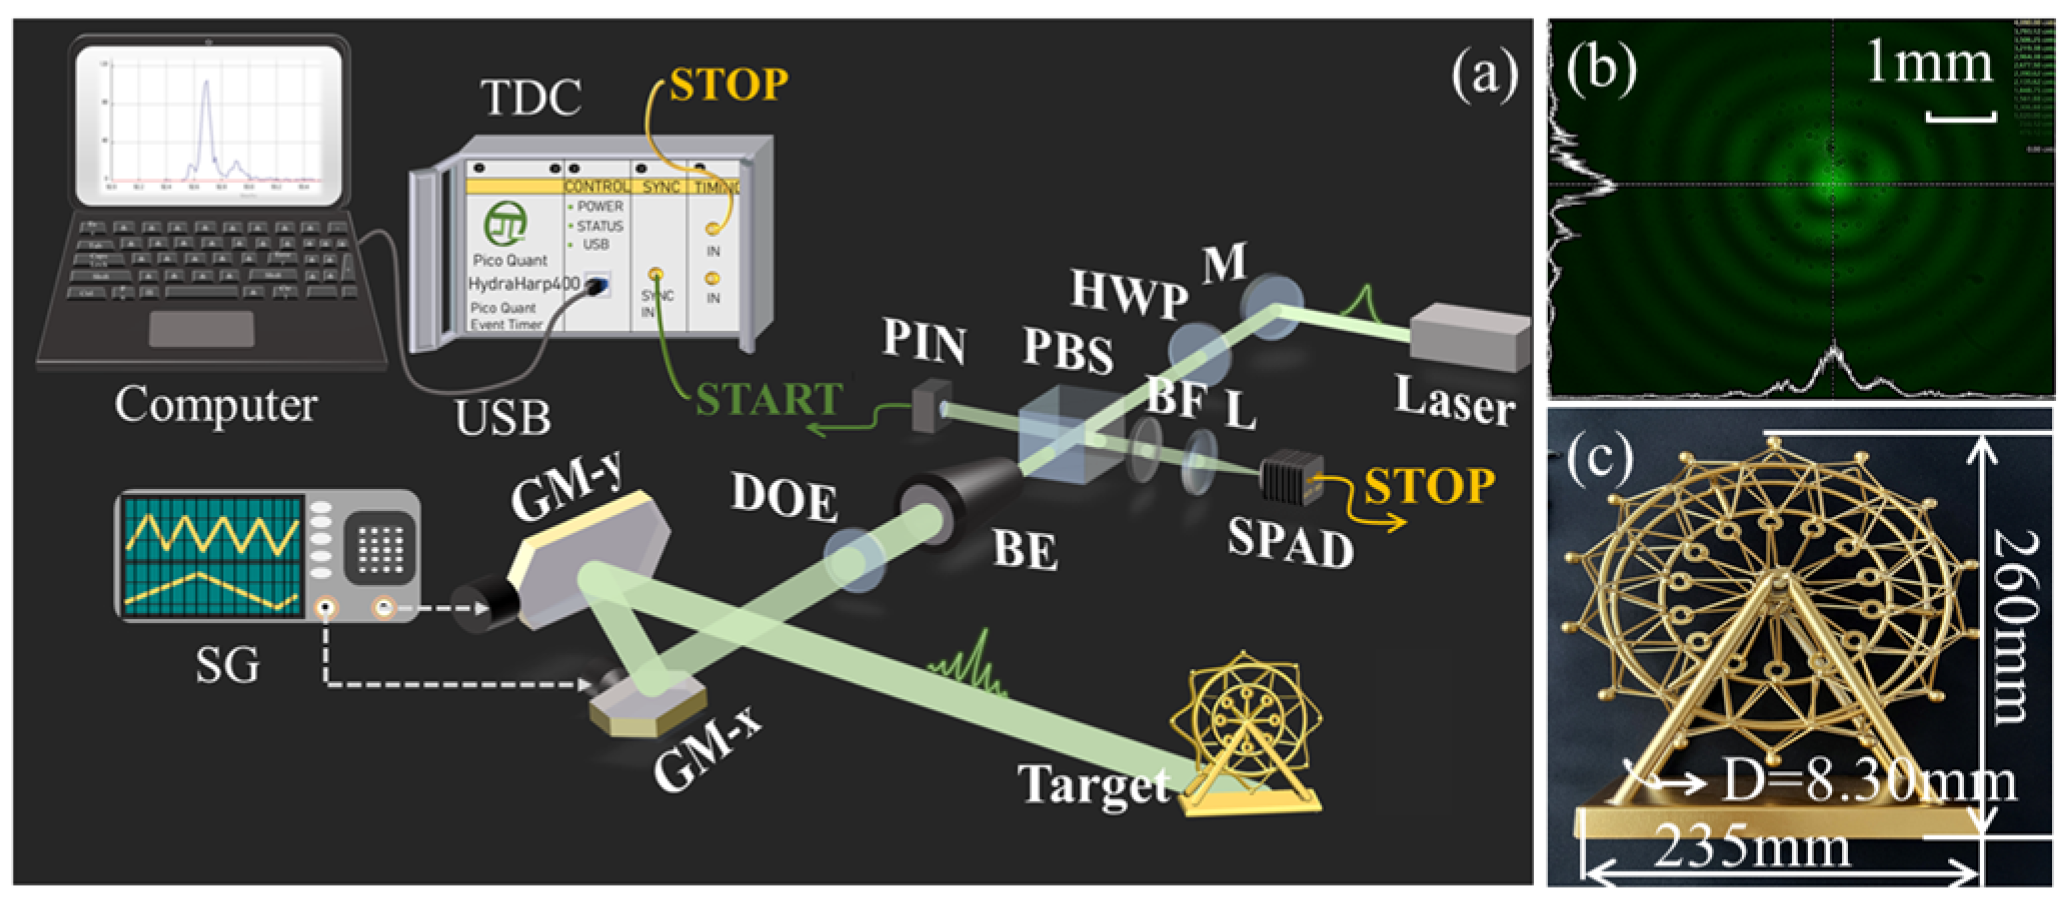
Figure 1. (a) A schematic diagram of the Bessel-beam single-photon imaging system. Laser: picosecond pulsed laser with a central wavelength at 532 nm and a repetition rate of 10 kHz (G-10P-C, Shanghai Buchuang Laser Technology Co., Ltd., Shanghai, China); M: high-reflection mirror; PBS: polarization beam splitter cube (PBS22-532, LBTEK, Changsha, China); BE: 20× beam expander (BE20-532-20X UVFS high-power beam expander, Thorlabs, America); PIN: PIN photodiode; DOE: diffraction optical element (Sichuan Jiuguang Technology Co., Ltd., Chengdu, China); GM-x: X-axis galvanometer scanner (S-9210, SUNNY, Beijing, China); GM-y: Y-axis galvanometer scanner (S-9210, SUNNY, Beijing, China); L: lens with the focal length of 15 mm and the diameter of 18 mm (ACL1815U-A, Thorlabs, America); SPAD: silica single-photon avalanche photodiode-based single-photon detector (Homebuilt); TDC: time-to-digital converter (HydraHarp 400, PicoQuant, Germany); SG: signal generator; BF: bandpass filter (FLH532-10, Thorlabs, America). (b) The intensity distribution of the Bessel beam spot at 14.3 m. (c) The photograph of the target.
Photonics 11 00704 g001
Figure 2. The time distribution histogram of the echo photons when the Bessel beam illuminated the targets as shown in the inset picture, where C1 and C3 are the echo photon counts of the side-lobe light, and C2 is the echo photon count of the central spot.
Photonics 11 00704 g002
Figure 3. The depth image with different denoising thresholds: (a) original image; (b) 4; (c) 10; (d) 20; (e) 40; (f) 60.
Photonics 11 00704 g003
Figure 4. The depth images with varying measurement times: (a) 1000 s, (b) 100 s, (c) 10 s, (d) 2 s.
Photonics 11 00704 g004
Figure 5. Comparison of the photo and grayscale image of the target with dimensions: (a) the photo of the target; (b) the grayscale image of the target.
Photonics 11 00704 g005
Figure 6. Comparison of the depth image with sidelobes eliminated and sidelobes retained: (a) depth image with sidelobes retained; (b) depth image with sidelobes eliminated.
Photonics 11 00704 g006
Figure 7. Comparison of target size errors extracted by eliminating and retaining sidelobes in grayscale images with different measurement areas and actual size: (a) 2.0 mm; (b) 4.0 mm; (c) 8.4 mm.
Photonics 11 00704 g007
Disclaimer/Publisher’s Note: The statements, opinions and data contained in all publications are solely those of the individual author(s) and contributor(s) and not of MDPI and/or the editor(s). MDPI and/or the editor(s) disclaim responsibility for any injury to people or property resulting from any ideas, methods, instructions or products referred to in the content.