Abstract
A four-group mechanically compensated continuous-zoom microscope is proposed and designed based on the theory of continuous zoom. The system addresses the limitations of traditional continuous-zoom microscopes, including a small zoom ratio, a short working distance, and the loss of details during 2D–3D switching. The system has a magnification of 0.6×~6.0× under two-dimensional observation, adapts to two-third-inch sensors, has a working distance of 130 mm, and adds a 360-degree rotatable beamsplitter for three-dimensional full-field-of-view observation. The magnification, numerical aperture, and sensor dimensions remain unchanged under both two-dimensional and three-dimensional observation. The design results demonstrate that the system is capable of achieving a high zoom ratio of 10× while maintaining a high level of imaging quality in both two-dimensional and three-dimensional modes. The MTF curves for each magnification are in close proximity to the diffraction limit, the spot diagrams are smaller than the airy disk range, and the zoom cam curves are smooth with no inflection points. Furthermore, the system negates the visual discrepancies and loss of detail that arise when switching observation modes due to alterations in system magnification and numerical aperture, thereby broadening the scope of applications for continuous-zoom microscopes.
1. Introduction
Continuous-zoom optical systems are widely used in the fields of biological, medical, material, industrial inspection, etc. Compared with fixed-magnification optical systems, continuous-zoom systems allow users to adjust the appropriate magnification to observe and obtain a 2D (two-dimensional) planar image of the sample, with a low magnification for observing the overall structure and a high magnification for scrutinizing the details of the sample. The information will not be lost when the magnification is switched; thus, efficiency is improved [1,2,3,4,5]. In 2019, Haonan Feng designed a 0.5×~2.5× zoom microscope system with a high zoom ratio of 5×, but the working distance was only 34 mm [6]. In 2021, Tengfei Chen designed a 0.7×~5.6× continuous-zoom microscope with a zoom ratio of only 8× and a working distance of 80 mm [7]. However, all of these continuous-zoom microscope systems have the problems of a short working distance, an insufficient zoom ratio, and the fact that they can only present 2D images. In order to solve these problems, in 2023, Zhijie Ma designed a 0.7×~4.5× continuous-zoom objective to collect 2D/3D (three-dimensional) information about the sample, with working distances of 90 mm and 70 mm and magnifications of 0.7×~4.5× and 0.4×~2.5× for 2D and 3D imaging, respectively [8]. Its small zoom ratio, its loss in some sample details, and visual discrepancies due to the reduction in magnification when switching from 2D to 3D imaging limit the application scenarios for the continuous-zoom objective.
To address these problems, this paper designs a high-zoom-ratio, full-field-of-view continuous-zoom microscope system which achieves a long working distance. No visual difference occurs due to the magnification of 2D and 3D images, resulting in seamless switching between 2D and 3D observation.
2. Design Principle
A zoom optical system is an optical device that allows the focal length to be changed by adjusting the position of the internal lens groups. It allows the user to change the magnification and field of view without changing lenses, providing a convenient way to capture images of objects of different sizes at different distances. The main challenge is to design a zoom optical system that maintains high imaging quality throughout the entire zoom range. This requires precise optical system design and fine mechanical manufacturing processes to ensure the accurate adjustment of the optical path and the stability of the lens assembly [9,10].
Zoom optical systems can be classified into optical and mechanical compensation depending on the compensation method [11,12,13].
Optical compensation is characterized by the fact that the movement of the moving group is isotropic, as long as the moving group is cemented together to make a linear movement [14,15,16]. Therefore, there is no need to design an eccentric cam, which can be processed by cutting a straight groove in the lens barrel. However, a zoom optical system with optical compensation is generally longer than a mechanical compensation system, and the image plane position is slightly displaced during the zoom process. This is due to the fact that the optical characteristics of the optical system change while the focal length changes, resulting in a shift in the image plane, which makes this type of system more difficult to design and adjust due to the problem of the small displacement of the image plane [17].
Taking positive group compensation as an example, the four-group mechanical compensation system is shown in Figure 1. The system consists of a front fixing group, group 1; a zooming group, group 2; a compensating group, group 3; and a rear fixing group, group 4. This system is characterized by the fact that the movement of each moving group along the direction of the optical axis is independent of each other, and the trajectories of the moving groups can be linear or nonlinear. The displacements of the zooming group and the compensating group correspond to each other [18,19]. The advantage of the mechanical compensation system is that both the zooming group and the compensating group can assume the function of zooming, which not only makes the system zoom faster but also makes the optical aberrations easy to balance.
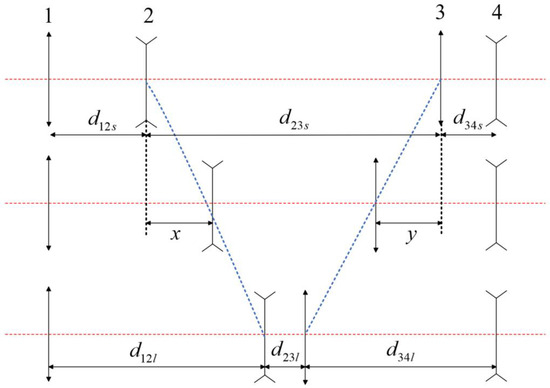
Figure 1.
Four-group zoom optical system (positive group compensation, The red dashed line represents the optical axis of the optical system, and the blue dashed line represents the trajectory of the lens model’s movement).
In most cases, to achieve the same zoom ratio, one can choose between an optical compensation structure and a mechanical compensation structure. However, the optical compensation structure can cause the image plane to be displaced, and the displacement range of the moving elements is excessively large. This leads to an overall length that is longer than that of the mechanical compensation structure, making aberration correction more challenging. On the other hand, the mechanical compensation system provides sufficient flexibility to adjust and optimize the overall performance of the system, allowing us to achieve higher image quality at various magnifications. It also takes into account the potential for future system expansion or upgrades. Consequently, in this paper, a system comprising a four-group mechanical compensation system is employed in order to surmount these limitations.
Only the zooming group and compensating group need to be analyzed because the moving groups produce the movement of the image plane. The focal lengths of the front fixing group, the zooming group, the compensating group, and the rear fixing group in Figure 1 are , , , and , respectively. The magnifications of the zooming group and the compensating group are and , respectively. The interval between the front fixing group, 1, and the zooming group, 2, is ; the interval between the zooming group, 2, and the compensating group, 3, is ; and the interval between the compensating group, 3, and the rear fixing group, 4, is . By convention, the longest focal length of the system is in the initial state of the system and is distinguished by the subscript l. The shortest focal length of the system is distinguished by the subscript s. For example, and indicate the intervals between the first and second groups at the shortest and longest focal lengths, respectively.
In the zooming process, the image plane position is unchanged, so the algebraic sum of the movements of the image plane of the moving groups is zero. According to the zoom differential equation [20], the following relationship holds:
Equation (1) is a multivariate fully differential equation. If we set to be the original function, then .
The general solution is as follows:
Recall that the initial state is in the telephoto position, with the value of being a constant:
Eliminating the constant by subtracting Equation (3) from Equation (2) gives rise to a special solution to the equation:
The collation results in the derivation of a quadratic equation, taking the magnification, , of the compensating group as the variable:
where
Solving for the two roots, β31 and β32, of the magnification, , of the compensating group, we obtain the following:
The relationship between the movement, , and magnification, , of the zooming group is as follows:
The movement, , of the compensating group is as follows:
Finally, the zoom ratio, , of the system is obtained as follows:
The zooming group, 2, and compensating group, 3, move together synchronously to achieve the zoom ratio requirement. Each movement of the zooming group, 2, corresponds to and . The continuous-zoom differential model, as previously described, allows for the determination of the distribution of the focal power and the positions of the optical groups by means of the application of Equations (6)–(10).
Figure 2 shows a schematic diagram of the continuous-zoom 2D/3D microscope. There are two light paths: a 2D imaging light path, as shown by the red light, and a 3D imaging light path, as shown by the green light. The two light paths share the beam splitter, the objective lens, the continuous-zoom body lenses, and the image plane shown in the blue light path. The 3D imaging module, as shown in Figure 3, consists of two lenses, a reflector, a switch, and a beam splitter. The 3D imaging module can be rotated 360 degrees around the optical axis of the objective lens to record the 3D information of samples. Two switches are incorporated into the light paths (blue dashed line), with the function of preventing the light paths from being affected by the other light path when one of them is in use.
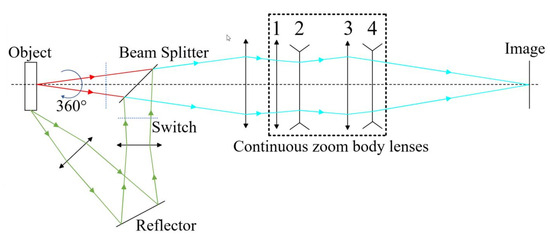
Figure 2.
A schematic diagram of the continuous-zoom 2D/3D microscope.
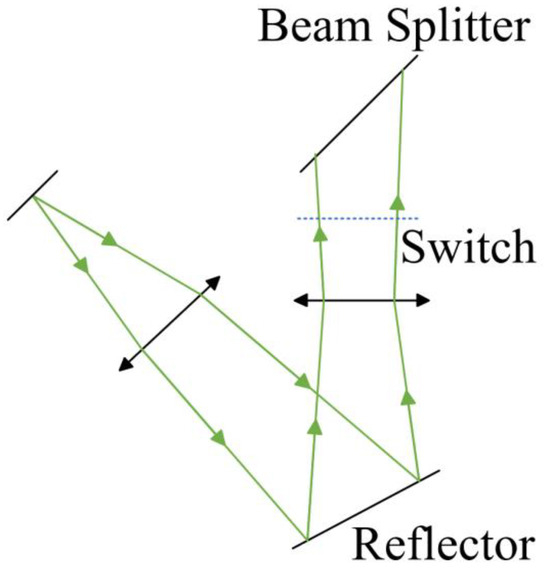
Figure 3.
A schematic diagram of the 3D imaging module.
3. Optical System Design
3.1. Design Indicators
The main design indicators of the 0.6×~6.0× continuous-zoom 2D microscope are listed in Table 1.

Table 1.
Design indicators.
3.2. Design Process
The design of the zoom optical system is highly intricate, with the establishment of the model representing a pivotal aspect. In the event that the initial parameters of the optical system are not selected in an appropriate manner, it will result in an illogical distribution of the system’s focal power as well as difficulty in aberration correction. Consequently, according to the theory of continuous zoom, the optimal optical model can be swiftly established coupled with the Lens Module function of the CODEV software (Version 2022.03). The design flow is shown in Figure 4. Firstly, the ideal optical model is established according to the requirements of the design indicators, and the parameters of each group are determined. Reasonable merit functions are set, and automated design is carried out. The ideal optical model is gradually replaced with real optical glass; finally, the imaging quality is evaluated. It is necessary to conduct repeated optimization and image quality evaluations to ascertain that the system meets the design requirements. The setting and dynamic modification of the merit function are important throughout the design process. The system designed in this paper has several main parameters that need to be constrained, as shown in Table 2. Here, the reduction ratio (RED) is used to control the magnification of the system, and the overall length (OAL) is used to control the total length of the system.
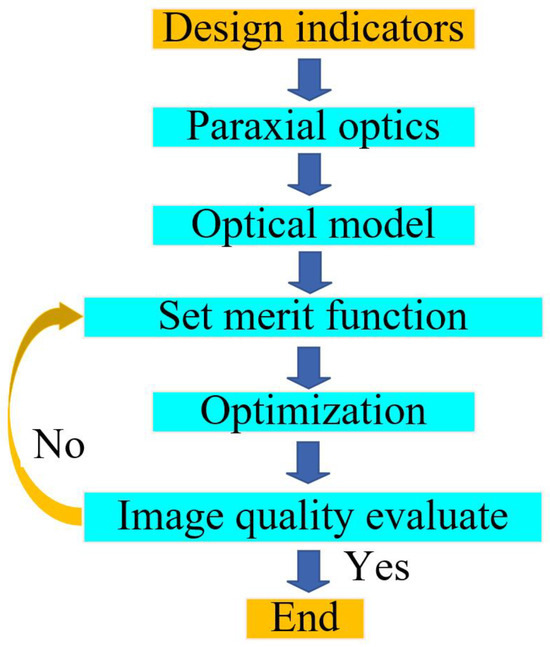
Figure 4.
Design flow chart.

Table 2.
The merit function’s main constraints.
In particular, it should be noted that to ensure the stability of the image plane, the total length of the system at each magnification needs to be equal, so a user constraint is needed, given by the following method: @OAL_Z12 == (OAL SO..I Z1) − (OAL SO..I Z2) = 0.
According to the principles described in Section II, the focal length and the position of each group were solved. The initial parameters of the zoom system are shown in Table 3 and Table 4. The ideal optical model is shown in Figure 5. The blue and red lines are light from different fields of view. The models were replaced with real optical glass for optimization and aberration correction. In the case of continuous-zoom microscope optical systems, the most significant aberrations, such as chromatic and geometric distortion, can be controlled by using Distortion Y (DIY) during the optimization process. Furthermore, the use of special low-dispersion materials can effectively reduce the system’s chromatic aberrations. However, these materials are generally more difficult to process than ordinary glass materials, which also leads to their higher cost. In order to control the cost of the lens, it is necessary to make a reasonable selection and make use of these special low-dispersion materials.

Table 3.
Initial focal length of each group.

Table 4.
Initial distance between groups.

Figure 5.
The ideal optical model: (a) 0.6×, (b) 1.0×, (c) 2.0×, (d) 4.0×, and (e) 6.0×.
Considering the processability of the lenses, it is necessary to control the centering coefficients of the individual lenses during the design process in addition to correcting the aberration. The mechanical centering coefficient, K, is defined as follows:
where and are the corresponding processing apertures of the front and rear surfaces of the lens; and is the radius of curvature of the front and rear surfaces of the lens. The lens is easy to center and has good processability when ; the lens is difficult to center when ; the lens cannot be centered when . The centering coefficient, , of each lens is monitored in real time by the constraint function, and a lens with a poor centering effect is adjusted over time.
3.3. Design Results
The final design results are presented in Figure 6. The 0.6×~6.0× continuous-zoom microscope, which is designed for two-dimensional imaging, comprises 12 glass spherical lenses. Lines of different colours are light for different fields of view. Except for the rear fixing group, which uses two doublets, the rest of the groups use one doublet, including the objective lens, the front fixing group, the zooming group, and the compensating group. During continuous zoom, the stop follows the movement of the compensating group. The 3D imaging module comprises a beam splitter, two doublets, a reflector, and two single lenses, which are integrated into a 2D imaging zoom system to form a 3D imaging zoom system. The 2D imaging zoom system and the 3D imaging zoom system share the same continuous-zoom body lenses, with a magnification range of 0.6×–6.0× and a zoom ratio of 10×.
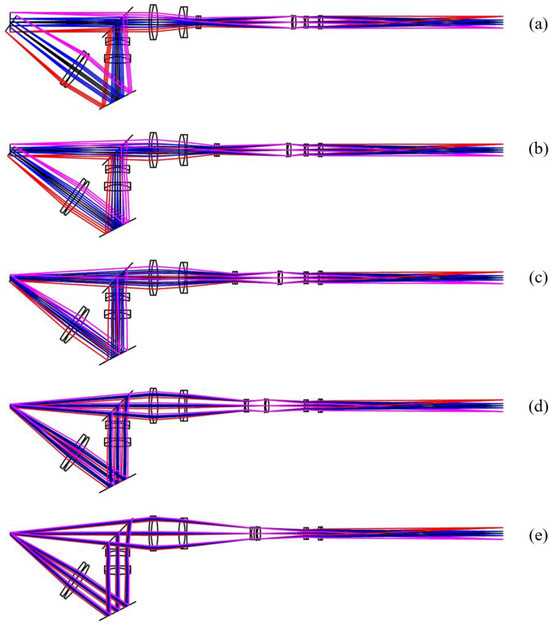
Figure 6.
The structure of a 0.6×~6.0× continuous-zoom 2D/3D microscope: (a) 0.6×, (b) 1.0×, (c) 2.0×, (d) 4.0×, and (e) 6.0×.
Table 5 and Table 6 show the structural parameters of the continuous-zoom optical system and the 3D imaging module, respectively. Surfaces 6, 10, and 14 in Table 5 are the distance between the front fixing group and the zooming group, the distance between the zooming group and the compensating group, and the distance between the compensating group and the rear fixing group during zooming, and the range of movement of the three surfaces is shown in Table 7.

Table 5.
The 0.6×~6.0× continuous-zoom 2D microscope’s structure parameters.

Table 6.
The 3D imaging module’s structure parameters.

Table 7.
Range of movement of the surface.
4. Image Quality Evaluation
The imaging quality of the optical systems was analyzed in terms of the modulation transfer function (MTF) and spot diagram, as well as the geometric distortion [21,22,23].
The MTF is an important performance metric that describes a system’s ability to transfer information about details and contrasts at different spatial frequencies. The MTF curve is an objective and credible measurement tool that provides a comprehensive picture of an optical system’s ability to handle detail, stratification, and overall contour.
The spot diagram shows the image created by a point source of light passing through an optical system. Ideally, an optical system would image a point source as a single point. However, due to a variety of factors, actual optical systems do not achieve perfect imaging, so the point source spreads out across the image plane. By analyzing the shape, width, and symmetry of the spot diagram, the imaging quality of the optical system can be quantified. This includes some possible aberrations, such as spherical aberration, coma, and astigmatism.
Geometric aberration is a phenomenon observed in imaging systems whereby straight lines and shapes in an image are distorted or bent when imaged due to limitations in the optical design or manufacturing defects. It can be defined as the discrepancy between the geometric properties of an image and those of the object in the actual scene. Geometric distortions may be broadly classified into two categories: pincushion distortion and barrel distortion. In the case of pincushion distortion, the edges of the image are bent outward, whereas in the case of barrel distortion, the edges are bent inward.
4.1. Two-Dimensional Imaging System
4.1.1. MTF Curve
The MTF curves of the 0.6×~6.0× continuous-zoom 2D microscope are shown in Figure 7, where subplots (a), (b), (c), (d), and (e) correspond to 0.6×, 1.0×, 2.0×, 4.0×, and 6.0×, respectively. It can be seen that the MTF curves at each magnification are close to the diffraction limit. The MTF curves at 0.6× and 1.0× in subplots (a) and (b) almost reach the diffraction limit. The MTF curves at 2.0×, 4.0×, and 6.0× in subplots (c)–(e) show a certain decrease due to the increase in the magnification and numerical aperture.
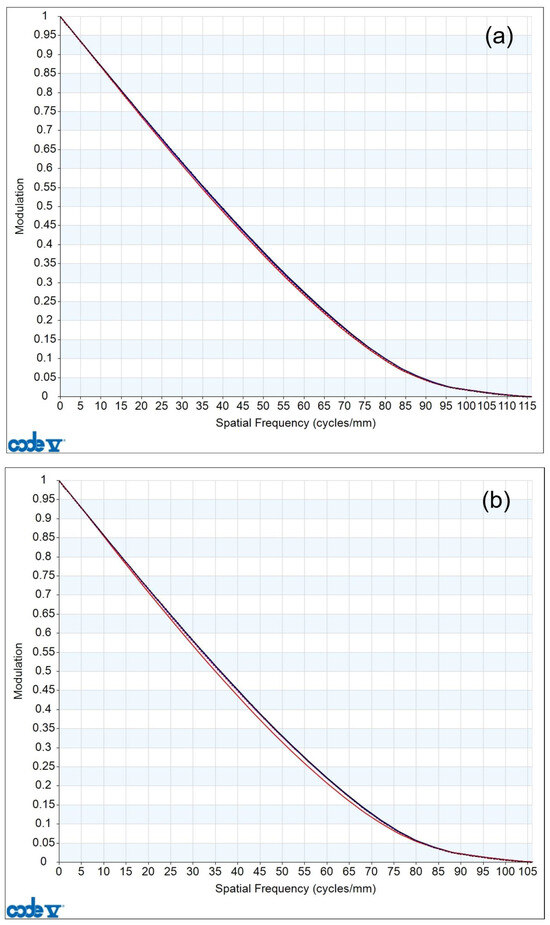
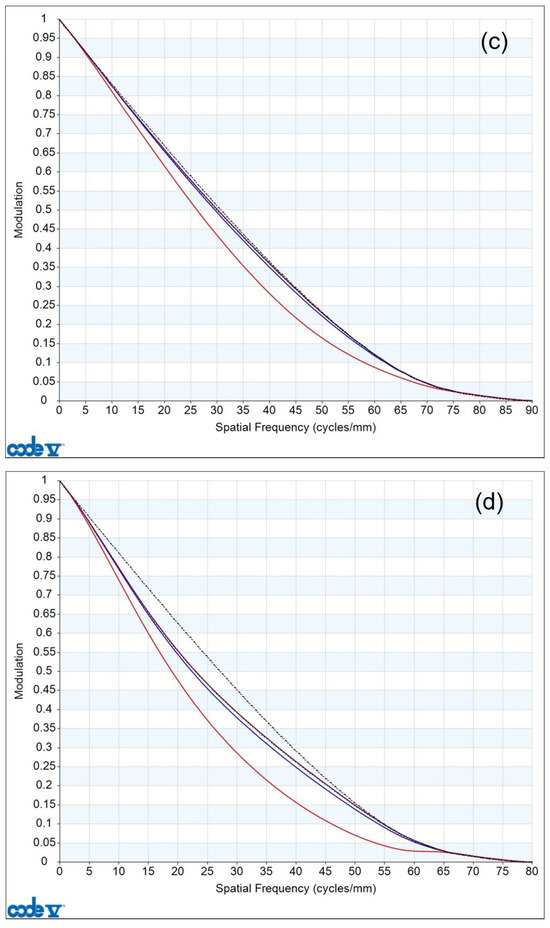
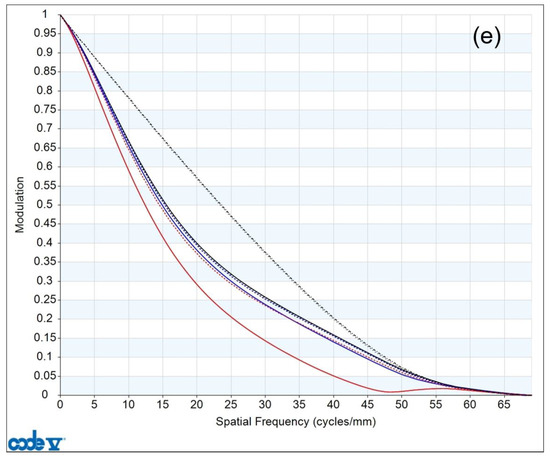
Figure 7.
MTF curves at different magnifications: (a) 0.6×, (b) 1.0×, (c) 2.0×, (d) 4.0×, and (e) 6.0×. (The black dashed line in the figure represents the diffraction limit, with different colors indicating the MTF curves for different fields of view. The solid lines represent the tangential direction, and the dashed lines represent the radial direction).
4.1.2. Spot Diagram
The spot diagrams of the 0.6×~6.0× continuous-zoom 2D microscope are shown in Figure 8, where subplots (a), (b), (c), (d), and (e) correspond to 0.6×, 1.0×, 2.0×, 4.0×, and 6.0×, respectively. It can be seen that the spot diagrams of both the central and edge fields of view are basically smaller than the airy disk range at each magnification, with the 4.0× and 6.0× magnifications being slightly larger than the airy disk range.
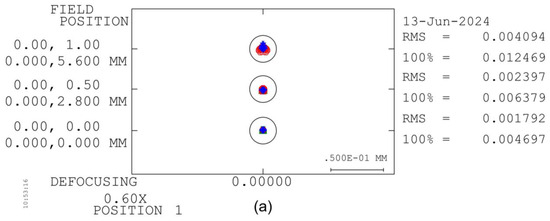
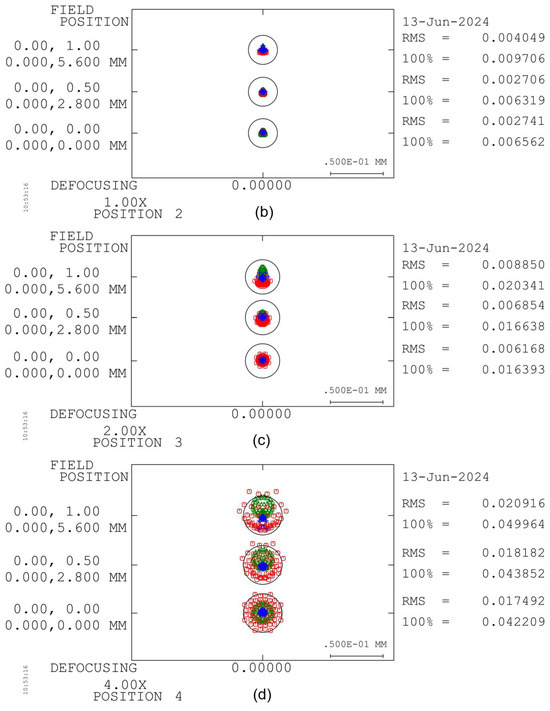
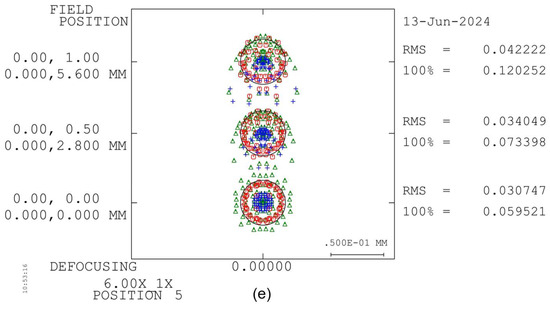
Figure 8.
Spot diagrams at different magnifications: (a) 0.6×, (b) 1.0×, (c) 2.0×, (d) 4.0×, and (e) 6.0×. (Red, green, and blue represent the three wavelengths of light at d (656.27 nm), F (587.56 nm), and C (486.13 nm), respectively.).
4.1.3. Geometric Distortion
The geometric distortion of the 0.6×~6.0× continuous-zoom 2D microscope is shown in Figure 9, where subplots (a), (b), (c), (d), and (e) correspond to 0.6×, 1.0×, 2.0×, 4.0×, and 6.0×, respectively. The distortions are positive at all magnifications, and the values are controlled within 1% of each other.
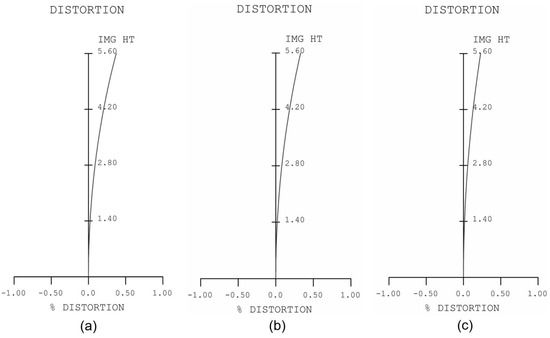
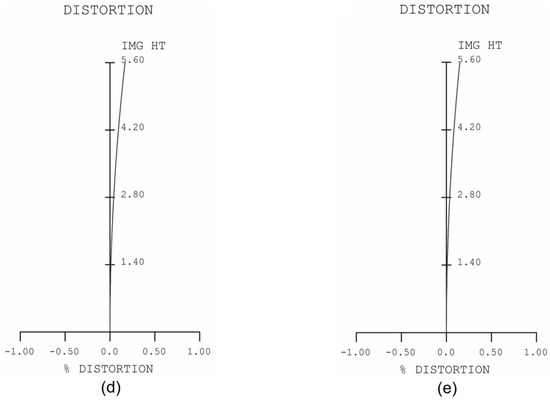
Figure 9.
Geometric distortion at different magnifications: (a) 0.6×, (b) 1.0×, (c) 2.0×, (d) 4.0×, and (e) 6.0×.
4.2. Three-Dimensional Imaging System
4.2.1. MTF Curve
The MTF curves of the 0.6×~6.0× continuous-zoom microscope 3D optical system are shown in Figure 10, where subplots (a), (b), (c), (d), and (e) correspond to 0.6×, 1.0×, 2.0×, 4.0×, and 6.0×, respectively. It can be seen that the MTF curves almost reach the diffraction limit.
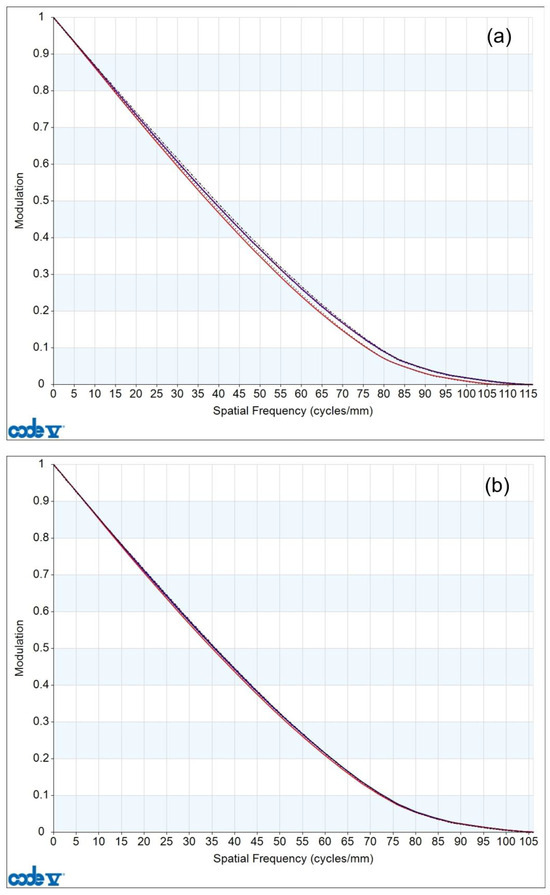
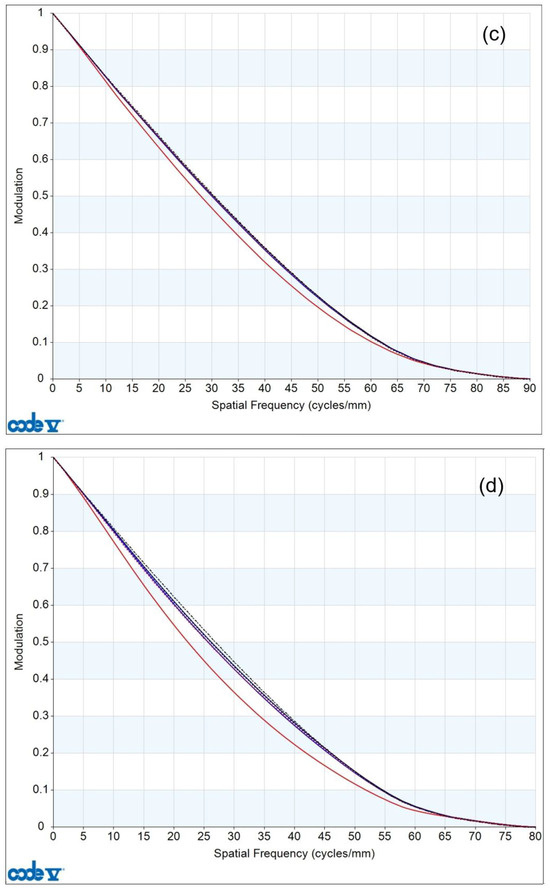
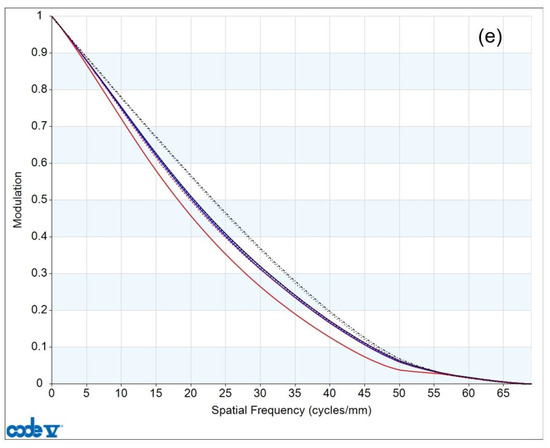
Figure 10.
MTF curves at different magnifications: (a) 0.6×, (b) 1.0×, (c) 2.0×, (d) 4.0×, and (e) 6.0×. (The black dashed line in the figure represents the diffraction limit, with different colors indicating the MTF curves for different fields of view. The solid lines represent the tangential direction, and the dashed lines represent the radial direction).
4.2.2. Spot Diagram
The spot diagrams of the 0.6×~6.0× continuous-zoom 3D microscope are shown in Figure 11, where subplots (a), (b), (c), (d), and (e) correspond to 0.6×, 1.0×, 2.0×, 4.0×, and 6.0×, respectively. It can be seen that the spot diagrams of both the central and edge fields of view are basically smaller than the airy disk range at each magnification.
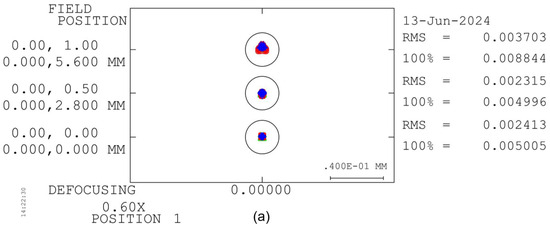
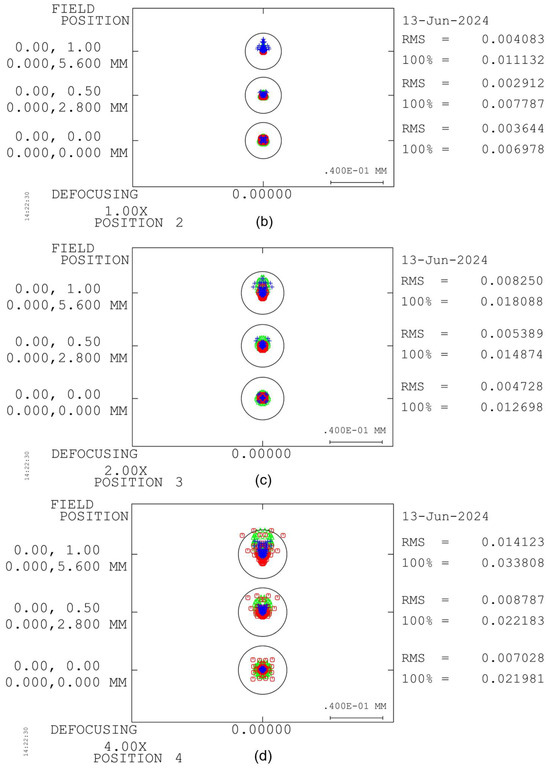
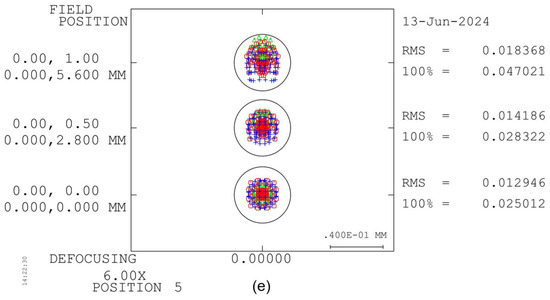
Figure 11.
Spot diagrams at different magnifications: (a) 0.6×, (b) 1.0×, (c) 2.0×, (d) 4.0×, and (e) 6.0×. (Red, green, and blue represent the three wavelengths of light at d (656.27 nm), F (587.56 nm), and C (486.13 nm), respectively.).
4.2.3. Geometric Distortion
The geometric distortion of the 0.6×~6.0× continuous-zoom 3D microscope is shown in Figure 12, where subplots (a), (b), (c), (d), and (e) correspond to 0.6×, 1.0×, 2.0×, 4.0×, and 6.0×, respectively. The distortions are positive at all magnifications, and the values are controlled within 1% of each other.
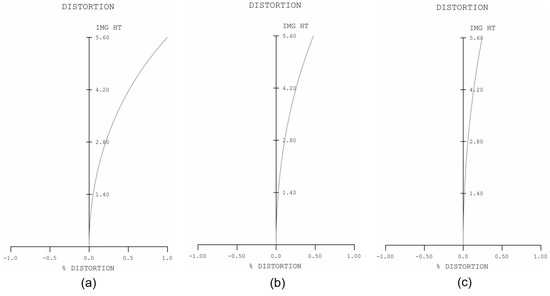
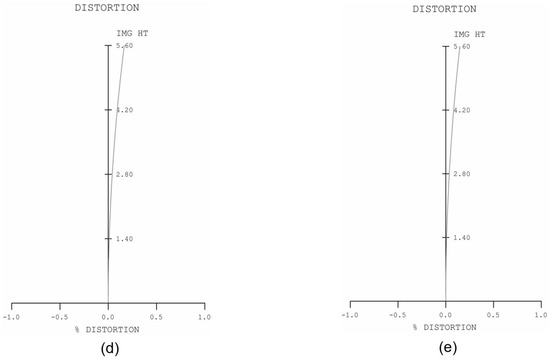
Figure 12.
Geometric distortion at different magnifications: (a) 0.6×, (b) 1.0×, (c) 2.0×, (d) 4.0×, and (e) 6.0×.
5. Zoom Cam Curve Design
The zoom cam curve directly affects the movement of the lens components in a zoom optical system, which typically include the zooming and compensating groups. The accurate movement of these components is critical to achieving high-quality imaging and zoom functions in an optical system. The quality of the cam curve design determines the continuity and smoothness of the zoom process. Unreasonable curves may cause stalling during the zoom process, thus affecting the image quality. It is therefore evident that reasonable curves can help keep each group in the correct position to ensure the maintenance of image quality and a stable image plane throughout the zoom range. In order to achieve this, it is necessary to ensure that the relative displacement of the zooming group and compensating group is accurate. This will ensure that high-quality imaging performance is maintained [24,25,26,27,28].
The fitted cam curves are shown in Figure 13. The orange line represents the curve of the zooming group, the blue line represents the curve of the compensating group, the vertical axis indicates the distance between the zoom group and the compensation group during movement, and the horizontal axis indicates the length of the zoom curve after it has been unfolded on the side of the cam cylinder. The system’s zooming and compensating group curves are smooth, with no inflection points and no stalling during zooming.
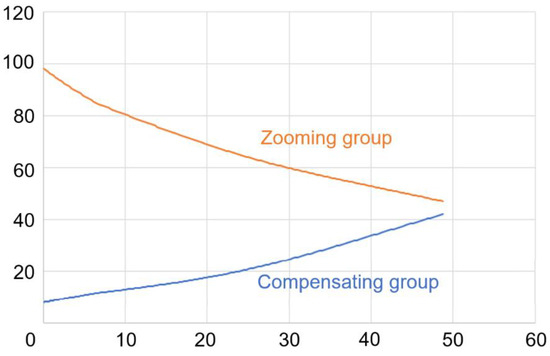
Figure 13.
Zoom cam curves of the 0.6×~6.0× continuous-zoom 2D/3D microscope.
6. Tolerance Analysis
Tolerance analysis is a critical step in evaluating the performance of optical systems. In an ideal design, an optical system should operate normally within a certain range of manufacturing and assembly errors. However, the reality is that all components exhibit minor deviations during the production process, and assembly accuracy is also subject to constraints.
Tolerance analysis features in optical design software can assist in evaluating image quality (e.g., wavefront error, point spread function, modulation transfer function) and can also help engineers achieve a balance between optimal design specifications and production costs. Additionally, tolerance analysis includes compensator functions; in optical systems, certain tolerances can be compensated by adjusting other parameters. Compensators can be added and utilized in tolerance analysis, thereby optimizing the manufacturing capacity of the design. Tolerance analysis ensures that optical designs are not only theoretically feasible but, more importantly, are practically achievable in actual production processes while maintaining the expected performance [29,30,31]. The main tolerance parameters of the 2D and 3D imaging systems are set as shown in Table 8.

Table 8.
Tolerance parameter setting.
The compensator is selected to be the system’s default back focal compensation, as shown in Table 9.

Table 9.
Parameters of the compensator.
Tolerance analyses were conducted separately for the 2D and 3D imaging systems. The analysis mode was a sensitivity analysis, and the evaluation criterion was the average MTF value.
6.1. Two-Dimensionsal Imaging System
The tolerance curve of the 0.6×~6.0× continuous-zoom 2D microscope is shown in Figure 14. The results indicate that the MTF for 90% of the field of view is greater than 0.3 at 0.6×; it exceeds 0.36 at 1.0×; it is above 0.26 at 2.0×; it is greater than 0.15 at 4.0×; and it remains above 0.08 at 6.0×.
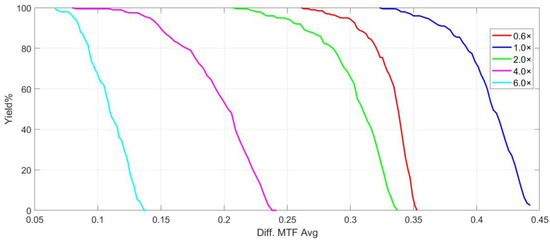
Figure 14.
The tolerance curves for different magnifications in the 2D imaging system.
These observations are consistent with the expected post-fabrication performance of optical systems, where the actual MTF is typically 0.15 to 0.2 lower than the ideal MTF. The tilt and decenter of lenses and lens groups have a more significant effect on the MTF at higher magnifications due to the increased deflection angles of the optical path.
6.2. Three-Dimensional Imaging System
The tolerance curve of the 0.6×~6.0× continuous-zoom 3D microscope is shown in Figure 15. The results indicate that the MTF for 90% of the field of view is greater than 0.37 at 0.6×; it exceeds 0.35 at 1.0×; it is above 0.23 at 2.0×; it is greater than 0.12 at 4.0×; and it remains above 0.06 at 6.0×.
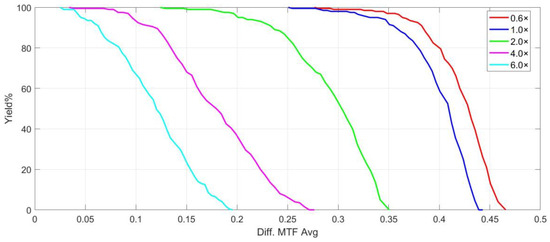
Figure 15.
The tolerance curves at different magnifications in the 3D imaging system.
These observations are consistent with the expected post-fabrication performance of optical systems, where the actual MTF is typically 0.15 to 0.2 lower than the ideal MTF. The 3D imaging system exhibits greater sensitivity to the tilt and decenter of lenses and lens groups than the 2D imaging system due to the incorporation of a beam splitter and reflector.
In conclusion, it is anticipated that the 2D and 3D imaging systems will deliver high-quality images within the defined tolerance ranges. Furthermore, the tolerances specified are in compliance with the current manufacturing and alignment processes for optical components.
7. Conclusions
The design results demonstrate that the microscope features a high zoom ratio of 10×, a long working distance of 130 mm, a high resolution, and low aberrations, with smooth zoom cam curves that meet the manufacturing specifications. In comparison to conventional continuous-zoom microscopes, this system is not only capable of 2D imaging but also 3D imaging. Furthermore, the transition from 2D to 3D imaging does not result in a loss of detail or the introduction of visual discrepancies due to changes in magnification and numerical aperture.
This microscope offers a multitude of benefits across various fields. In biology and medicine, the microscope’s continuous-zoom feature and high magnification range from 0.6× to 6.0× enable researchers to observe the morphology, structure, and dynamics of samples with high precision. The ability to switch between 2D and 3D views allows researchers to gain a more complete understanding of the object being examined, thus facilitating a detailed study of the sample’s structure. In industry, particularly in the assembly of circuit components, integrating 3D imaging into a microscope is extremely useful. It can quickly and comprehensively capture the 3D image of a component, providing engineers and technicians with a clear and detailed view of the entire component. This capability is of great significance for the rapid and accurate assessment of the overall condition of a part, including its size, shape, and assembly relationship with other components. Furthermore, 3D imaging with a full field of view allows technicians to discern every detail of a component, which is crucial for identifying potential assembly issues or defects. This reduces unnecessary interference in the assembly process, thereby enhancing productivity and improving the quality of the final product.
Author Contributions
Conceptualization, Y.G. and F.L.; methodology, Y.G., F.L., J.H. (Jiebo Huang) and J.H. (Jiaying He); validation, Y.G. and F.L.; resources, F.Y. and T.Z.; data curation, Y.G.; writing—original draft preparation, Y.G. and F.L.; writing—review and editing, Y.G., F.L., F.Y., and T.Z.; project administration, F.Y. and T.Z. All authors have read and agreed to the published version of the manuscript.
Funding
This research was funded by the National Natural Science Foundation of China (61205158) and the Zhejiang Provincial Natural Science Foundation of China (LY15F050013).
Institutional Review Board Statement
Not applicable.
Informed Consent Statement
Not applicable.
Data Availability Statement
Some of the data have been provided in the paper. Other relevant data are available upon request; please contact the authors for access.
Conflicts of Interest
The authors declare no conflicts of interest.
References
- Xu, L.-F.; Zhang, X.; Cai, W.; Qu, H.-M. Optical design of high-magnification zoom systems with multiple moving lens groups. Infrared Laser Eng. 2013, 42, 1748–1753. [Google Scholar]
- Jiang, L.; Huang, W. Design of long focal length large zoom ratio MWIR zoom optical system. Infrared Laser Eng. 2012, 41, 1867–1871. [Google Scholar]
- Chen, T.-F.; Yu, F.-H. Review of Continuous Zoom Microscope. Laser Optoelectron. Prog. 2021, 58, 62–72. [Google Scholar]
- Zhang, R.-Z.; Chen, Y.; Zhang, J.-M.; Li, Y.; Zhang, J. Design of zoom microscope objective with long working distance. Infrared Laser Eng. 2019, 48, 420–425. [Google Scholar]
- Ye, W.-W.; Huang, J.-Y.; Zhou, T.-F.; Lin, F. Design of Continuous Zoom Double Telecentric System and Analysis of Cam Curve. Laser Optoelectron. Prog. 2020, 57, 218–224. [Google Scholar]
- Feng, H.-N.; Mei, Q.-S.; Liang, X.-L. 0.5×~2.5× long working distance zoom microscope objective lens design. Opt. Instrum. 2018, 40, 40–46. [Google Scholar]
- Chen, T.-F.; Wang, J.; Liu, J.-L.; Shi, J.; Yu, F.-H. Optical System Design of Continuous Zoom Objective Lens with Multi-Conjugate Distances. Optics Ultra Precision Manufacturing and Testing. In AOPC 2020: Optics Ultra Precision Manufacturing and Testing; SPIE: Orlando, FL, USA, 2020; Volume 115680B, pp. 1–6. [Google Scholar] [CrossRef]
- Ma, Z.-J.; Zhang, J.; Xie, M.-Y.; Lu, X.-L.; Liao, M.-Z. Optical system design of 2D/3D continuous zoom objective lens. In Proceedings of the Fourteenth International Conference on Information Optics and Photonics, Tucson, AZ, USA, 10–12 July 2023; SPIE: Orlando, FL, USA, 2023; Volume 12935, pp. 1340–1348. [Google Scholar] [CrossRef]
- Gao, Y.-H.; Yang, Z.-Q.; Zhao, W.-X.; Jiang, B.; Li, D.-M.; Li, M.-S. Optimum design of cam curve of zoom system based on Zemax. Optik 2013, 124, 6358–6362. [Google Scholar] [CrossRef]
- Qiang, Z.-H.; Wu, L.; Mei, C.; Zhao, Y. Optimal design of cam curves for zoom lens. In Proceedings of the Sixth International Conference on Optical and Photonic Engineering, Shanghai, China, 8–11 May 2018; SPIE: Orlando, FL, USA, 2018; Volume 108272V, pp. 1–5. [Google Scholar] [CrossRef]
- Qian, C.-S.; Li, F.; Yang, J.-F.; Sun, Y.; Yang, W.-Q. Mechanical design of zoom optical system for deep space exploration. In Proceedings of the 9th International Symposium on Advanced Optical Manufacturing and Testing Technologies: Large Mirrors and Telescopes, Harbin, China, 26–29 April 2014; SPIE: Orlando, FL, USA, 2019; Volume 1083704, pp. 1–7. [Google Scholar] [CrossRef]
- Wang, L.; Li, L. Research on cam curve structure for Infrared zoom optical system. Space Optics, Telescopes, and Instrumentation. In AOPC 2019: Space Optics, Telescopes, and Instrumentation; SPIE: Orlando, FL, USA, 2019; Volume 1134117, pp. 1–6. [Google Scholar] [CrossRef]
- Zhao, Y.; Kang, S.-F.; Qing, X. Detection method and evaluation of zoom CAM curve based on linear displacement. In Proceedings of the International Conference on Optoelectronic and Microelectronic Technology and Application, Nanjing, China, 20–22 October 2020; SPIE: Orlando, FL, USA, 2020; Volume 1161718, pp. 1–8. [Google Scholar] [CrossRef]
- Tao, L.; Zhao, J.-S. Optically Compensated LWIR Zoom Objective with Magnification of 5×. Infrared Technol. 2008, 30, 210–213. [Google Scholar]
- Zhang, L.; Pan, X.-D.; Liu, Y.; Liu, H.-X. Design of optical compensated high zoom ratio infrared step zoom lens. J. Appl. Opt. 2013, 34, 738–741. [Google Scholar]
- Shi, G.-H. Optical Compensated Step Zoom Lens. Opto-Electron. Eng. 2009, 36, 1–3. [Google Scholar]
- Neil, L.A. Evolution of zoom lens optical design technology and manufacture. Opt. Eng. 2021, 60, 051211. [Google Scholar] [CrossRef]
- Lee, D.-Y.; Park, S.-C. Design of an 8× Four-group Inner-focus Zoom System Using a Focus Tunable Lens. Opt. Soc. Korea 2016, 20, 283–290. [Google Scholar] [CrossRef]
- Jo, S.-H.; Park, S.-C. Design and analysis of an 8× four-group zoom system using focus tunable lenses. Opt. Express 2018, 26, 13370–13382. [Google Scholar] [CrossRef] [PubMed]
- Tang, H.; Li, H.-B.; Peng, L.; Ming, J.-Q.; Ji, Z.-B.; Pu, E.; Yang, Z.; Bi, X.; Bao, K.; Zheng, W.; et al. Optical Design of Light-Small MWIR Continuous Zoom System. Infrared Technol. 2023, 45, 1278–1285. [Google Scholar]
- Yi, N.; Meng, Q.-C.; Qi, Y.-L.; Zhang, Y.-Q. Middle Infrared Continuous Zoom Optical System. Infrared Technol. 2009, 31, 694–697. [Google Scholar]
- Wang, Q. The spot diagram energy distributed curve and the geometric optical transfer function. Chin. J. Comput. Phys. 1992, 9, 413–414. [Google Scholar]
- Xiao, Z.-T.; Lou, S.-L.; Wu, J.; Gen, L.; Zhang, F. Design of optical system for stereo imaging fundus camera. Opt. Precis. Eng. 2018, 26, 1054–1060. [Google Scholar] [CrossRef]
- Yang, Z.-P.; Li, X.-L.; Yang, W.-Y.; Yan, T.-Y.; Pu, E.-C.; Yin, L. Optimization method of the cam curve for a continuous zoom optical system. Appl. Opt. 2024, 63, 816–822. [Google Scholar] [CrossRef]
- Luo, M.; Zhang, S.-Q.; Wang, H.-Y.; Chen, L.-J.; Wang, X.; Lin, W.-H.; Liu, Y.-J.; Bai, Z.-H. Optimal Design and Experimental Verification of a Continuous Zoom Cam. Infrared Technol. 2022, 44, 958–963. [Google Scholar]
- Wang, Y.-K.; Chong, Y. A Method of Measuring the Curve of Continuous Zoom Cam. Dev. Innov. Mach. Electr. Prod. 2020, 33, 74–75. [Google Scholar]
- Wang, T.; Yuan, Y.-J.; Wu, Y.-C.; Zhang, W.-G.; Pang, L. Pressure Angle Optimization for Cam Curve of Continuous Zoom Lens. Electron. Opt. Control 2021, 28, 61–65. [Google Scholar]
- Peng, J.-W.; Shi, K.; Lei, Y.-J.; Mei, C.; Wu, L. Optimal Design of Cam Curve Structure of the 30× Continuous Zoom System. Acta Photonica Sin. 2019, 48, 210–215. [Google Scholar]
- Lin, T.-Y.; Cheng, C.-C. A noval opto-mechanical tolerance analysis method for precision lens systems. Precis. Eng. 2021, 35, 447–454. [Google Scholar] [CrossRef]
- Hammer, A.; Whale, M.; Forsberg, P.; Murk, A.; Emrich, A.; Stake, J. Optical tolerance analysis of the multi-baem limb viewing instrument STEAMR. IEEE Trans. Terahertz Sci. Technol. 2014, 4, 714–721. [Google Scholar] [CrossRef]
- Yang, H.-M.; Jiang, H.-L.; Yang, D.-R.; Wang, L.; Li, G.; Han, J. The Computer Optimizing and Processing of the Economic Tolerance of Optical System. Changchun Inst. Opt. Fine Mech. 1997, 20, 1–6. [Google Scholar]
Disclaimer/Publisher’s Note: The statements, opinions and data contained in all publications are solely those of the individual author(s) and contributor(s) and not of MDPI and/or the editor(s). MDPI and/or the editor(s) disclaim responsibility for any injury to people or property resulting from any ideas, methods, instructions or products referred to in the content. |
© 2024 by the authors. Licensee MDPI, Basel, Switzerland. This article is an open access article distributed under the terms and conditions of the Creative Commons Attribution (CC BY) license (https://creativecommons.org/licenses/by/4.0/).