1. Introduction
A photorefractive effect can be described as the light intensity, pattern-dependent refractive index change exhibited by certain electro-optic materials observed first in 1969 [
1,
2]. When a photorefractive material is illuminated by an intensity pattern created by light interference (fringe pattern), several events, starting from the photoexcitation of charge carriers to the generation of a space-charge field, occur in sequence, resulting in the development of a refractive index modulation (grating) across the material through an electro-optic effect [
3,
4]. These sequential events extend over time, making the photorefractive process temporally nonlocal. Moreover, the generation of refractive index modulation depends on the material’s response to the gradient of light intensity rather than the light intensity itself. Since the gradient of the refractive index is spatially extended, the photorefractive process is spatially nonlocal as well. Thus, the photorefractive process possesses both spatial and temporal nonlocality, which is the root cause of several interesting behaviors, including complex signal generation.
Researchers have extensively investigated the photorefractive behavior exhibited by electro-optic crystals, such as lithium niobate [
5], barium titanate [
6,
7], strontium–barium niobate [
8], etc. The primary aim behind those investigations were to unlock the potentials of photorefractivity in the fields of volume holography, hologram multiplexing [
9], wave mixing [
3], optical filtering [
10], image amplification [
11], optical phase conjugation (OPC), and 3D display [
12], etc. Photorefractive materials often show a real-time response to light patterns and have been investigated for applications that include optical computing [
13,
14], linear algebra processing [
15,
16], and optical neural networks [
17,
18,
19,
20], etc.
All the above-mentioned applications utilize the saturated or stable phase of the photorefractive process. This phase is simply a steady-state in refractive index modulation reached by the material after a certain time period of the onset of illumination. The grating (hologram) present in the material during this phase is stable (i.e., does not vary with time unless being perturbed). But before converging to the steady-state, the material (system) goes through a transitional phase. This transitional phase encapsulates rich spatio-temporal dynamics due to the nonlinearities and nonlocalities emebedded in the photorefractive process. Various investigations have documented these transient processes, especially in materials such as lithium niobate [
21,
22,
23], bismuth silicone oxide [
24], barium titanate, etc. [
25,
26]. Smout et al. [
27] have reported the pulsating behavior of OPC output when barium titanate is used as a self-pumped phase conjugate mirror. Temporal instabilities in photorefractive four-wave mixing (FWM) systems were also discovered and reported [
28].
Some studies even indicate chaotic behavior in the emitted (output) light signals during the photorefractive transient phase under certain conditions. Multiple researchers have documented instances of chaotic phenomena in photorefractive phase conjugators that incorporate external feedback mechanisms, such as mirrors [
29] or reflections from the crystal surfaces [
30,
31]. Wieslaw et al. [
32] theoretically showed that period doubling and low-order chaos could be exhibited by a photorefractive four-wave mixing (transmission geometry) process without any external feedback. The emergence of chaos in photorefractive optical phase conjugation has also been proved theoretically [
33]. Siuying et al. showed periodic and chaotic spatio-temporal states in a photorefractive phase conjugate resonator (PCR) [
34]. Chaotic results generated from multigrating phase conjugation in a photorefractive four-wave mixing process has also been reported [
35]. The rich and complex spatio-temporal nonlinear dynamics exhibited by the photorefractive process makes it a promising candidate for artificial intelligence or neural network-based applications, such as reservoir computing [
36,
37].
Though several reports on complex and chaotic signal generation exists, to the best of our knowledge, there are no reports that utilize the most simple ‘photorefractive two-wave mixing’ (PR-TWM) process for such a purpose. In this research paper, we theoretically investigate the possibilities of complex nonlinear dynamic and chaotic signal generation in a PR-TWM process, without any external feedback. In other words, we try to simulate the time-dependent (transient) changes in the intensity of one of the beams, induced by the ‘energy exchange process’ in a PR-TWM process. The novel idea employed here for the generation of complex behavior is the application of a sinusoidal electric field to the crystal (i.e., to perturb the system with a smooth sinusoidal signal). Applying a sinusoidal field, i.e., an alternating current (AC) to photorefractive process, has so far been considered only as a method to enhance the space-charge field [
38,
39]. Here, we numerically show for the first time that the output light intensity from a PR-TWM system with a constantly applied AC field becomes oscillatory and can be driven towards the emergence of periodic doubling and chaos. For the numerical simulations, we use only real-world parameters of a lithium niobate crystal (LiNbO
3) that are practically measured and reported elsewhere. The key advantage of the proposed method is the ability of controlled complex signal generation using a PR-TWM setup without any external feedback, which makes it significantly simple compared to existing (FWM, OPC, PCR, etc.) arrangements. This research study is comprehensive and relies on the foundational principles of Kogelnik’s coupled wave theory combined with Kukhtarev’s material equations [
21].
2. Principle
Photorefractive two-wave mixing (PR-TWM) is a process in which a pair of light beams are directed onto a photorefractive material, which writes a volume hologram (grating) in the material by inducing periodic modulations in the refractive index of the material. Both the beams are coupled together through the hologram they wrote, resulting in an energy exchange between the two beams [
40,
41]. This process was first reported by Stabler and Amodei [
42]. A theory that explains the above phenomena is formulated by Kukhtarev et al. [
4].
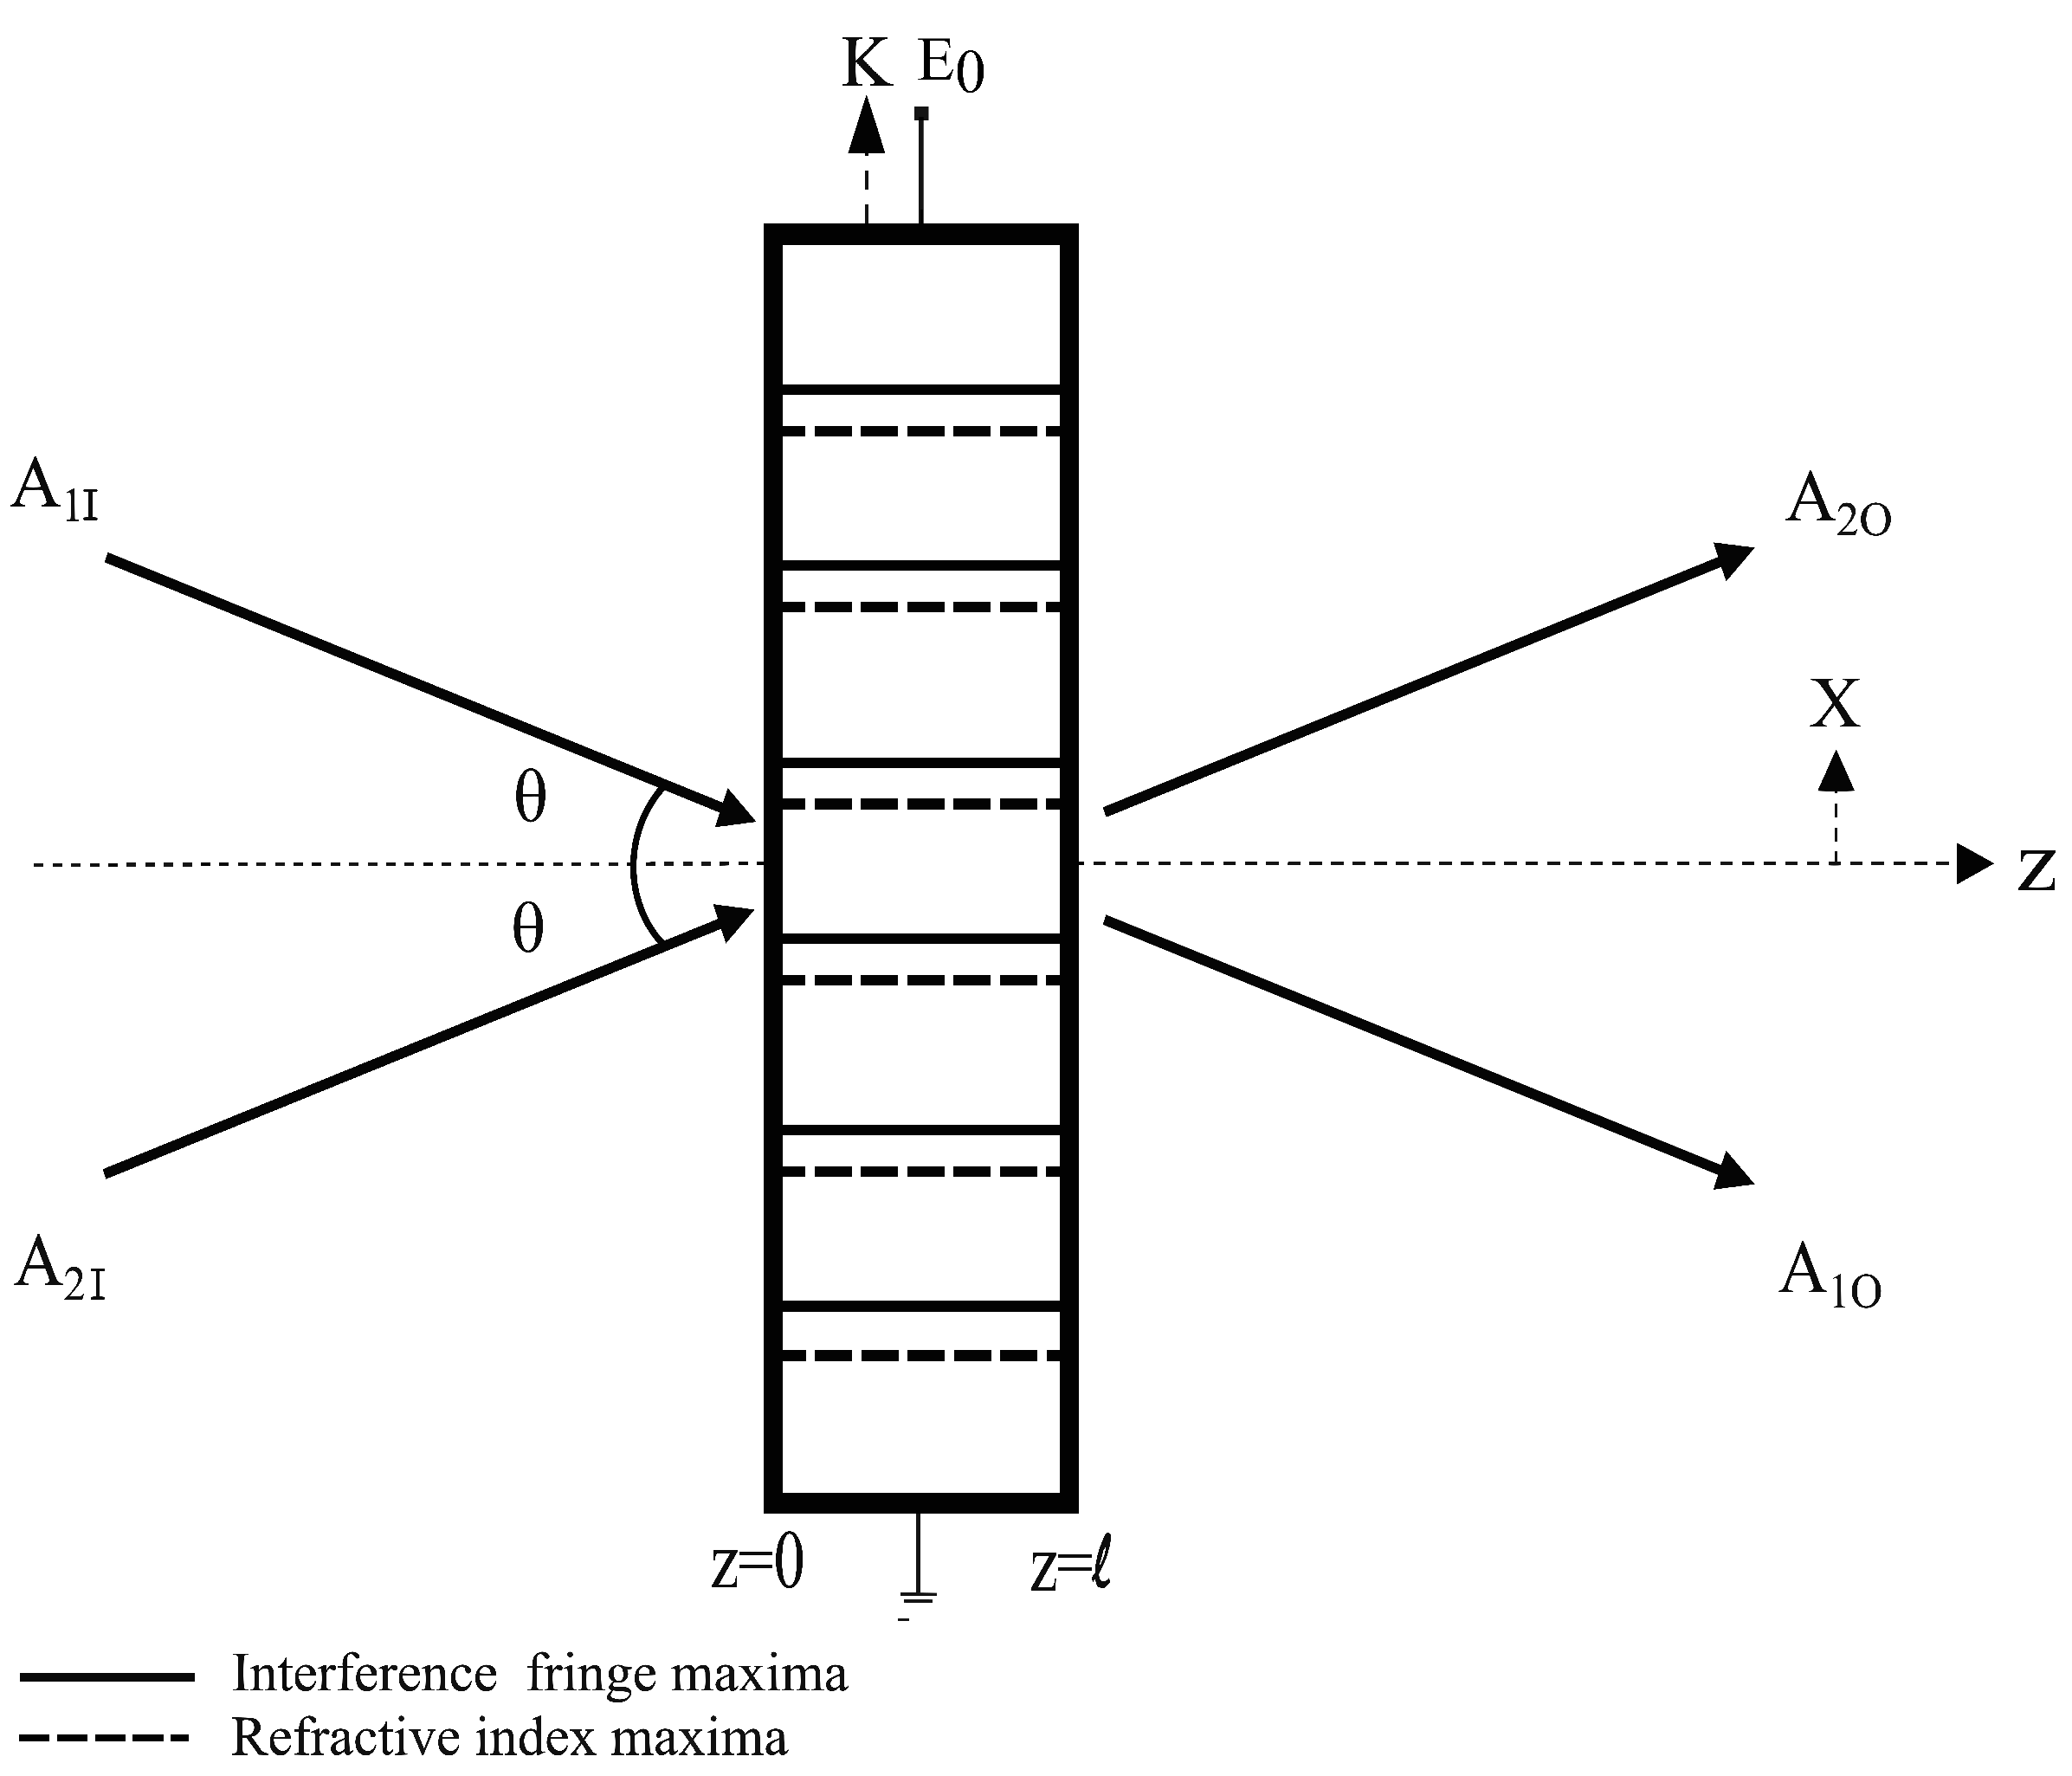
The photorefractive two-wave mixing configuration in a transmission geometry is shown in
Figure 1. Two plane waves,
and
, known as the reference beam and signal beam, respectively, occur on the same side of the crystal, making an angle
with each other on the x–z plane. The crystal axis (c-axis) is assumed to be oriented along the x-axis and is perpendicular to the bisector of the two beams, where the bisector is along the z-axis. Both plane waves,
and
, are s-polarized, and the plane of polarization is perpendicular to the c-axis of the crystal. The two beams superpose inside the material, creating an interference pattern with alternating bright and dark regions. The charge carriers in the brighter region of the material become photoexcited and migrate to the conduction band. From the conduction band, the carriers diffuse along the direction of their concentration gradient (with a characteristic ‘diffusion length’) before being trapped. The trapped carriers are then re-excited, re-trapped, re-excited again, and so on. After some time, the carriers are preferentially accumulated in the darker regions of the material, where they are less efficiently excited than anywhere else. This results in a spatial separation of charges (i.e., a spatially modulated pattern of carrier distribution in the material) within the material. This periodic separation results in the formation of a modulated space-charge electric field. The intensity pattern produced in the material due to the interference of two beams is sinusoidal in nature. The charge distribution after the excitation and trapping processes will also follow this sinusoidal pattern. Now, the sinusoidal charge distribution produces an electric field, whose strength is proportional to the gradient of the charge distribution (consequence of Poisson’s law). Since a sinusoid and its gradient are phase shifted by 90
∘, the charge distribution and electric field are also phase shifted by 90
∘. Then, the refractive index pattern is generated, which spatially aligns with the electric field (through Pockels effect). Hence, the irradiating intensity pattern and the resulting refractive index pattern are phase shifted by 90
∘. Then, the space-charge field is converted to a spatial modulation of refractive index of the material through an electro-optic effect known as ‘Pockels effect’. Therefore, the incident light interference pattern on a photorefractive material is converted into a refractive index grating in the material. The grating vector (K) produced by the photorefractive effect is perpendicular to the z-axis, as shown in
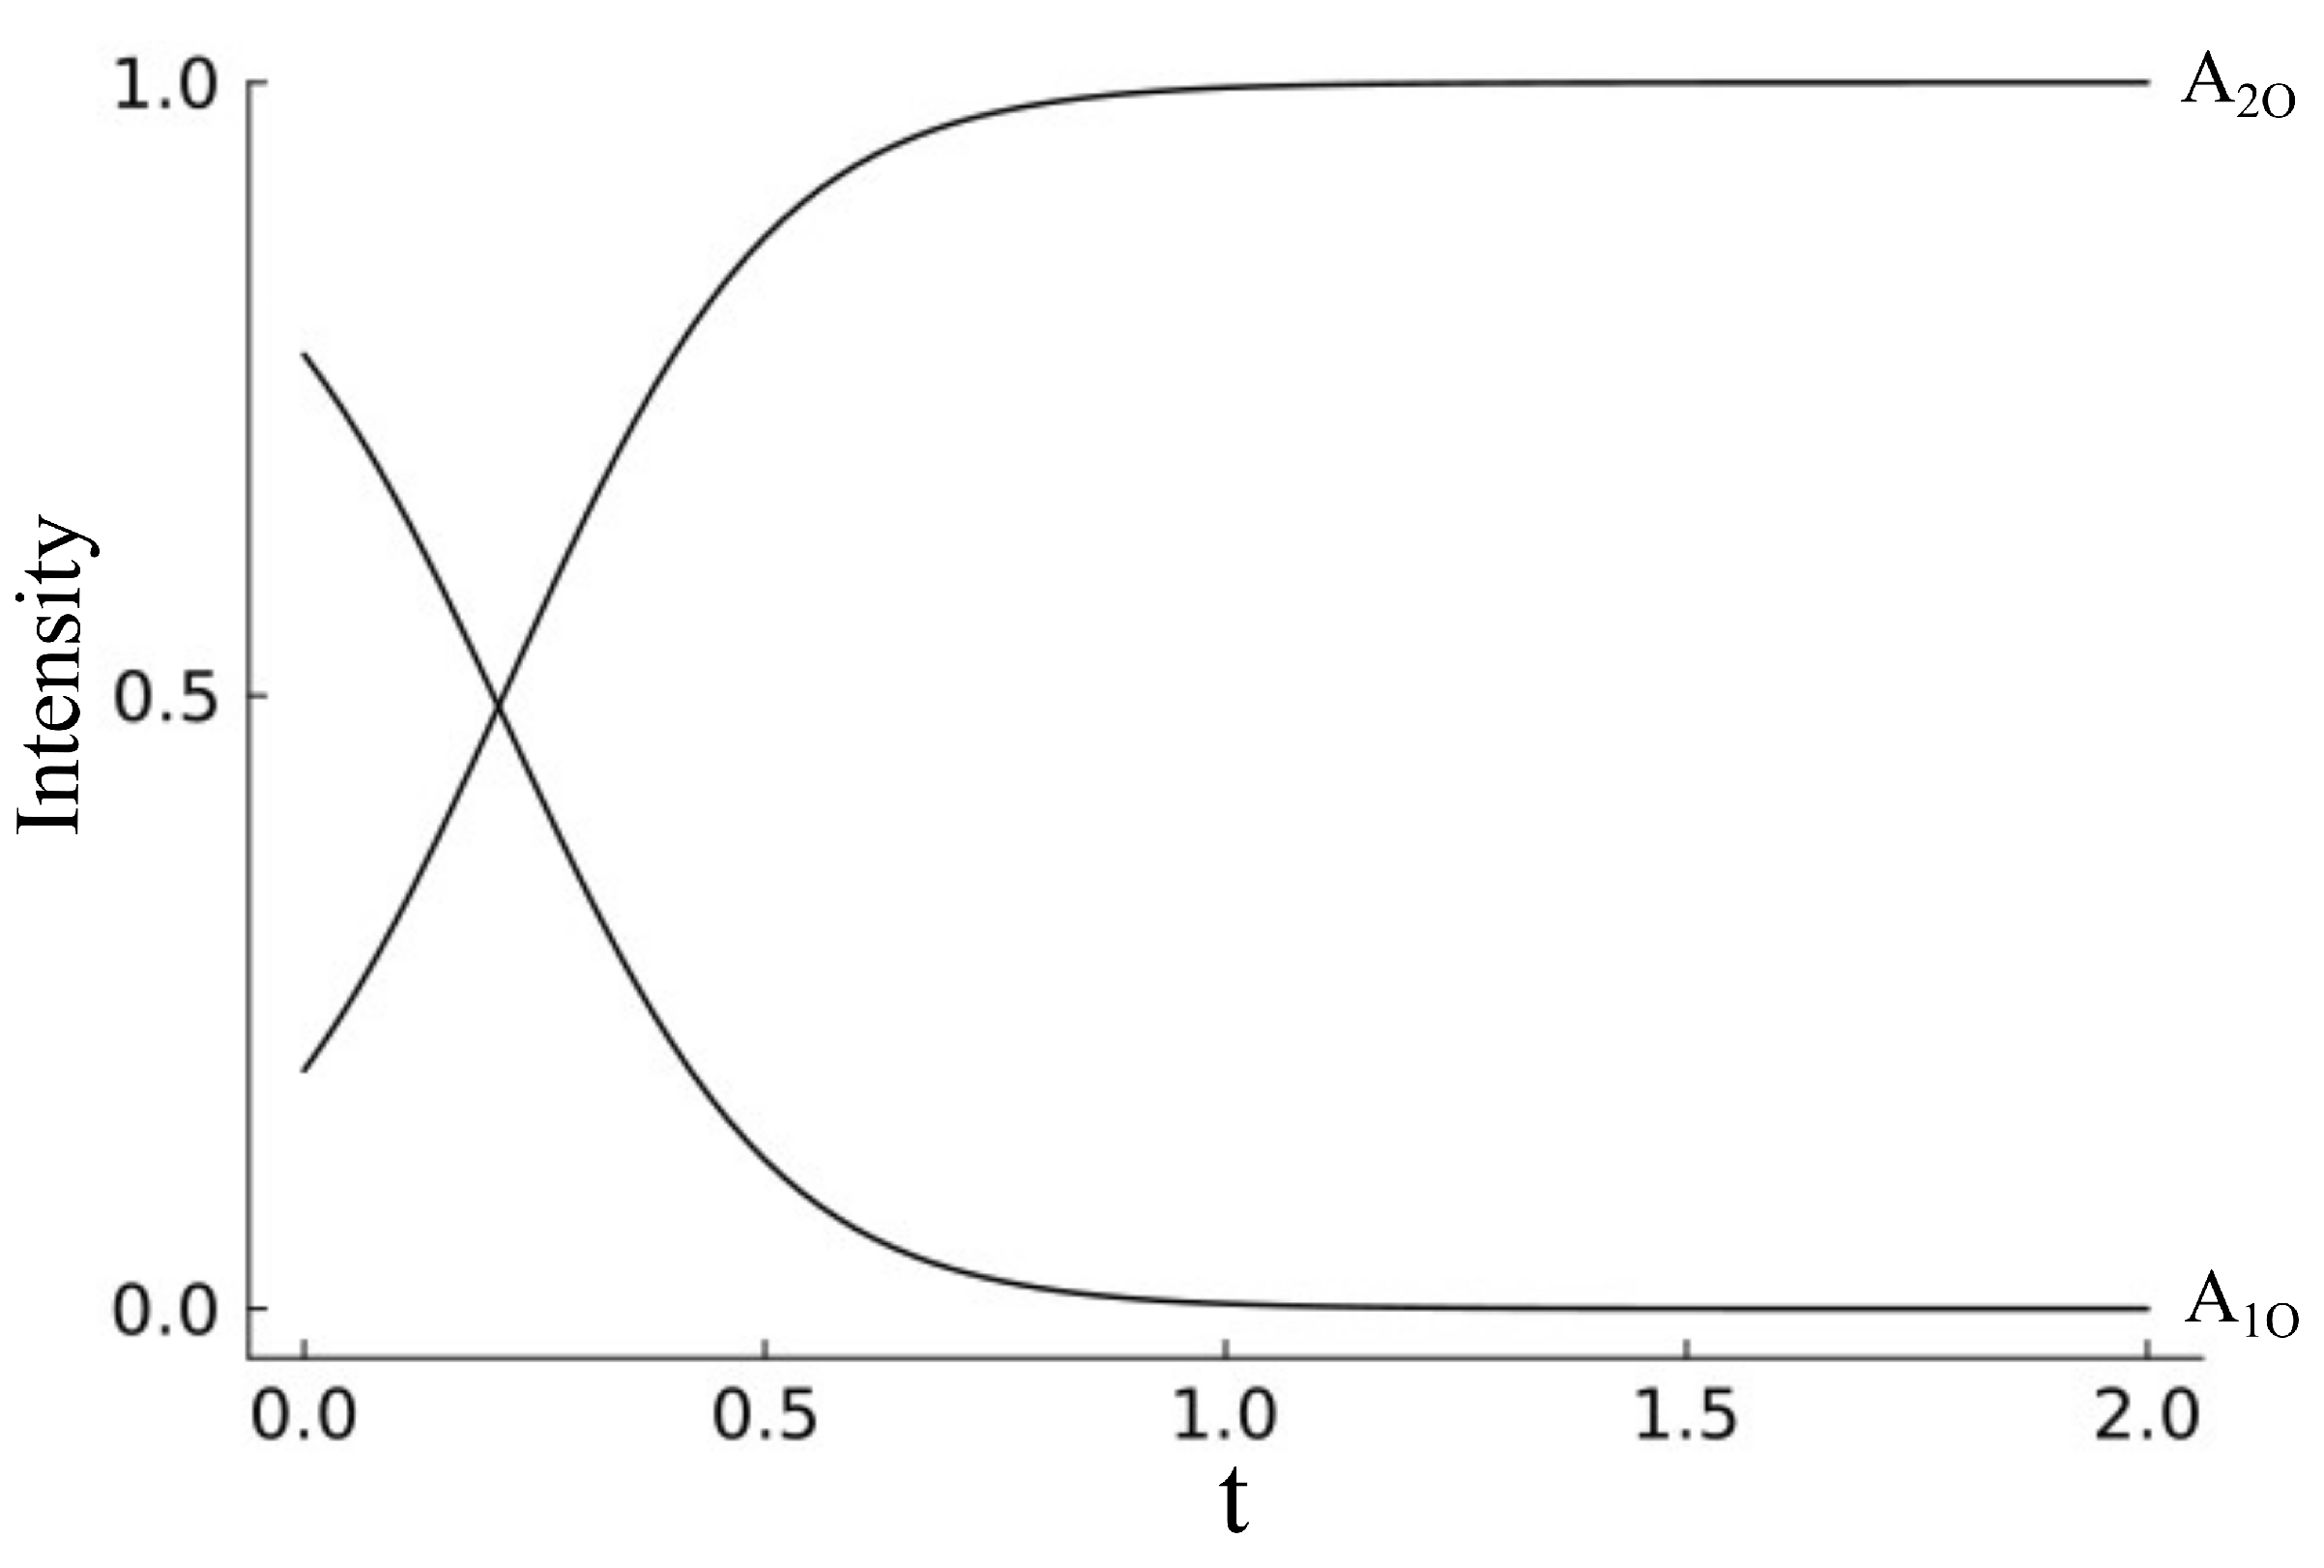
Figure 1. Several spatio-temporal events sequentially occur before the grating reaches a stationary state, which can be understood by observing temporal changes in the beams that exit from the crystal. One of the interesting observable phenomena is the energy exchange between two beams, as shown in
Figure 2. The irradiating pattern and the refractive index pattern being phase shifted by 90
∘ is the reason behind the energy exchange process. The phase shifted grating formed in the material affects (diffracts) the light beams that originally created the grating, which, as a result, writes a new grating, which again modifies the light beams, and the process goes on until a saturation is reached. This process is called ‘self-diffraction’, and the grating formed at the saturation point diffracts light in such a way that more light is pumped into the direction of one of the beams, resulting in the energy exchange process. The formation of phase-shifted refractive index grating induces a spatial non-locality, which is a distinctive feature of photorefractivity. It is this feature that plays a key role in the energy exchange process that occurs between the two beams in a PR-TWM process.
The mathematical description of the PR-TWM process involves the following three partial differential equations (Equations (
1)–(
3)). First, the evolution of the incident light fields inside the crystal is given by the Kogelnik’s coupled-wave theory, which is represented as a set of coupled differential equations (Equations (
1) and (
2)) [
21,
32]. Here, we neglect the time derivative since the time taken for light propagation in the crystal is significantly shorter than the time taken for grating formation. Hence, these equations describe the time-independent coupling between the incident light beams and provide an understanding of their behavior as they propagate through the crystal.
The incident light beams result in a space-charge field being developed in the crystal. The temporal evolution of the space-charge field or index grating in the material for a given light intensity distribution is described by the Kukhtarev’s time-dependent equation, Equation (
3) [
32,
43]. The temporally varying complex amplitude of the grating results in a temporally varying light intensity at the exit of the crystal. This temporal variation in the exiting (output) light signal is the pivotal factor in the generation of complex signals. Solutions to the three coupled differential equations (Equations (
1)–(
3)) will help us understand the characteristics of temporal variation in the intensity of the output beam.
In Equations (
1) and (
2), the term ‘
’ corresponds to the coupling constant, which is defined as ‘
’, where ‘
n’ is the background refractive index of the crystal. We assume there are linearly polarized beams (here, we consider the two writing beams to be ideal plane waves; this means that their intensity is perfectly uniform across the wavefront) intersecting at an angle of 10 degrees with respect to the z-axis, where ‘
w’ is the frequency of the input light field, ‘
r’ is the electro-optic coefficient, and ‘
c’ is the velocity of light. Here, the electro-optic co-efficient defines the direction of polarization of the light beam with respect to the orientation of the, crystal which is a tensor. In this paper, we use the effective electro-optic co-efficient from [
22], which is assumed to be a scalar and independent of the polarization of light. In Equation (
3), the terms ‘
Q’ and ‘
’ correspond to the complex amplitude of the index grating and the magnitude of the applied AC field, respectively. ‘
,
, &
’ represent the material fields in the crystal and are defined as follows: ‘
’ is the diffusion field, defined as ‘
’; ‘
’ is the electric field that moves an electron a distance of ‘
’ during its lifetime, defined as ‘
’; and ‘
’ is the saturation value of the space-charge field, defined as ‘
’. The above-mentioned parameters that correspond to the LiNbO
3 crystal can be found in [
44]. The photovoltaic effect is a characteristic property of a lithium niobate crystal, which is represented by the bulk photovoltaic term
. This bulk photovoltaic term
is not included in Equation (
3), which corresponds to the case where it can be neglected, as reported earlier [
21,
22]. But the
term cannot be neglected otherwise, and the equation that includes the ‘
’ term is shown in Equation (
4). Here, ‘
, where ‘
’ is the photovoltaic length. In this research, we will consider both the cases (with and without the photovoltaic term) in the simulation and discuss its effects.
As briefly mentioned earlier, the key idea behind the generation and control of a complex output signal is the application of a sinusoidal electric field across the crystal. Sinusoidal electric fields are usually used to enhance the amplitude of a space-charge field generated in the material. But here, we focus on understanding the nonlinear dynamic behavior it induces on the output light signal by virtue of the energy exchange process. The dynamics here originate from the interaction (coupling) between the beams, resulting in an energy exchange process. This beam coupling is mediated by the refractive index modulation, which the beams themselves have created in the first place, while passing through the crystal. Thus, the grating and the light beams are in a bound relationship with each other (a feedback-like mechanism), and they both evolve together in space and time, influencing each other. Now, the application of an external sinusoidal field affects this relationship, which in turn affects the spatio-temporal evolution process, resulting in a complex modulation in coupling [
45]. Such modulations that occur on the application of a square-wave electric field has already been investigated [
46]. Accordingly, Equation (
3) is applicable to time-varying applied electric fields when the period of the applied field is greater than the free-carrier lifetime. Under this condition, each free carrier essentially encounters a slowly varying sinusiodal electric field throughout its lifespan. As carriers are generated at different moments, each of them experience a distinct electric field. Hence, the applied electric field is incorporated into the Kukhtarev equations as a force acting on the free carriers, and Equation (
3) can be employed for understanding the effects of thee applied electric field [
47]. Since it is difficult to analytically solve the three coupled differential equations, we resort to numerical methods to understand the dynamic behavior.
3. Numerical Analysis
Here, we employ simulation methods to find out the temporal evolution of the complex amplitude of exiting light beams in a PR-TWM process. For this, it is required to solve the coupled differential Equations (
1)–(
3). We use the fourth-order Runge–Kutta method to numerically solve these equations. For Equations (
1) and (
2), we set the boundary conditions as
and
, which corresponds to the unperturbed value of the optical fields at the input end of the crystal for all time. The wavelength of light used is 533 nm for both
and
, and the temperature was set to 300 K (room temperature). For Equation (
3), we set the initial condition as
, which means that the space-charge field (grating amplitude) is zero over all the space at the initial time period (i.e., we start with no grating at t = 0). Substituting Equation (
3) with Equation (
4) will enable us to simulate the PR-TWM process with the photovoltaic effect included (i.e., with the
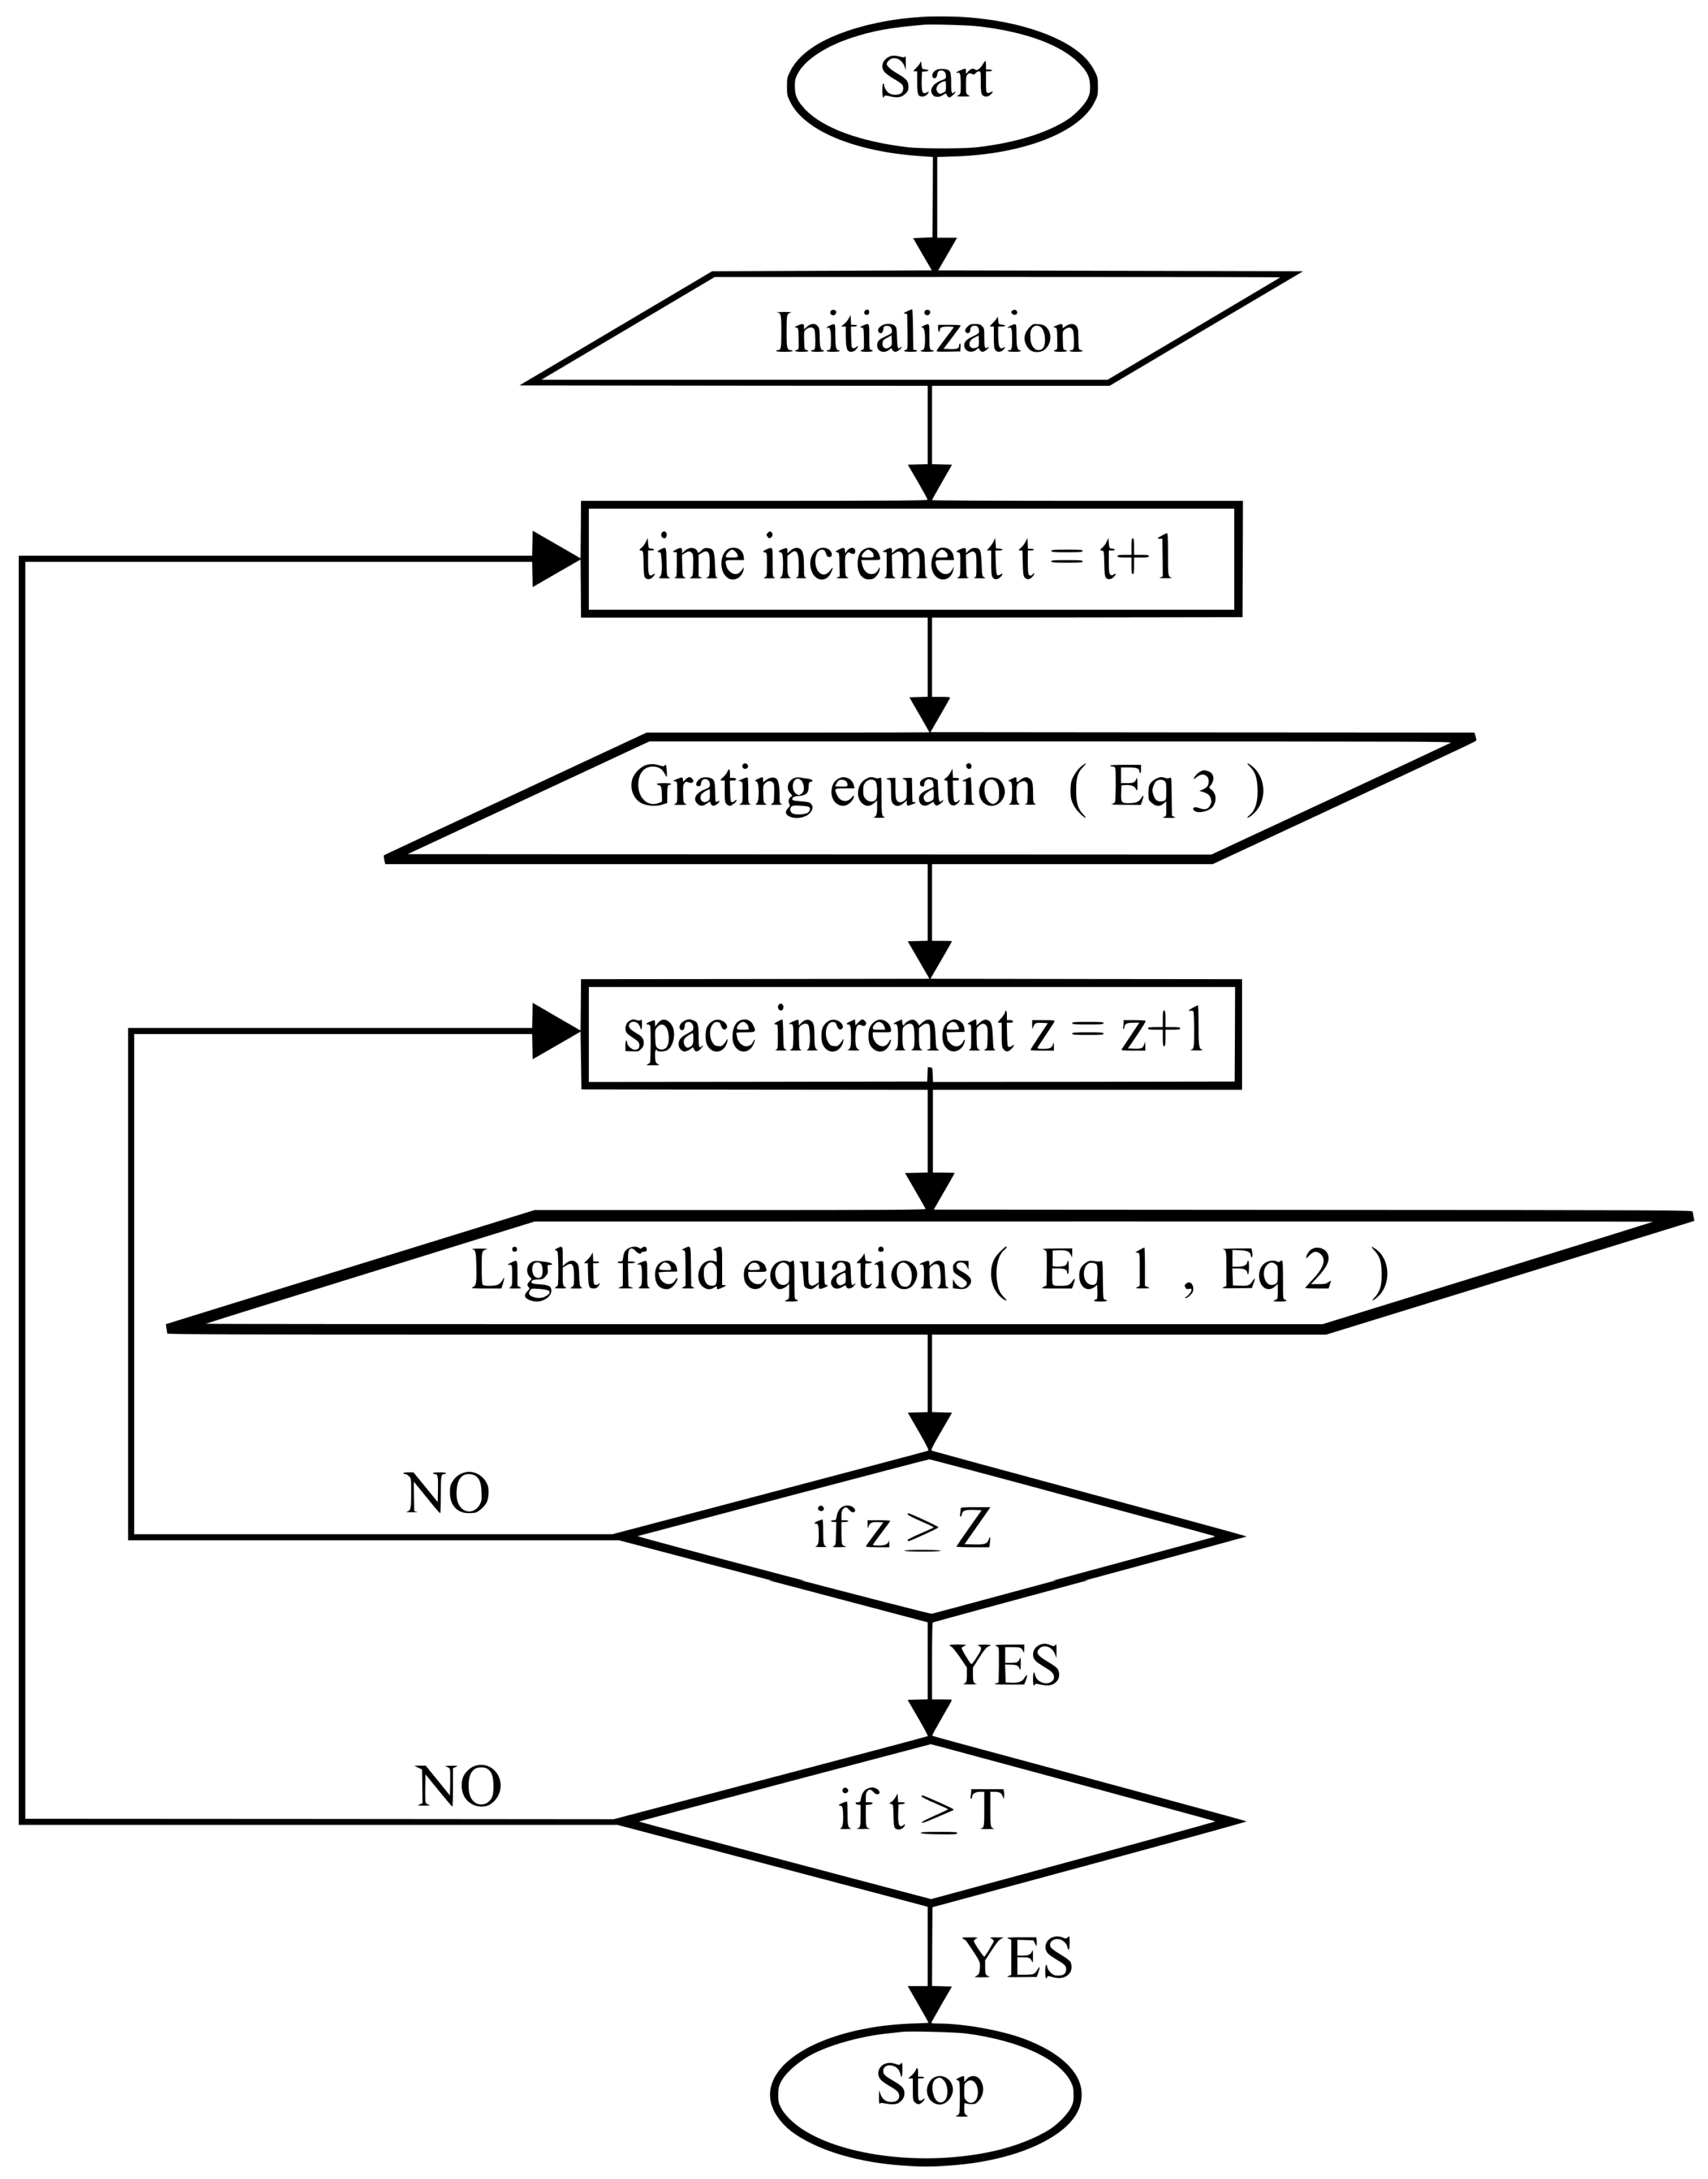
term). The flow chart that describes the whole simulation process is shown in
Figure 3.
After the first time interval
, the presence of optical fields (
and
) creates a non-zero value for the space-charge field,
Q. After this, the non-zero value of the space-charge field, in turn, affects the spatial variation of optical fields, resulting in beam coupling. The new values of
and
are then obtained by substituting the previous non-zero value of
Q in Equations (
1) and (
2). In the next time interval, we compute the updated value of
Q from the new values of
and
. Therefore, in a nutshell, the spatial variations in optical fields create a new grating amplitude in each step, and this new grating amplitude, in turn, affects the spatial variations of optical fields in the subsequent step, giving rise to temporally dynamic behavior. The above-mentioned computation steps are iterated until the spatial and temporal limits (described below) are reached. The spatial limit is given by the crystal length, which is 1.7 cm, and the temporal limit is set to be 2 s. These are typical real-world values used in PR-TWM experiments. We divide both space and time into 2000 points for our numerical integration, which generates a matrix of the size 2000 × 2000. Each element in the output matrix represents the intensity of the signal beam at each point in the crystal at a given specific time. During numerical integration, we gradually reduced the time steps (increasing data points) until the variation between results fell below the desired level of accuracy. This was repeated for all values of the applied electric field. The step size was fixed such that any further reduction in the chosen step size does not affect the results. The numerical computations were conducted using Julia programming language. The absolute values of crystal parameters and fundamental constants we used in the computation are listed in
Table 1.
4. Results and Discussions
To understand the complexities, we plot the variation in intensity of the signal beam at the exit of the crystal. The plots are then generated for varying applied electric fields to understand the changes in complexity of the signal with the electric field and the route to chaos.
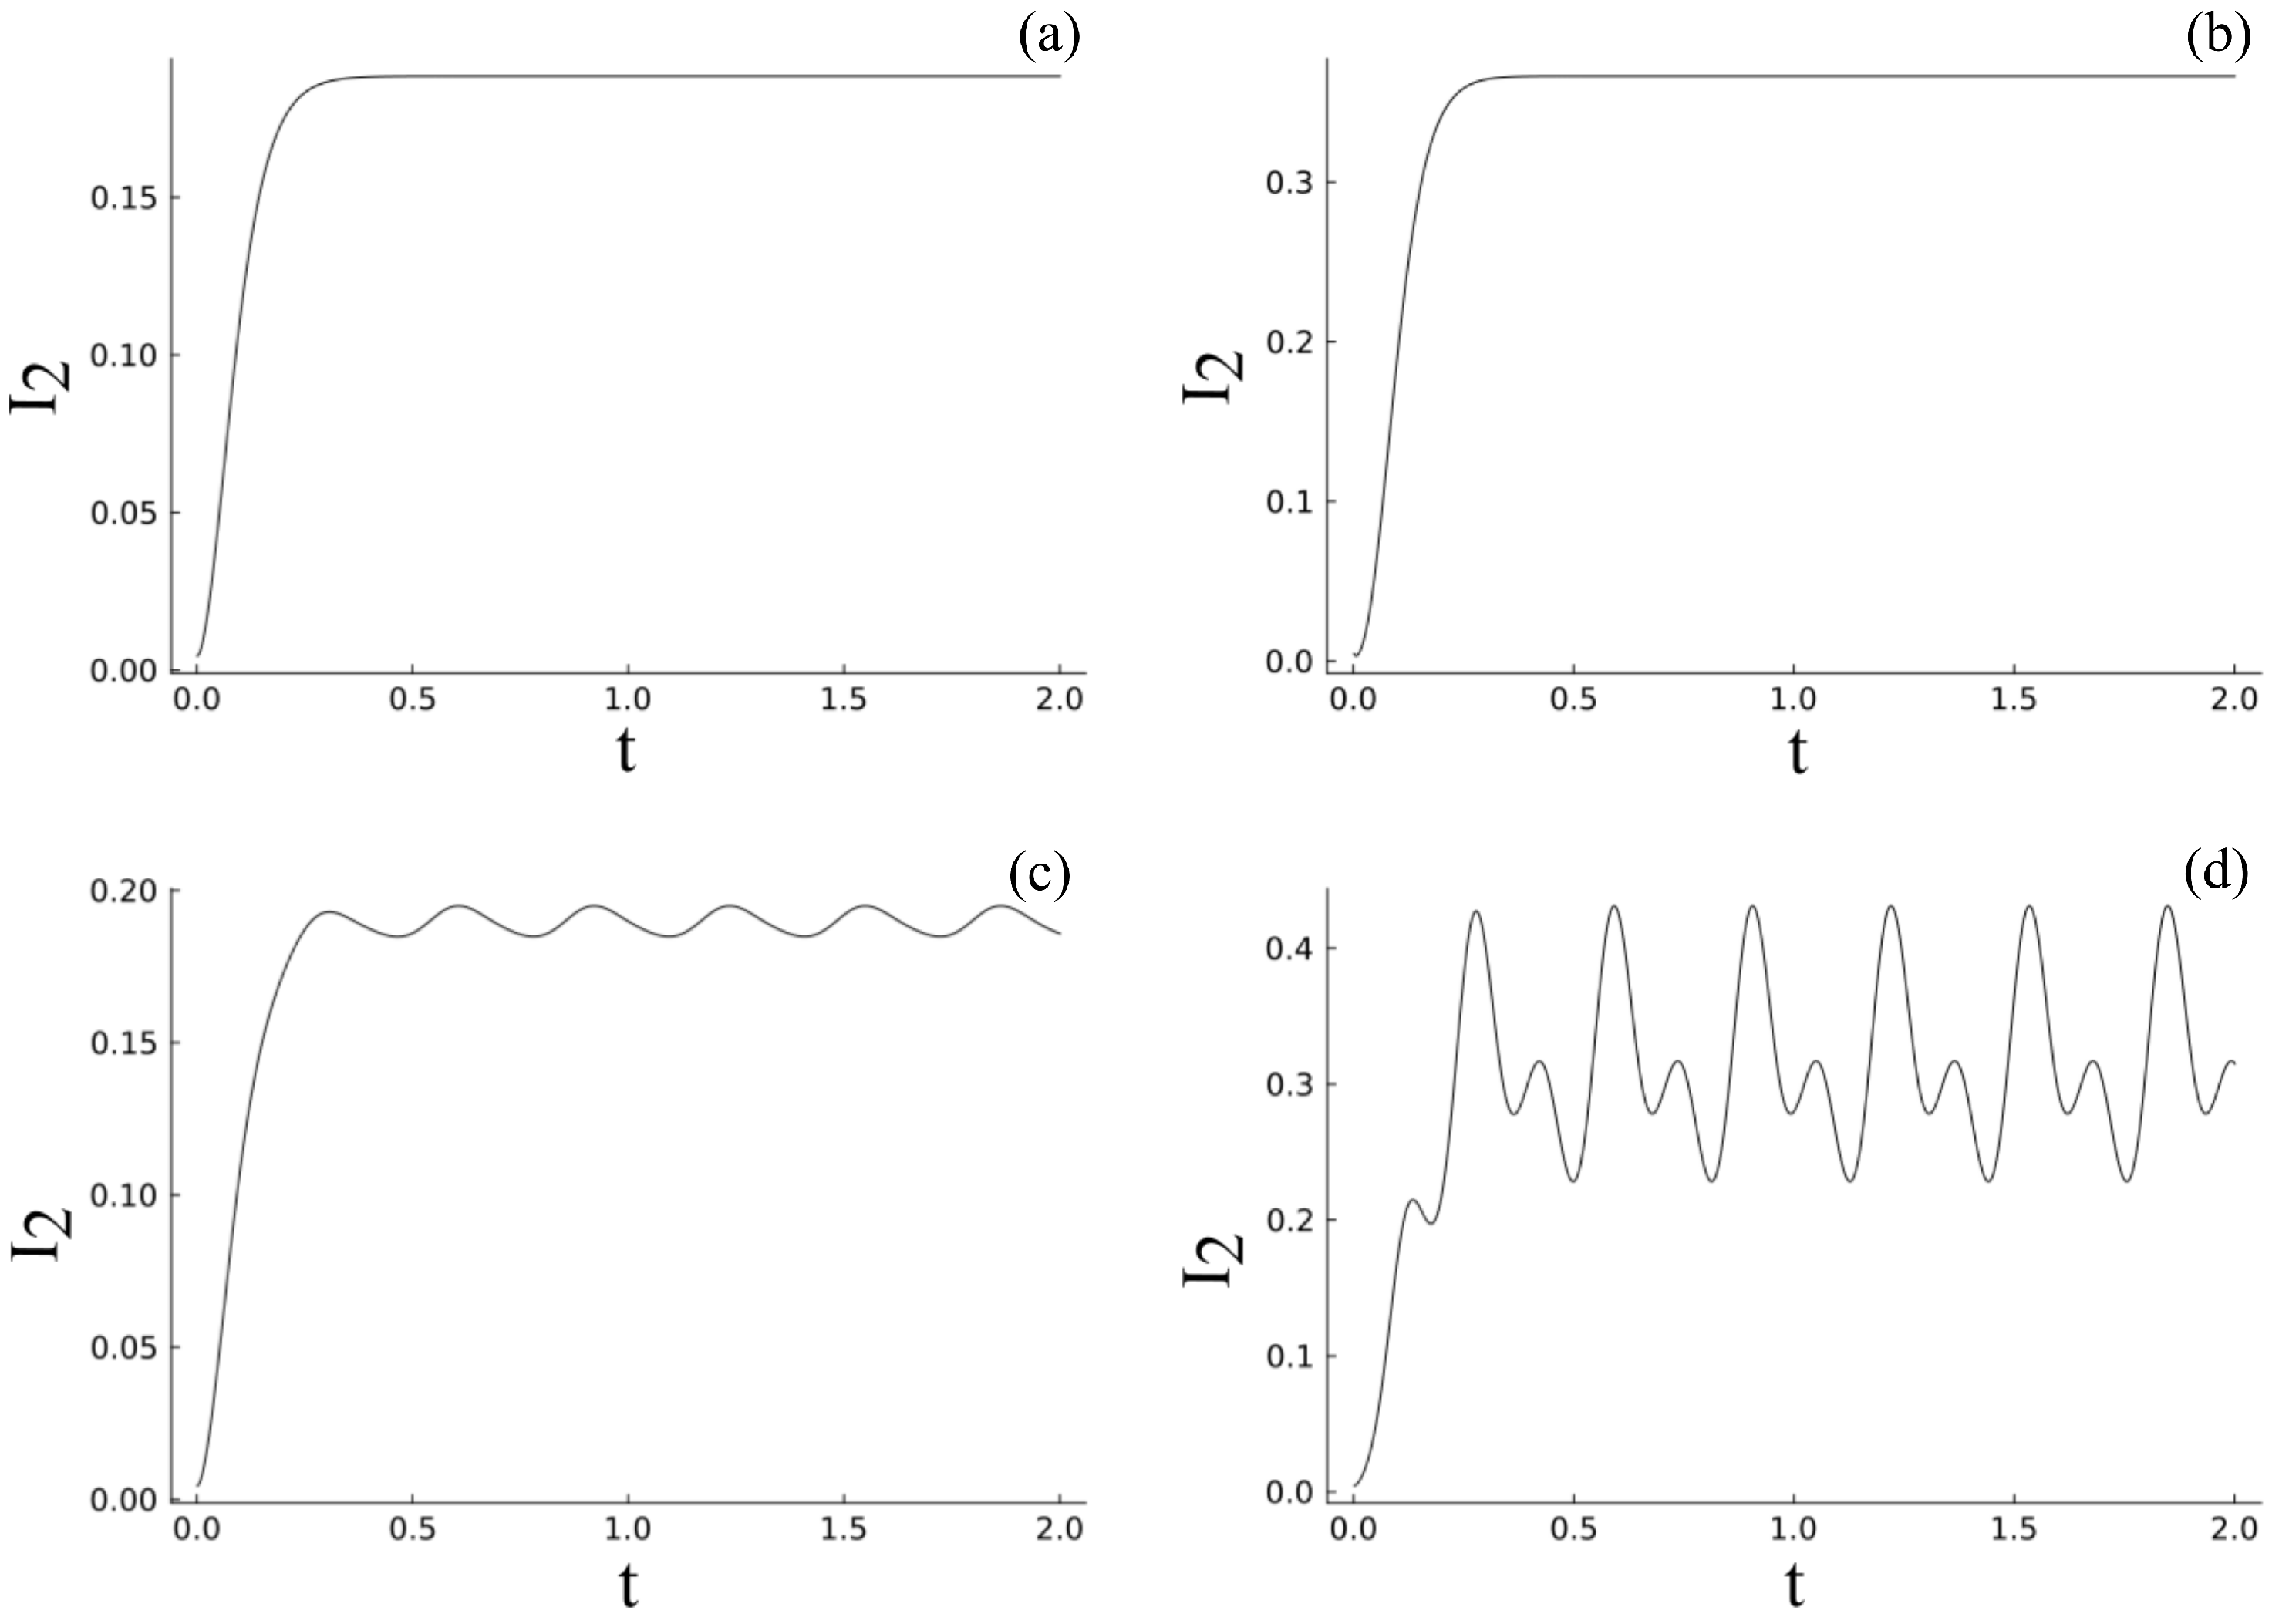
First, we look at the output intensity of the signal beam (
) with no applied electric field, which is shown in
Figure 4a. Here, we observe a simple intensity gain profile, followed by a saturation, which agrees with the standard output pattern of a PR-TWM process (simple diffusion-only case, without an external field). Then, we apply a DC field of a low magnitude at 2 KV/cm, and the corresponding output signal beam is shown in
Figure 4b. Here, we see an increase in the magnitude of gain compared to the previous (no field) case, which can be attributed to the contributions from the drift of carriers, in addition to diffusion. Now, when we apply a sinusoidal field with a low amplitude (0.1 KV/cm), we start to observe small oscillations, but it still follows a saturation pattern, as seen in
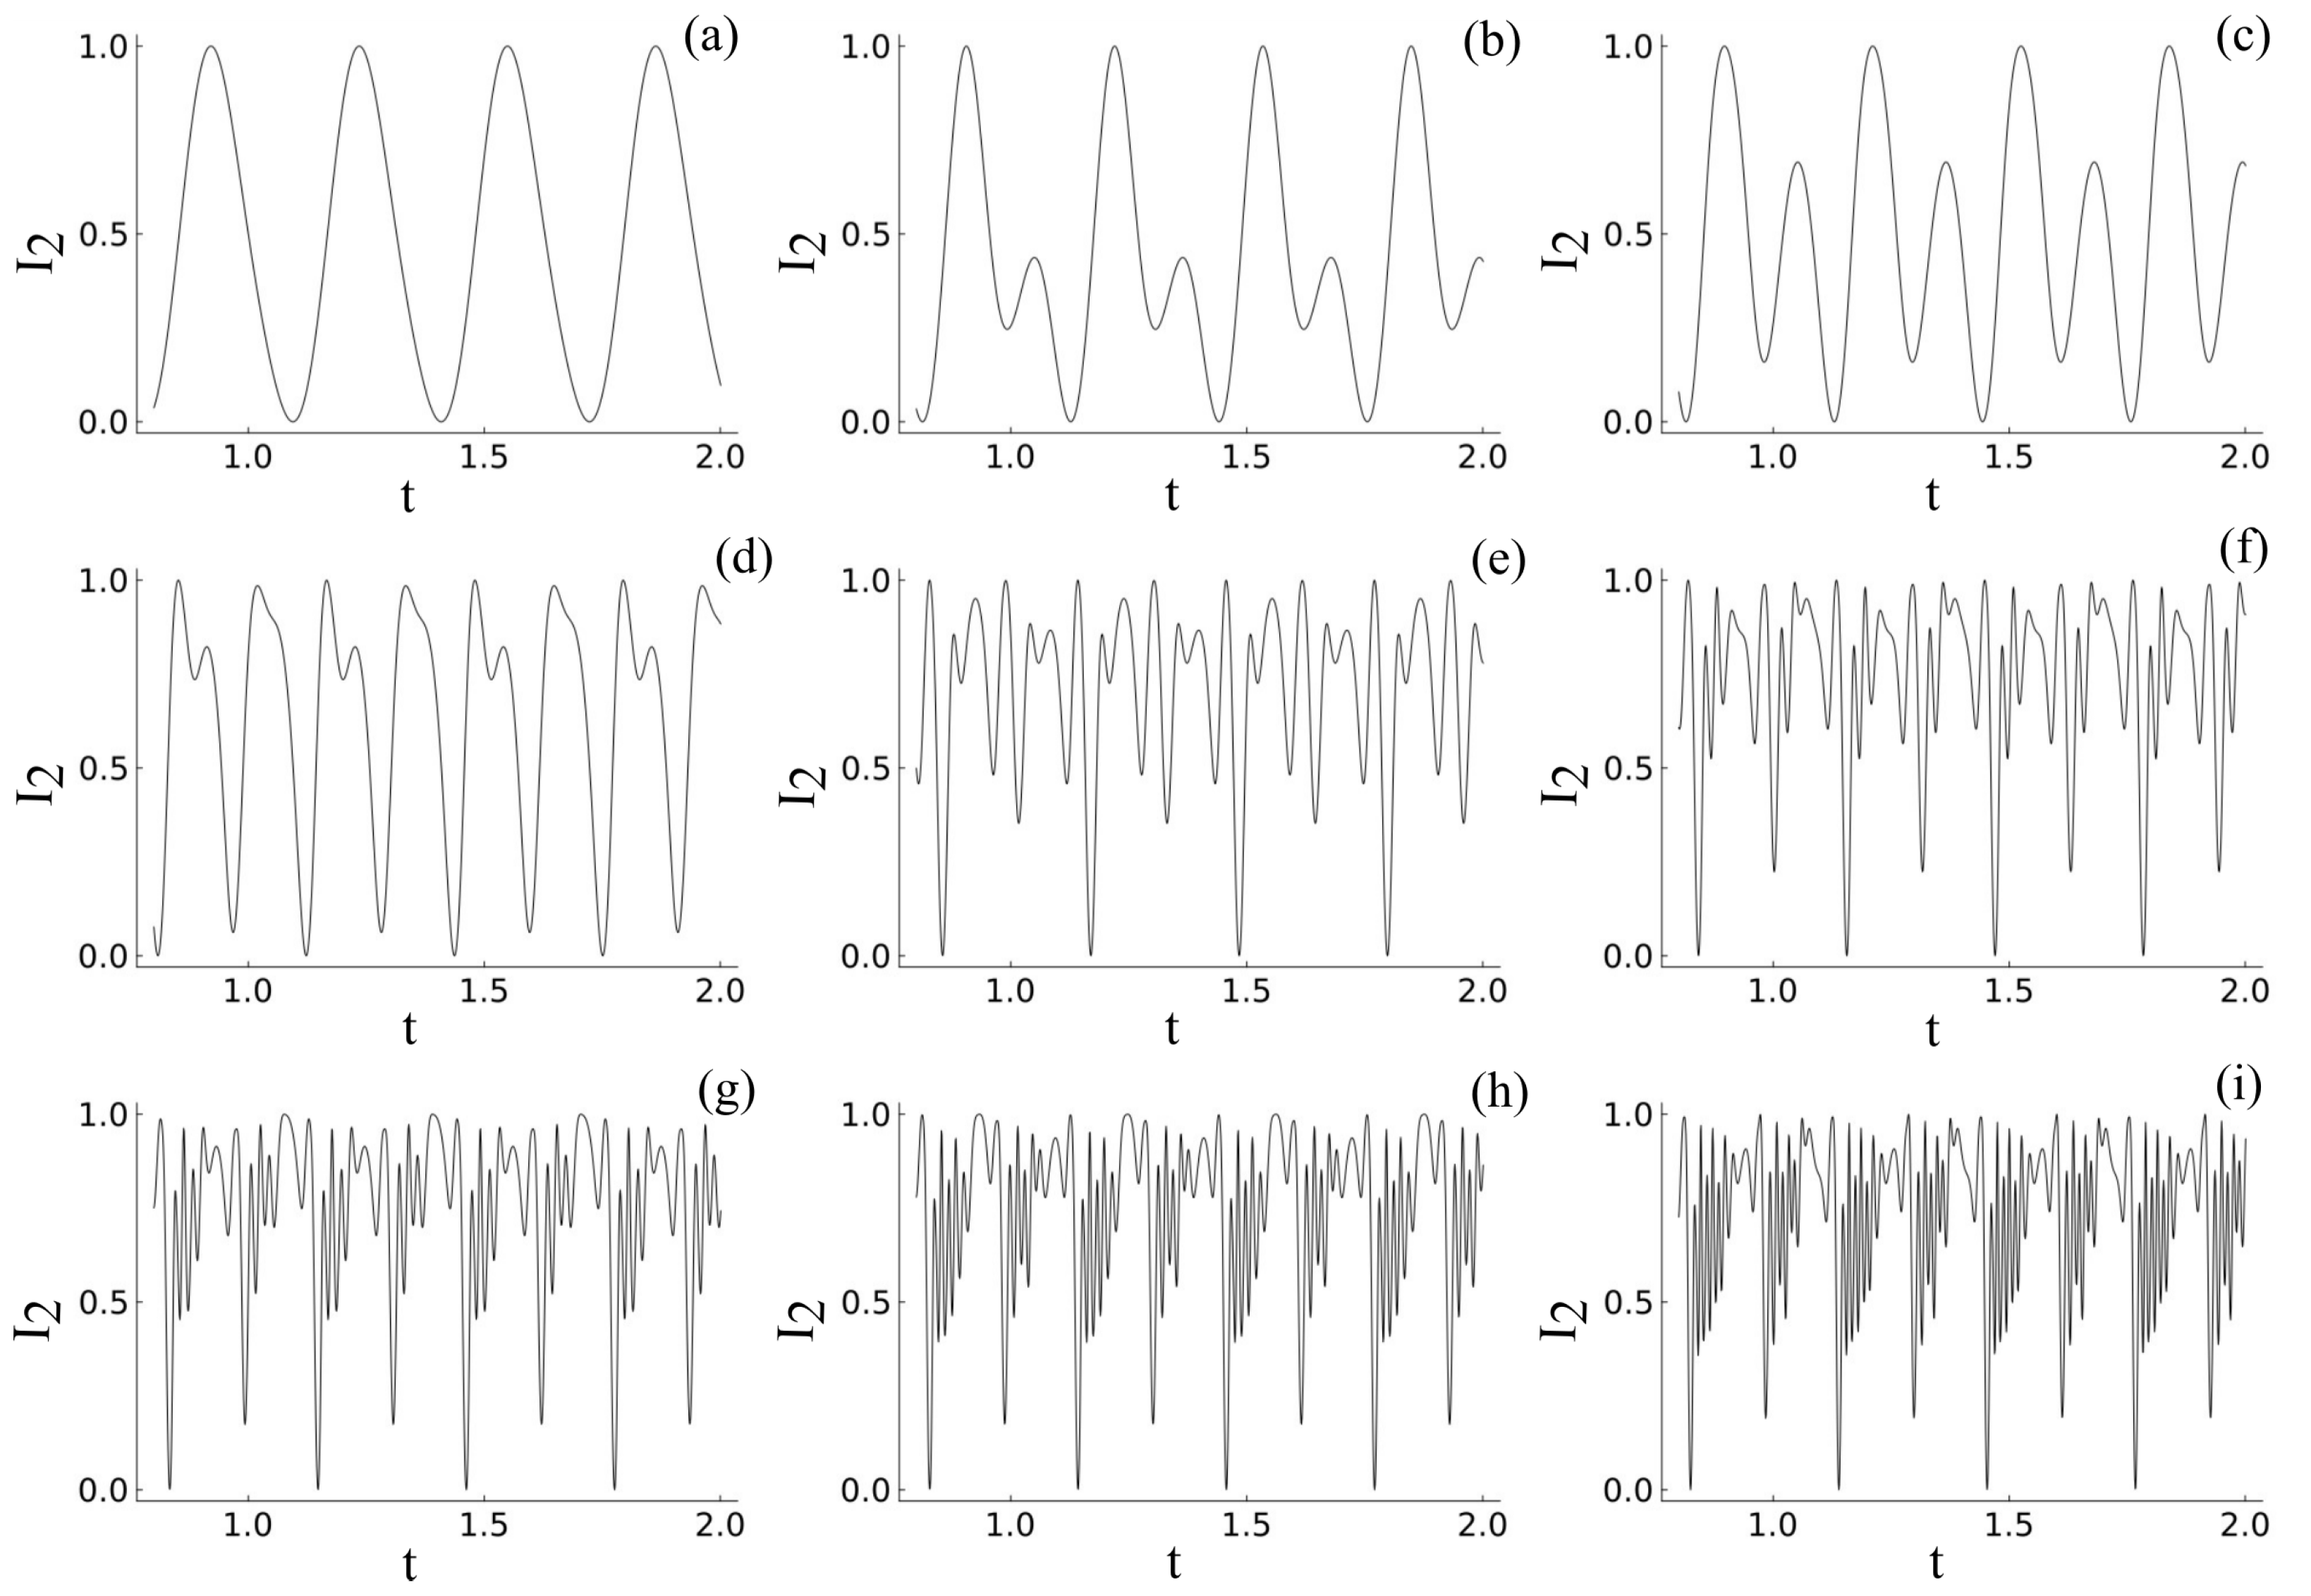
Figure 4c. Now, when the amplitude of the applied field is increased further, things start to get more interesting. The intensity of the output signal (
) starts to show more oscillatory behavior (unstable) with a definite periodicity and deviates from saturation with a definite periodicity, as shown in
Figure 4d. A further increase in the amplitude of the electric field results in a complex oscillatory behavior, accompanied by the generation of new frequencies, which are discussed below.
Since we are interested in understanding the emergence of new periodic patterns, we plot the variation of the signal beam (
) with respect to time for different magnitudes of the applied field, as shown in
Figure 5. An increase in the applied field increases the absolute amplitude of the output signal (higher gain). But here, we are are interested in the new-born patterns and their frequencies and not on the absolute value of intensity. Hence, we normalize the intensity of the signal beam
in the plots, which makes the qualitative comparison of the different pattern generated easy. For normalization, we consider the abscissa to start from 0.5 units of time to 2.0 units of time. Upon increasing the amplitude of the sinusoidal electric field (keeping the frequency fixed), we can see the emergence of new peaks with new frequencies, as shown in
Figure 5b–i. The emergence of the new peaks can be attributed to the coupled sequence of events (from carrier generation to refractive index modulation to light diffraction) happening in space and time, which generates a nonlinear dynamic optical response. This response can be visualized as amplitude modulations in the exiting light beams. But this dynamic response can quickly converge to a saturation. Here, since we perturb the system, (using a sinusoidal electric field) the generated nonlinear dynamic signals persist forever. Hence, we observe a continuous generation of new frequency components in the output signal. When the applied electric field is increased further, then the intensity of the output signal shows more closely packed peaks with no clear periodicity.
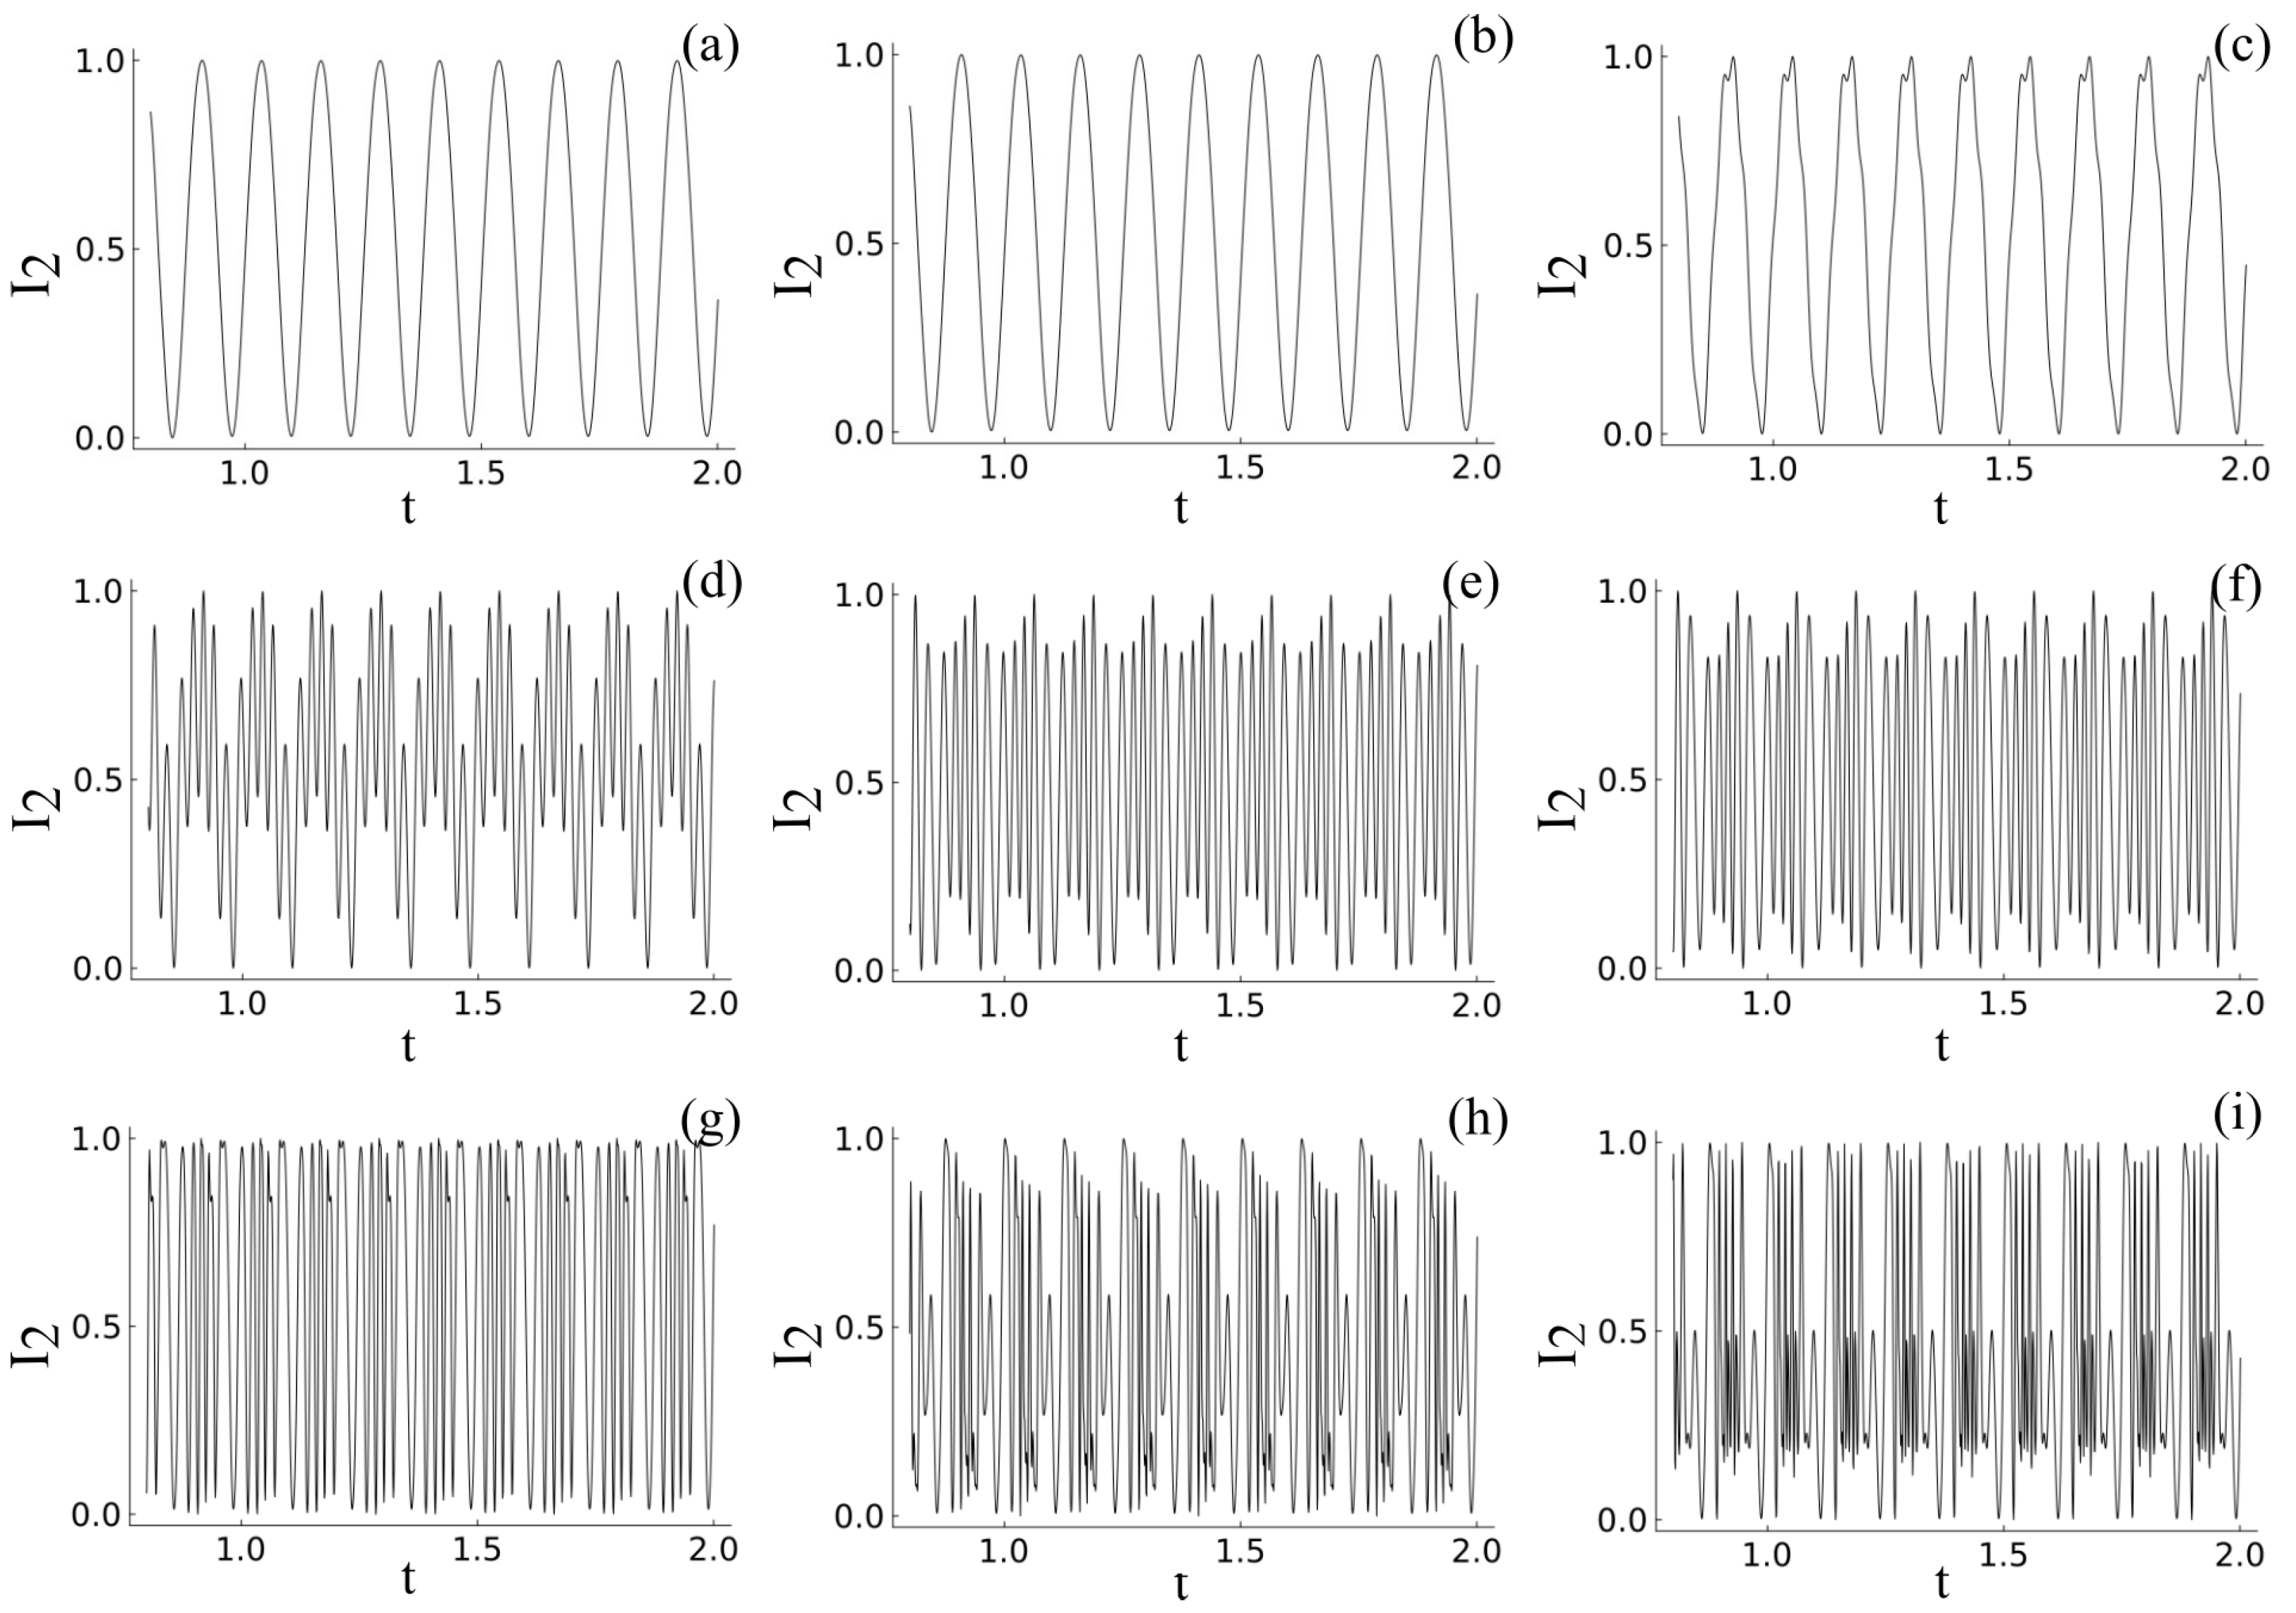
We now examine the case where the photovoltaic effect is not neglected. For this, we re-run the simulation but use Equation (
4) this time, where the value of
used is shown in
Table 1. Here, the applied fields were set from 0.1 KV/cm to 14 KV/cm since a chaotic response was observed for higher applied fields. The change in intensity of the light signal with time is plotted in
Figure 6a–i. From the plots, a similar behavior (to the
neglected case) can be observed, where the complexity in the nonlinear dynamic signals increases with the applied field amplitude. But it is interesting to note that it does not follow the same frequency pattern and exhibits a more complex period-doubling route here. From this, we can conclude that the PR-TWM shows period-doubling behavior for both cases but with different frequency patterns.
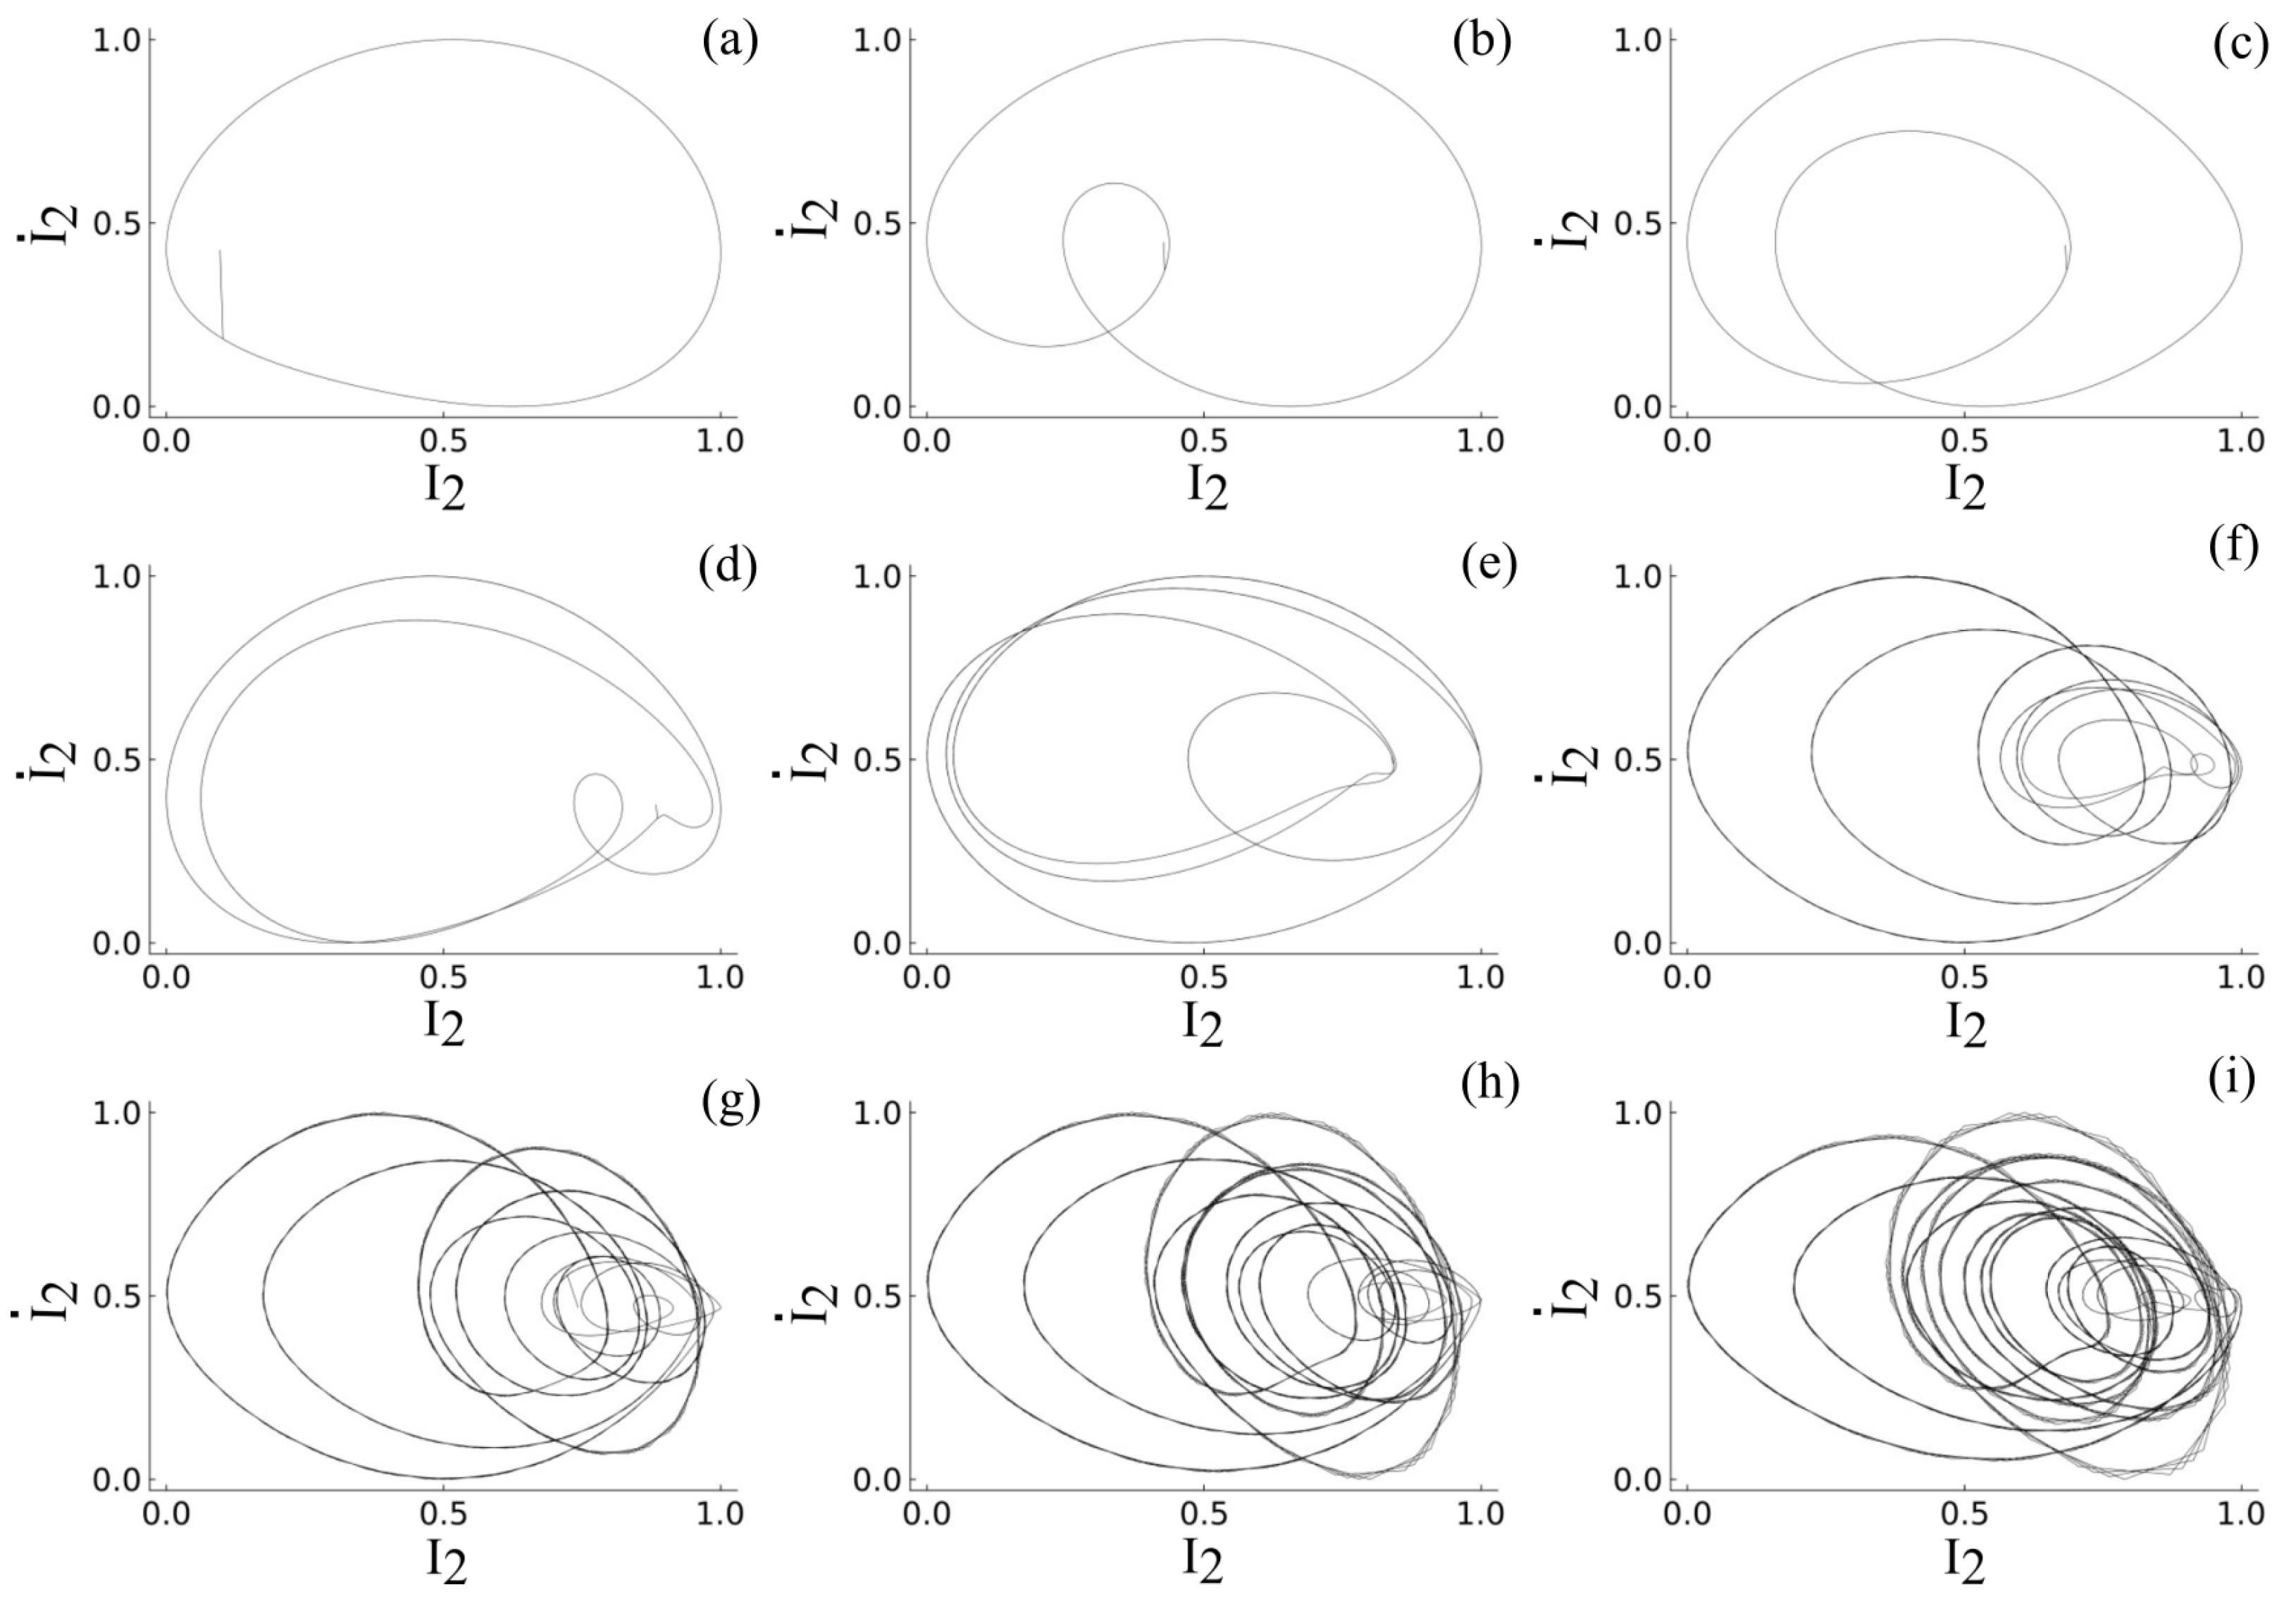
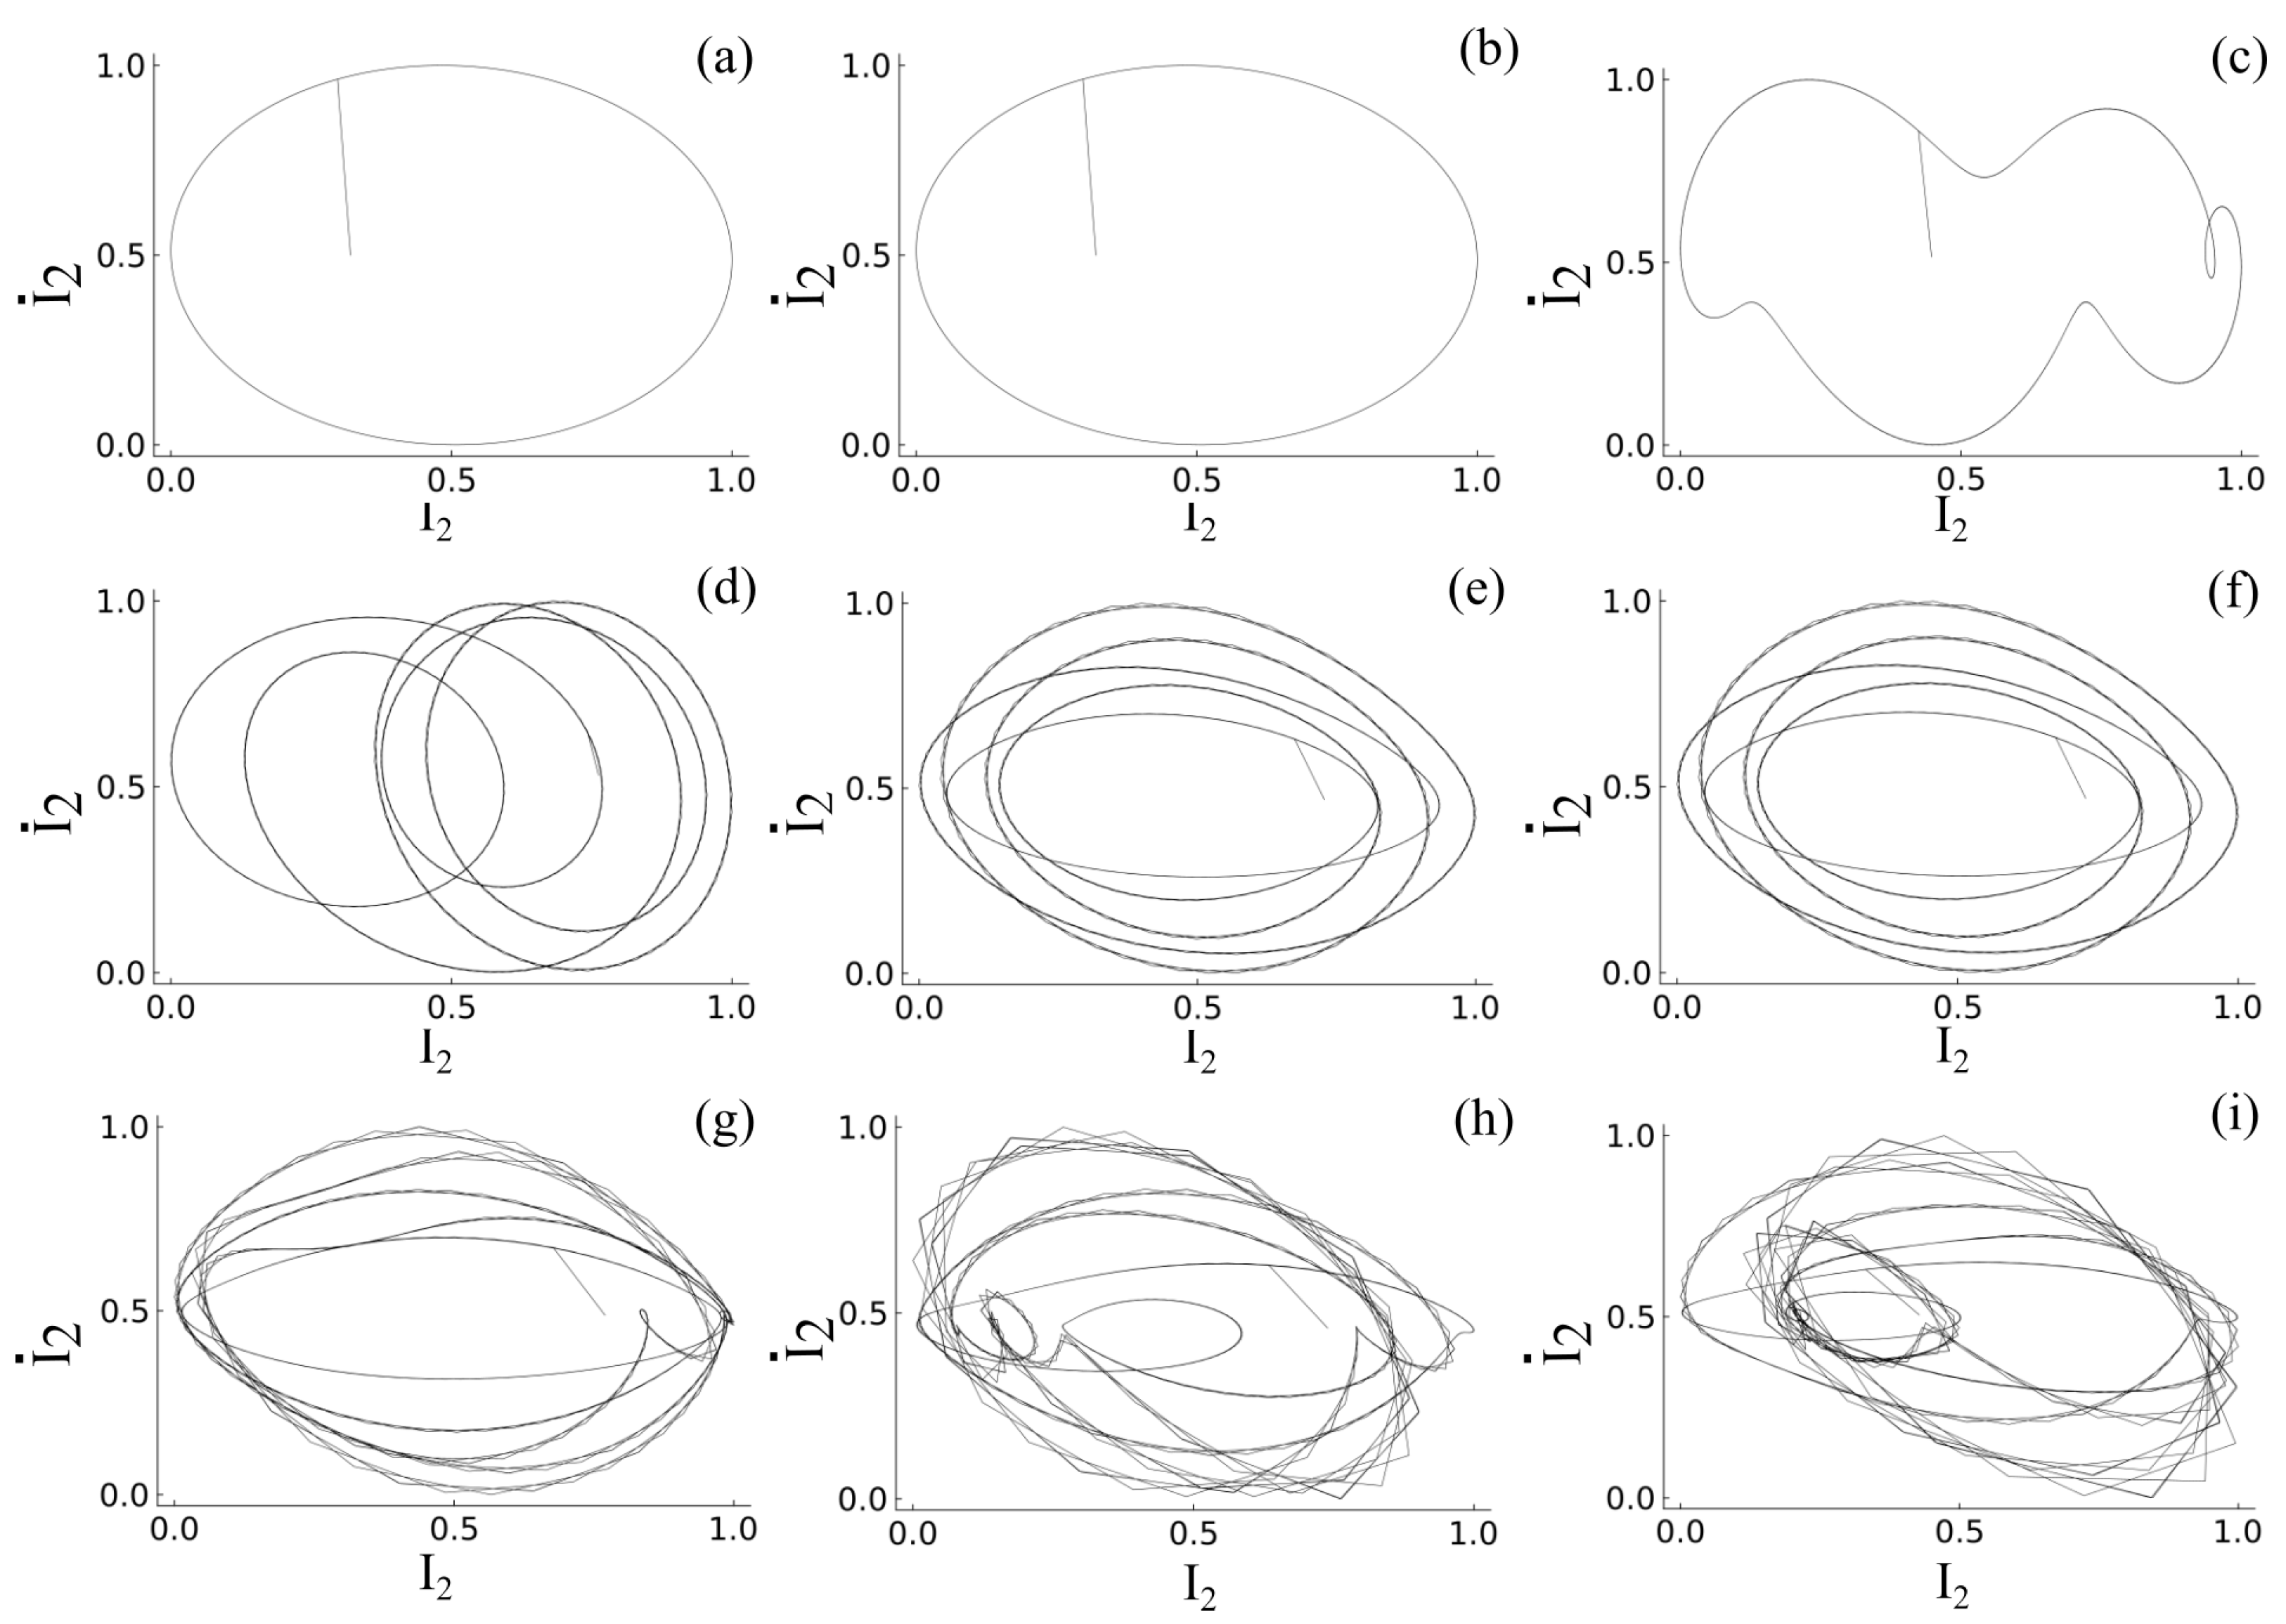
To better understand the periodicity of the generated peaks and their complex nature, phase portraits of the output signal beam are generated. A phase portrait is nothing but a plot of the derivative of intensity (
) versus intensity (I). The phase portrait of the output beam corresponding to each applied field (0.1 KV/cm to 24 KV/cm) for the photovoltaic effect negligible case are shown in
Figure 7a–i. From the intensity plots (
Figure 5) and phase plots (
Figure 7), we can confirm the existence of period doubling, which is a characteristic feature of nonlinear dynamic systems. The phase plots for the system with a photovoltaic effect for varying applied fields (0.1 KV/cm to 14 KV/cm) are shown in
Figure 8a–i, respectively. From the intensity plots (
Figure 6) and phase plots (
Figure 8), we can conclude that the existence of the photovoltaic effect does not change the period-doubling behavior of the system. But it is important to note that the period-doubling behavior happens only between the applied voltage range of 0.1 KV/cm to 14 KV/cm, after which a more chaotic behavior is observed. In other words, the effect of the photovoltaics is to increase the complexity and thereby reach the chaotic regime quickly. Another direct observation from the plot is that the nonlinear dynamic response of
can be controlled through the magnitude of the applied field
. The angle between the incident beams was set to be 10
∘ in the simulation to replicate real-world use case scenarios. But complex behavior with different periods and amplitudes were observed for other incident angles as well.
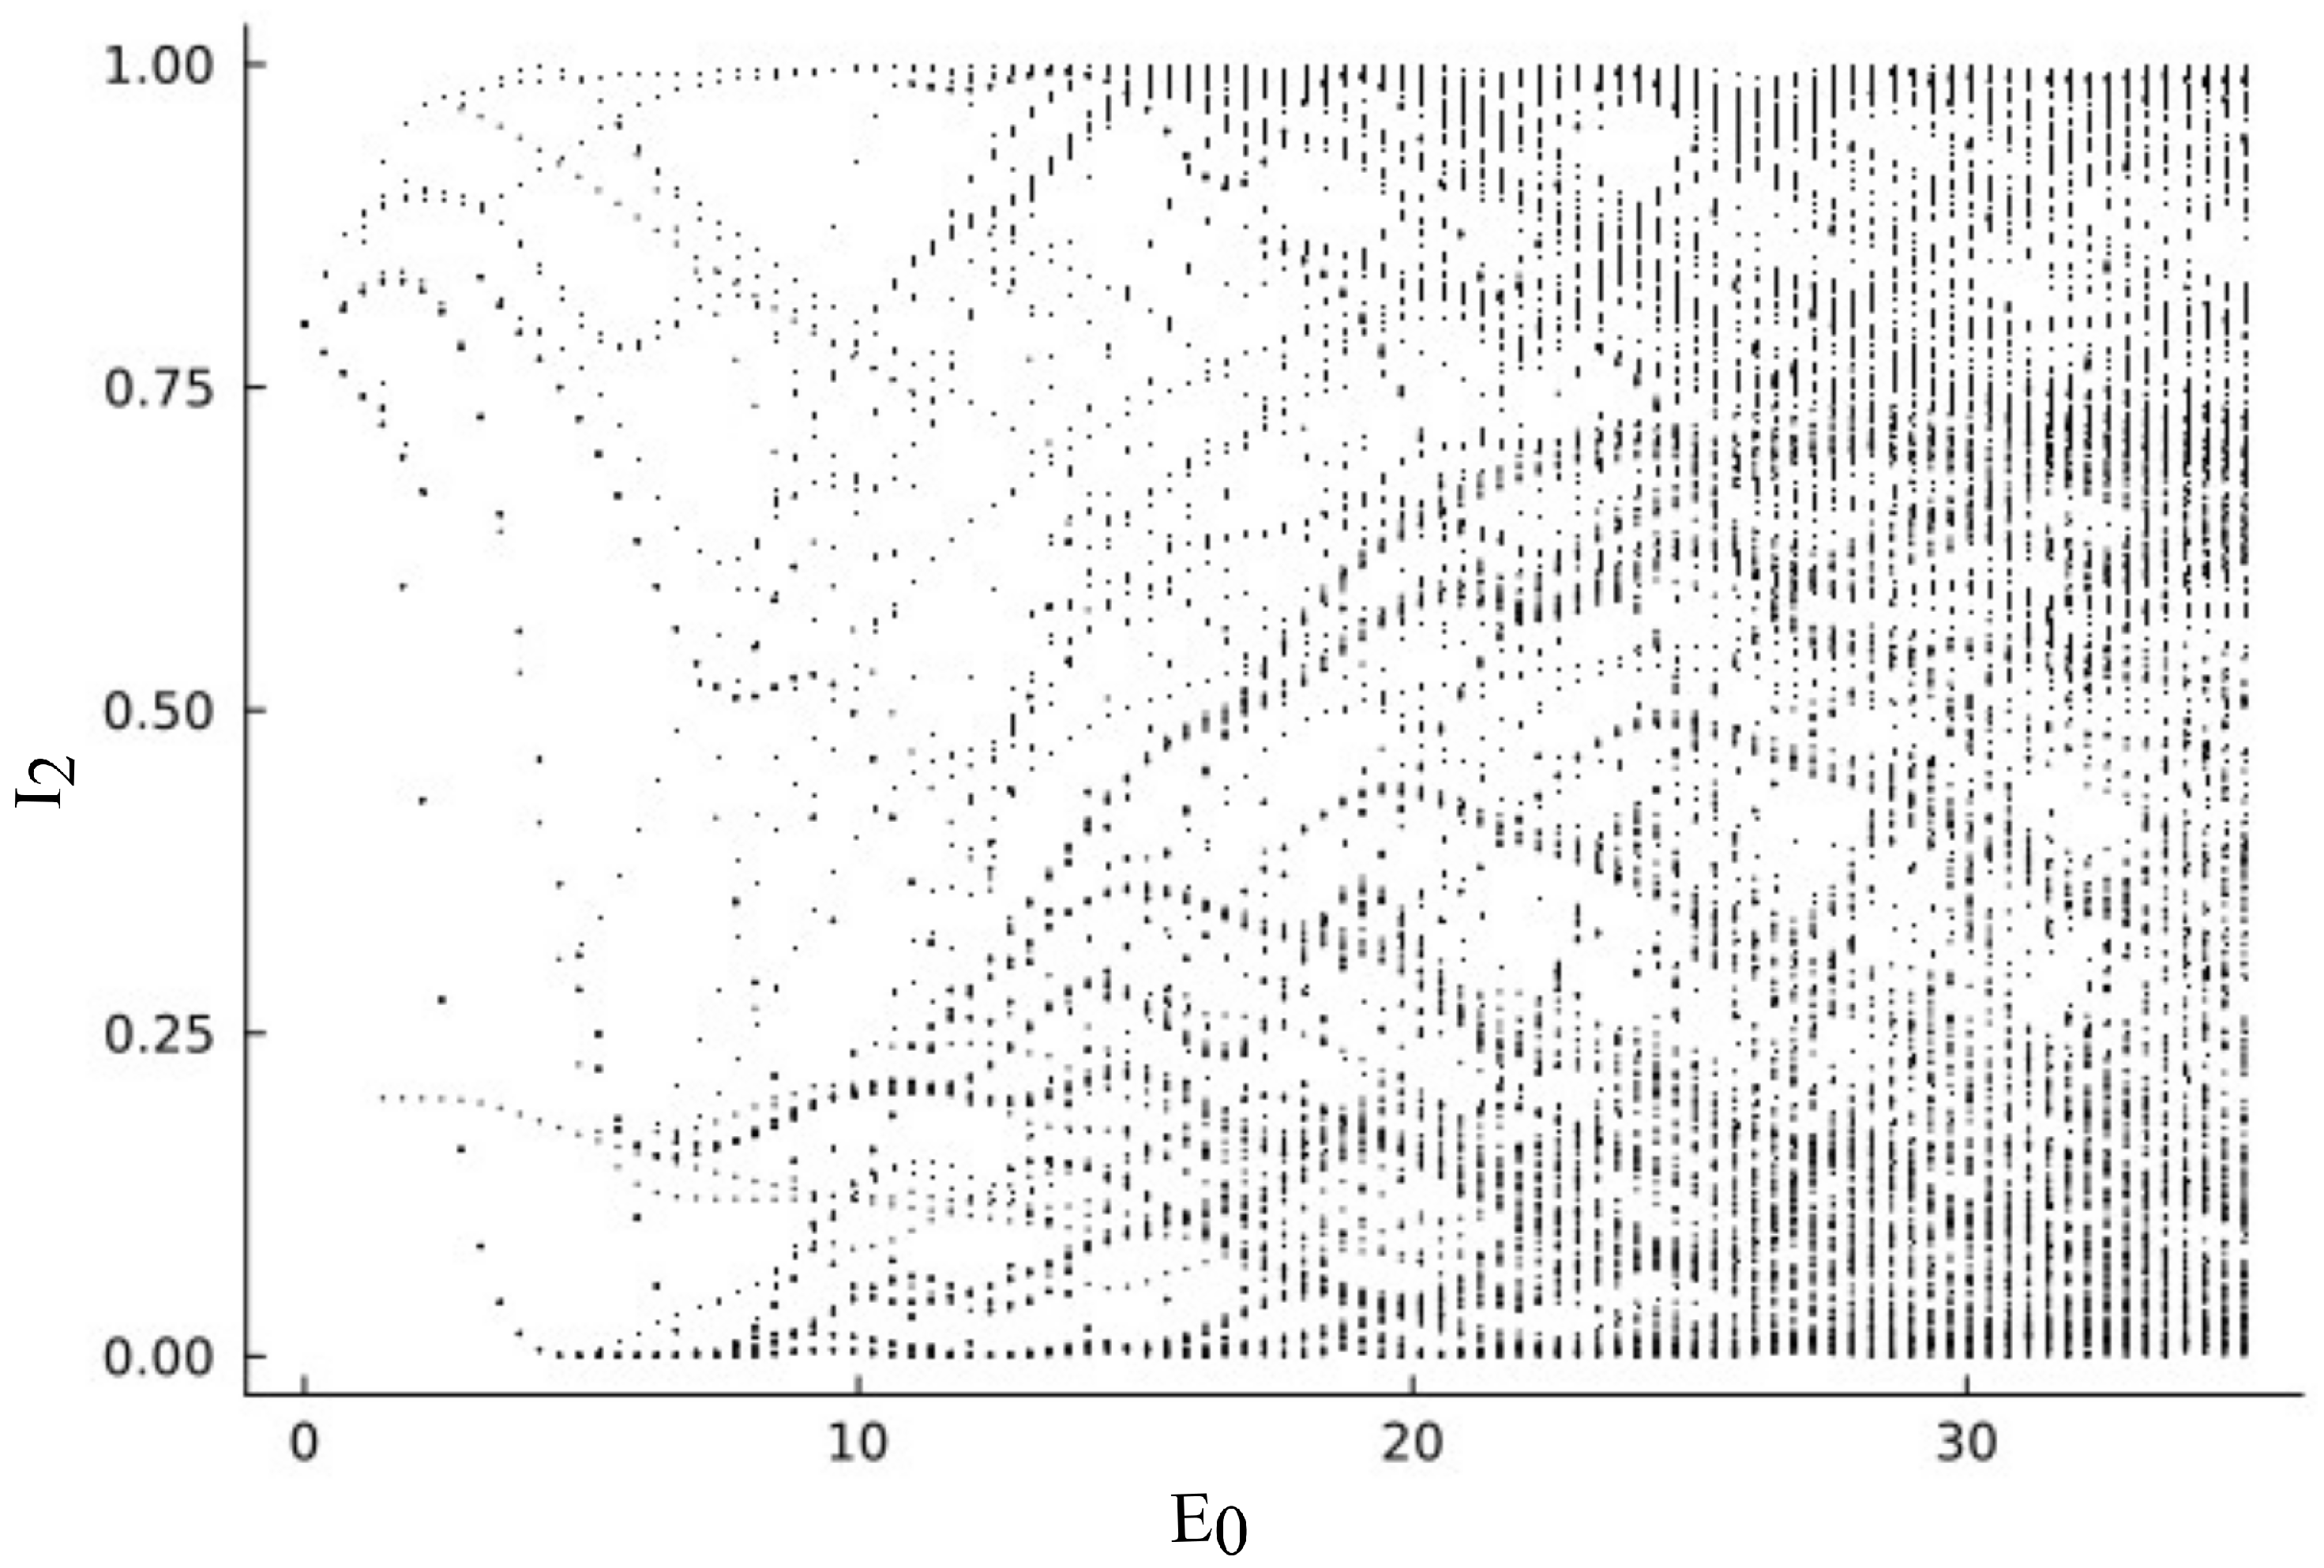
The case where the photovoltaic effect is neglected shows a clear period-doubling route to chaos. But, with photovoltaic effects included, the system shows more complex period-doubling behavior, which demands more careful analysis to completely understand its route to chaos. So, for further analysis, here, we consider only the case without a photovoltaic effect. A visual summary of period-doubling characteristics can be obtained using a bifurcation diagram.
Figure 9 depicts the numerically obtained bifurcation diagram for the intensity of the output signal (
) for varying applied electric field amplitudes ranging from 0 KV/cm to 30 KV/cm. We can observe that the branching starts even from small values of amplitude of the electric field (
) as small as 2 KV/cm. Multiple branches start to originate as we increase the magnitude of
as new periods are generated, which is directly observable from the bifurcation plot. This bifurcation diagram is unique and is distinct from other bifurcation patterns commonly observed in nonlinear dynamical systems (the bifurcation diagram reported here is different from the ones from popular nonlinear dynamic systems, such as Lorentz, Logistic Map, Rössler system).
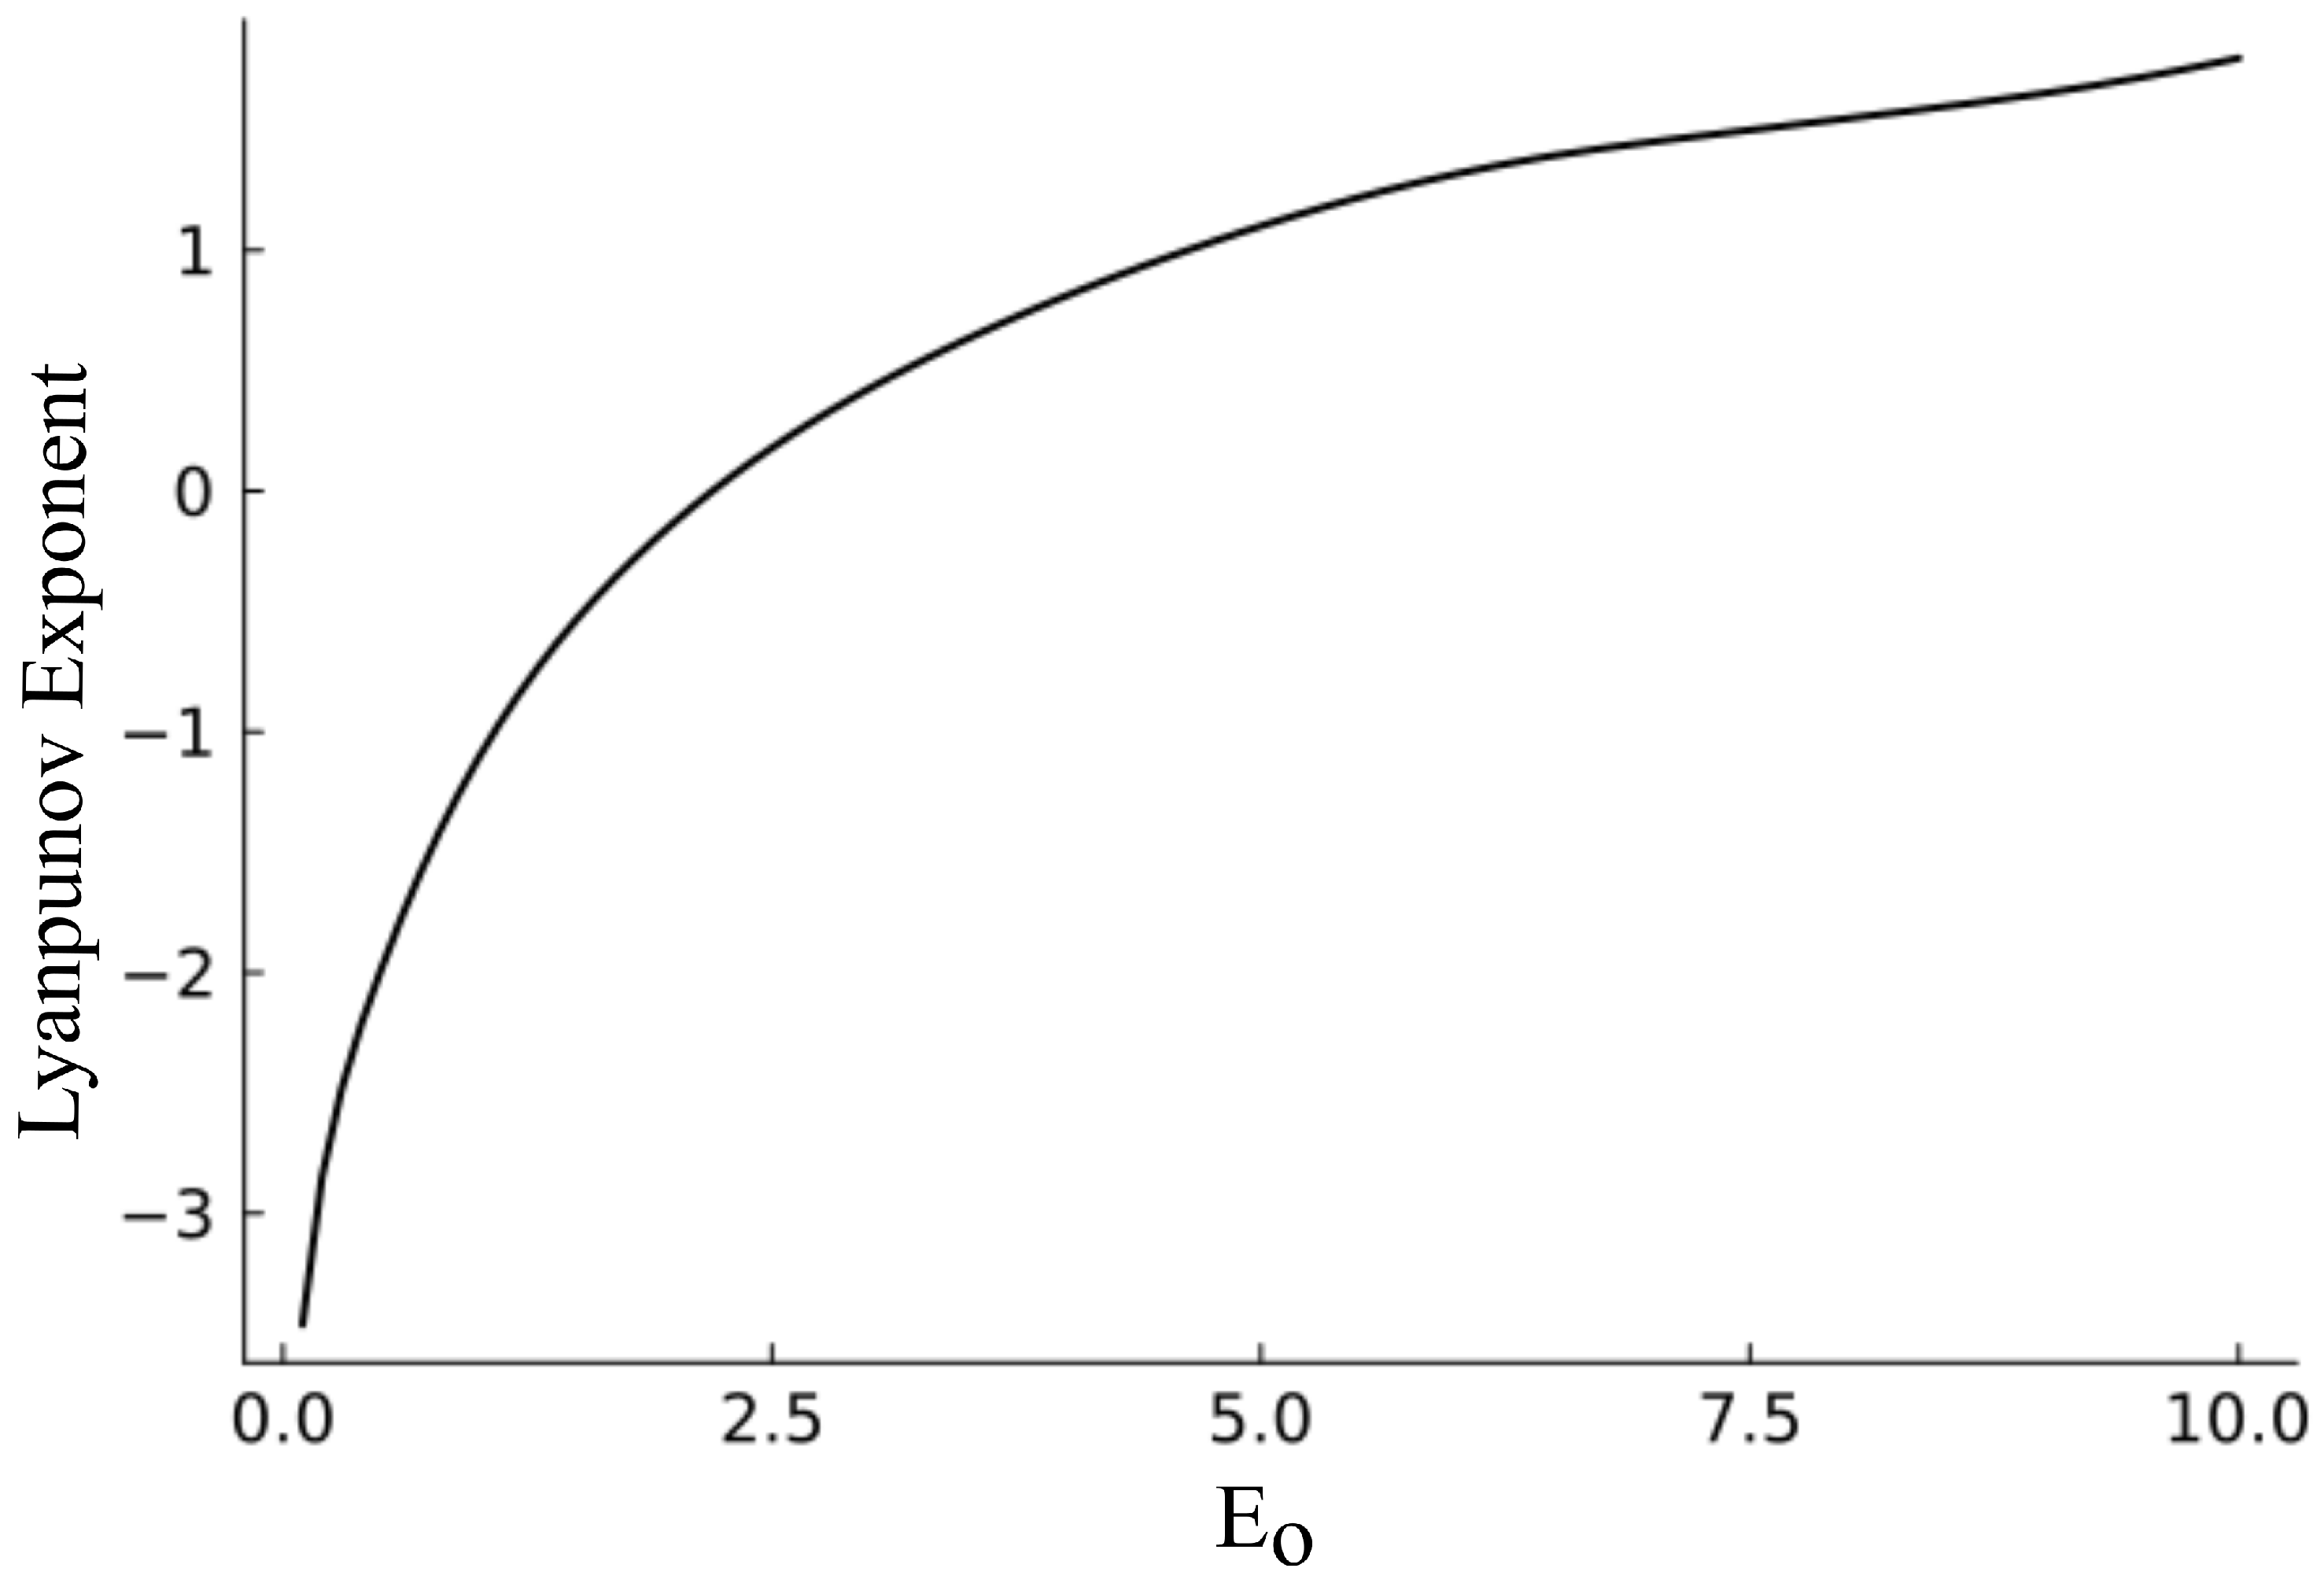
In order to quantify the complexity and chaotic nature of the generated signals [
48,
49], we have computed the lyapunov exponential for varying electric fields, and the corresponding values are plotted in
Figure 10. On examining the Lyapunov curve, it becomes evident that for lower amplitudes of the electric field, the Lyapunov exponent is negative, signifying a stable state within the system. However, for the amplitude at 2.2 KV/cm, the Lyapunov exponent turns positive, marking a transition in the system from stability to nonlinear dynamic behavior. Subsequently, the exponent continues to rise, indicating the transition of the system to chaos with increasing electric field values. Hence, we can conclude that the intensity of the exiting signal beam from the PR-TWM system takes a period-doubling route to chaos under the influence of an applied sinusiodal electric field. It is also important to note that the system exhibits distinct nonlinear dynamic behavior in accordance with the amplitude of the electric field, making it a controllable nonlinear dynamic system.
Such controllable nonlinear dynamic behavior is an important requirement to implement neural network-based computing hardware, such as reservoir computers. The PR-TWM system is very simple, compact, and scalable; hence, it possesses huge potential and is capable of playing a crucial role in the development of next-generation photonics-based artificially intelligent (AI) hardware. Here, we have explored only the results of modulating the applied electric field, but other parameters such as amplitude, phase, and polarization of one of the beams can also be modulated. Such modulations, when played together, can unlock even higher order nonlinear dynamic behavior, which we plan to investigate in the future. But our immediate future goal will be to experimentally verify the numerical findings reported here.
