1. Introduction
Optical telescopes such as catadioptric and full-mirror-type systems are often applied in astronomical research, earth observation missions and deep space exploration. The ROCSAT-2 and Pleiades HR both served as successful earth observation satellites with a lifetime of more than 10 years; they featured the high-end catadioptric type and full-mirror-type systems with an aperture over 60 cm, respectively [
1,
2]. Recently, Canon Electronics Inc. has developed several low-cost micro-satellites equipped with the optical payload consisting of their own digital camera and a 40 cm diameter catadioptric telescope aiming at commercial earth observation applications [
3]. The examples above show that the catadioptric telescope plays an important role in high-end and low-cost solutions for space telescopes.
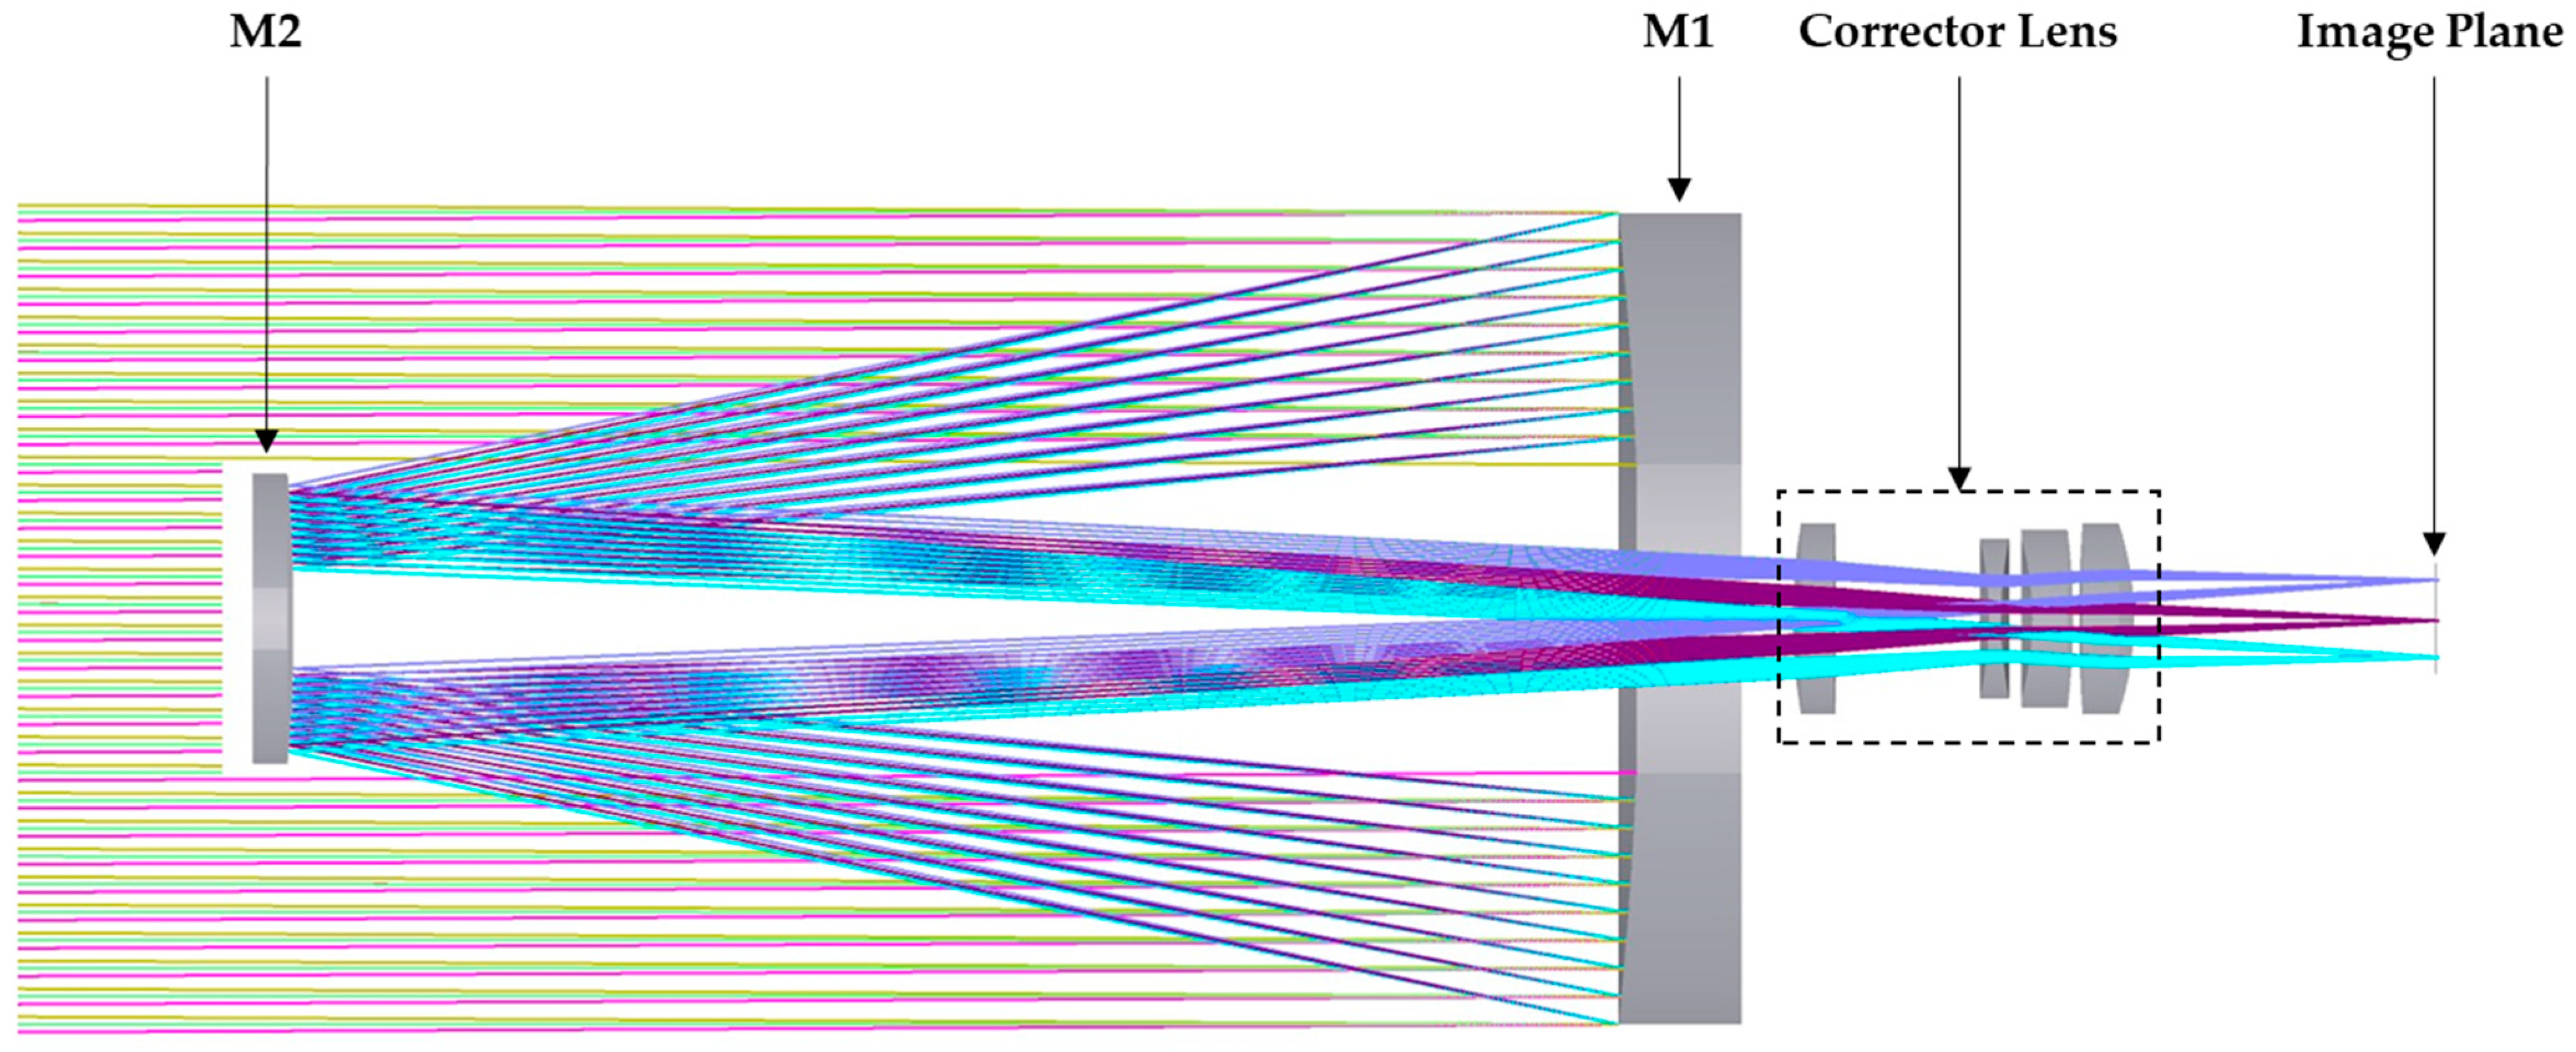
In this paper, a catadioptric telescope was designed to conduct an earth observation mission in a 500–600 km altitude orbit and it could provide multi-spectral images with a 450–890 nm wavelength band. The catadioptric telescope is a circularly symmetric system and features easier fabrication and faster alignment compared to more advanced architectures such as the full-mirror off-axis system which usually replaces the corrector lens with a tertiary mirror. In order to meet the tight schedule of deploying a constellation of remote sensing satellites, the catadioptric telescope could be a decent candidate for the optical payload of the earth observation mission. The optical layout of the telescope is shown in
Figure 1; it consists of a 40 cm diameter primary mirror (M1), a 14 cm diameter secondary mirror (M2) and a 4-lens corrector module [
4], where the color rays represent the light path of each field.
Both mirrors are made of a low coefficient of thermal expansion (CTE) substrate with high-reflectance silver coating on their optical surfaces, and the lenses are made of fused silica with broad-band anti-reflective coating (reflectance less than 2%) on each surface. The alignment and assembly of the corrector lens are accomplished with an allocated maximum range of tilt and decenter error budgets less than ±60 arcsec and ±75 µm, respectively.
The optical quality of the entire system is usually measured with an interferometer.
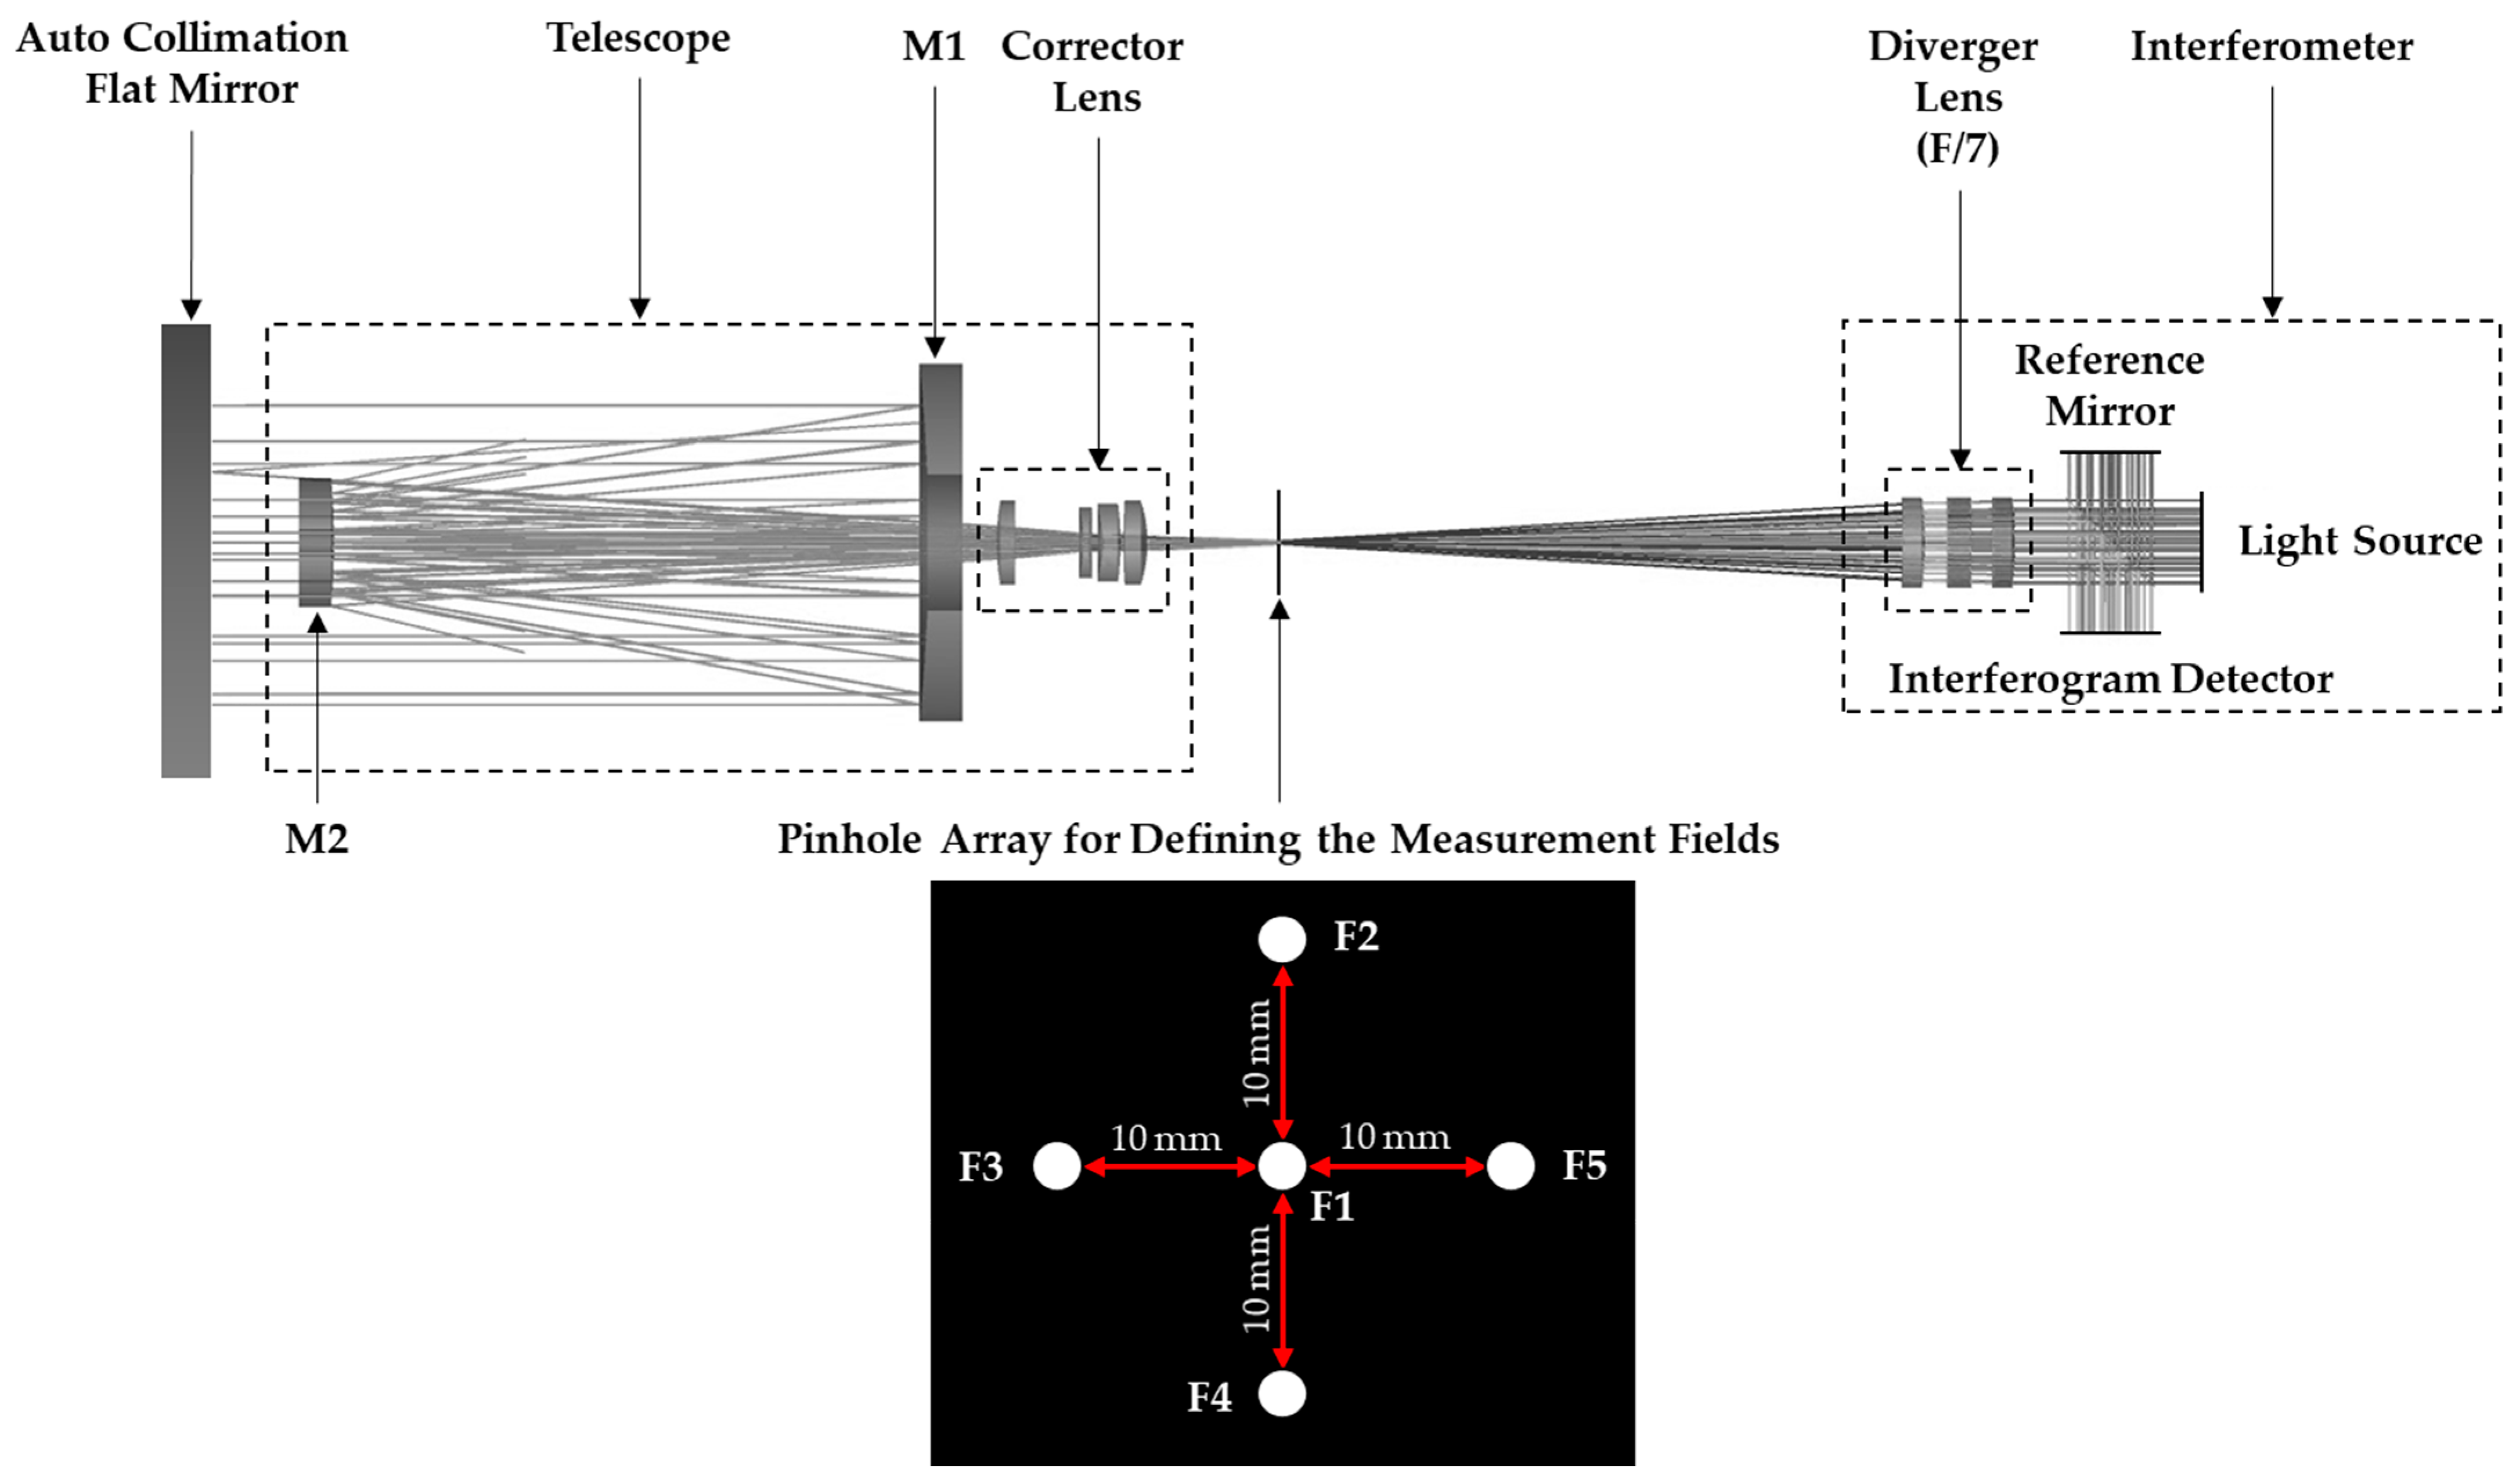
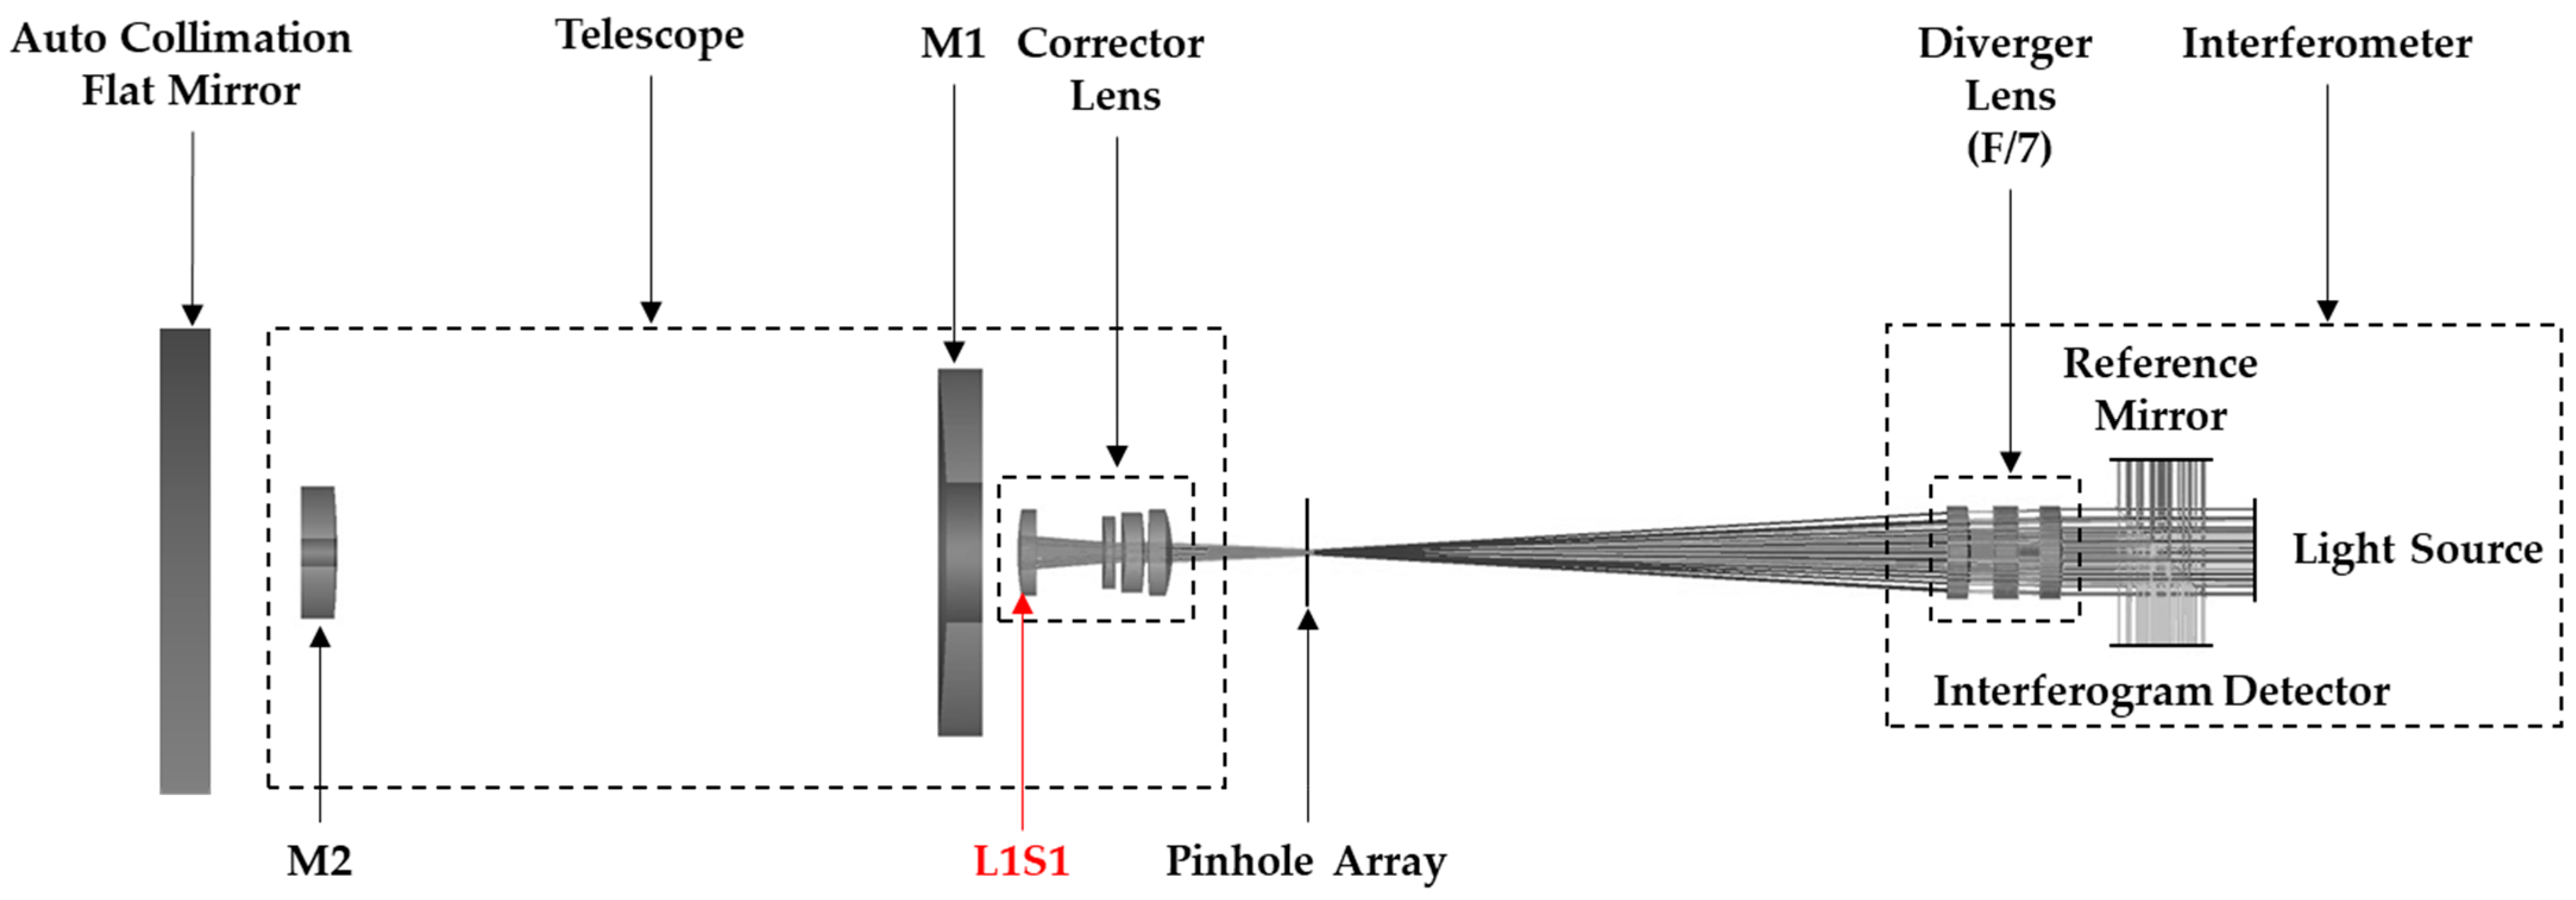
Figure 2 shows the full light path of the double-pass interferometric measurement system of the catadioptric telescope with a Twyman–Green interferometer which adopts a spherical diverger lens with an f-number of 7. An auto collimation flat mirror with a clear aperture of 24 inches is employed to construct a double-pass architecture for the interferometric measurement. In addition, a pinhole array, consisting of five pinholes with a diameter of 1 mm, as illustrated in
Figure 2, is used to define the measurement fields, including one on-axis field and four off-axis fields, and is placed on the image plane of the telescope.
A converging beam (He-Ne laser 632.8 nm), produced by the interferometer and the diverger lens, focuses onto the pinhole and then passes through the corrector to enter the telescope. After being reflected by M2 and M1 sequentially, it becomes collimatedly incident onto the auto collimation flat mirror. The reflected beam from the auto collimation flat mirror then returns to the telescope and interferometer by following the original light path. This to and fro route becomes the so-called double-pass light path. Finally, an interferogram can be obtained with the superposition of the return beam from the telescope and the reference beam from the reference mirror on the detector of the interferometer.
Before executing the interferometry, a sequence of mechanical alignments with a coordinate measuring machine (CMM) is conducted which will eventually leave an alignment error at the micrometer scale. The interferometry is then used for fine-tuning the position of optical components by monitoring the wavefront error (WFE). The final system wavefront data will be acquired in multiple average based on the standard deviation to eliminate the influence of random disturbances such as vibration and turbulence.
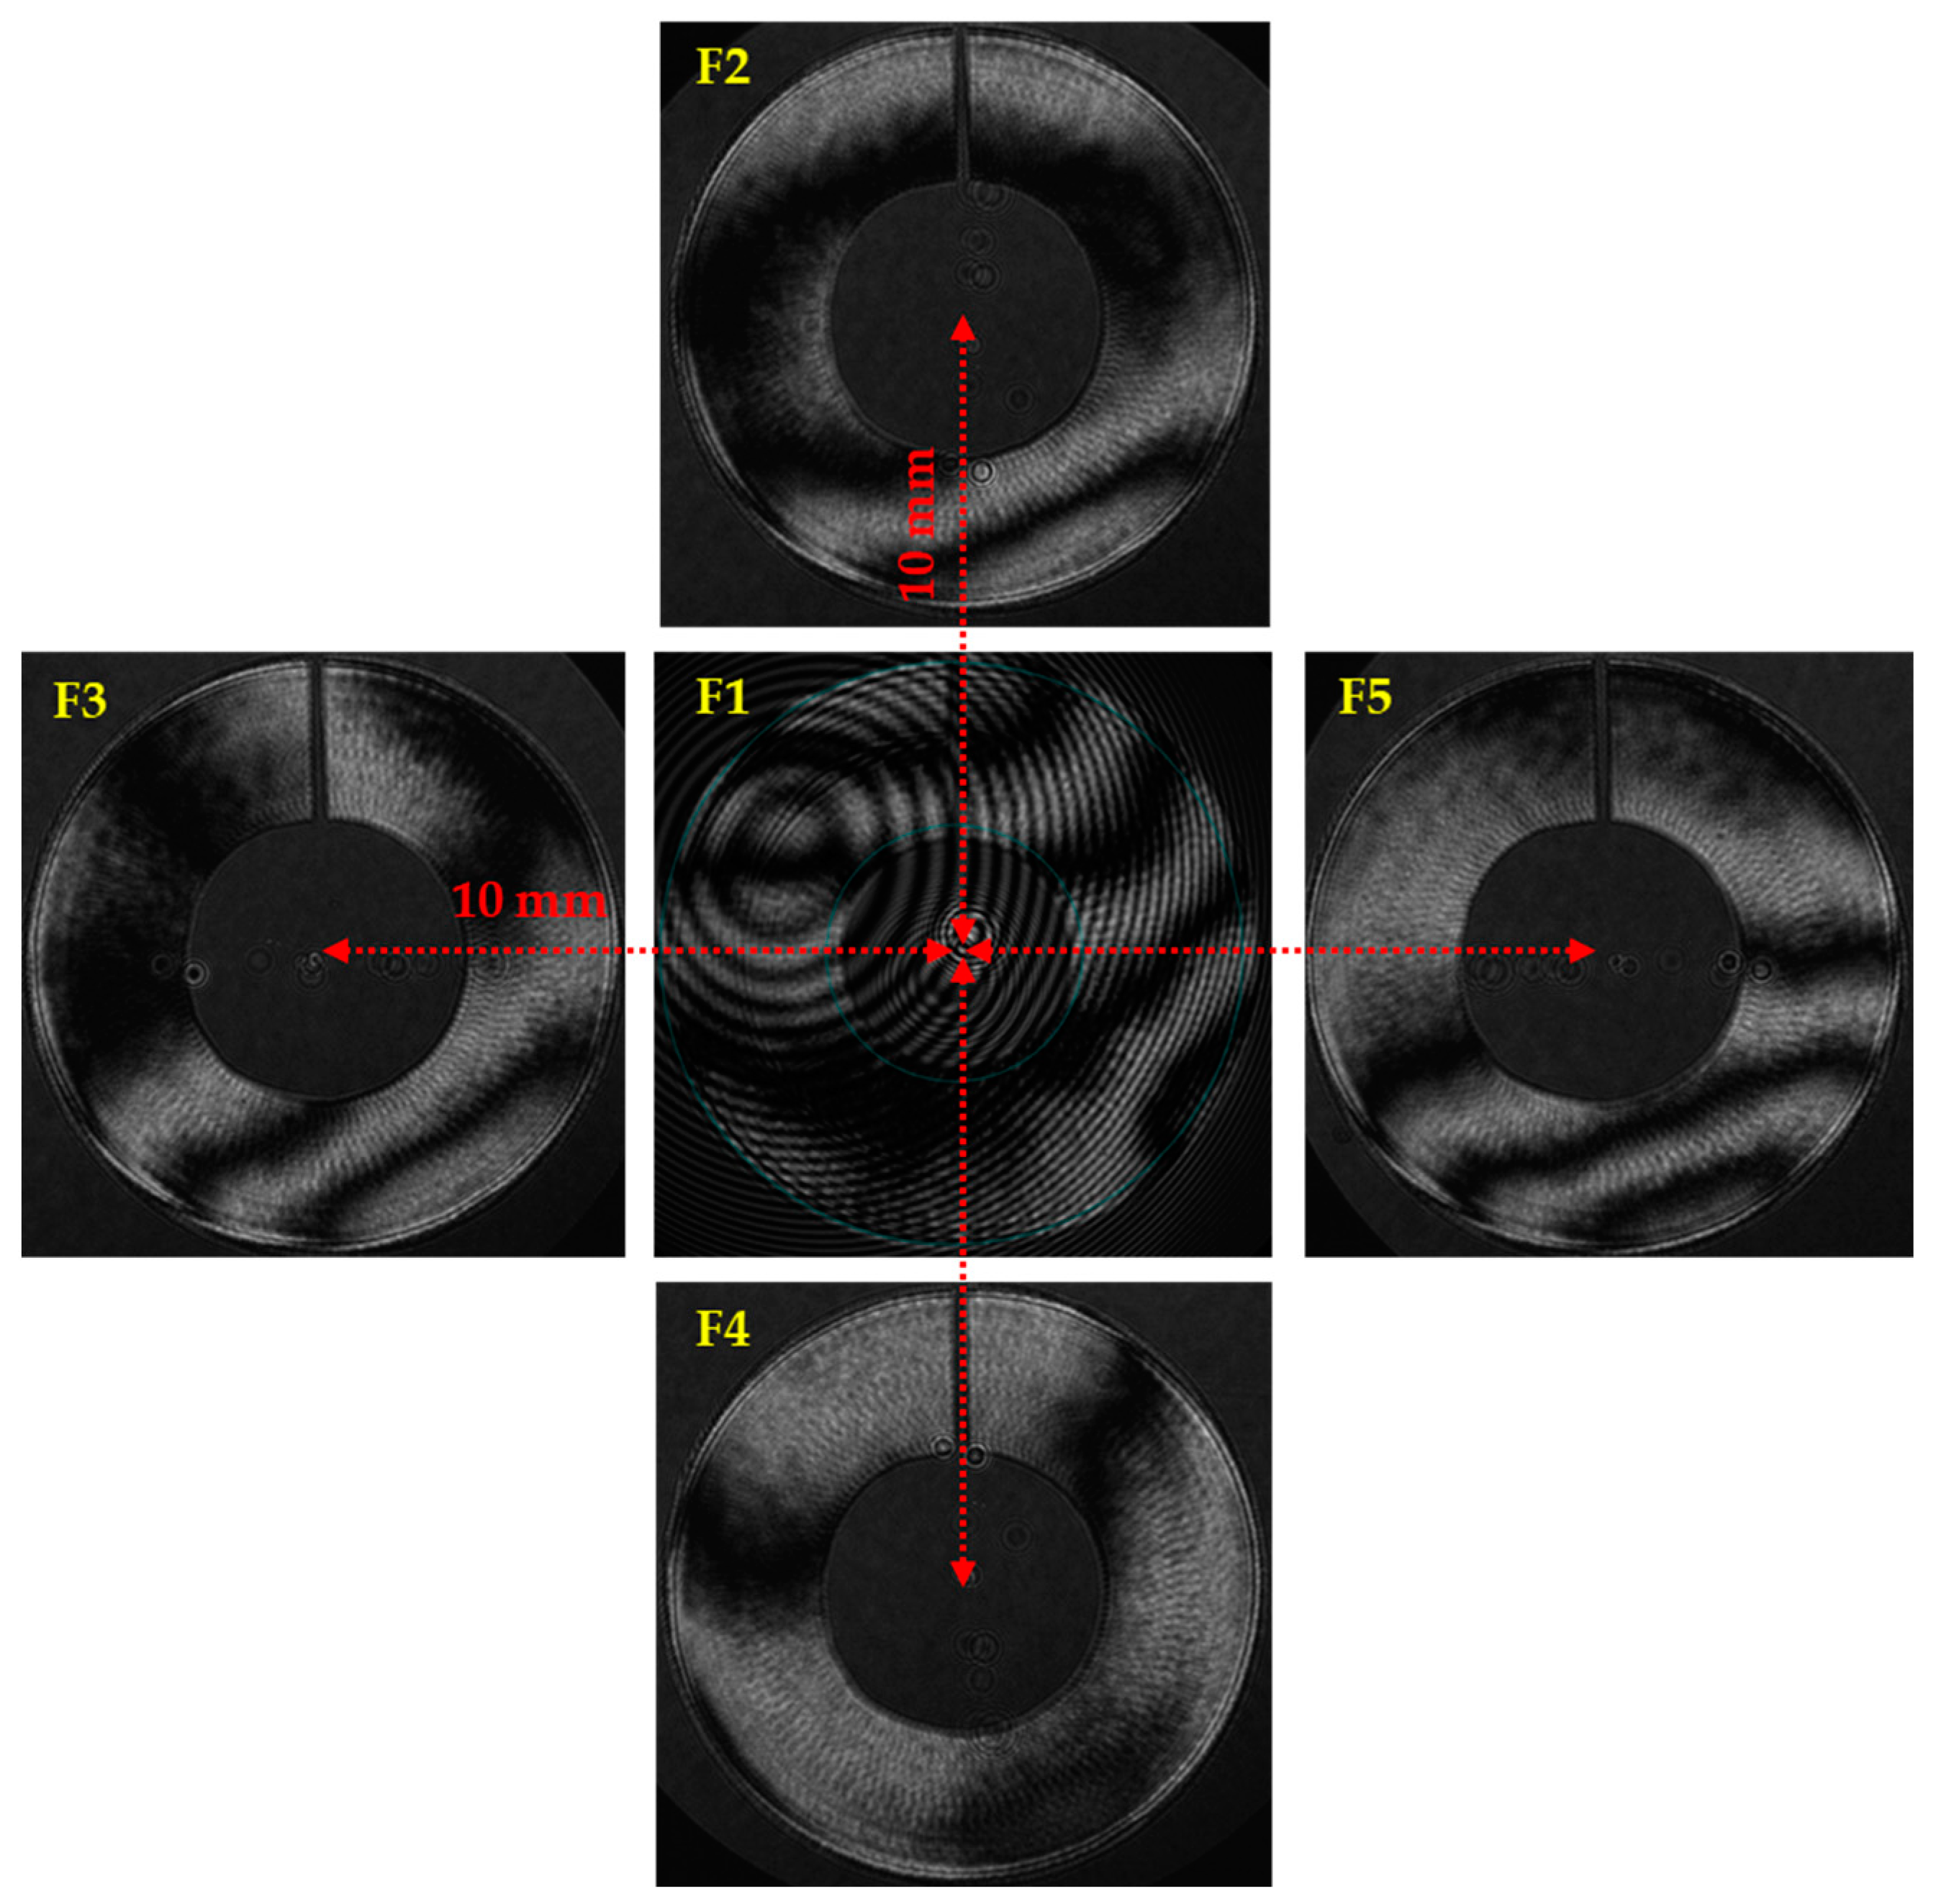
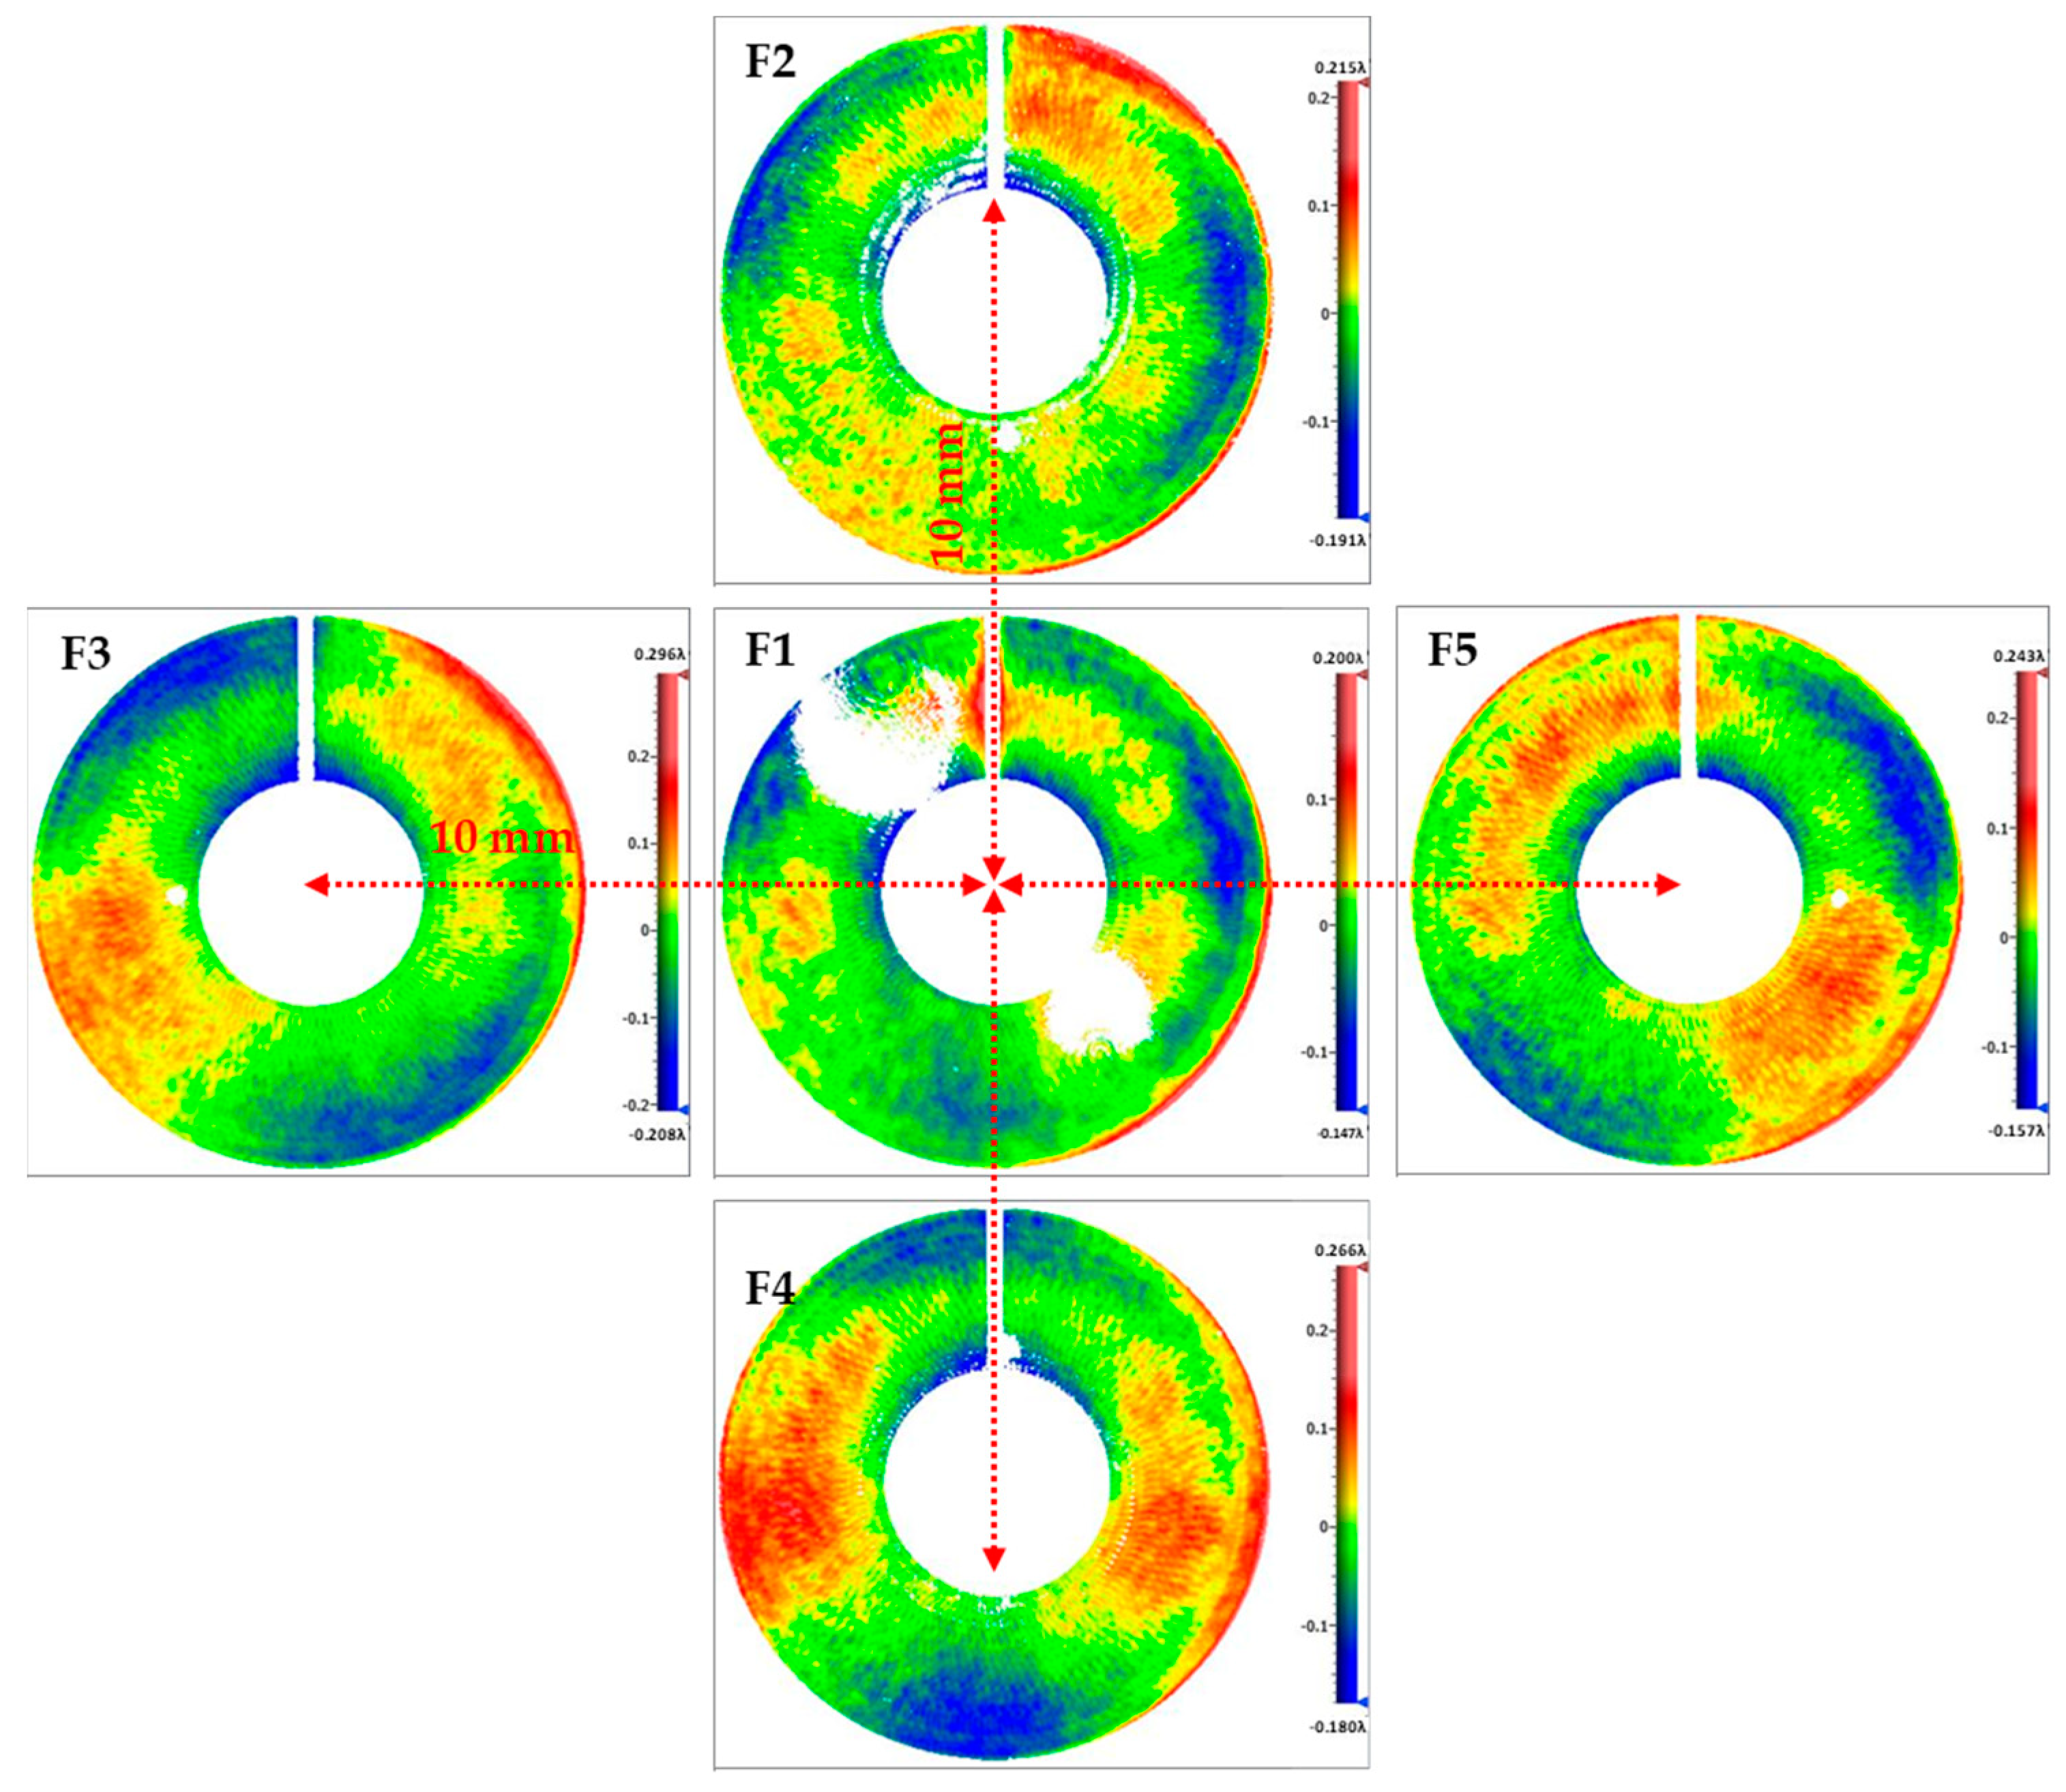
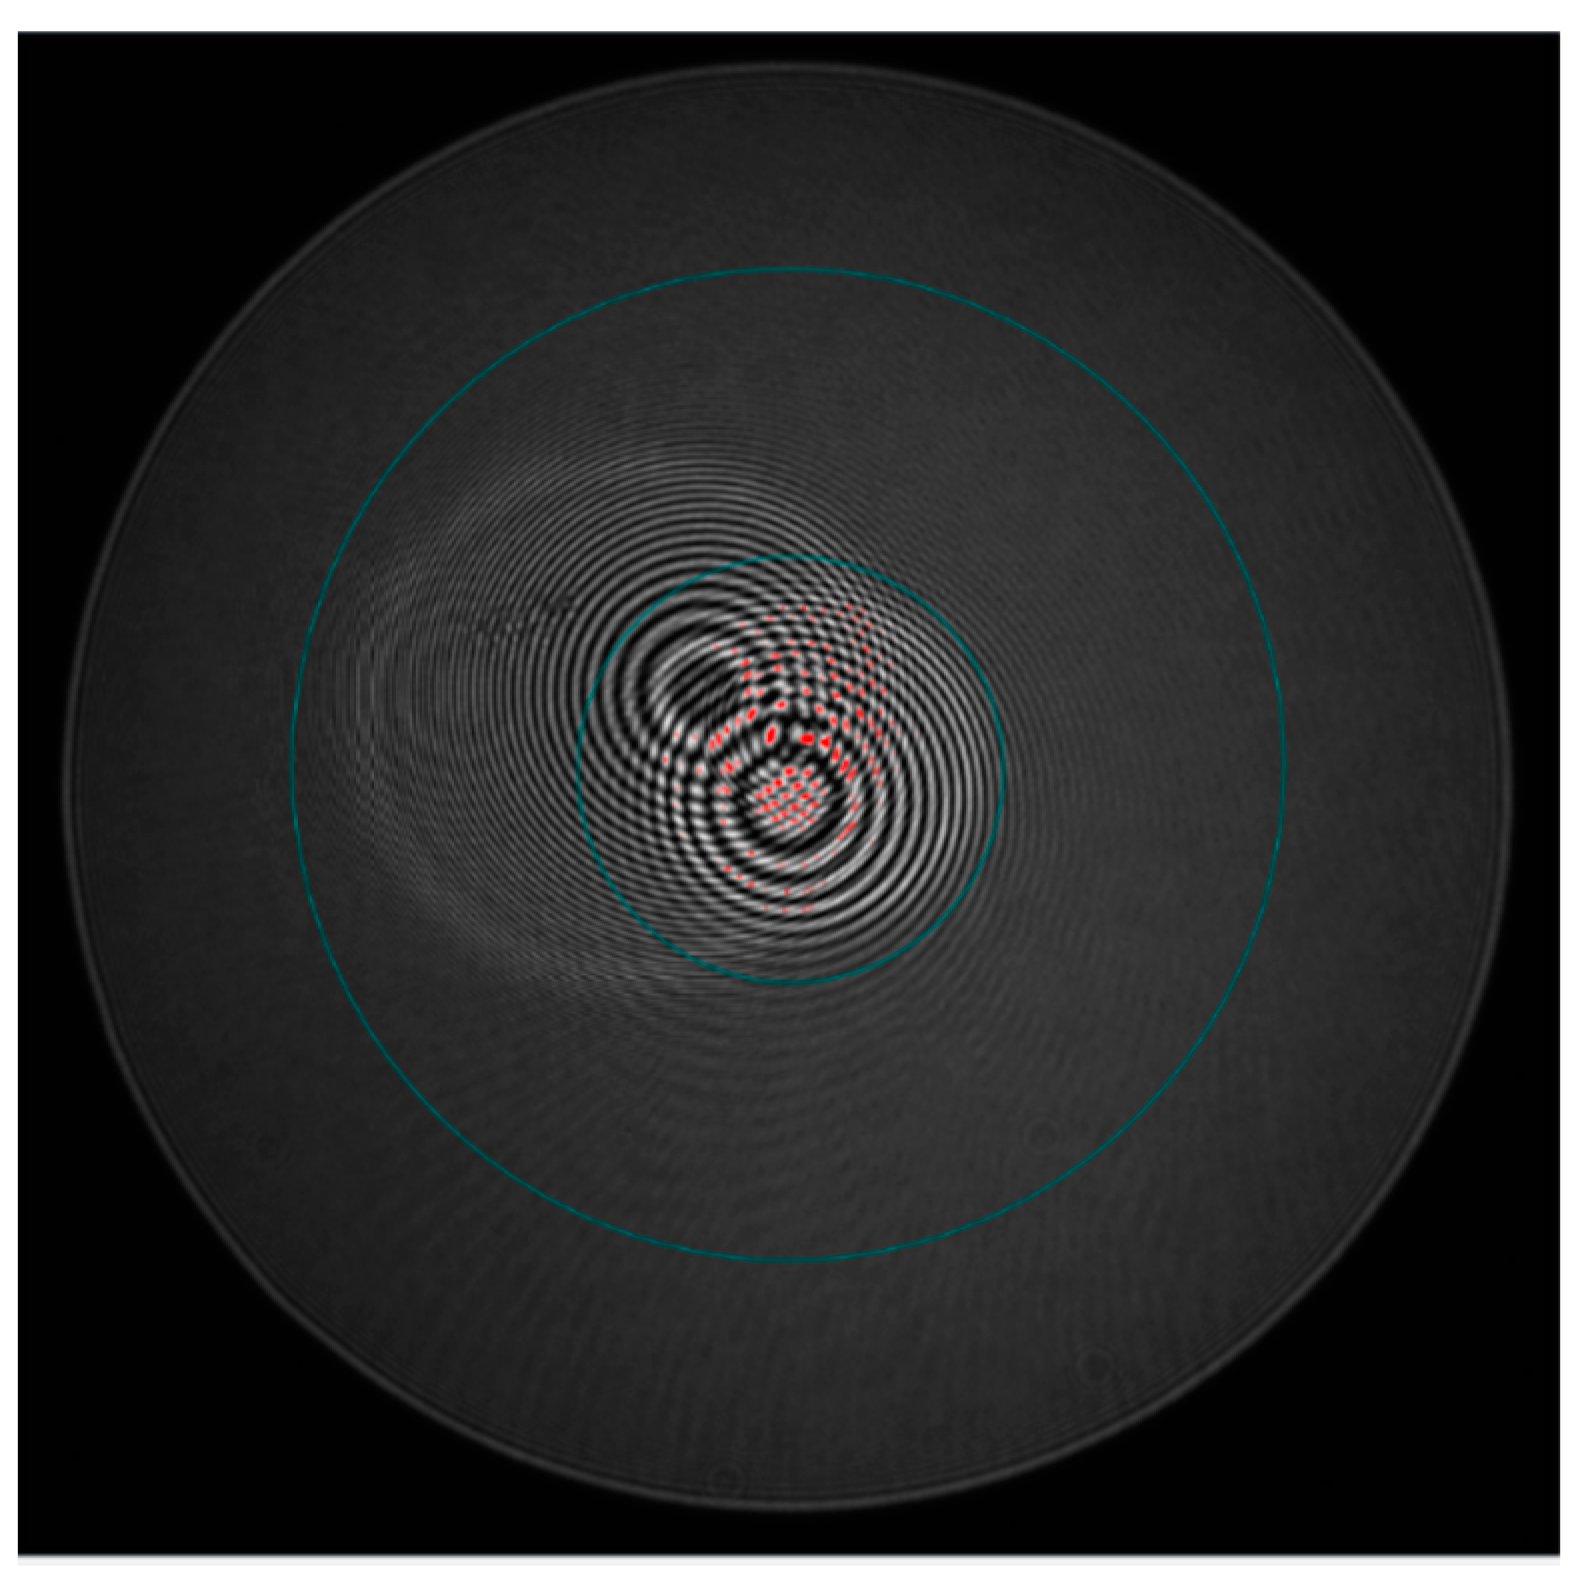
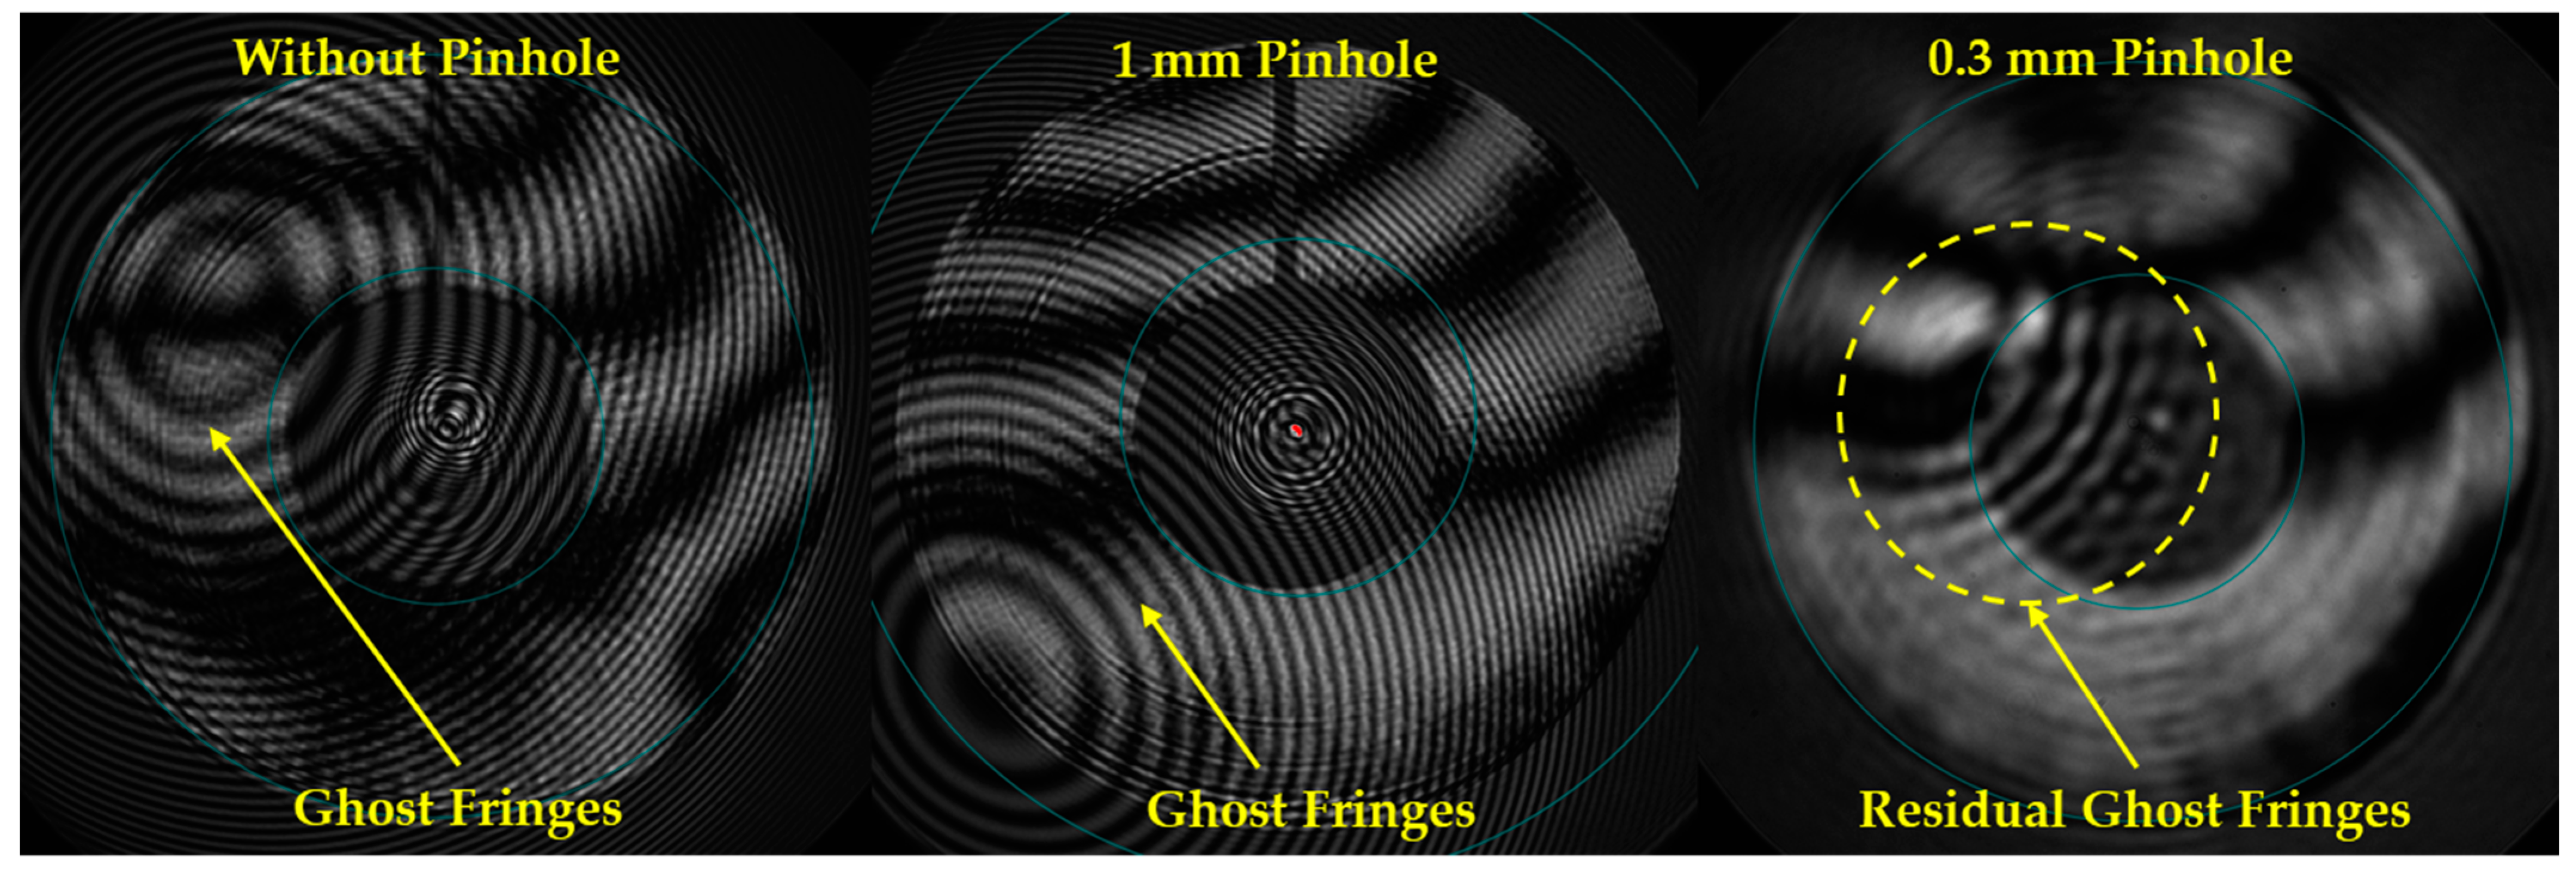
The full-field interferograms and corresponding WFE maps are shown in
Figure 3 and
Figure 4, respectively. The interferogram shows a coarse fringe from the overall telescope optics and several fine fringes which constitute unwanted disturbance called ghost fringe. Consequently, the WFE map in
Figure 4 shows broken patches where the ghost fringes are located, and those broken patches highly disturb the evaluation of the wavefront error. The other four off-axis fields present nominal WFE maps without ghost fringe disturbance.
Technically, the ghost fringes can be shifted away from the on-axis interferogram with a slight off-axis installation of the setup shown in
Figure 2, and this approach can be acceptable in cases where the full-field WFE results satisfy the requirement with good aberration symmetry, but it is not applicable in general. Ghost images are classified according to the number of reflections encountered in the ghost ray path [
5]. In imaging applications, ghost images could cause contrast reduction and veil parts of the image [
6]. The light reaching the nominal image plane could also degrade the image quality [
7]. Too many concentrated ghosts can disqualify a candidate lens design, equivalent to the effect of aberration [
8]. The intensity of a ghost image is proportional to the product of the reflection coefficient of the coating on the refractive interfaces involved in the ghost light path and inversely proportional to the area of the ghost image [
9]. In this paper, the source of the ghost fringe for the catadioptric telescope is investigated and the solutions to resolve the issue without off-axis installation are proposed and verified.
2. Source of Ghost Fringe in Catadioptric Telescope
In experiments, when a mask is located between the primary mirror and the corrector, blocking the laser beam from entering the mirrors, the ghost fringes still remain on the interferogram, as shown in
Figure 5. This shows that the ghost fringe mainly comes from the corrector lens. When adjusting the position of the corrector, the ghost fringe shifts on the interferogram in accordance.
Theoretically, there should be an infinite number of ghost fringes. For practical engineering purposes, only the ones with sufficient intensity to disturb the correct reading of the original system fringe should be considered. Therefore, only the ghost light path with the first reflection from a refractive surface will be examined. As there are four lens elements in the corrector module, there should be a total of eight ghost light paths meeting this condition. However, to form a clear ghost fringe on the interferogram, the ghost light path should have a focus point close to that of the original system interferometric light path, i.e., the position of the pinhole shown in
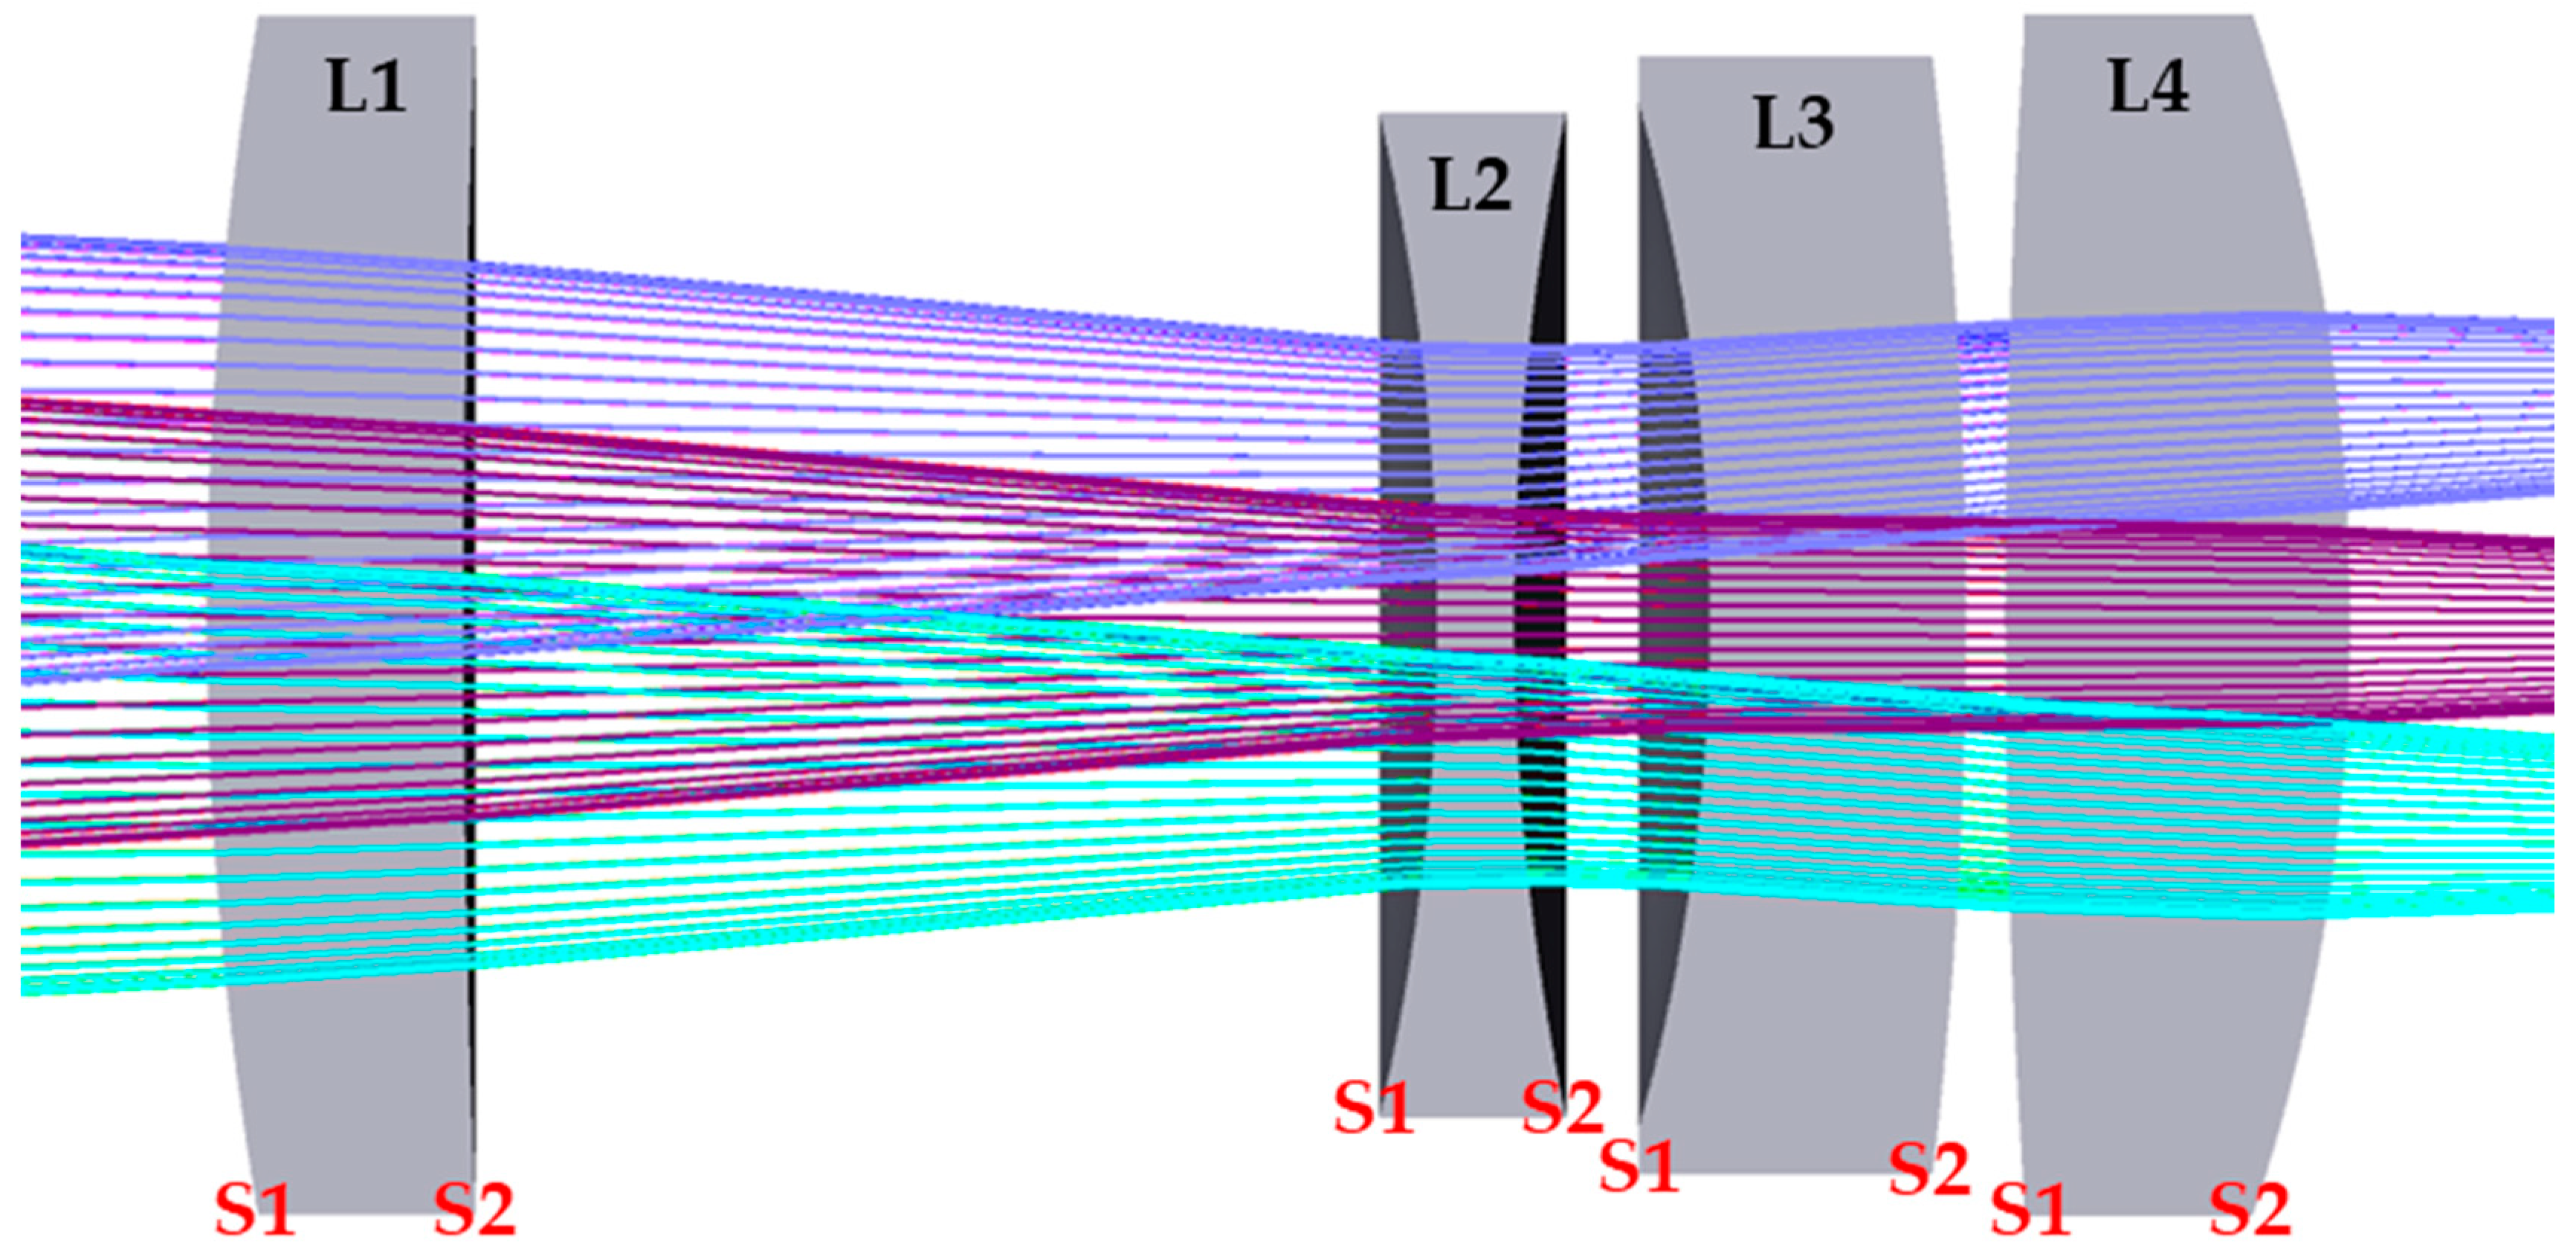
Figure 2. As a consequence, the most likely source of the ghost fringe come from the surfaces which are concave toward the pinhole, i.e., surface 1 of lens 1 (L1S1), L2S2, and L4S1, as illustrated in
Figure 6, where the corrector module and the light path through it in
Figure 1 are highlighted to show the labels of optical surfaces for the corrector.
The distances between the center of curvature of those three surfaces and the pinhole are listed in
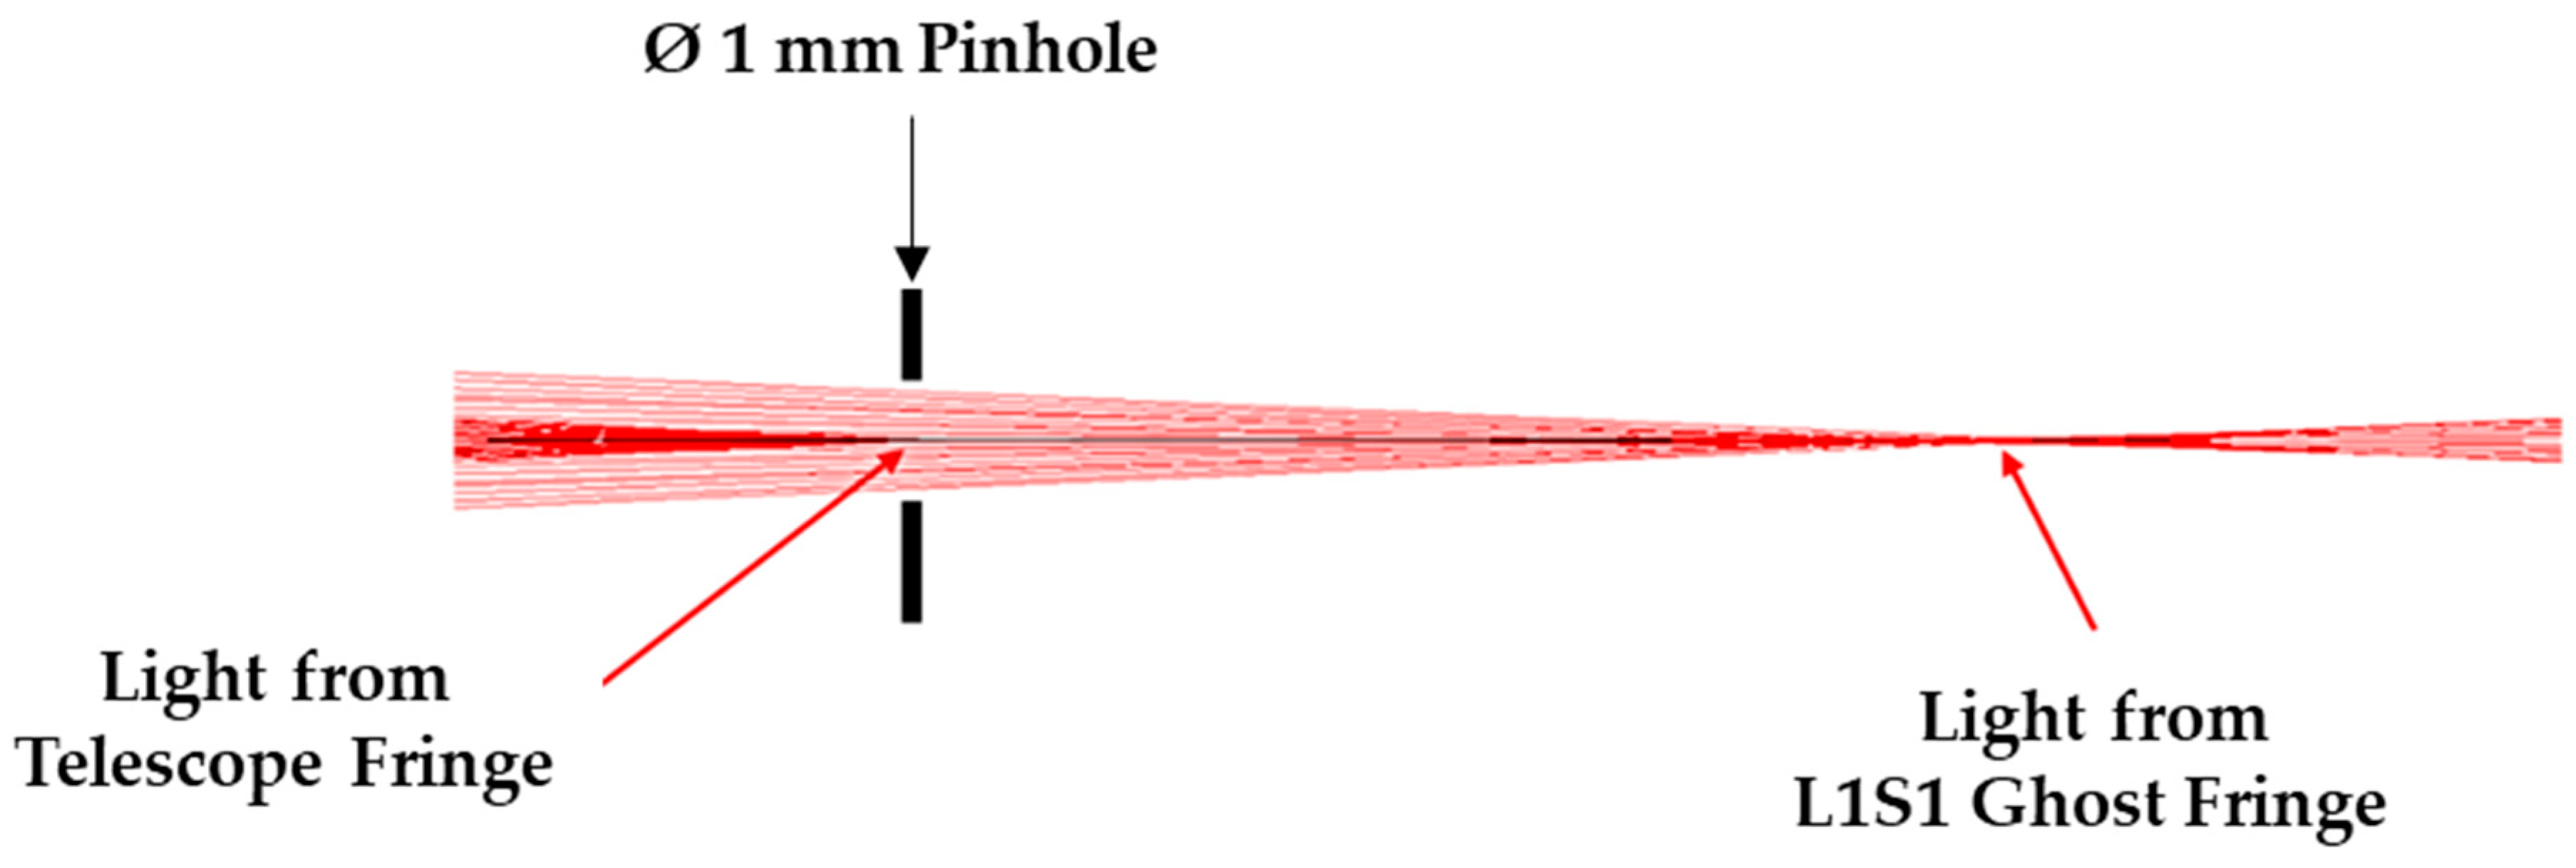
Table 1. According to the table, the center of curvature of L1S1 is the one closest to the pinhole, and the corresponding ghost fringe could be the largest and strongest. Its light path through the pinhole is simulated and illustrated in
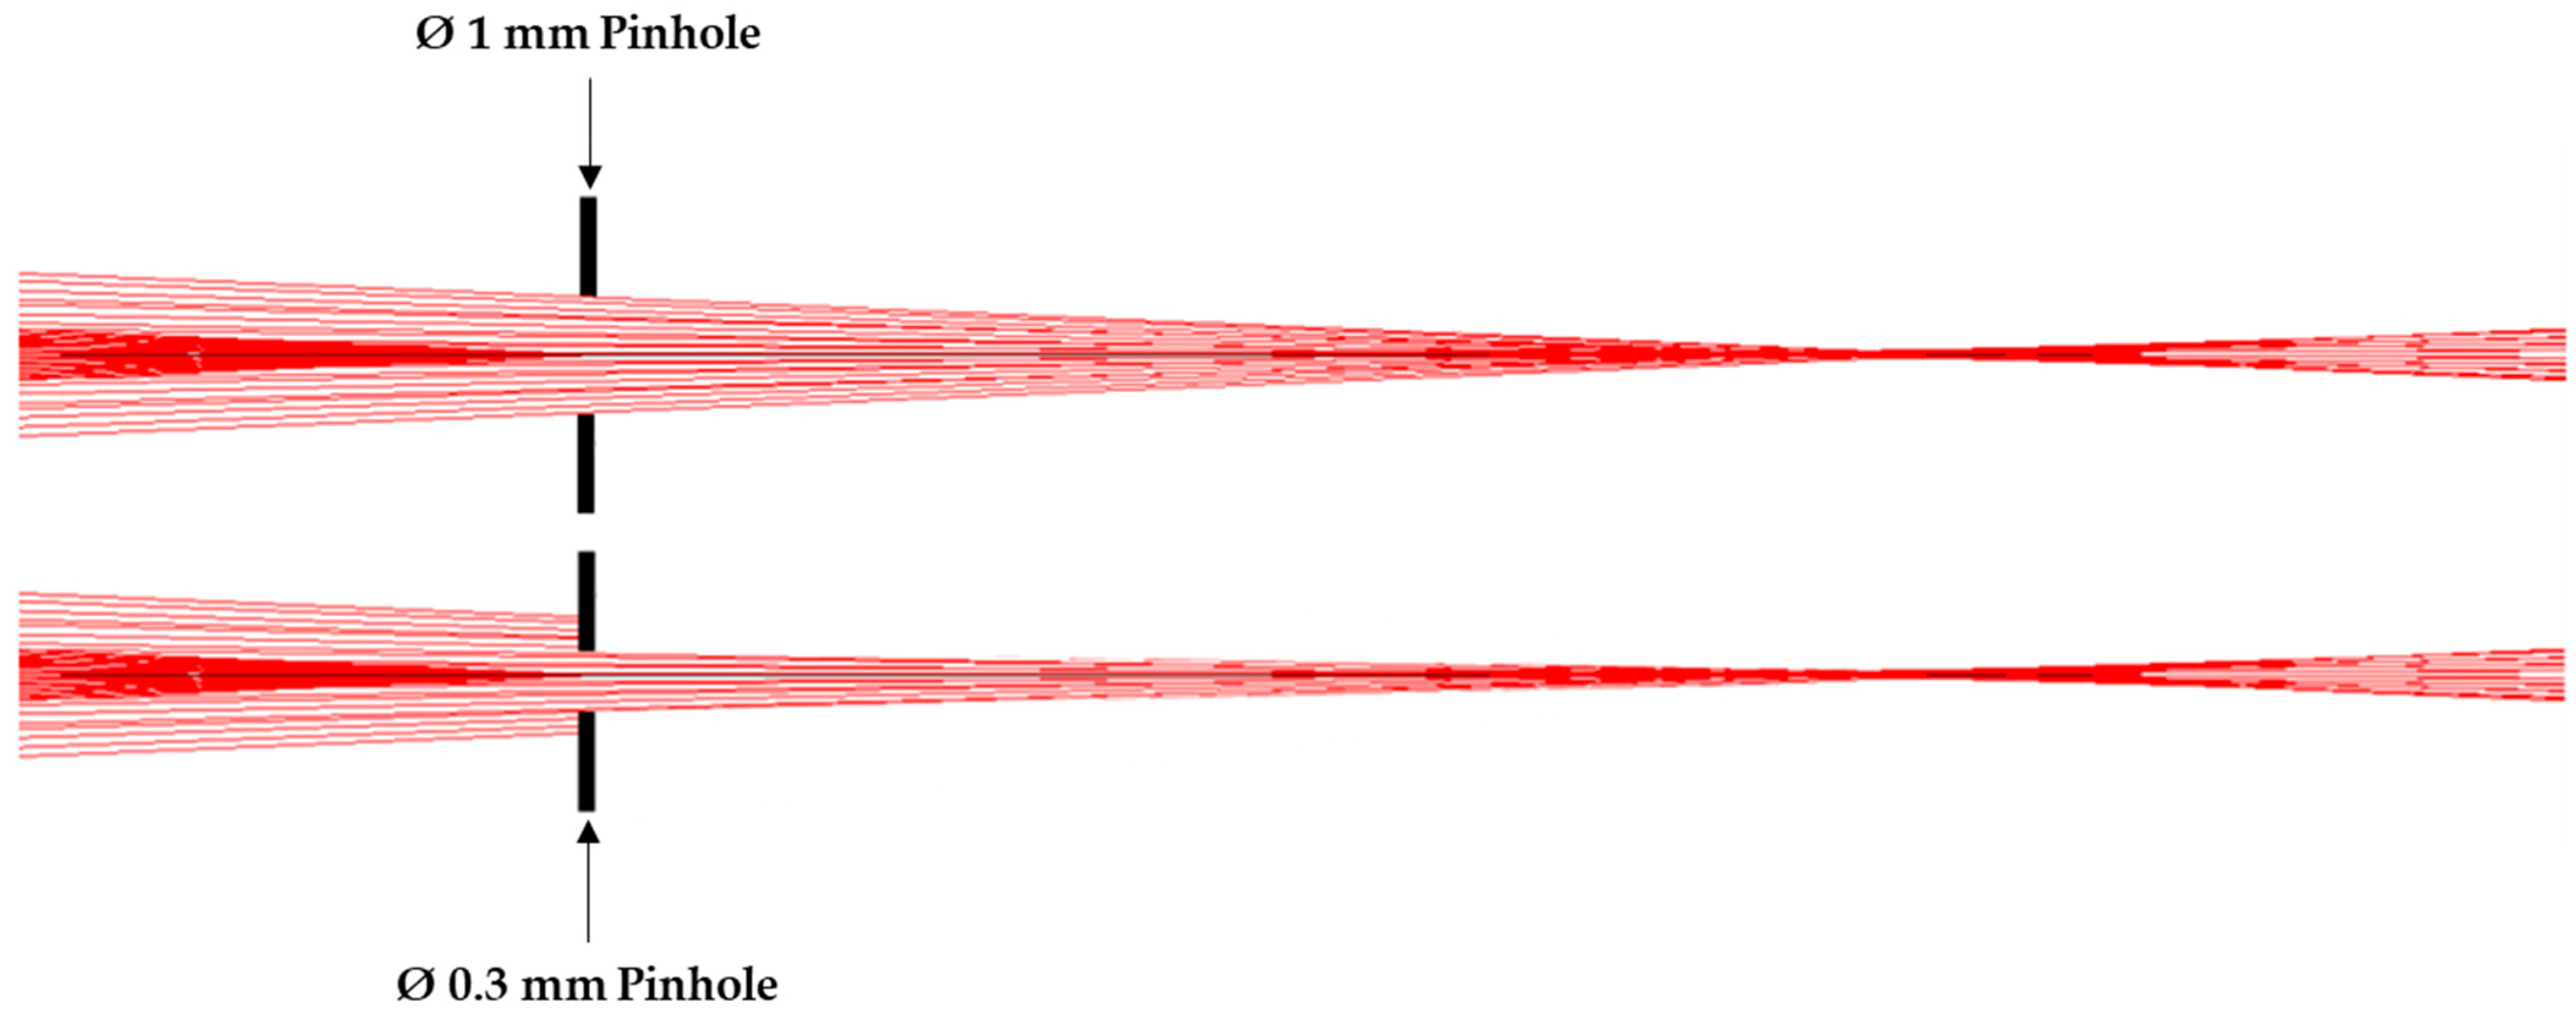
Figure 7.
An alternative approach to get around the disturbance of ghost fringes is to tilt the corrector module such that the reflected ghost light is directed out of the path toward the detector or image plane [
10]. To further confirm the source of the ghost fringe, the corrector module was tilted with respect to the center of curvature of the three surfaces listed in
Table 1. For example, when tilting the corrector with respect to the center of curvature of L1S1, the corresponding ghost fringe from L1S1 will stay at its original position. Based on the abovementioned optical simulation and experimental results, it is confirmed that the largest ghost fringe is from L1S1, whereas the other two smaller ghost fringes are from L2S2 and L4S1.
3. Elimination of the Ghost Fringe
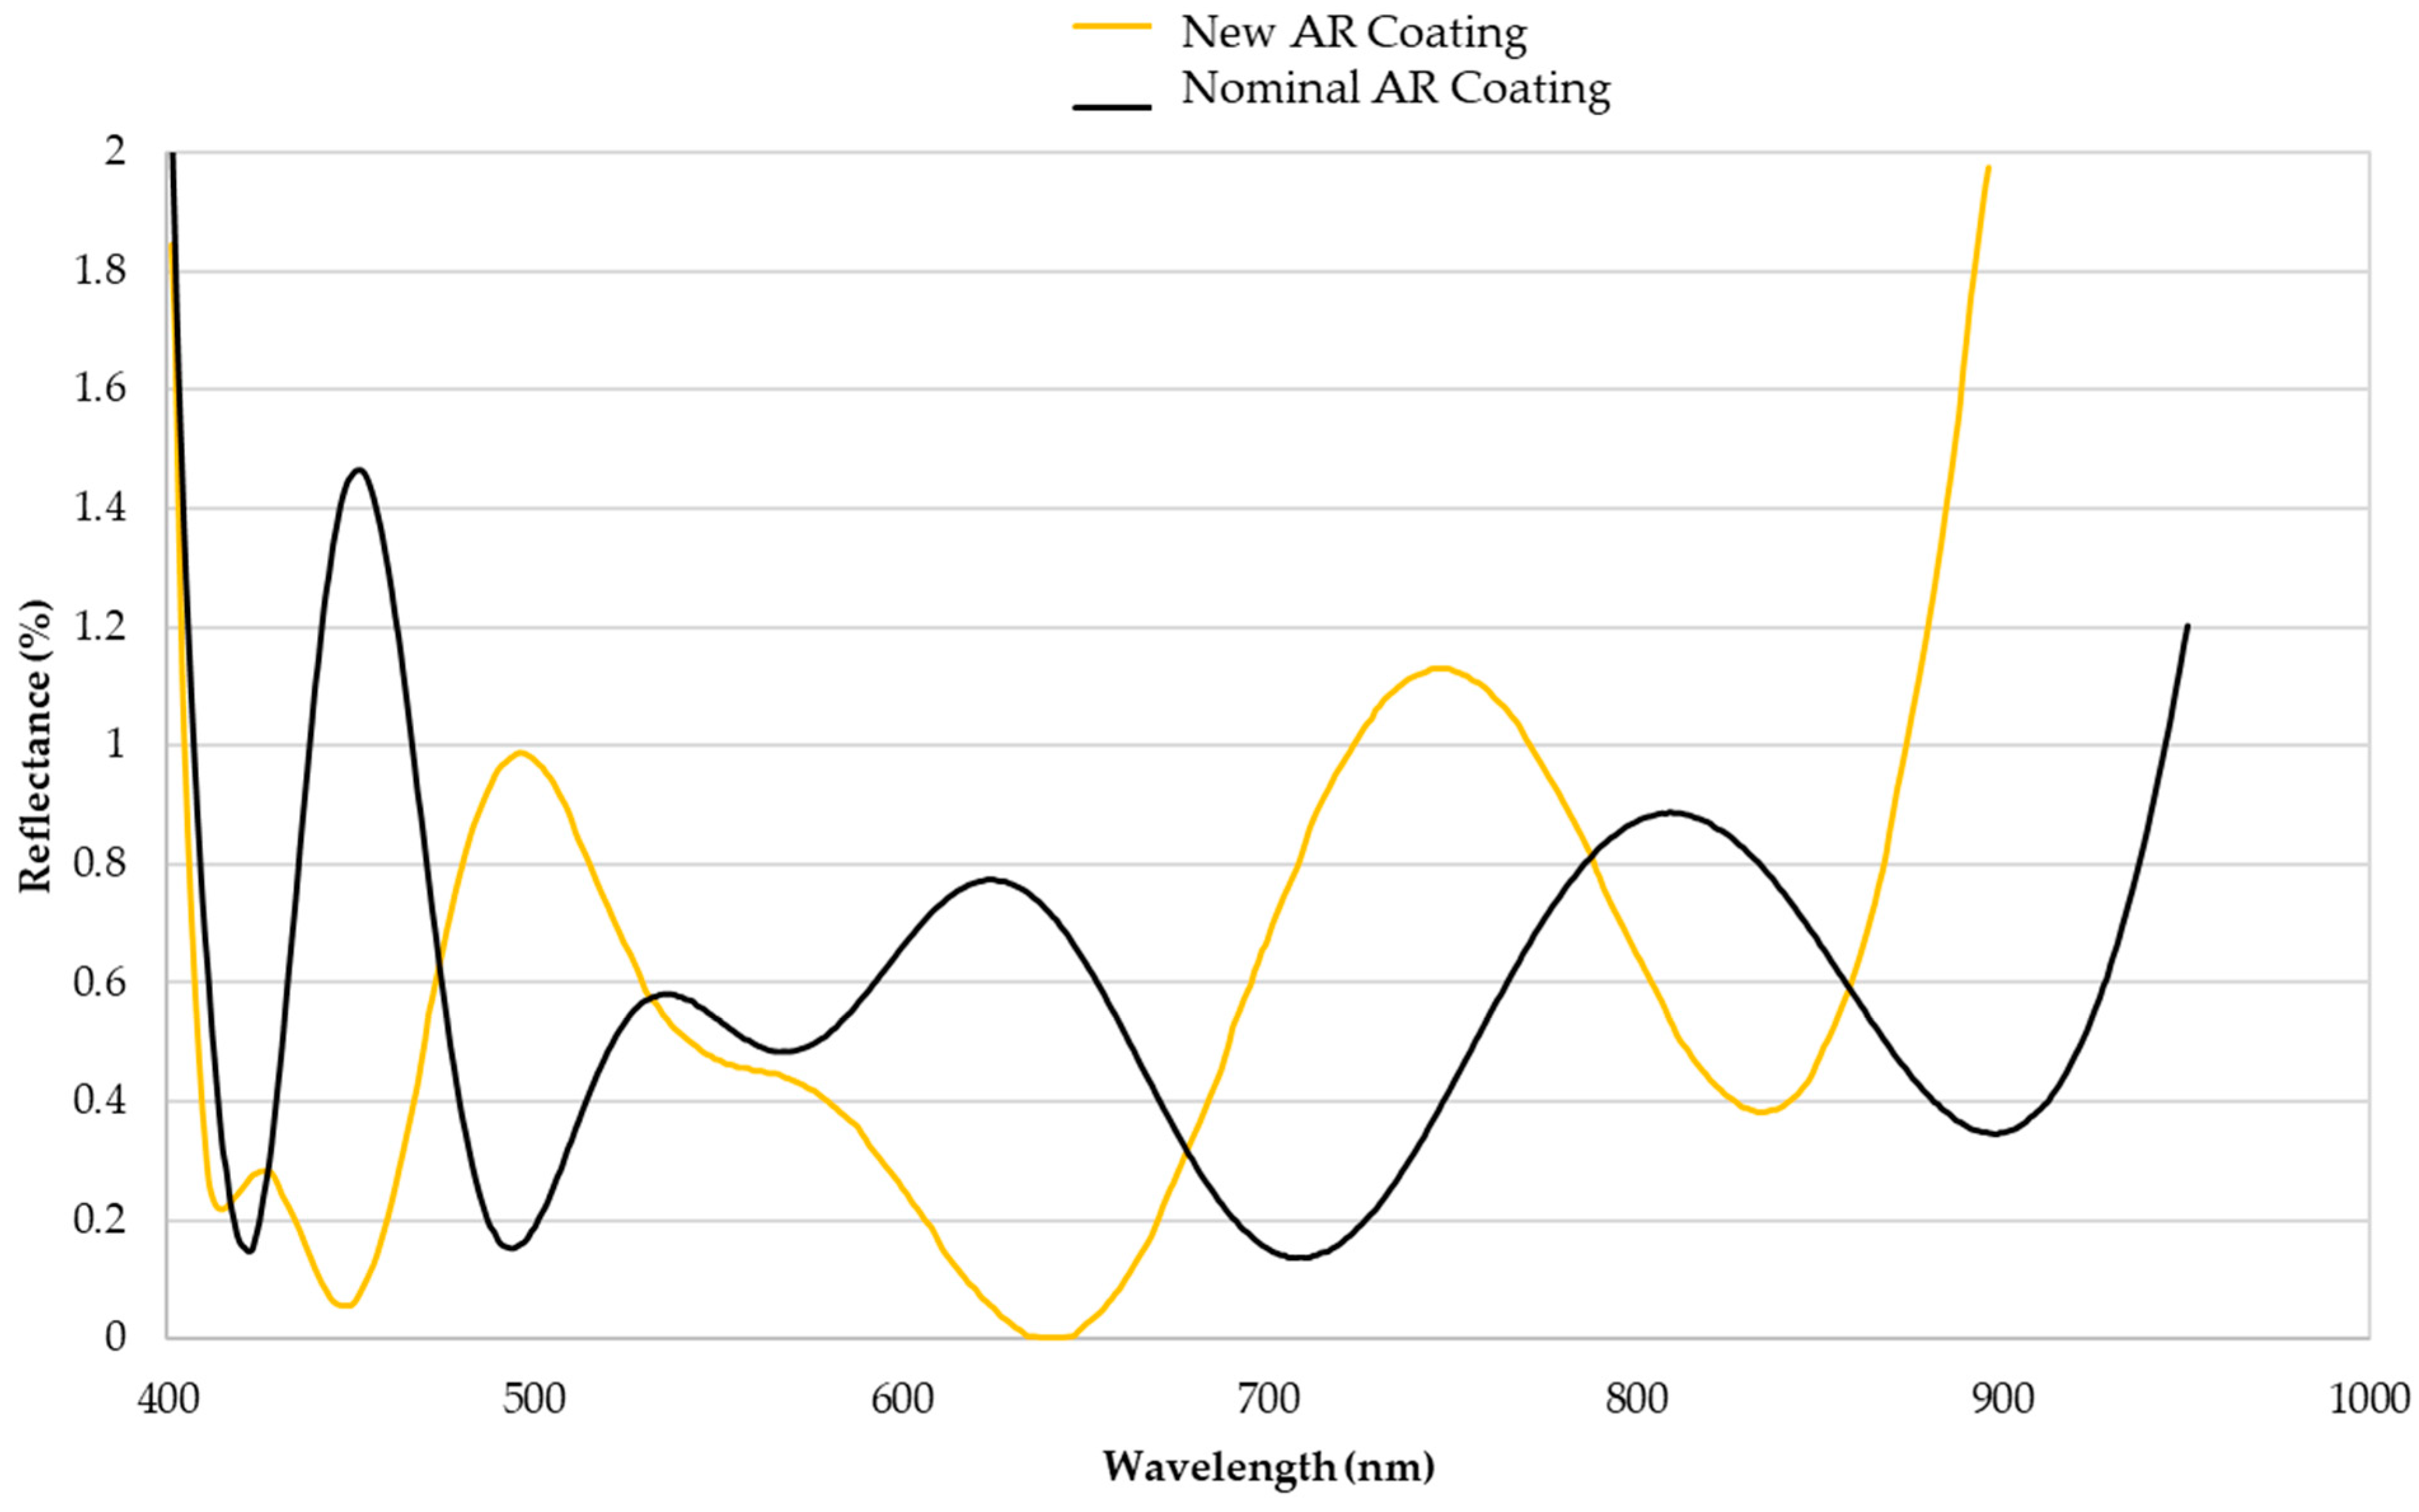
For eliminating the ghost fringes, several solutions have been proposed, including anti-reflection coating, polarization alteration, optical parameter manipulation, etc. The most direct way with minimum modification on the original optical system would be anti-reflection coating at the wavelength of the interferometer on the surfaces causing ghost fringes.
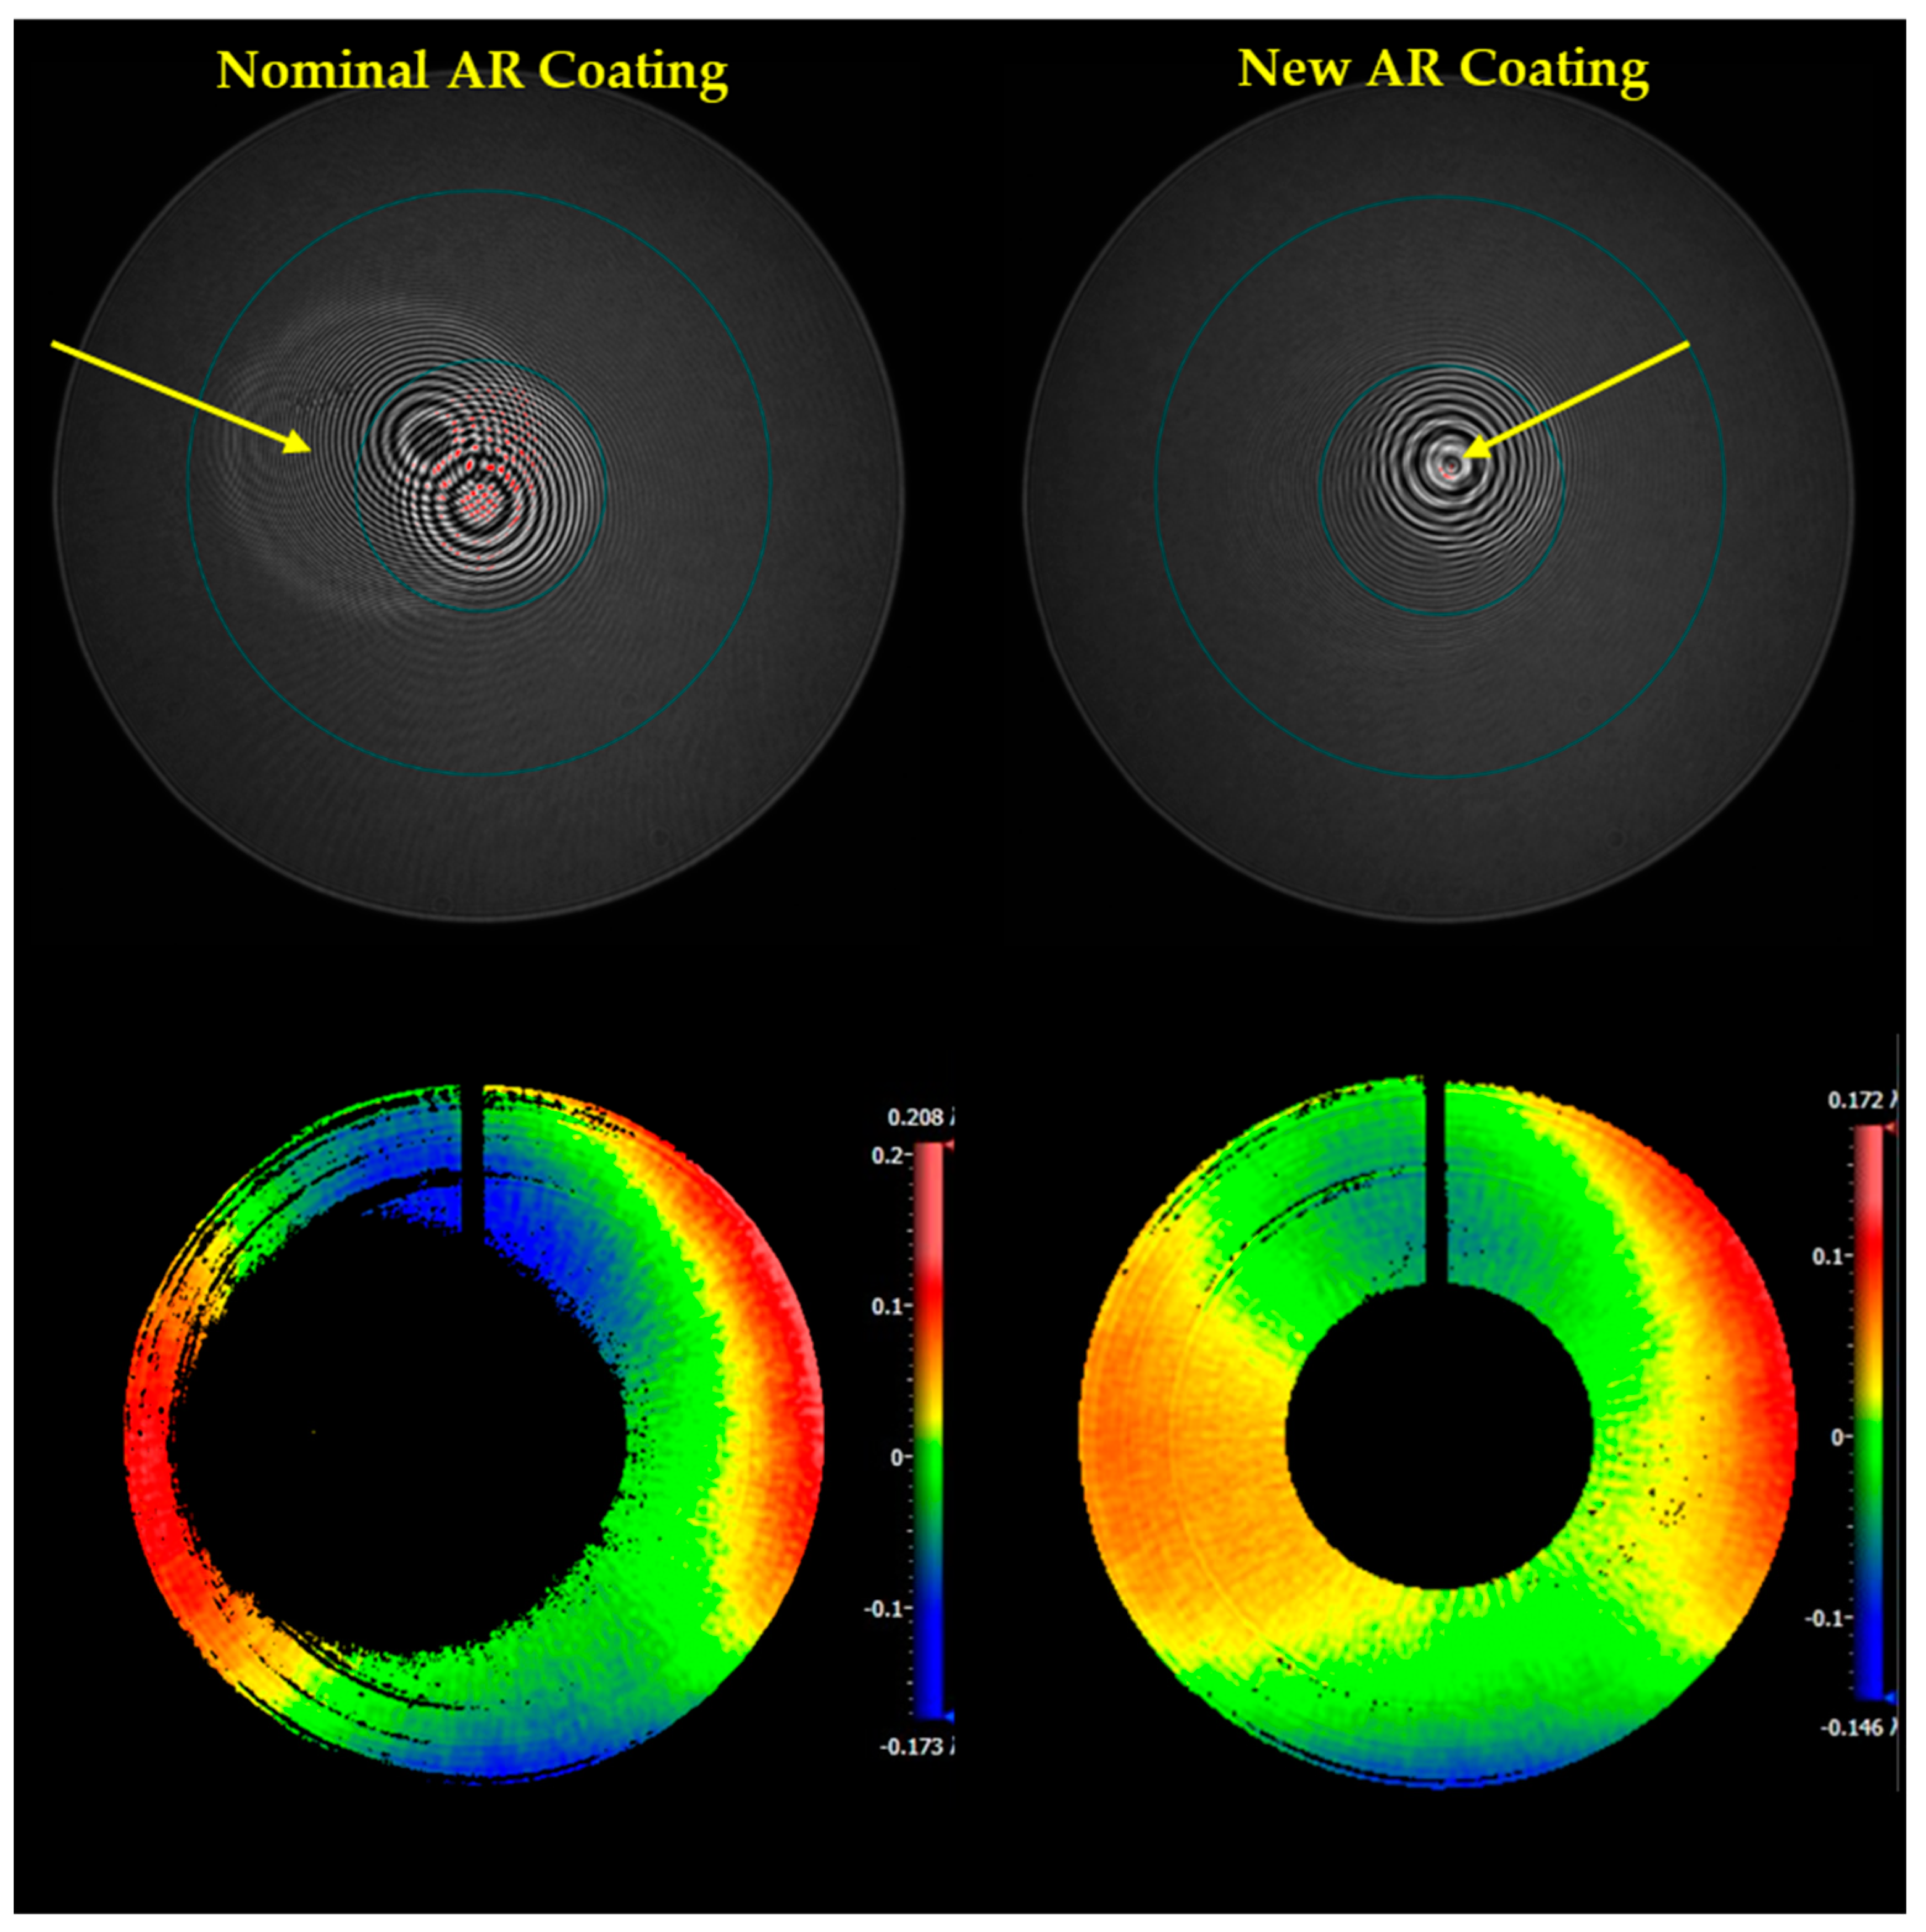
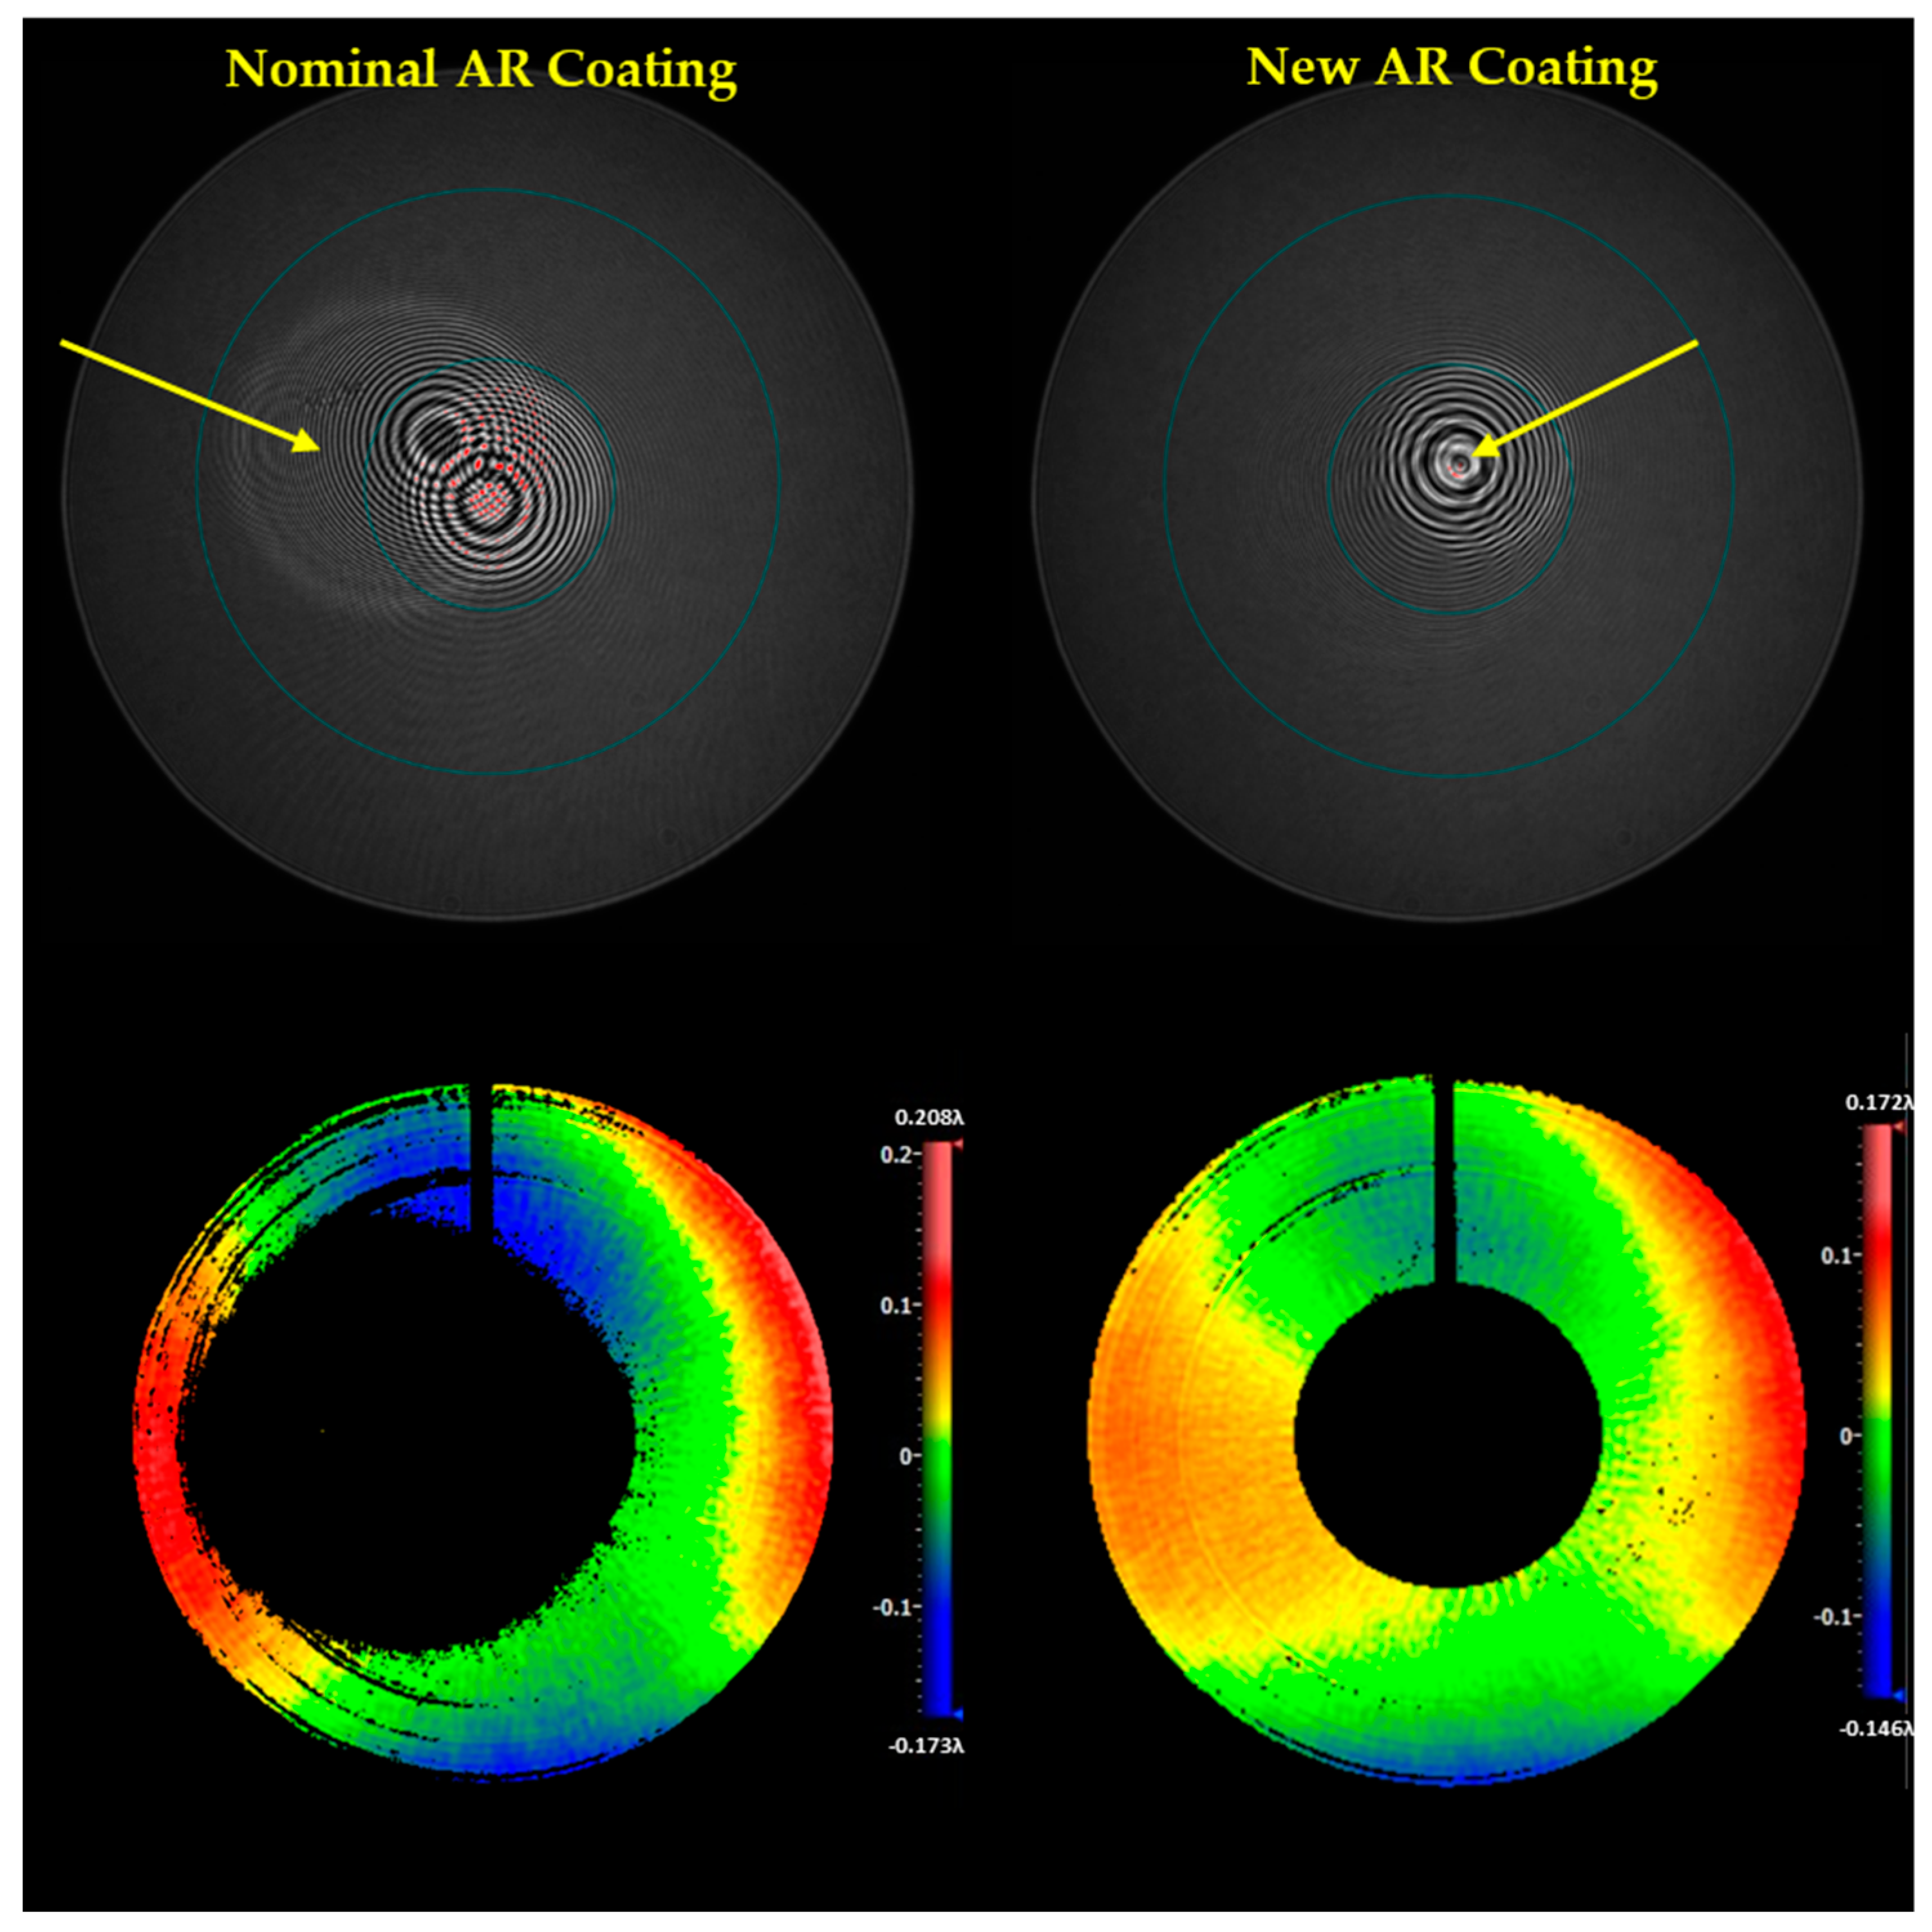
Figure 8 shows the spectral reflectivity of the coating for L1S1, where new coating has been designed specially for anti-reflection at the 632.8 nm wavelength of the He-Ne laser, which is used as the light source in the interferometer. The interferogram of the corrector and the WFE of the whole telescope with nominal and new coating on L1S1 are shown in
Figure 9, which indicates that the new coating is effective in eliminating the ghost fringe. Nevertheless, the modification is made only for accommodating interferometric measurements in the assembly process, which might not be an optimal design or might even cause side effects in real applications. This means that the approach is not a generic solution.
By examining the light path shown in
Figure 7, reducing the size of the pinhole should be able to block more energy from the ghost light path while allowing through the desired light from the telescope, consequently reducing the relative contrast of the ghost fringe. However, the minimum pinhole size is normally determined by the feasibility of the optical alignment process. An alternative but equivalent modification would be to change the f-number of the diverger lens of the interferometer.
The analysis of the influence of the f-number on the ghost fringe was conducted with the non-sequential mode of Zemax [
11,
12] by calculating the contrast of coherent irradiance. An aberration-free module, consisting of three lens elements, was designed to act as the diverger lens in the interferometric light path, as shown in
Figure 2. A 1 mm diameter pinhole with absorbing coating material was located at the image plane of the telescope. The whole interferometric system consisted of a diverger lens module, a reference mirror, a light source at 632.8 nm with 1 w/cm
2 power, and an interferogram detector with 1000 × 1000 pixels.
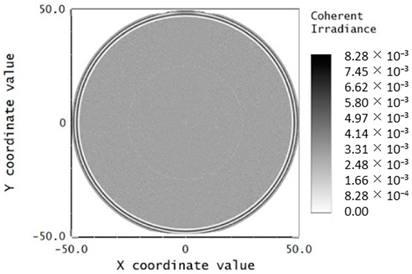
For the first configuration, perfect AR coating with 100% transmittance was applied to all surfaces of the corrector lens module to simulate the interferometric fringe of the whole telescope. The corresponding coherent irradiance on the interferogram and cross-sectional distribution are shown in
Figure 10. The maximum value of coherent irradiance was calculated by averaging the top 100 data points and the result was 0.0083 w/cm
2.
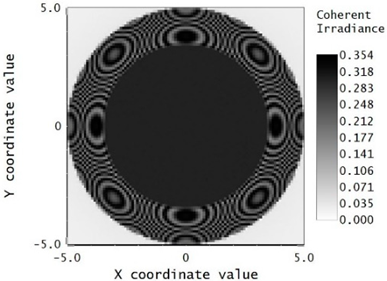
Secondly, in order to simulate only the ghost fringe from L1S1, the mirror surface was applied on L1S1, as shown in
Figure 11. With this setup, the coherent irradiance purely from L1S1 could be obtained, as shown in
Figure 12. The maximum value of coherent irradiance was 0.0106 w/cm
2.
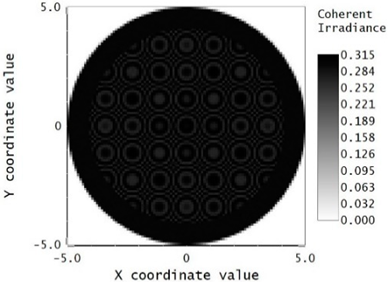
Finally, the superposition of the telescope fringe and the ghost fringe was simulated by applying 50% transmittance coating on L1S1. The gray scale graph of coherent irradiance with both the original telescope fringe and the ghost fringe from L1S1 is shown in
Figure 13. Based on this diagram, the contrast of the original fringe to the ghost fringe could be evaluated, which was around 60%.
A similar analysis can be performed for different f-numbers of the diverger lens module.
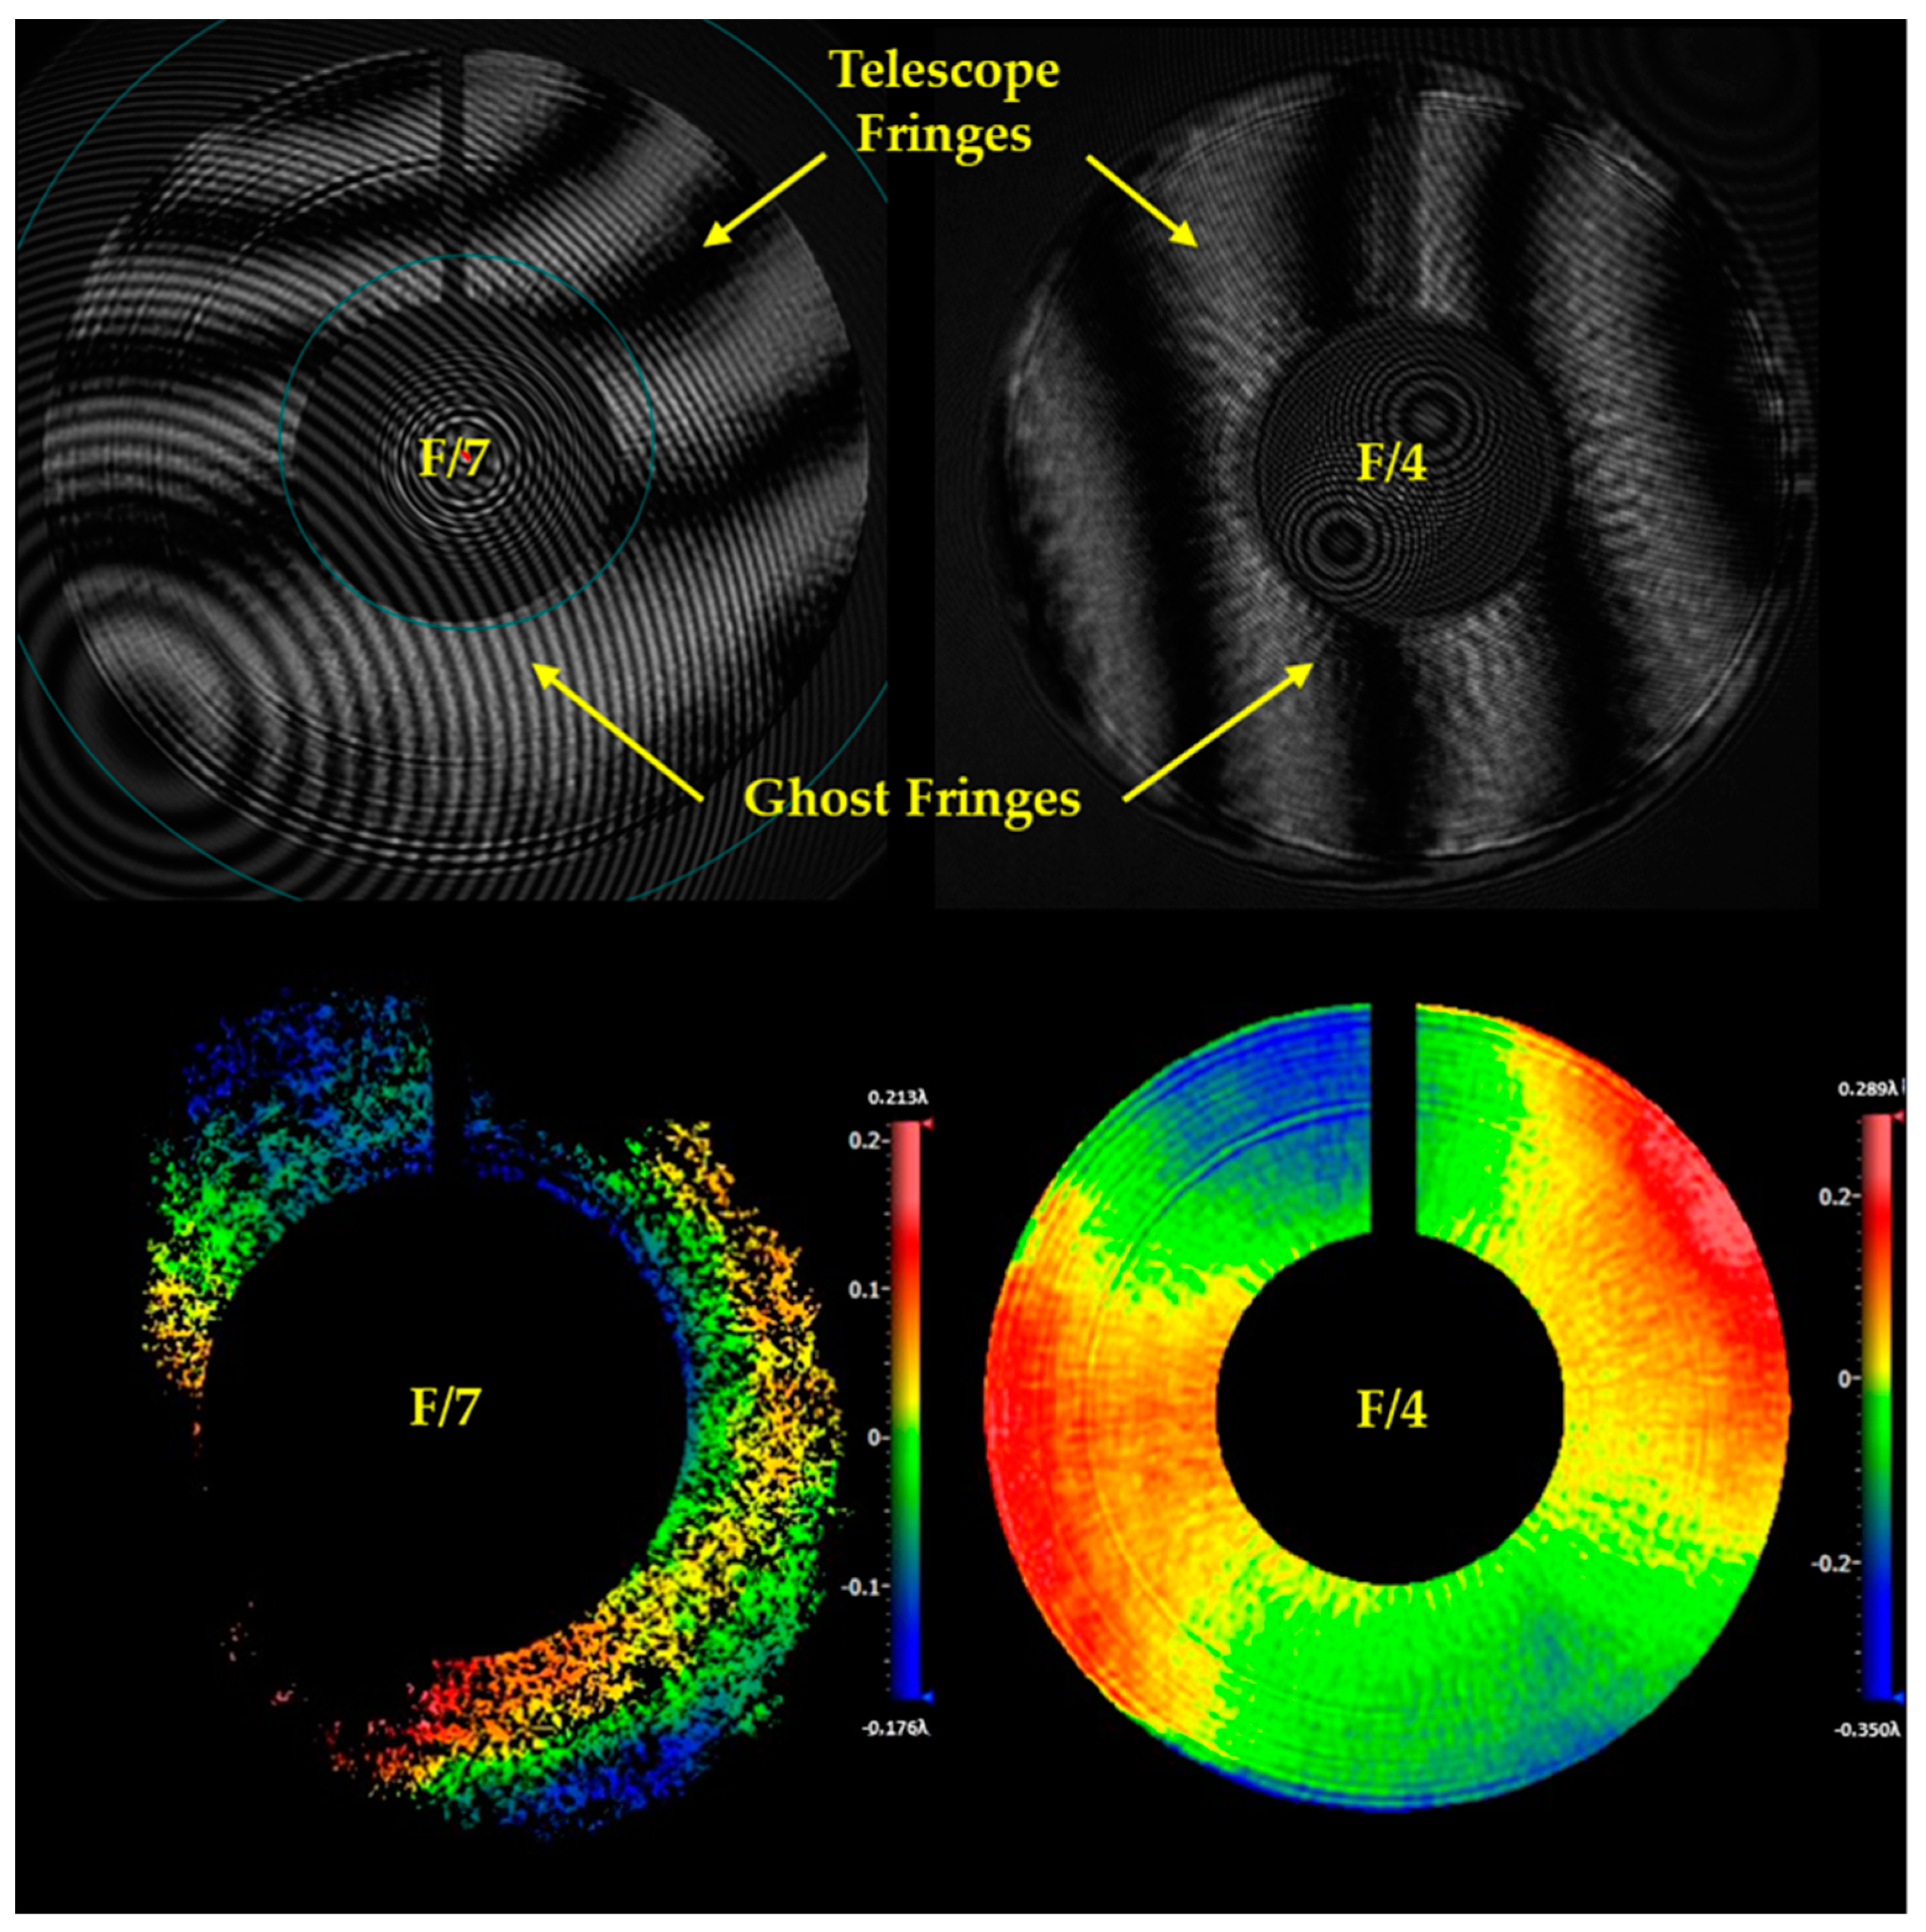
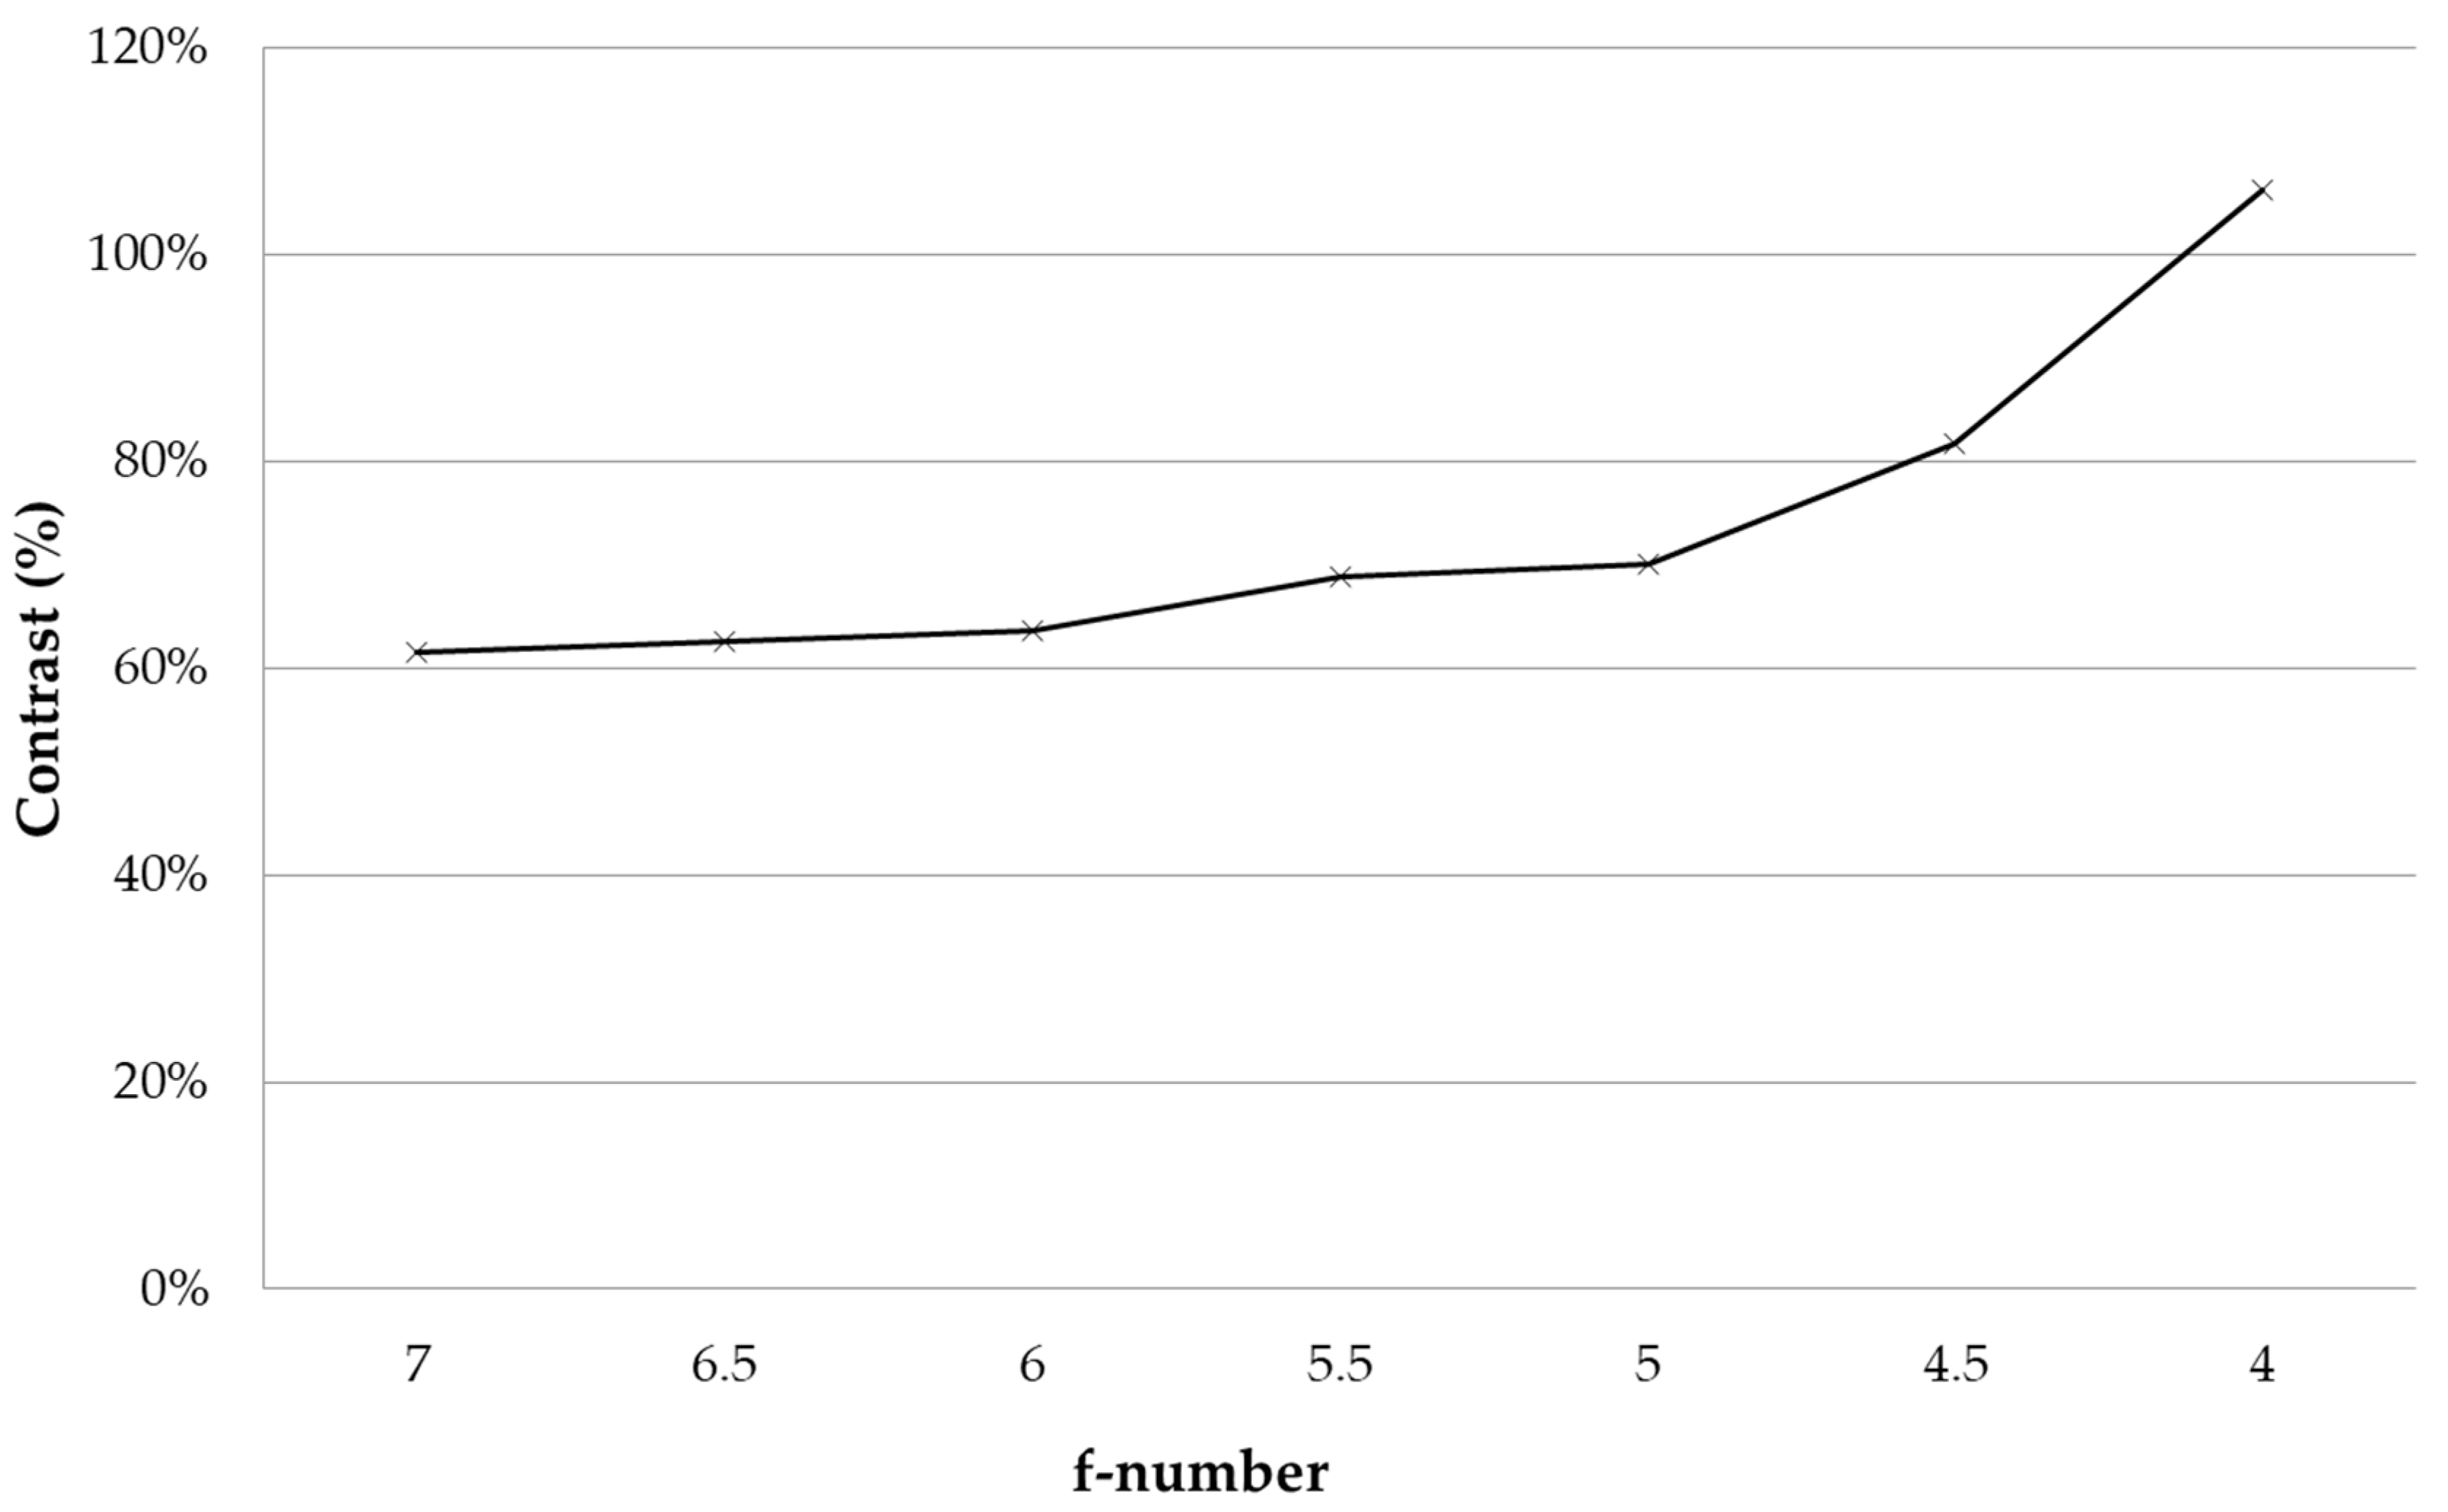
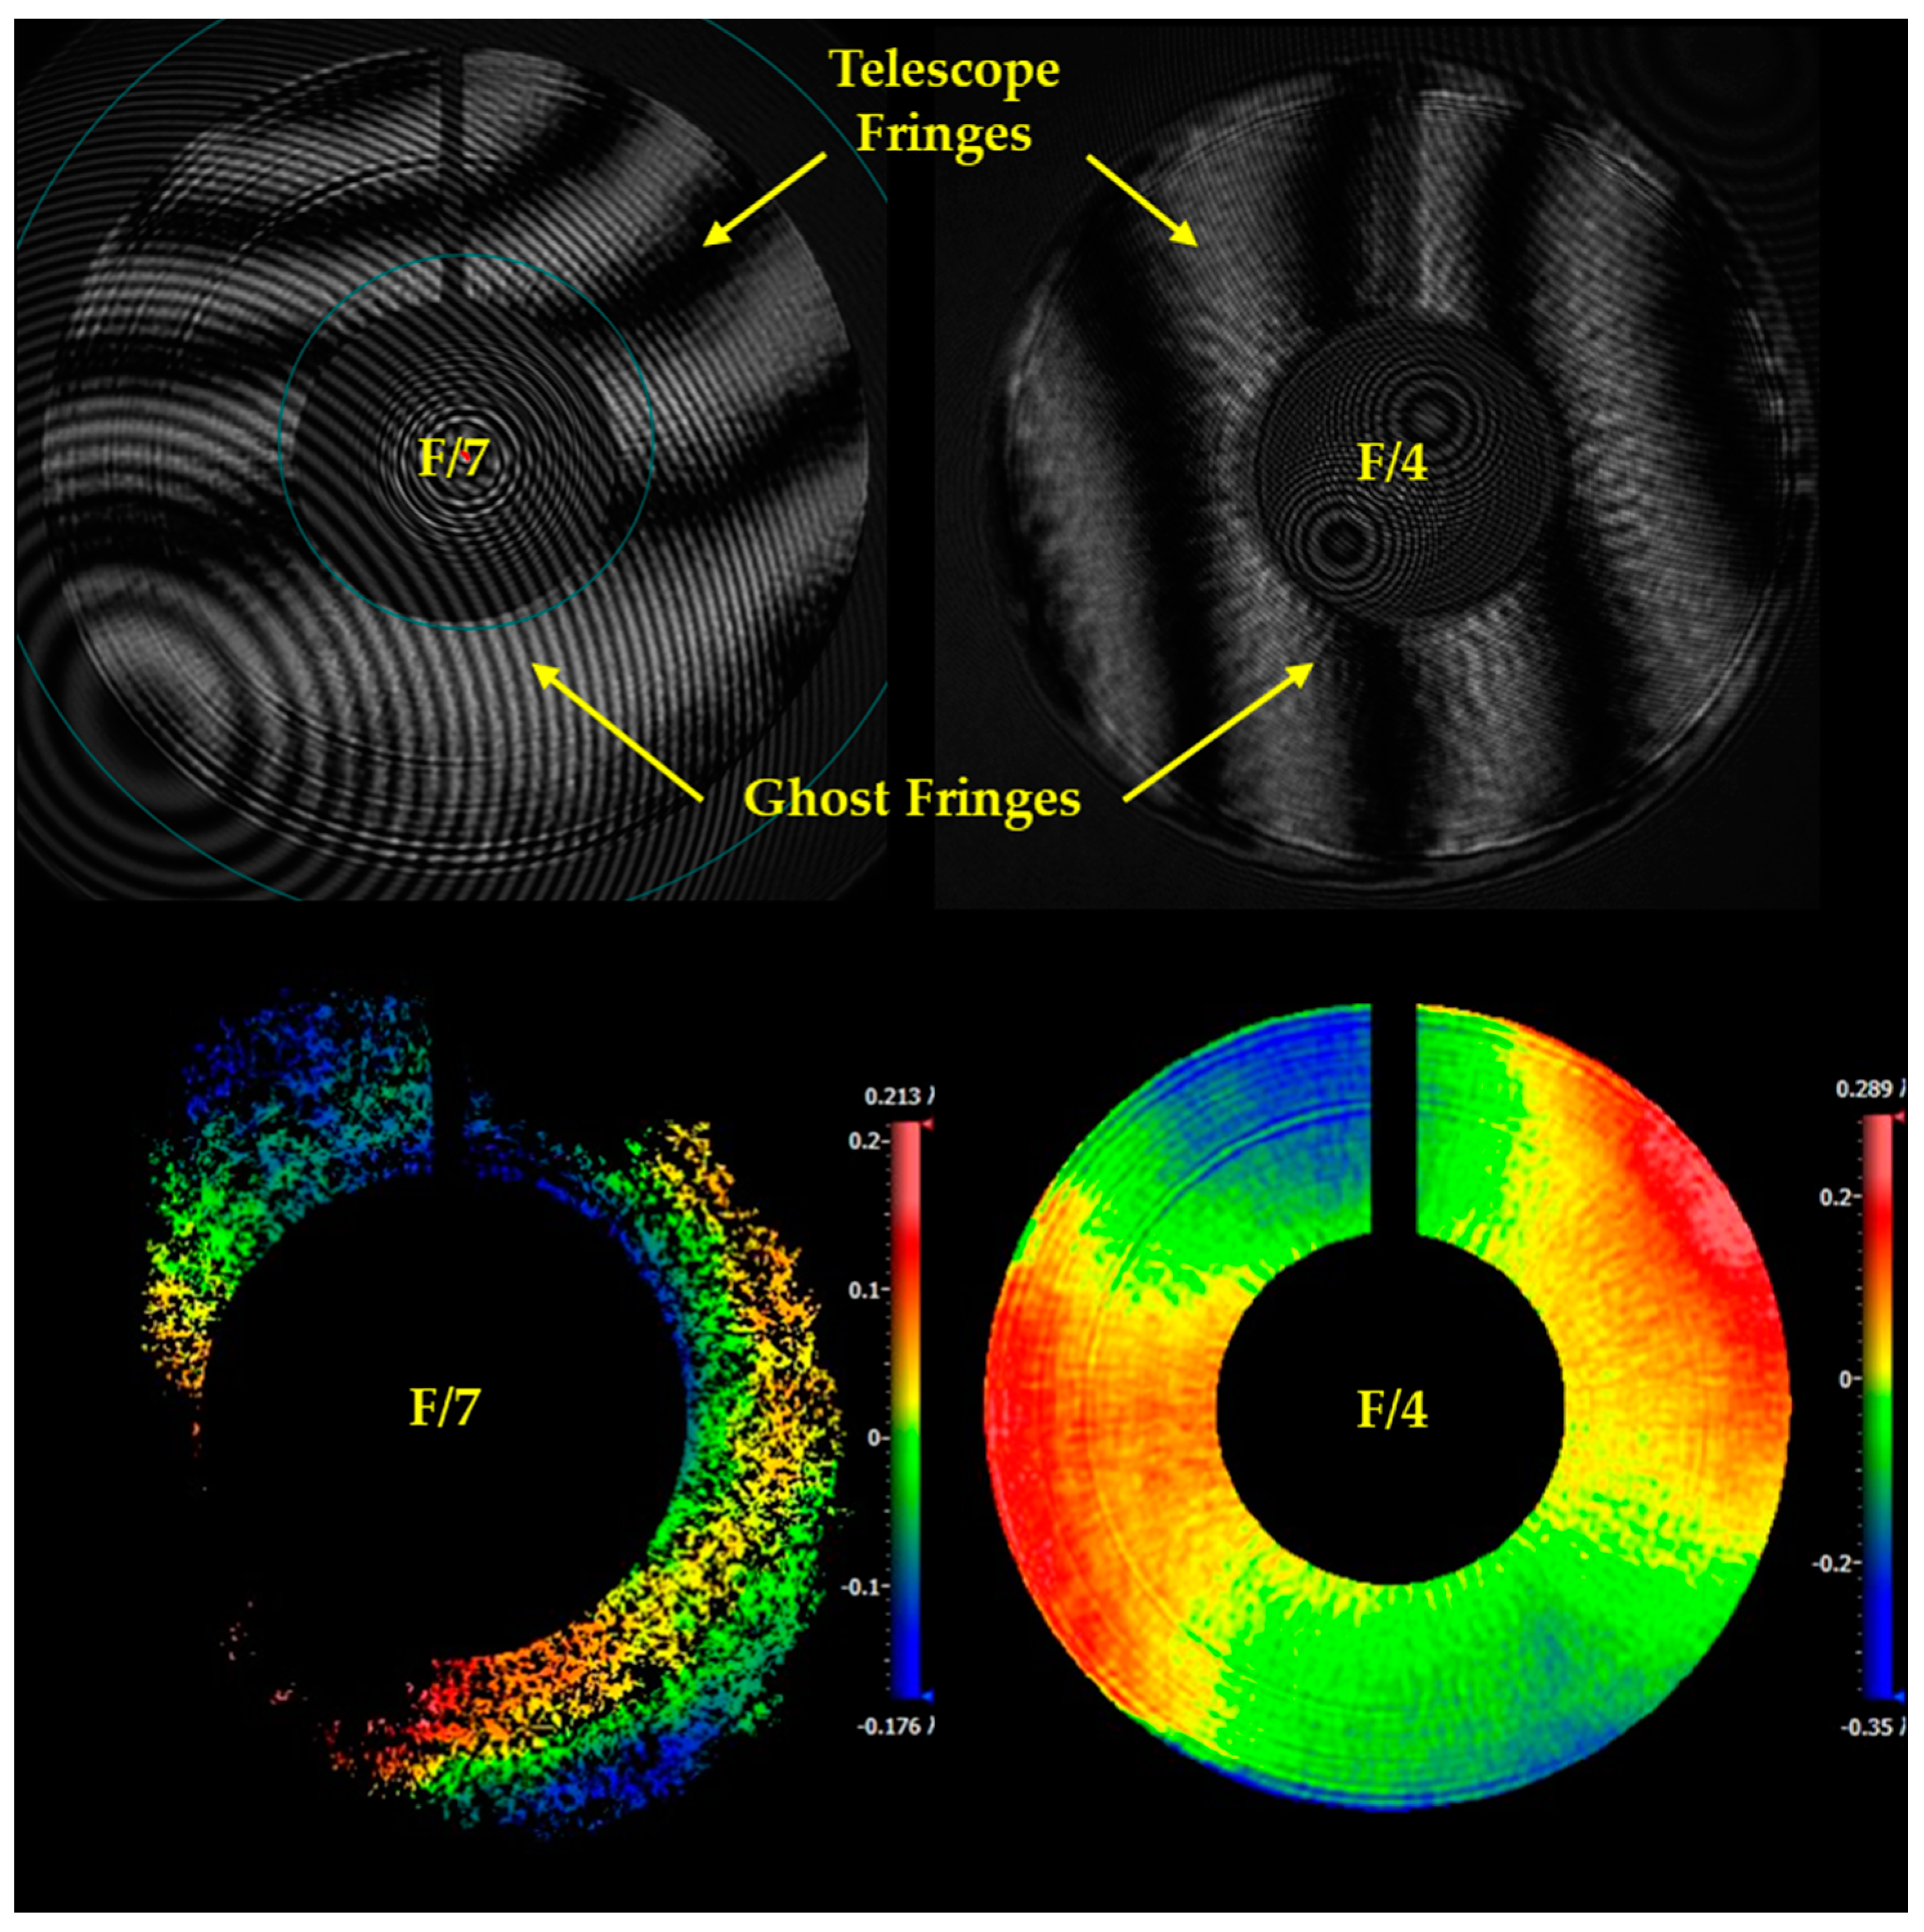
Figure 14 shows the contrast of the telescope fringe to the ghost fringe with different f-numbers of the diverger lens module from F/7 to F/4. It indicates that the contrast increases with the reduction in f-number, and it exceeds 100%, i.e., the intensity of the telescope fringe surpass that of the ghost fringe from L1S1, at F/4 of the diverger lens. The comparison of the superposition fringe for F/7 and F/4 is shown in
Table 2.
