Mobile Application for Visible Light Communication Systems: An Approach for Indoor Positioning


Abstract
1. Introduction
1.1. Recent Development of Visible Light Communication
1.2. Comparison between Visible Light Communication and Radio Frequency
- The distinctive nature of visible light communication (VLC) as a communication medium, characterized by noncoherent LED light sources, presents a significant difference from the traditional modulation techniques utilized in radio frequency (RF) communications. In RF systems, modulation encompasses the manipulation of amplitude, frequency, or phase to convey information, offering a wide range of possibilities. In contrast, VLC mainly relies on intensity modulation and direct detection as the primary method for data transmission. This approach imposes specific constraints, restricting the transmission of only real, non-negative signals in VLC, aligning with the unique characteristics of light as the medium for communication. This divergence underscores the need for innovative signal processing techniques and communication strategies tailored to VLC, opening new orientations for research and development in the field of optical wireless communication.
- Indoor visible light communication (VLC) systems are often seamlessly integrated into existing lighting infrastructure, making illumination a fundamental and integrated aspect of VLC technology. Within a typical office environment, the recommended illumination level typically falls around 400 lux [20]. In such settings, a VLC system is expected to provide stable and non-flickering lighting that can be dimmed for control and to meet the desired ambiance. In VLC, the optical power transmitted serves a dual purpose, as it is not solely dedicated to communication but also fulfills the crucial role of illumination. Therefore, the design criterion for VLC systems shifts away from the conventional RF systems, where the emphasis is primarily on minimizing the transmitted power. The development of VLC technology in this context not only enhances communication capabilities, but also contributes to energy-efficient and aesthetically pleasing indoor lighting solutions.
- In contrast to radio waves, which have the ability to penetrate walls and obstacles, optical signals, including those employed in visible light communication (VLC), are unable to traverse physical barriers. This inherent characteristic of optical signals brings a significant advantage in terms of security, as these signals tend to remain confined within the physical boundaries of the space in which they are emitted. When considering long-distance VLC communications, the concept of line-of-sight (LoS) emerges as an essential requirement. In LoS scenarios, both the sender and receiver must maintain an unobstructed, direct line-of-sight to each other for effective communication. Any intervening obstruction or barrier in the transmission path becomes immediately evident and can disrupt the communication link. Consequently, VLC technology garners substantial favor in military and governmental applications where stringent information privacy and security are of paramount importance. In these contexts, VLC’s ability to preserve the integrity of communication within confined spaces, comes with its susceptibility to obstructions, rendering it a highly desirable choice for the protection of sensitive information and the establishment of secure communication channels.
- The challenge of indoor localization has become a prominent and actively researched area, drawing significant attention in recent years. The use of global navigation satellite system (GNSS) signals for indoor localization faces practical challenges, primarily stemming from the effects of multipath transmission and signal attenuation within indoor environments. In the field of indoor positioning, conventional approaches have traditionally centered around radio-frequency methods, sound signals, and camera-based systems [21]. However, recent research has unveiled that visible light communication (VLC) systems can provide surprisingly accurate solutions for indoor localization applications [22]. VLC-based positioning (VLP) systems have proven to be highly effective in settings such as hospitals, airports, museums, and industrial plants, where traditional technologies often encounter limitations and constraints. This innovative application of VLC technology not only enhances indoor localization accuracy, but also opens new possibilities for precise tracking and navigation in challenging indoor environments.
1.3. Paper Contribution
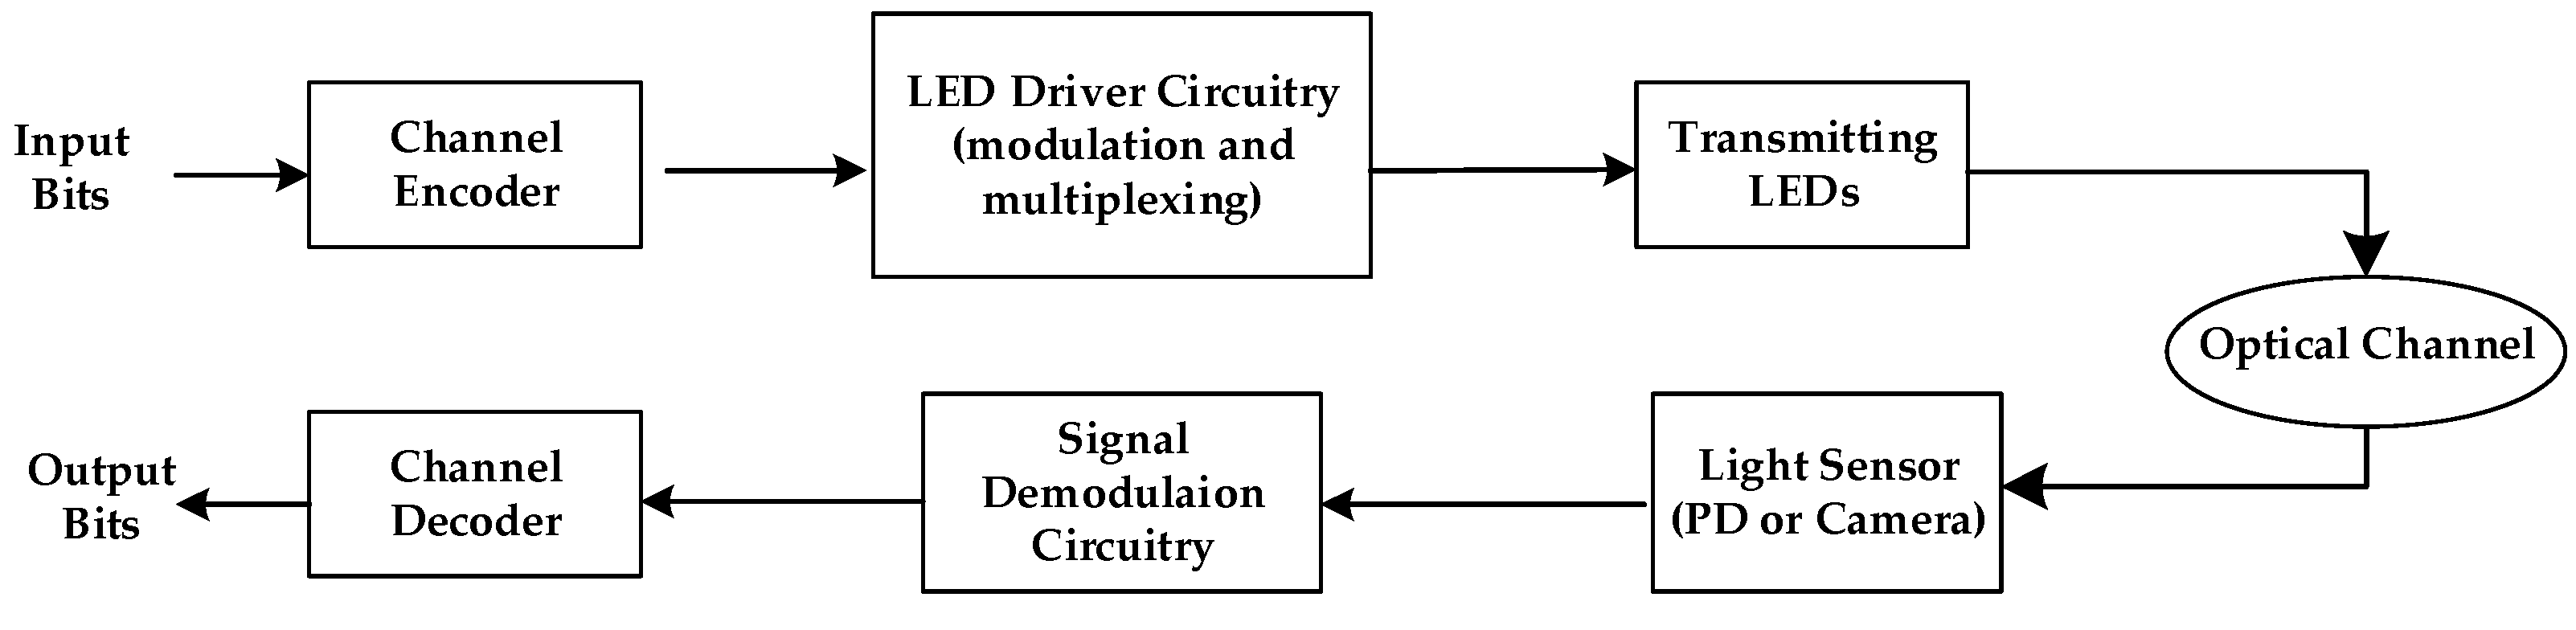
2. Visible Light Communication System Architecture
2.1. MAC and Physical Layer
2.1.1. MAC Layer
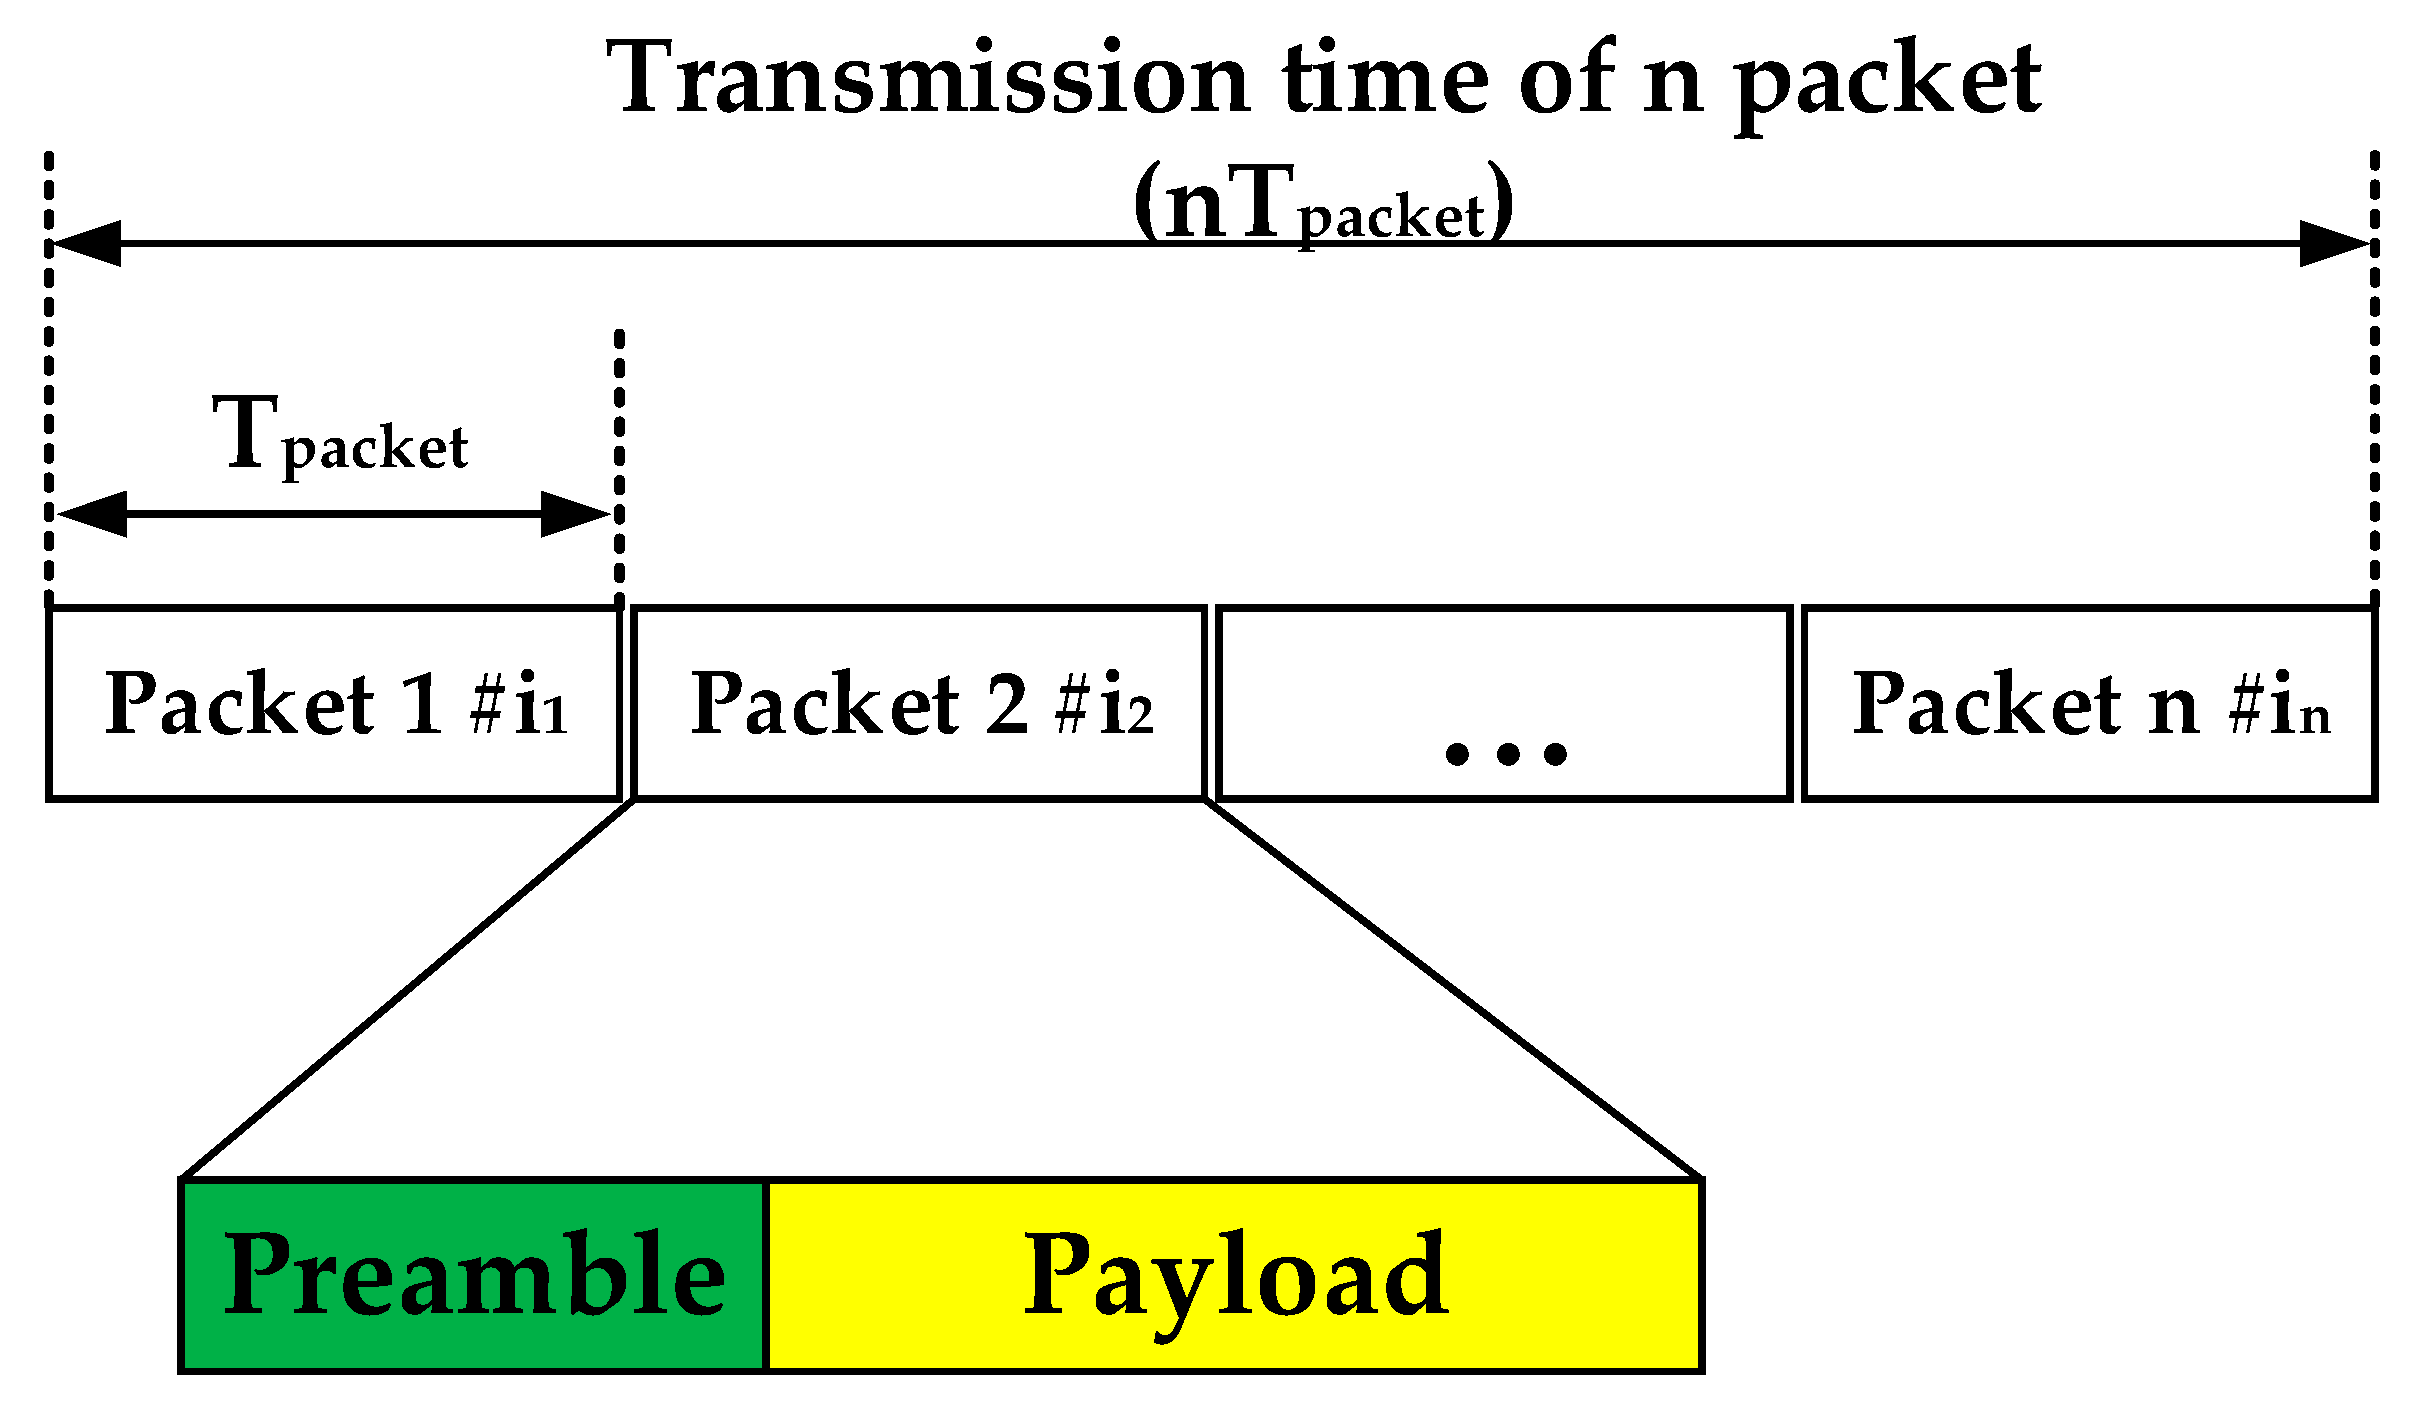
2.1.2. Physical Layer
2.2. Transmitter
2.3. Receiver
3. Literature Review
3.1. Modulation Techniques for Visible Light Communication
3.2. Technology for Indoor Positioning
3.2.1. Indoor Positioning Systems Utilizing Radio-Frequency Technology
3.2.2. Indoor Positioning based on the Visible Light Communication System
3.2.3. Discussion
4. Visible Light Communication System Design for Indoor Positioning
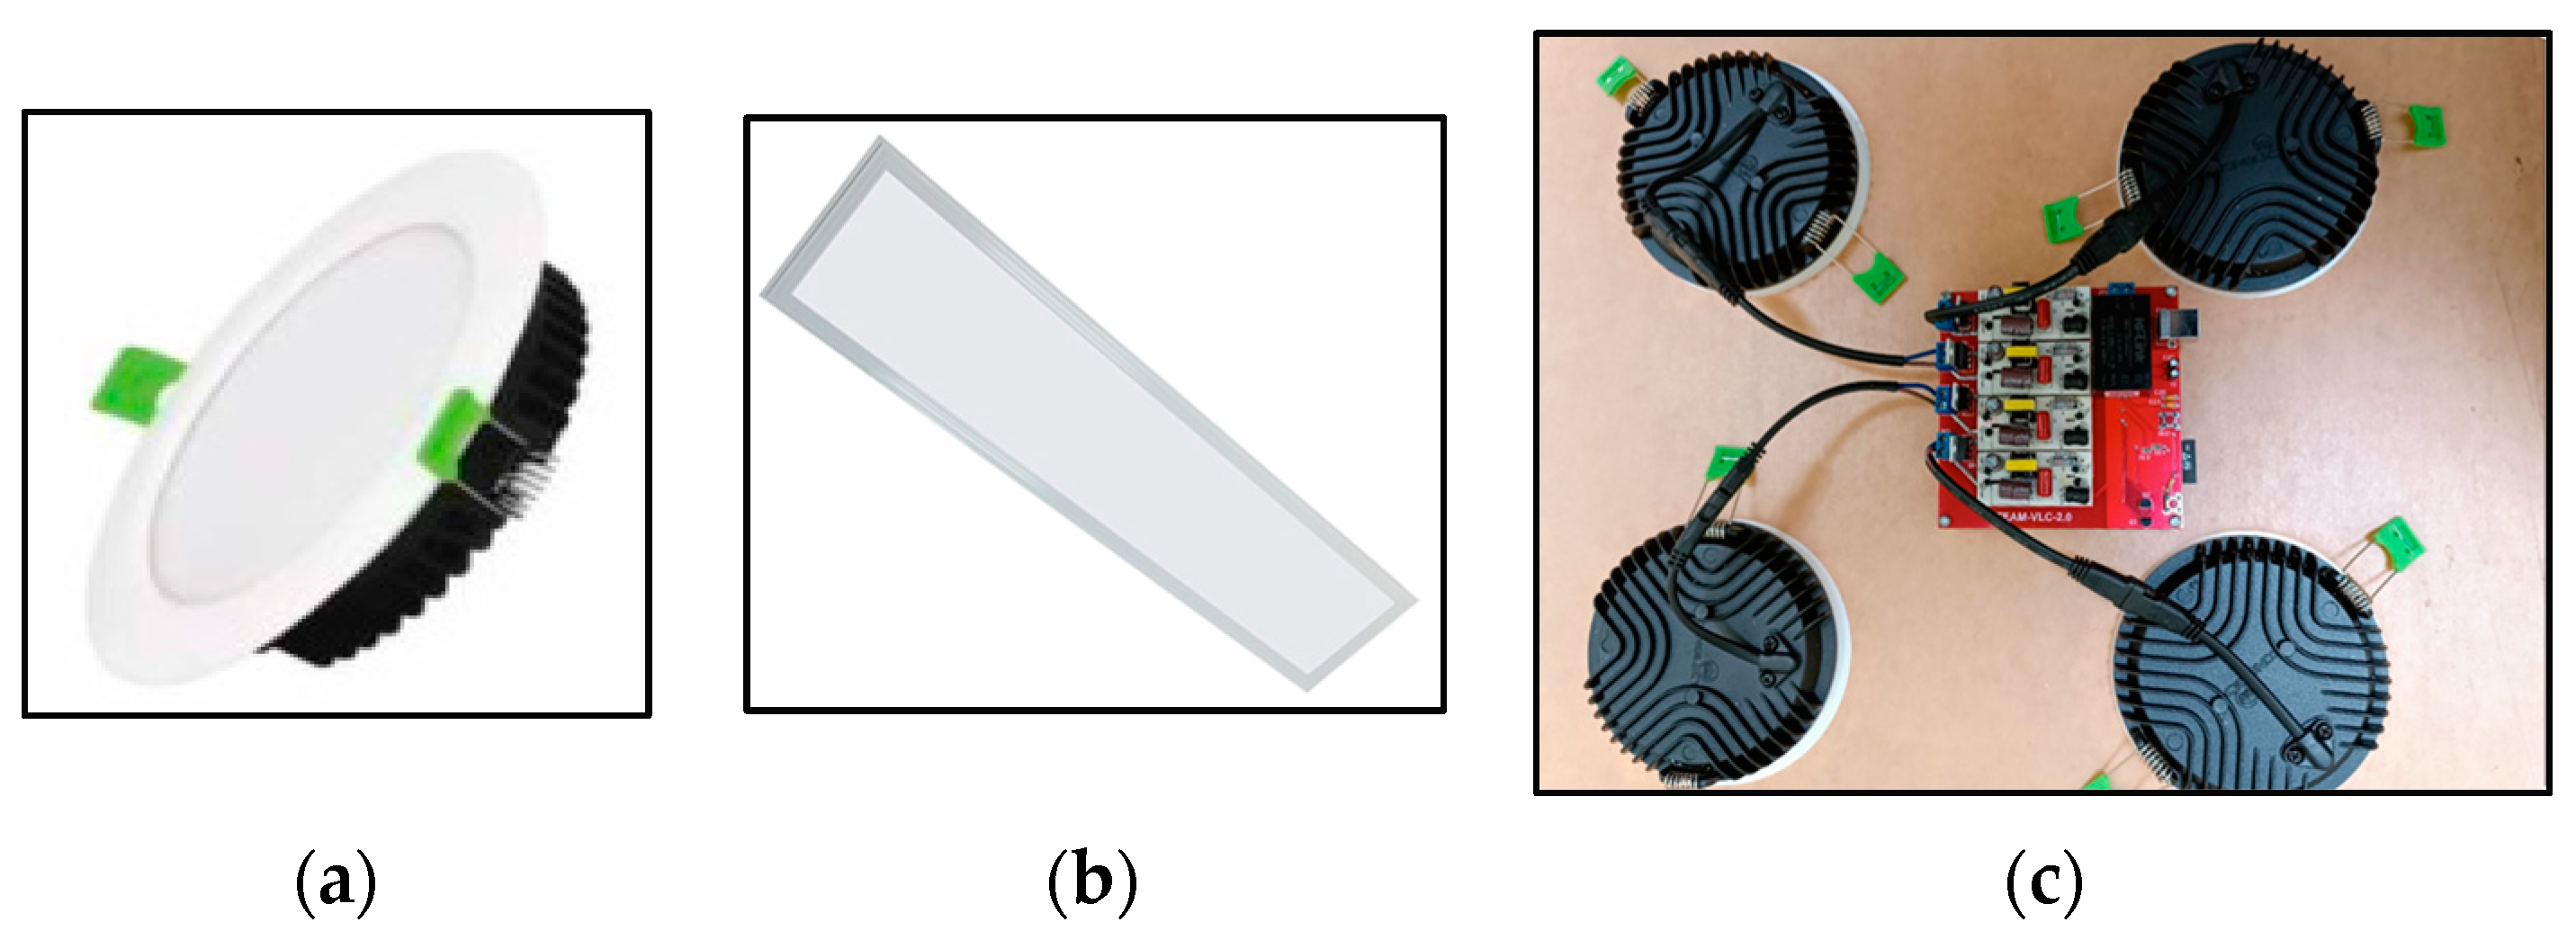
4.1. Transmitter Section
4.1.1. Transmitter Design
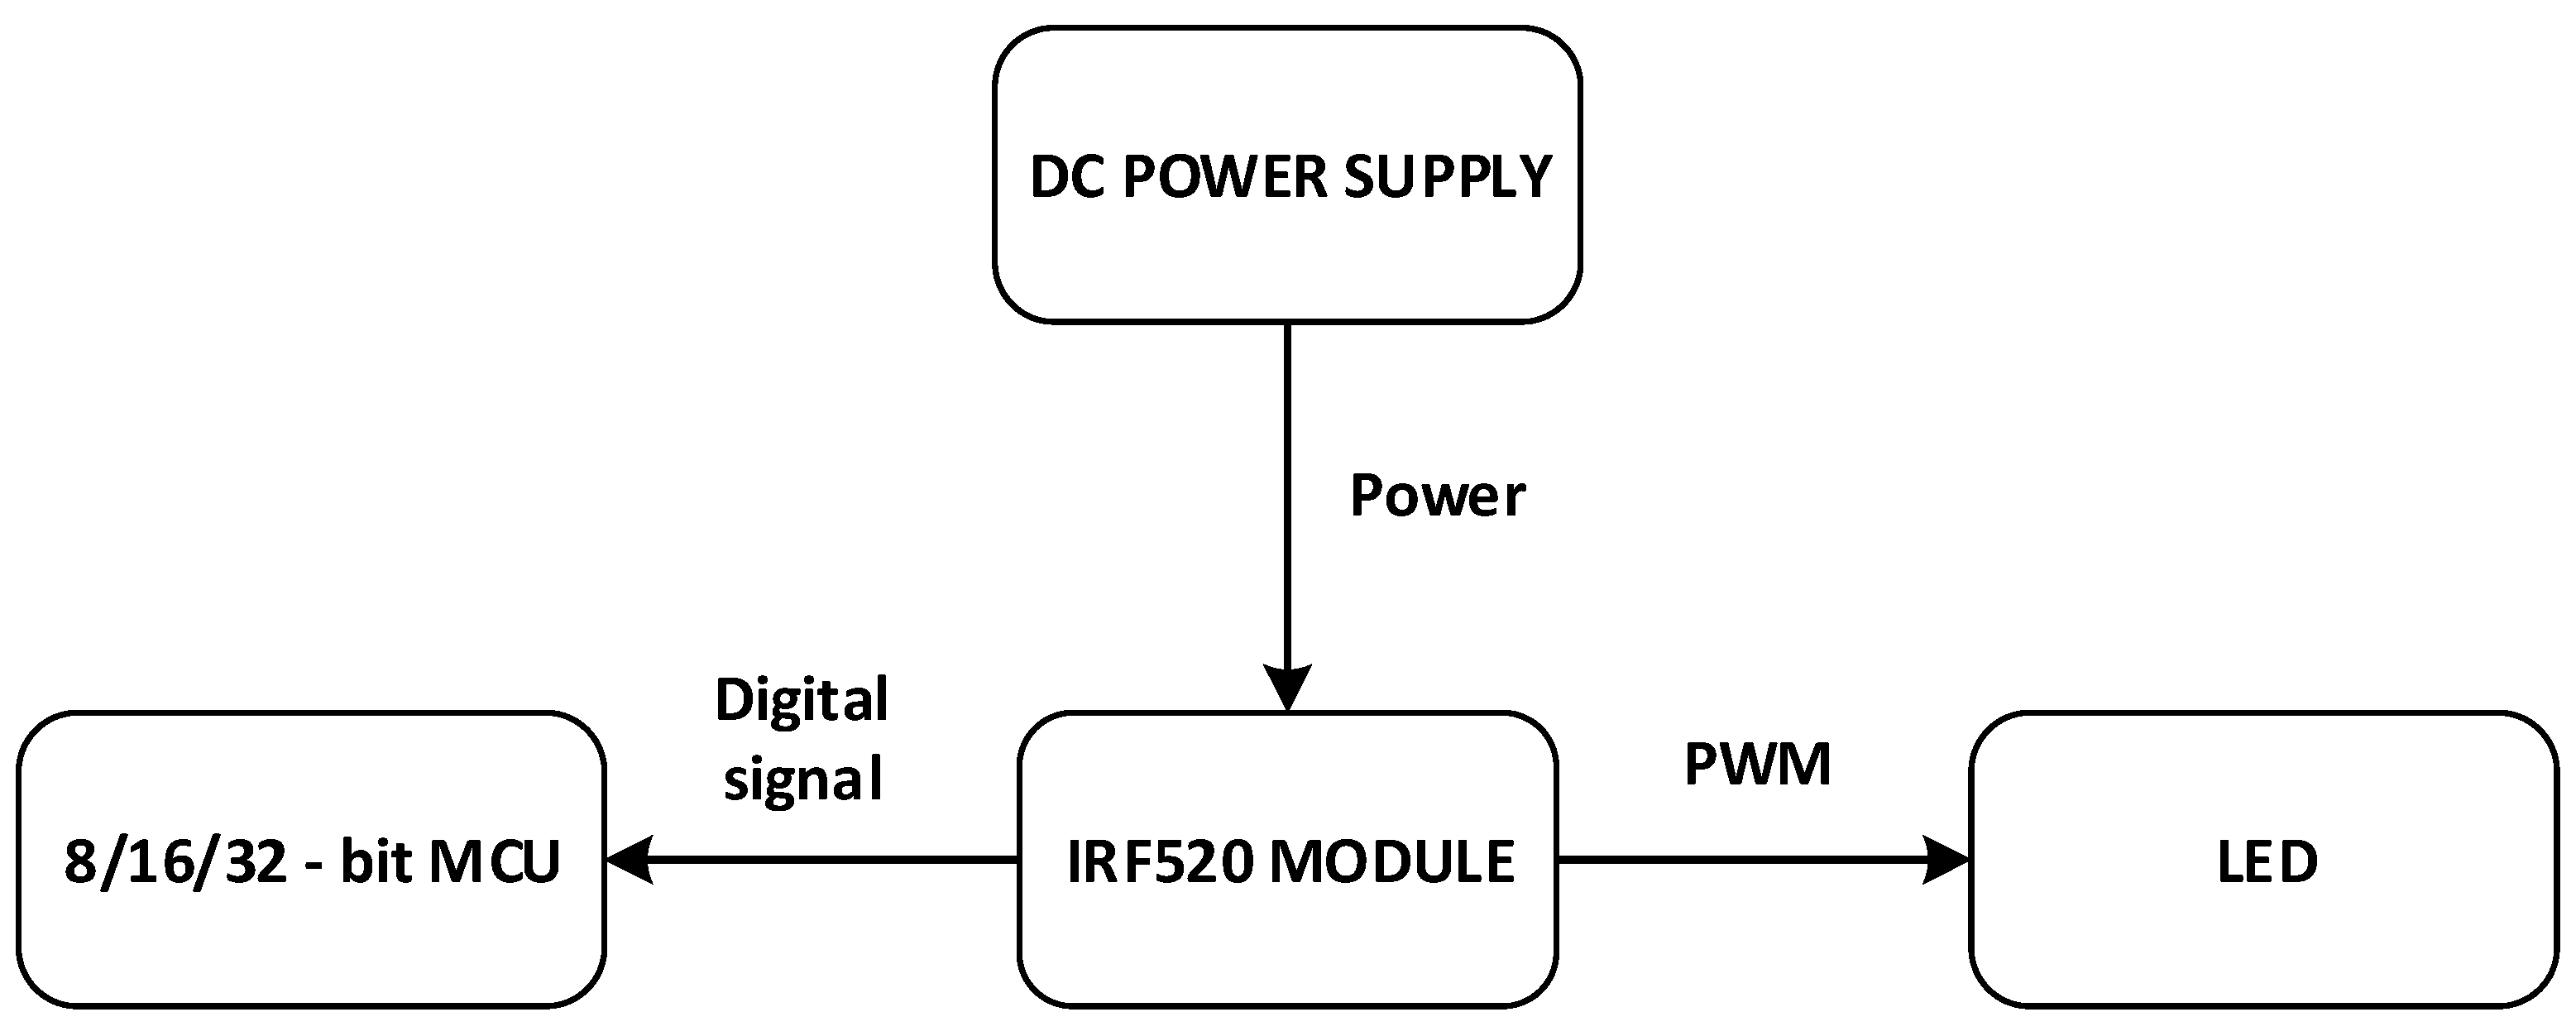
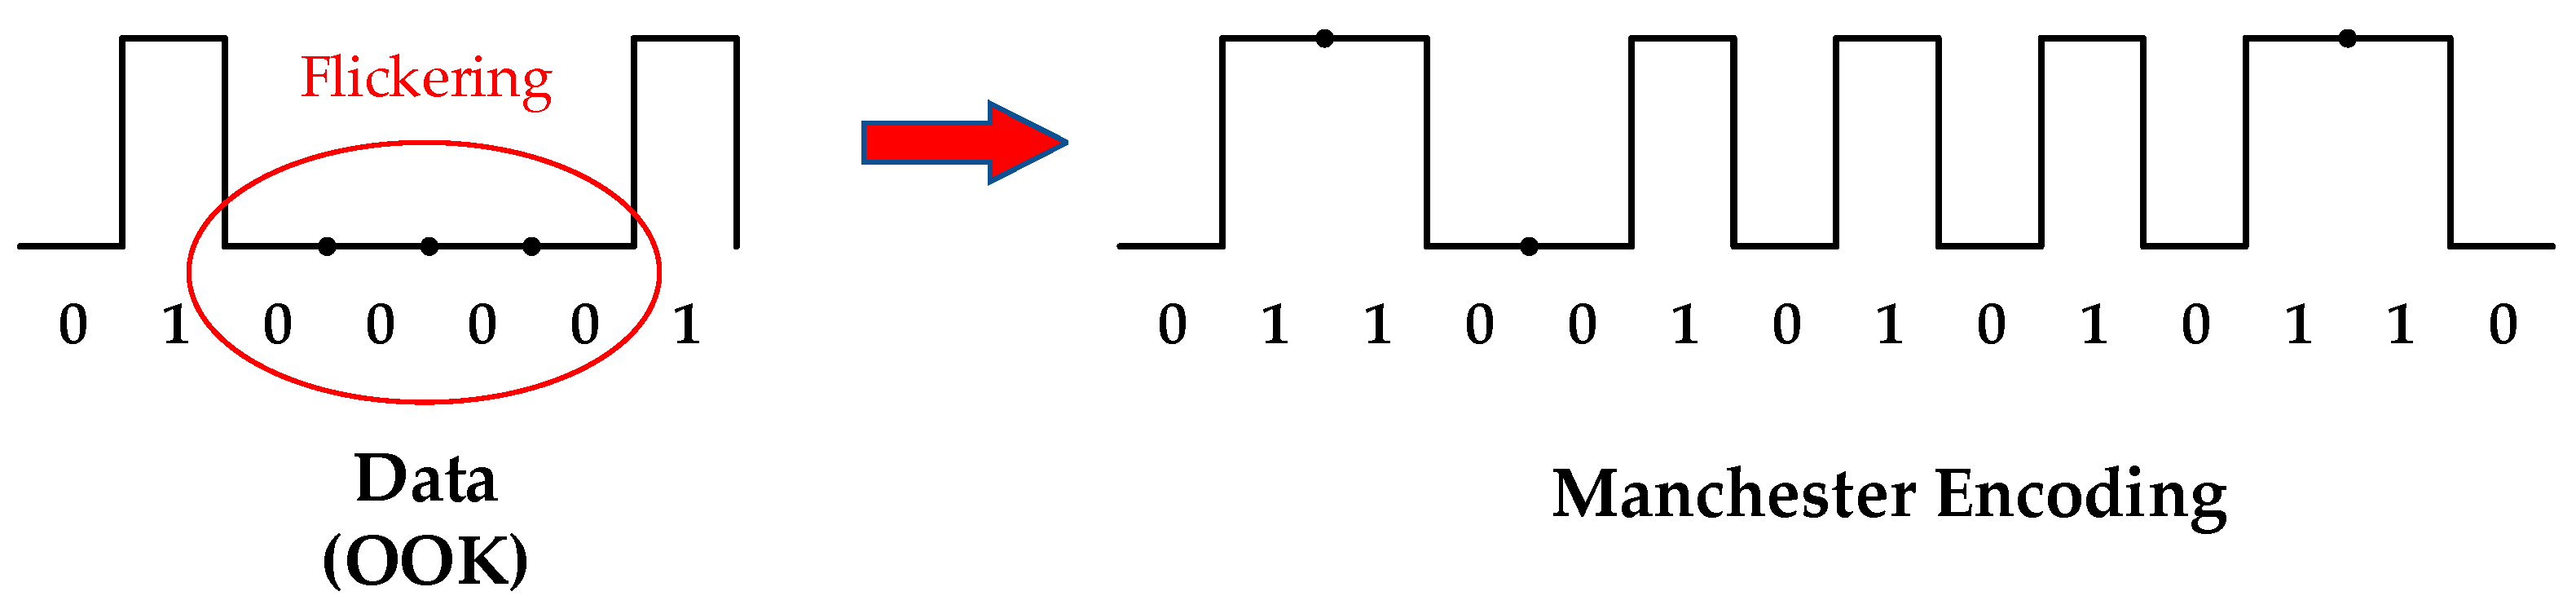
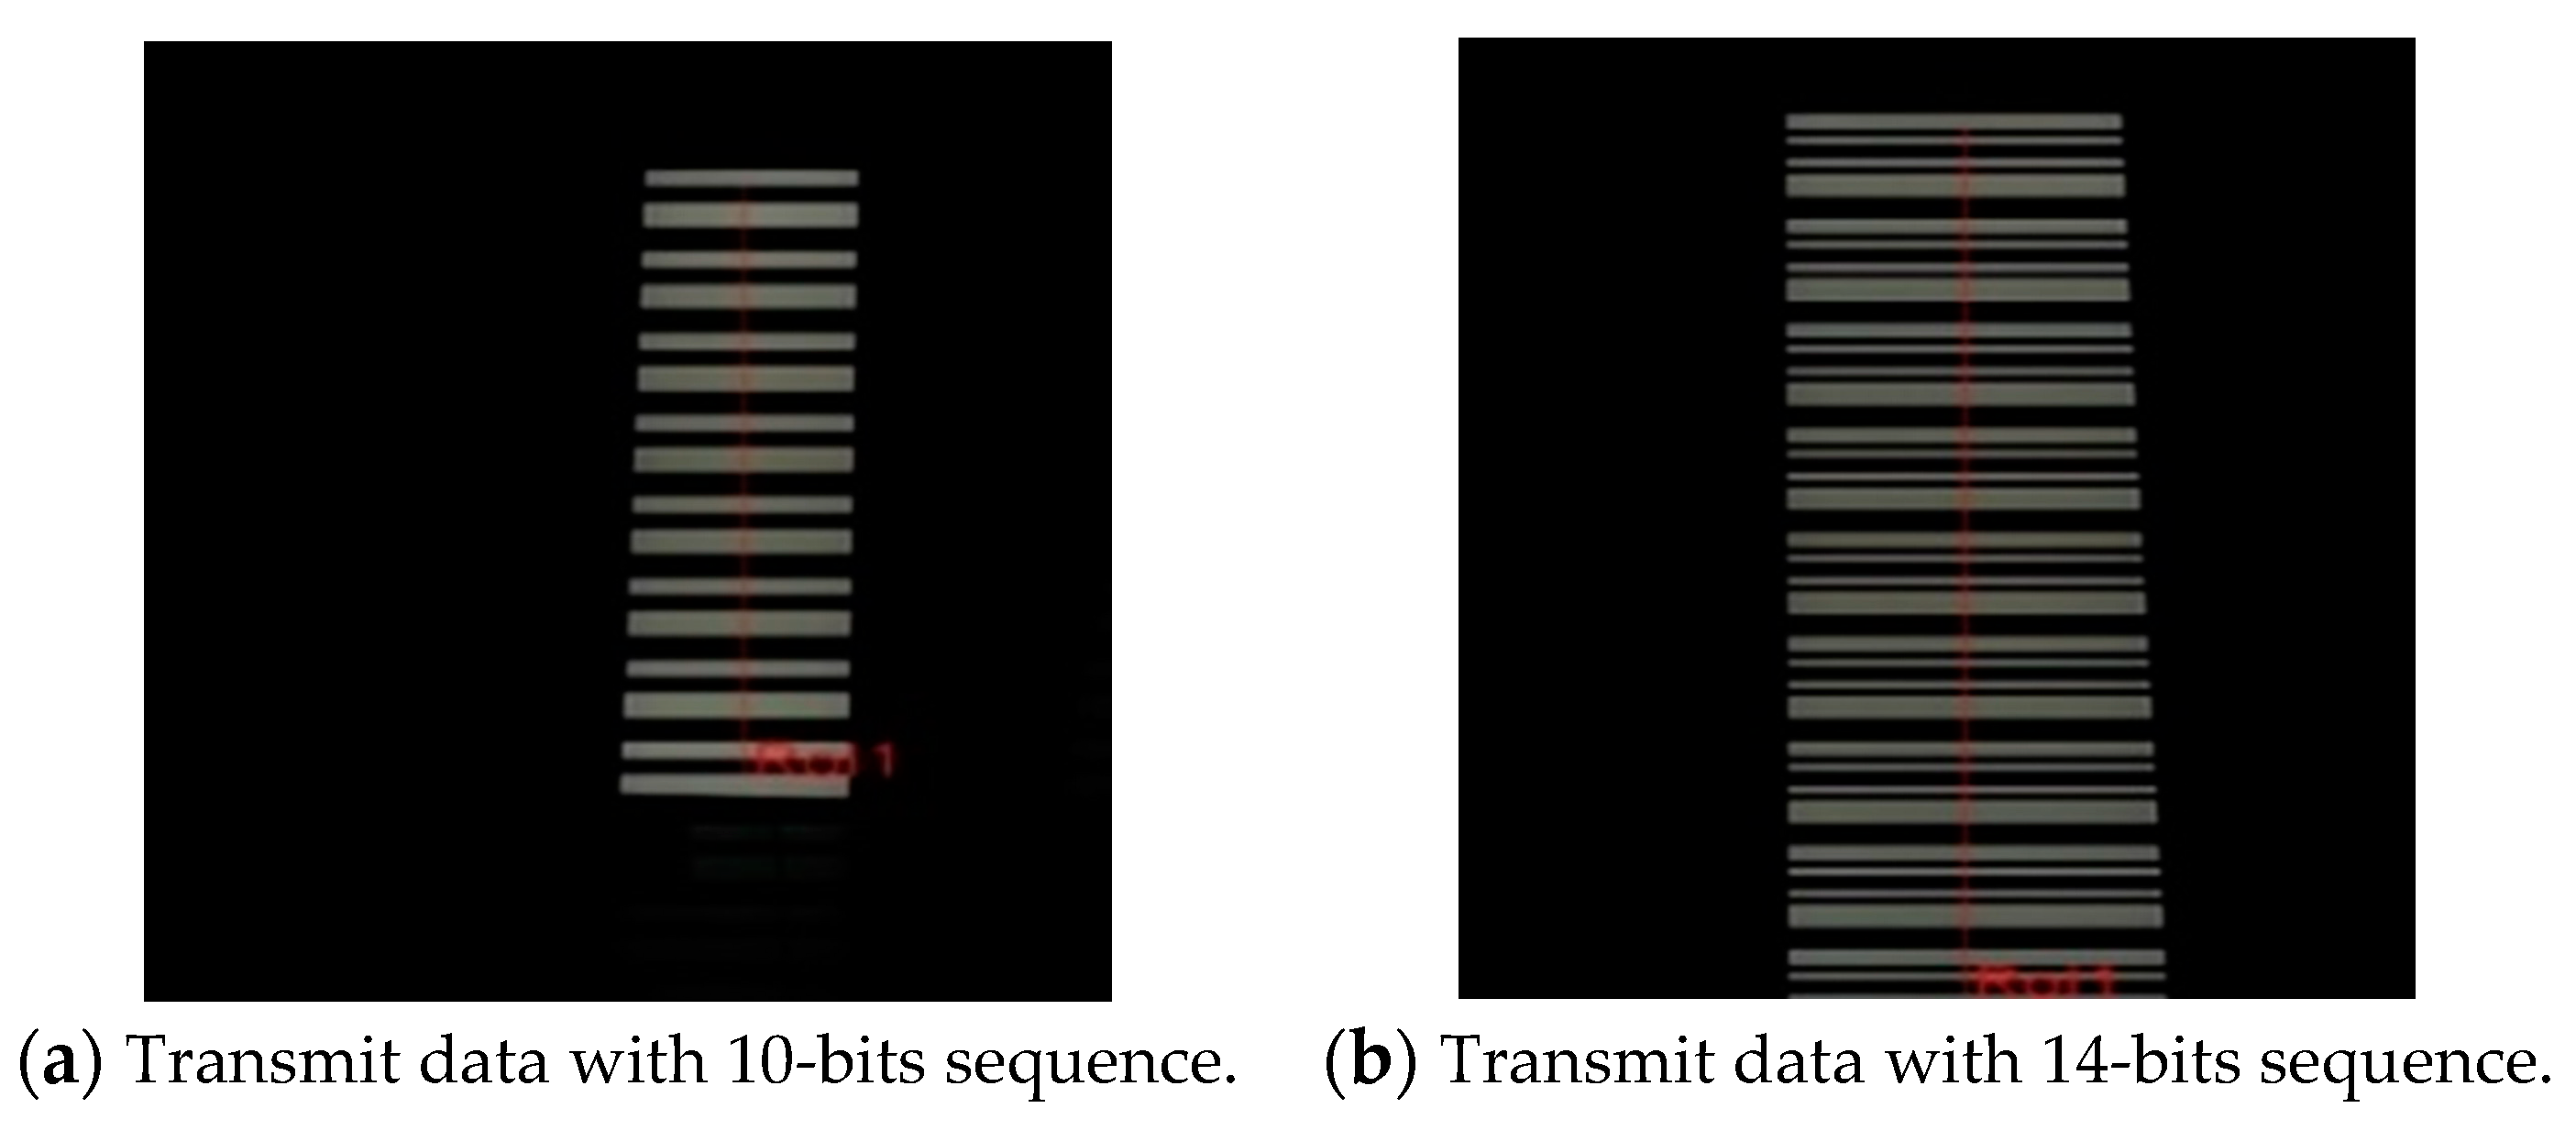
4.1.2. Transmitter Light-Emitting Diode Modulation
4.2. Receiver Section
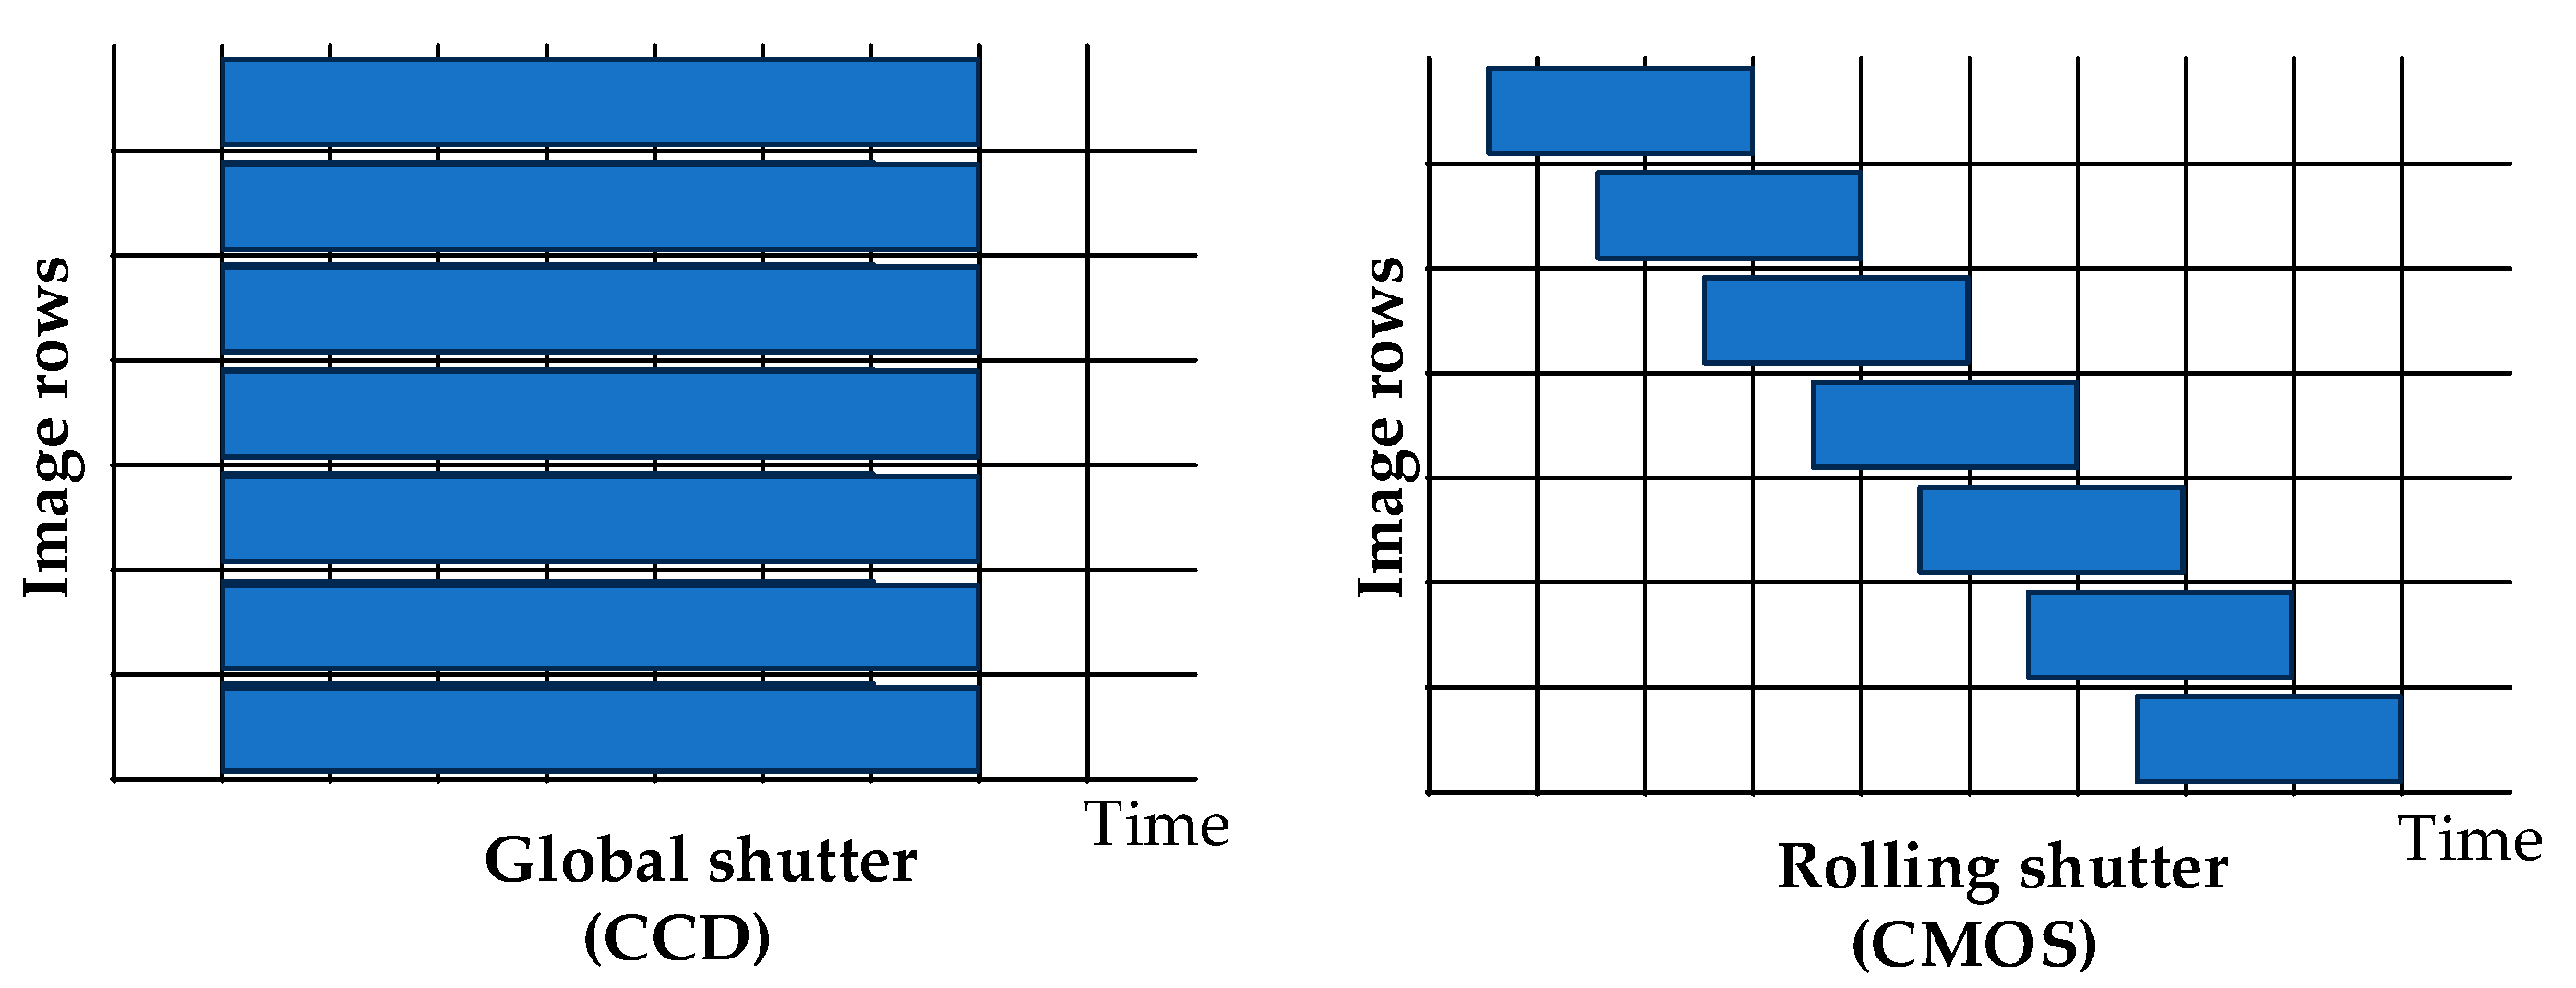
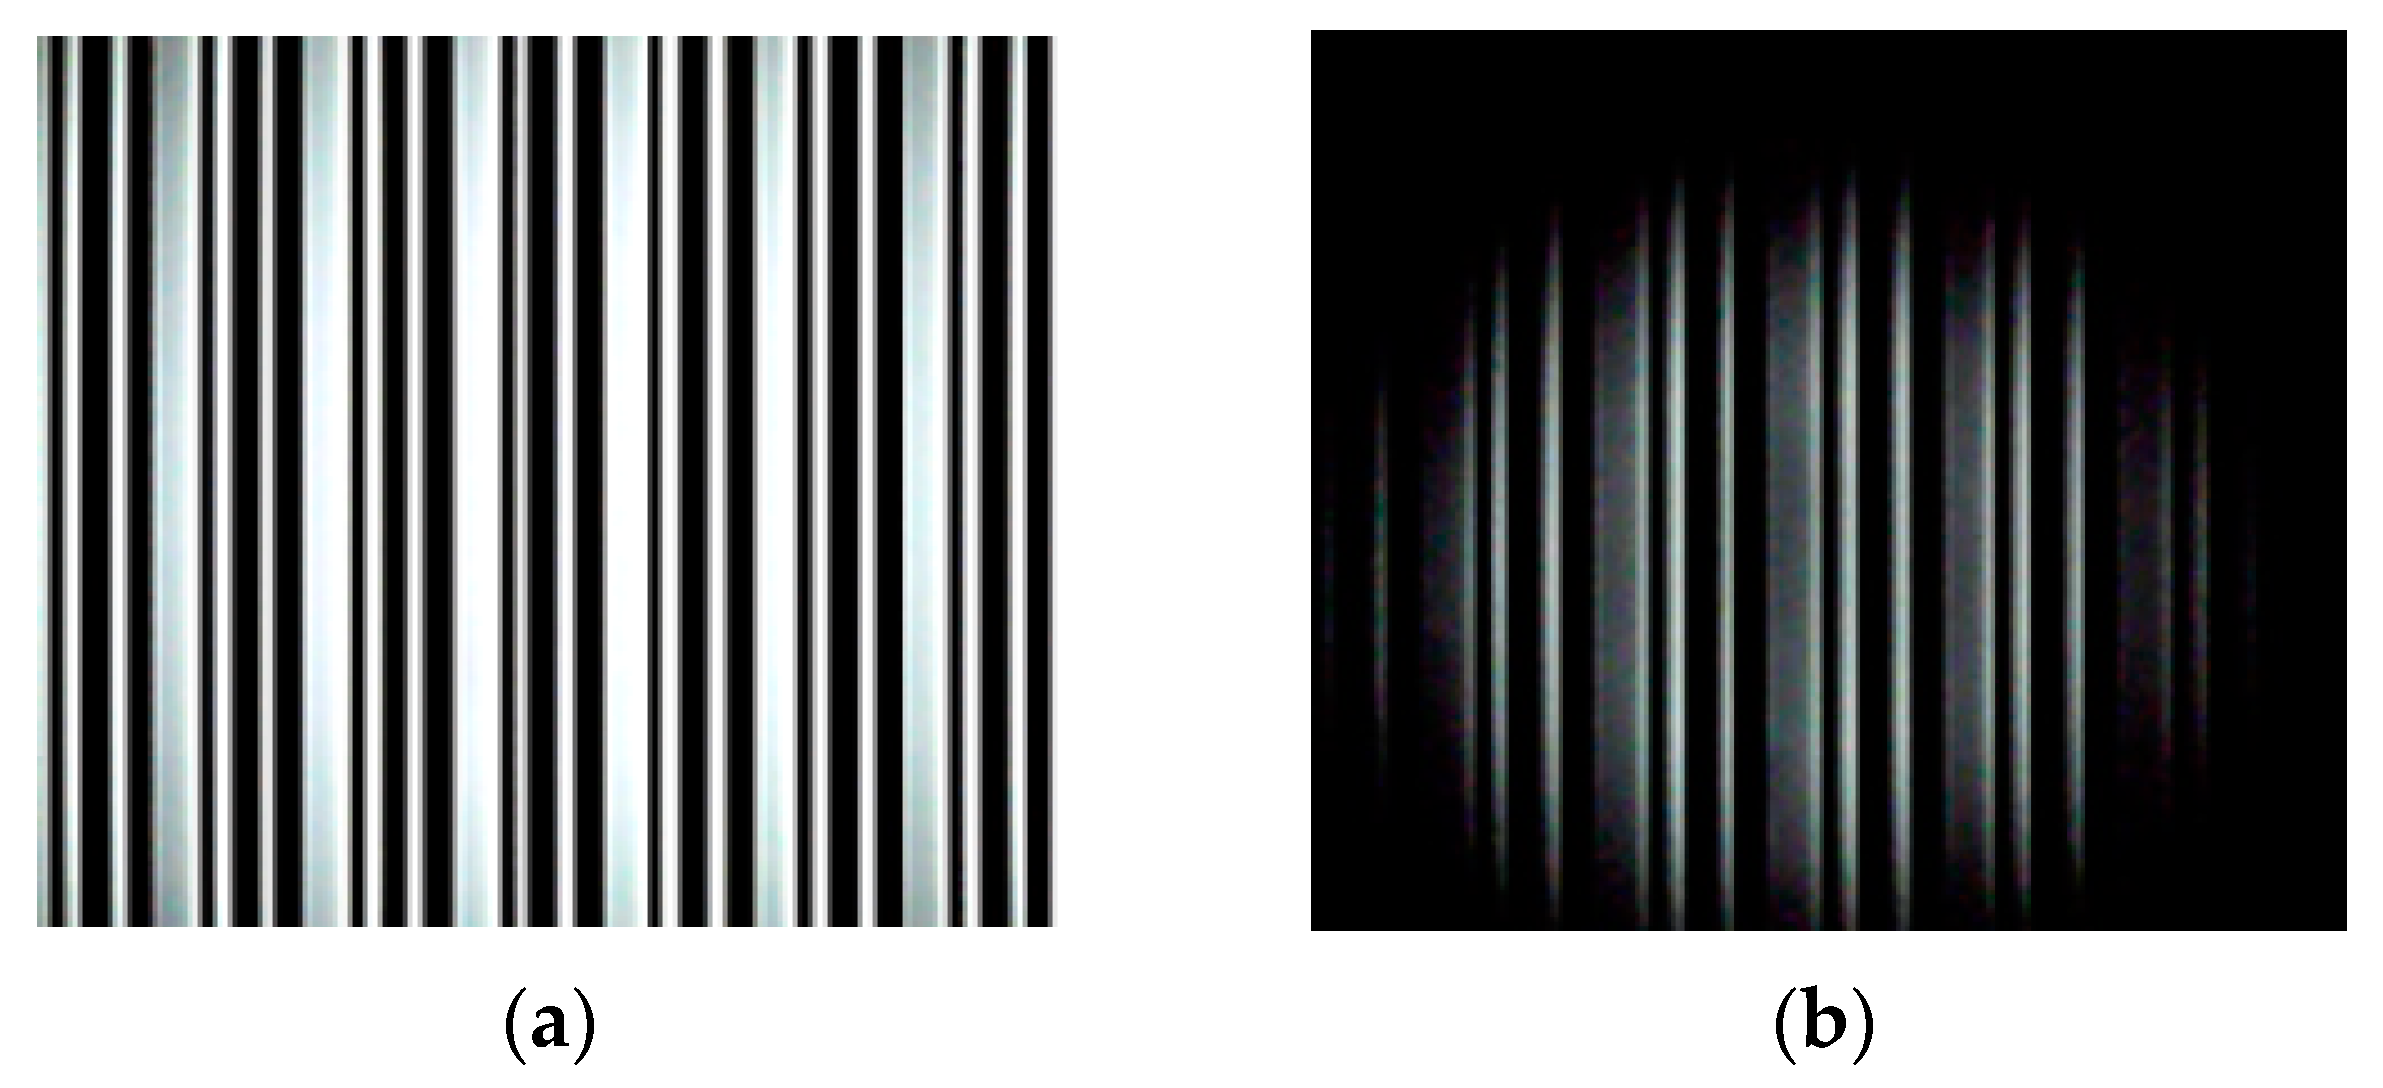
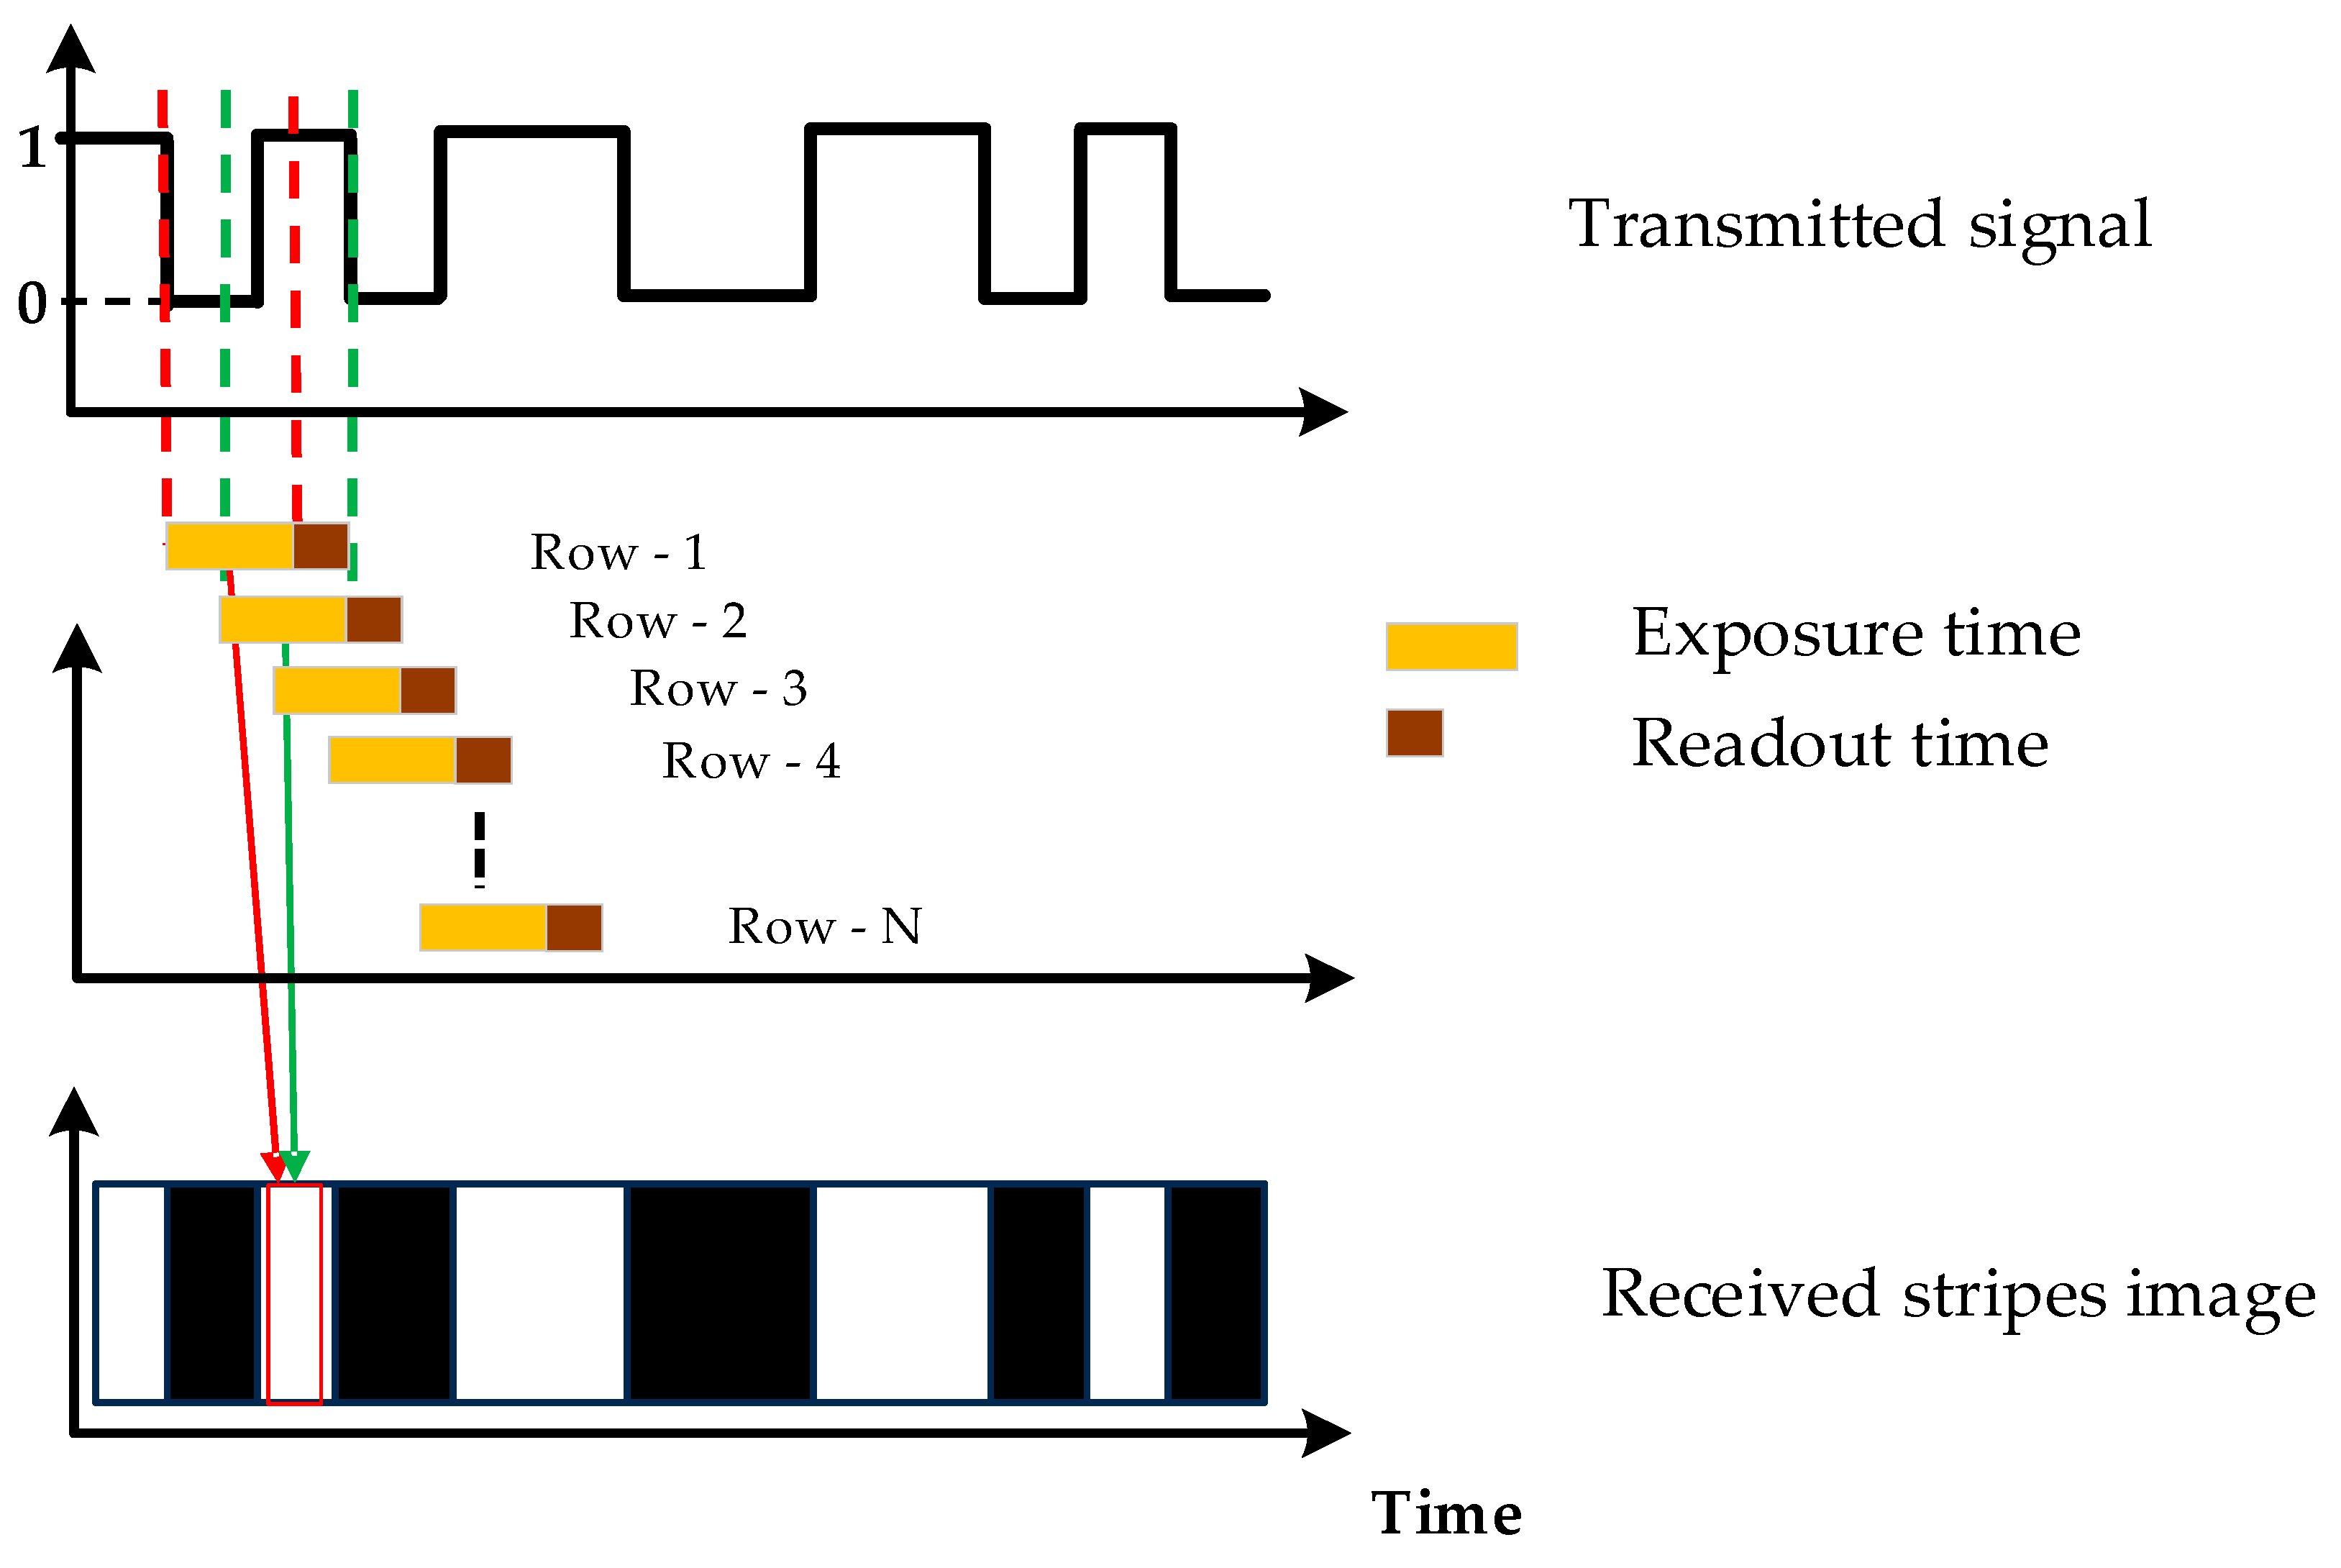
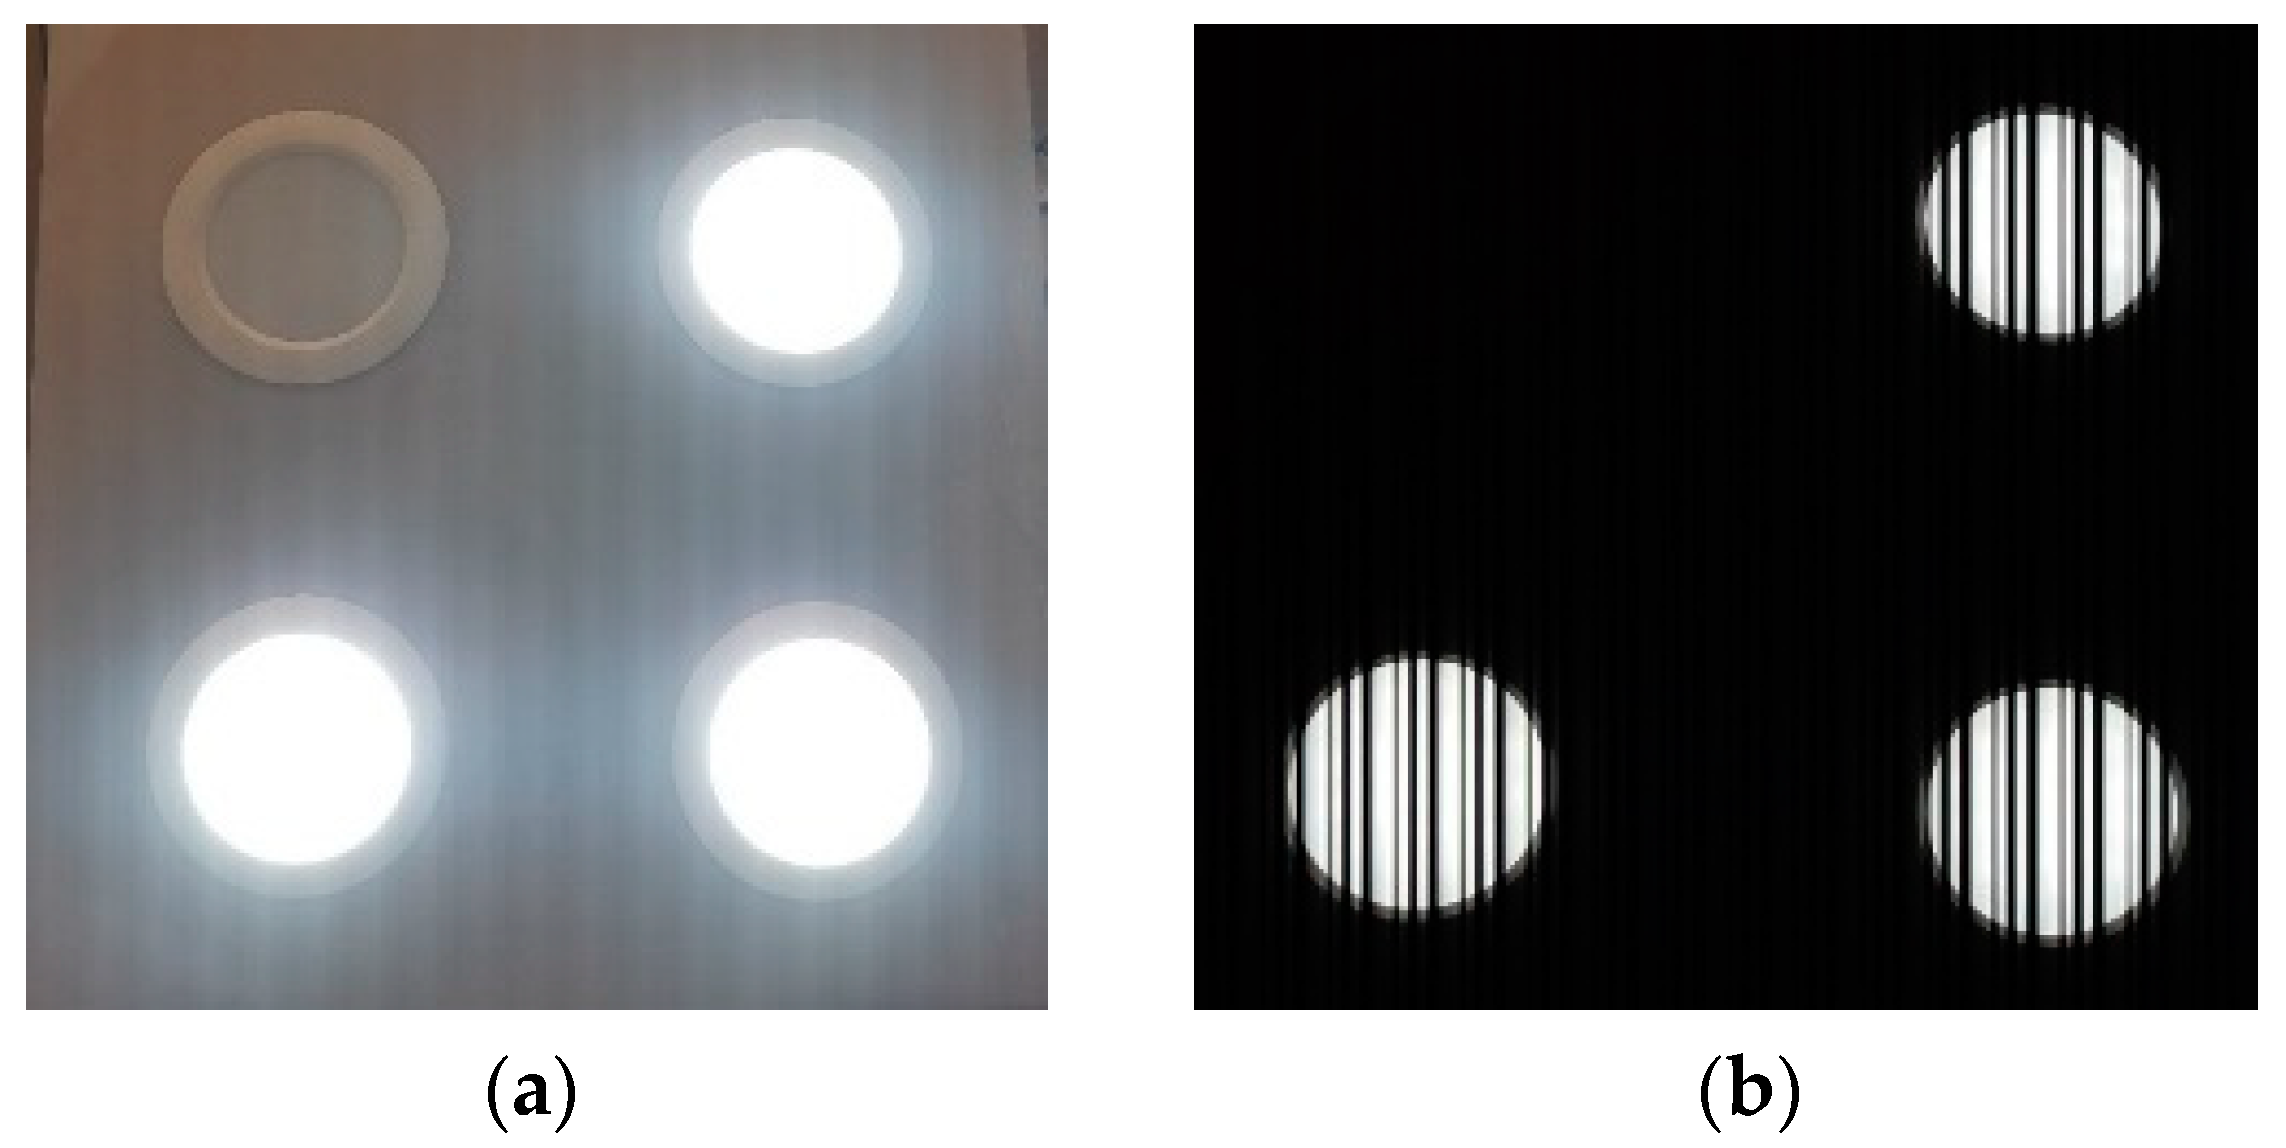
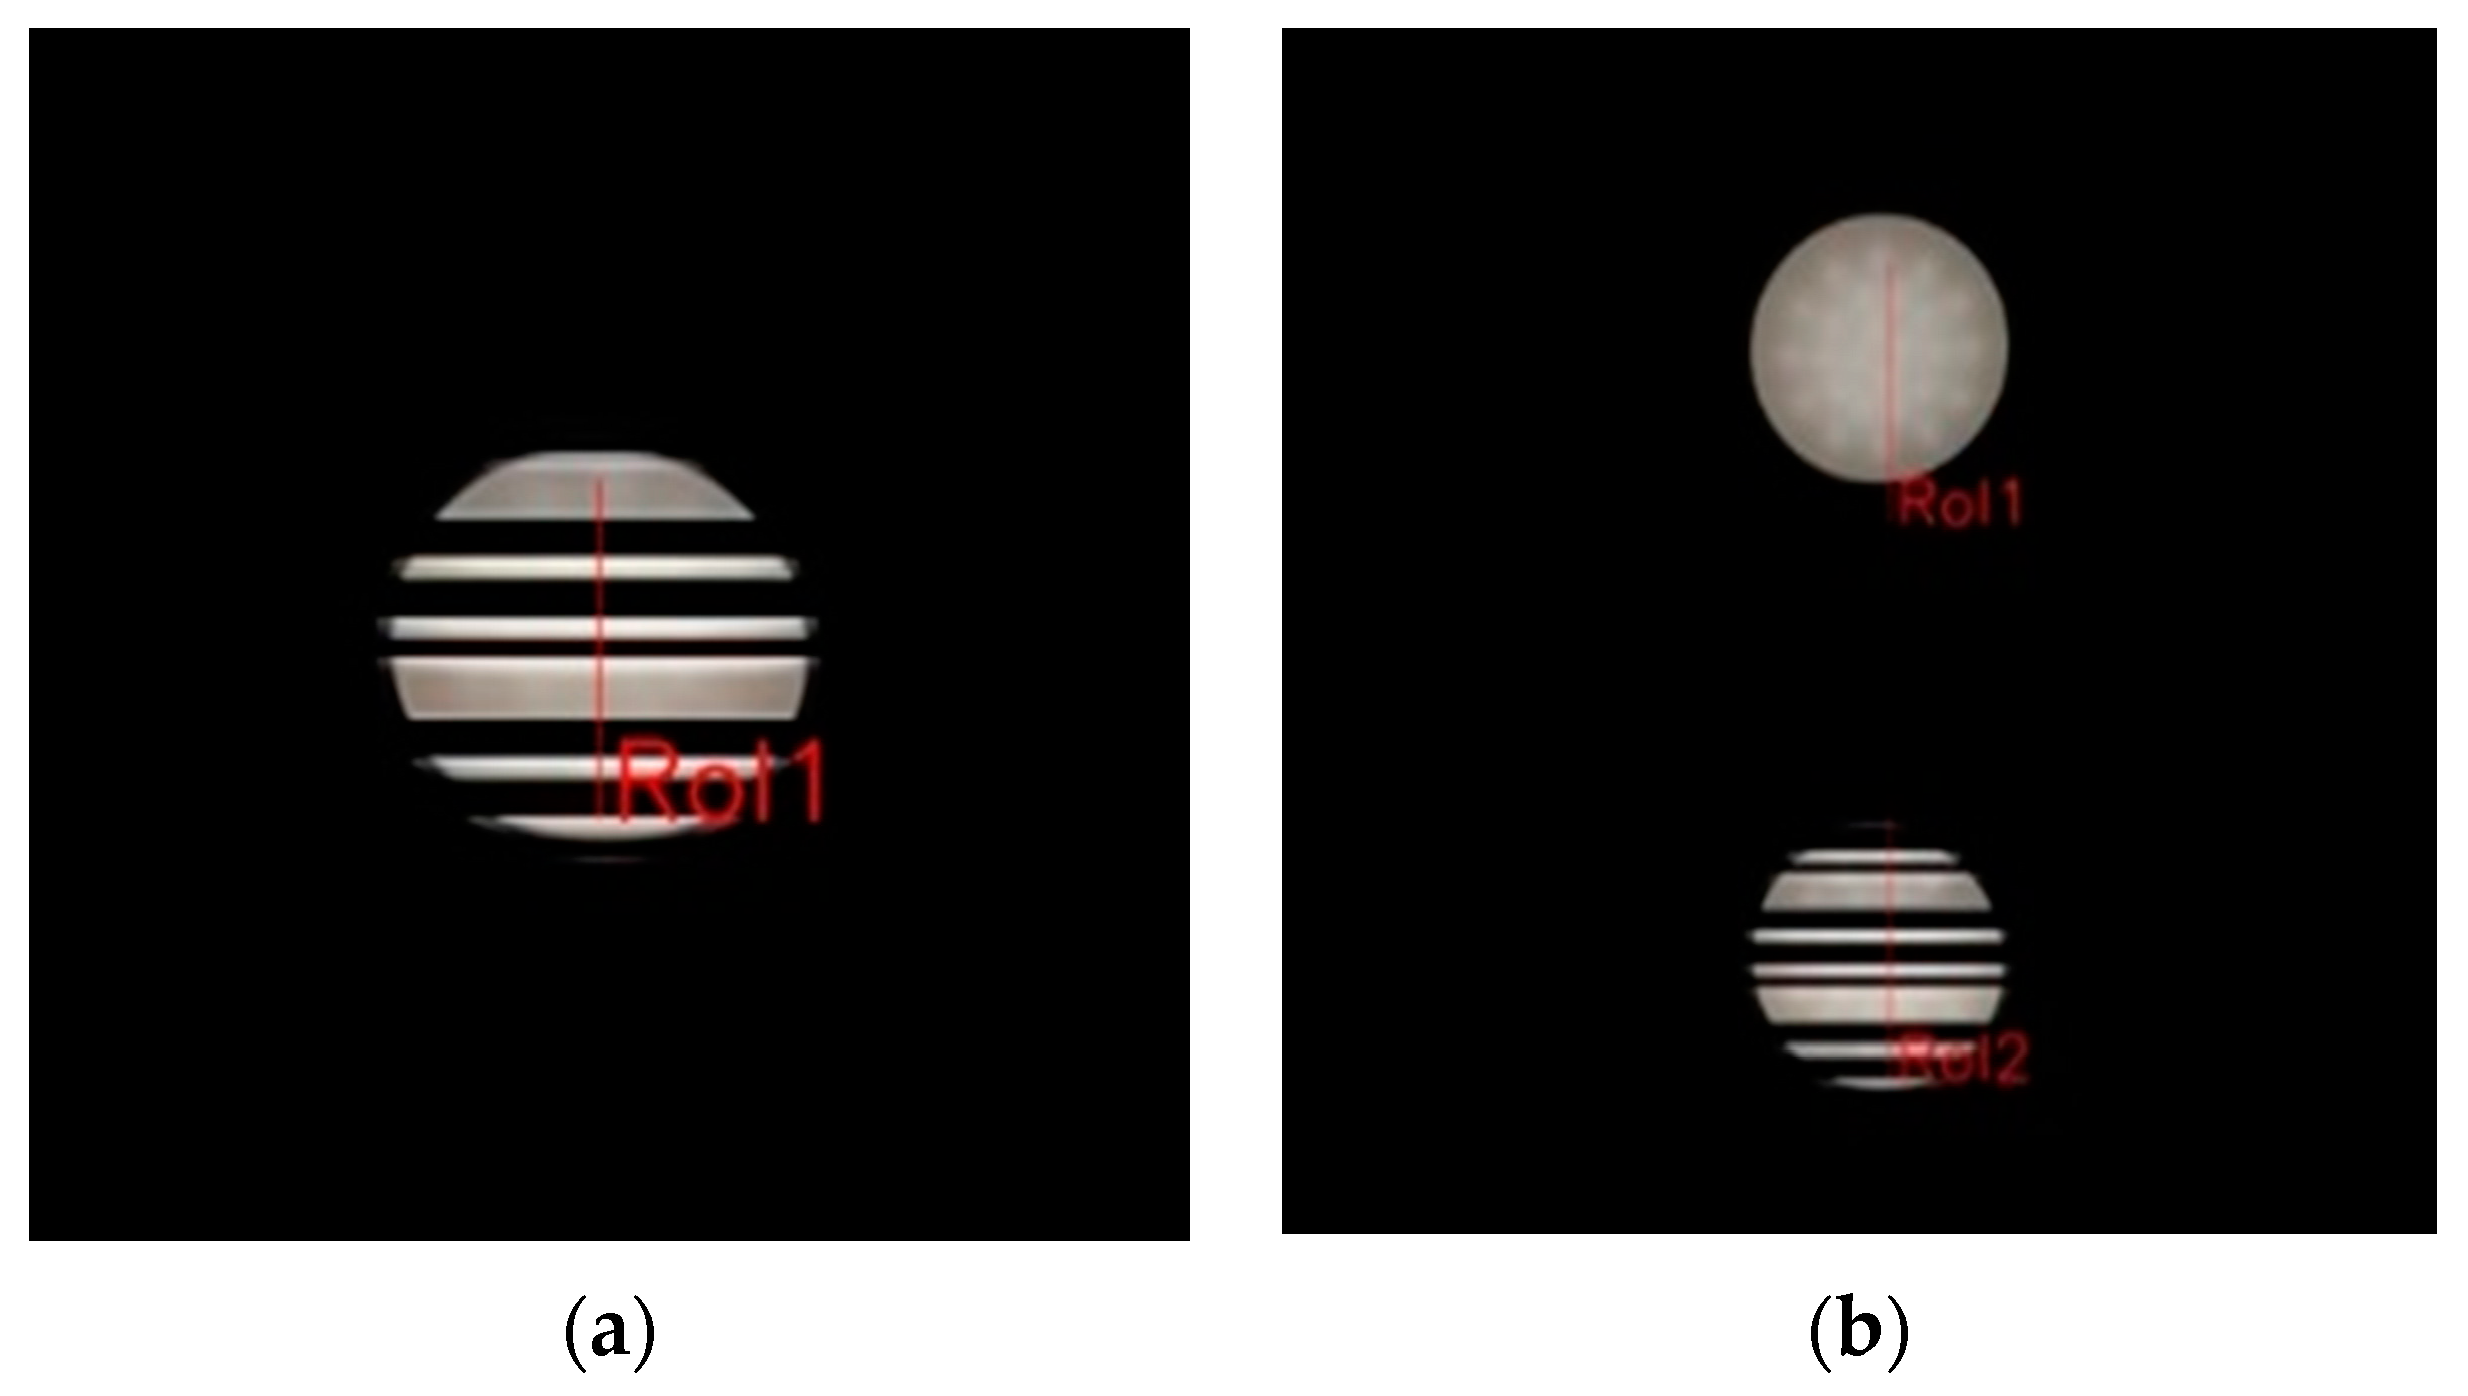
4.2.1. Smartphone CMOS Image Sensor’s Rolling Shutter Operation
4.2.2. Impact of Camera Parameters
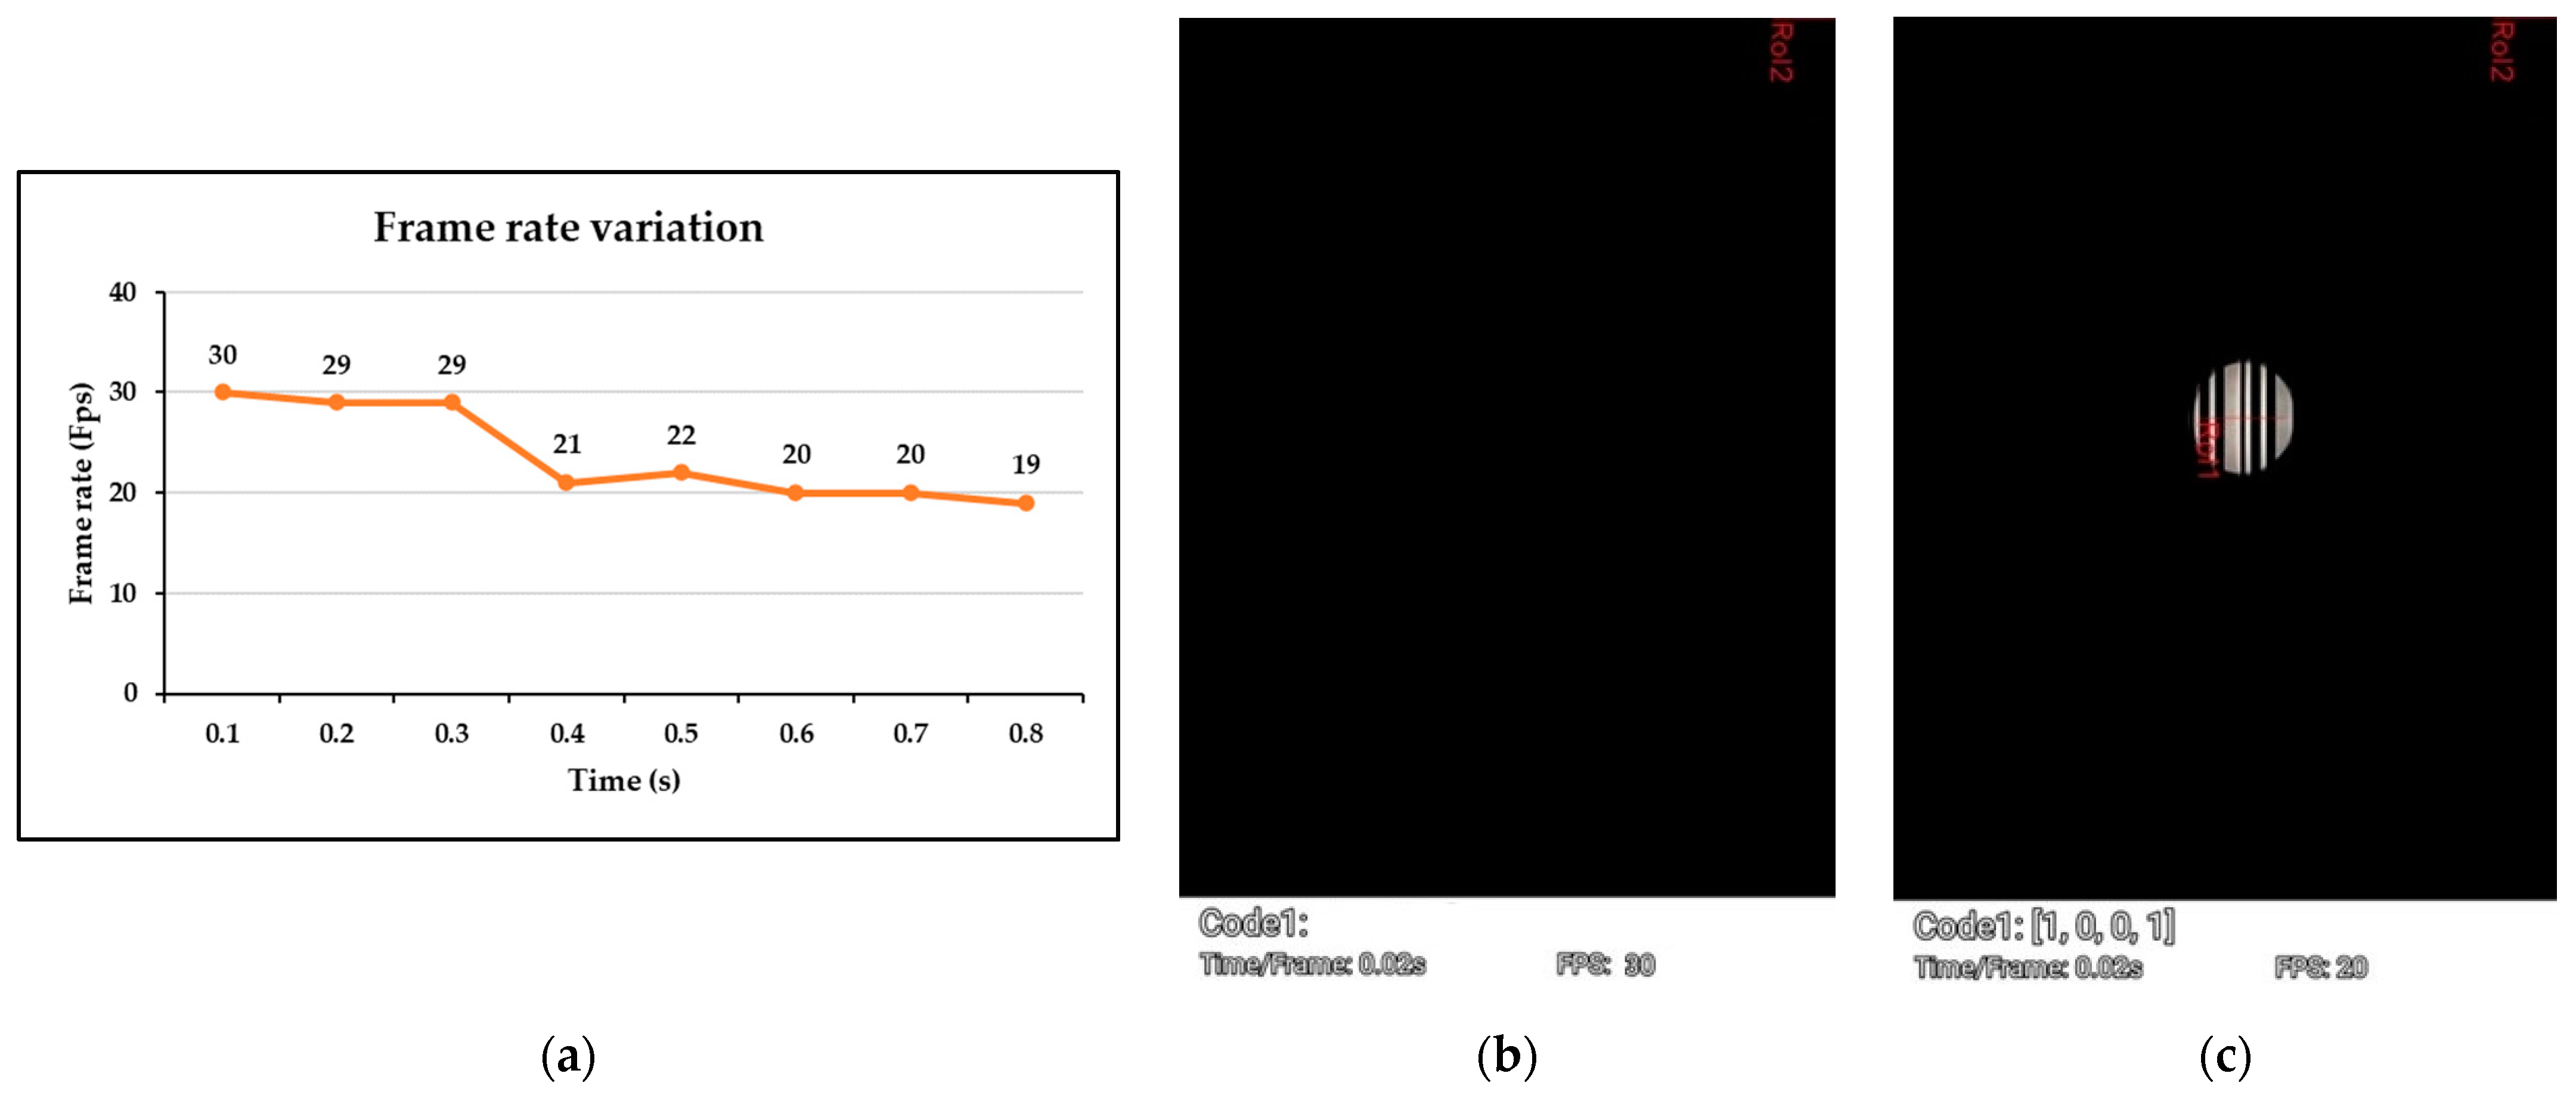
- Frame rate
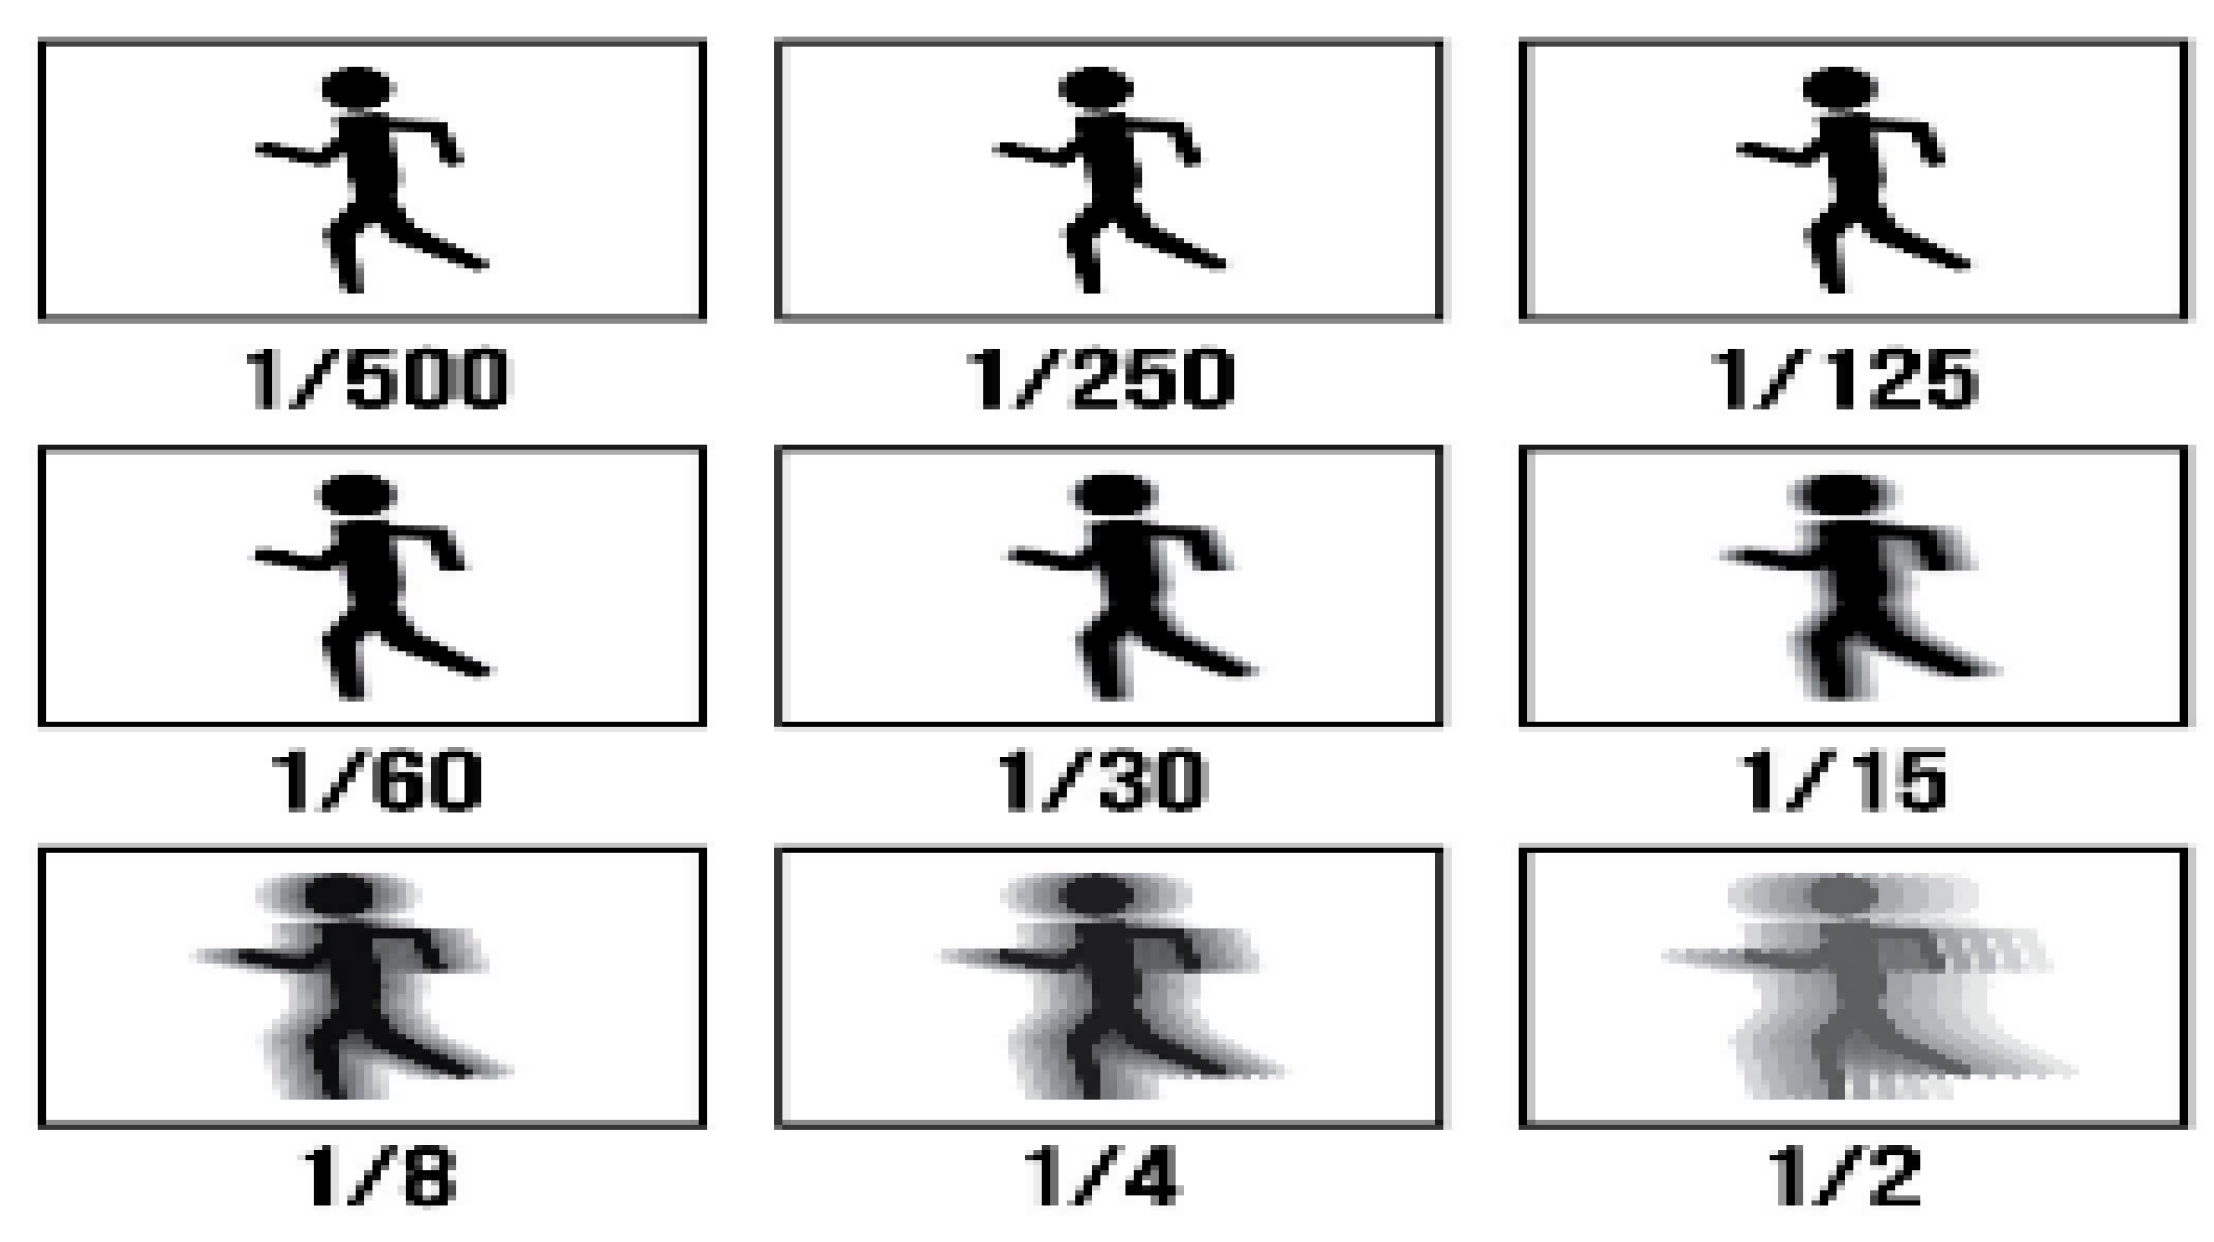
- Shutter speed
- Rolling rate
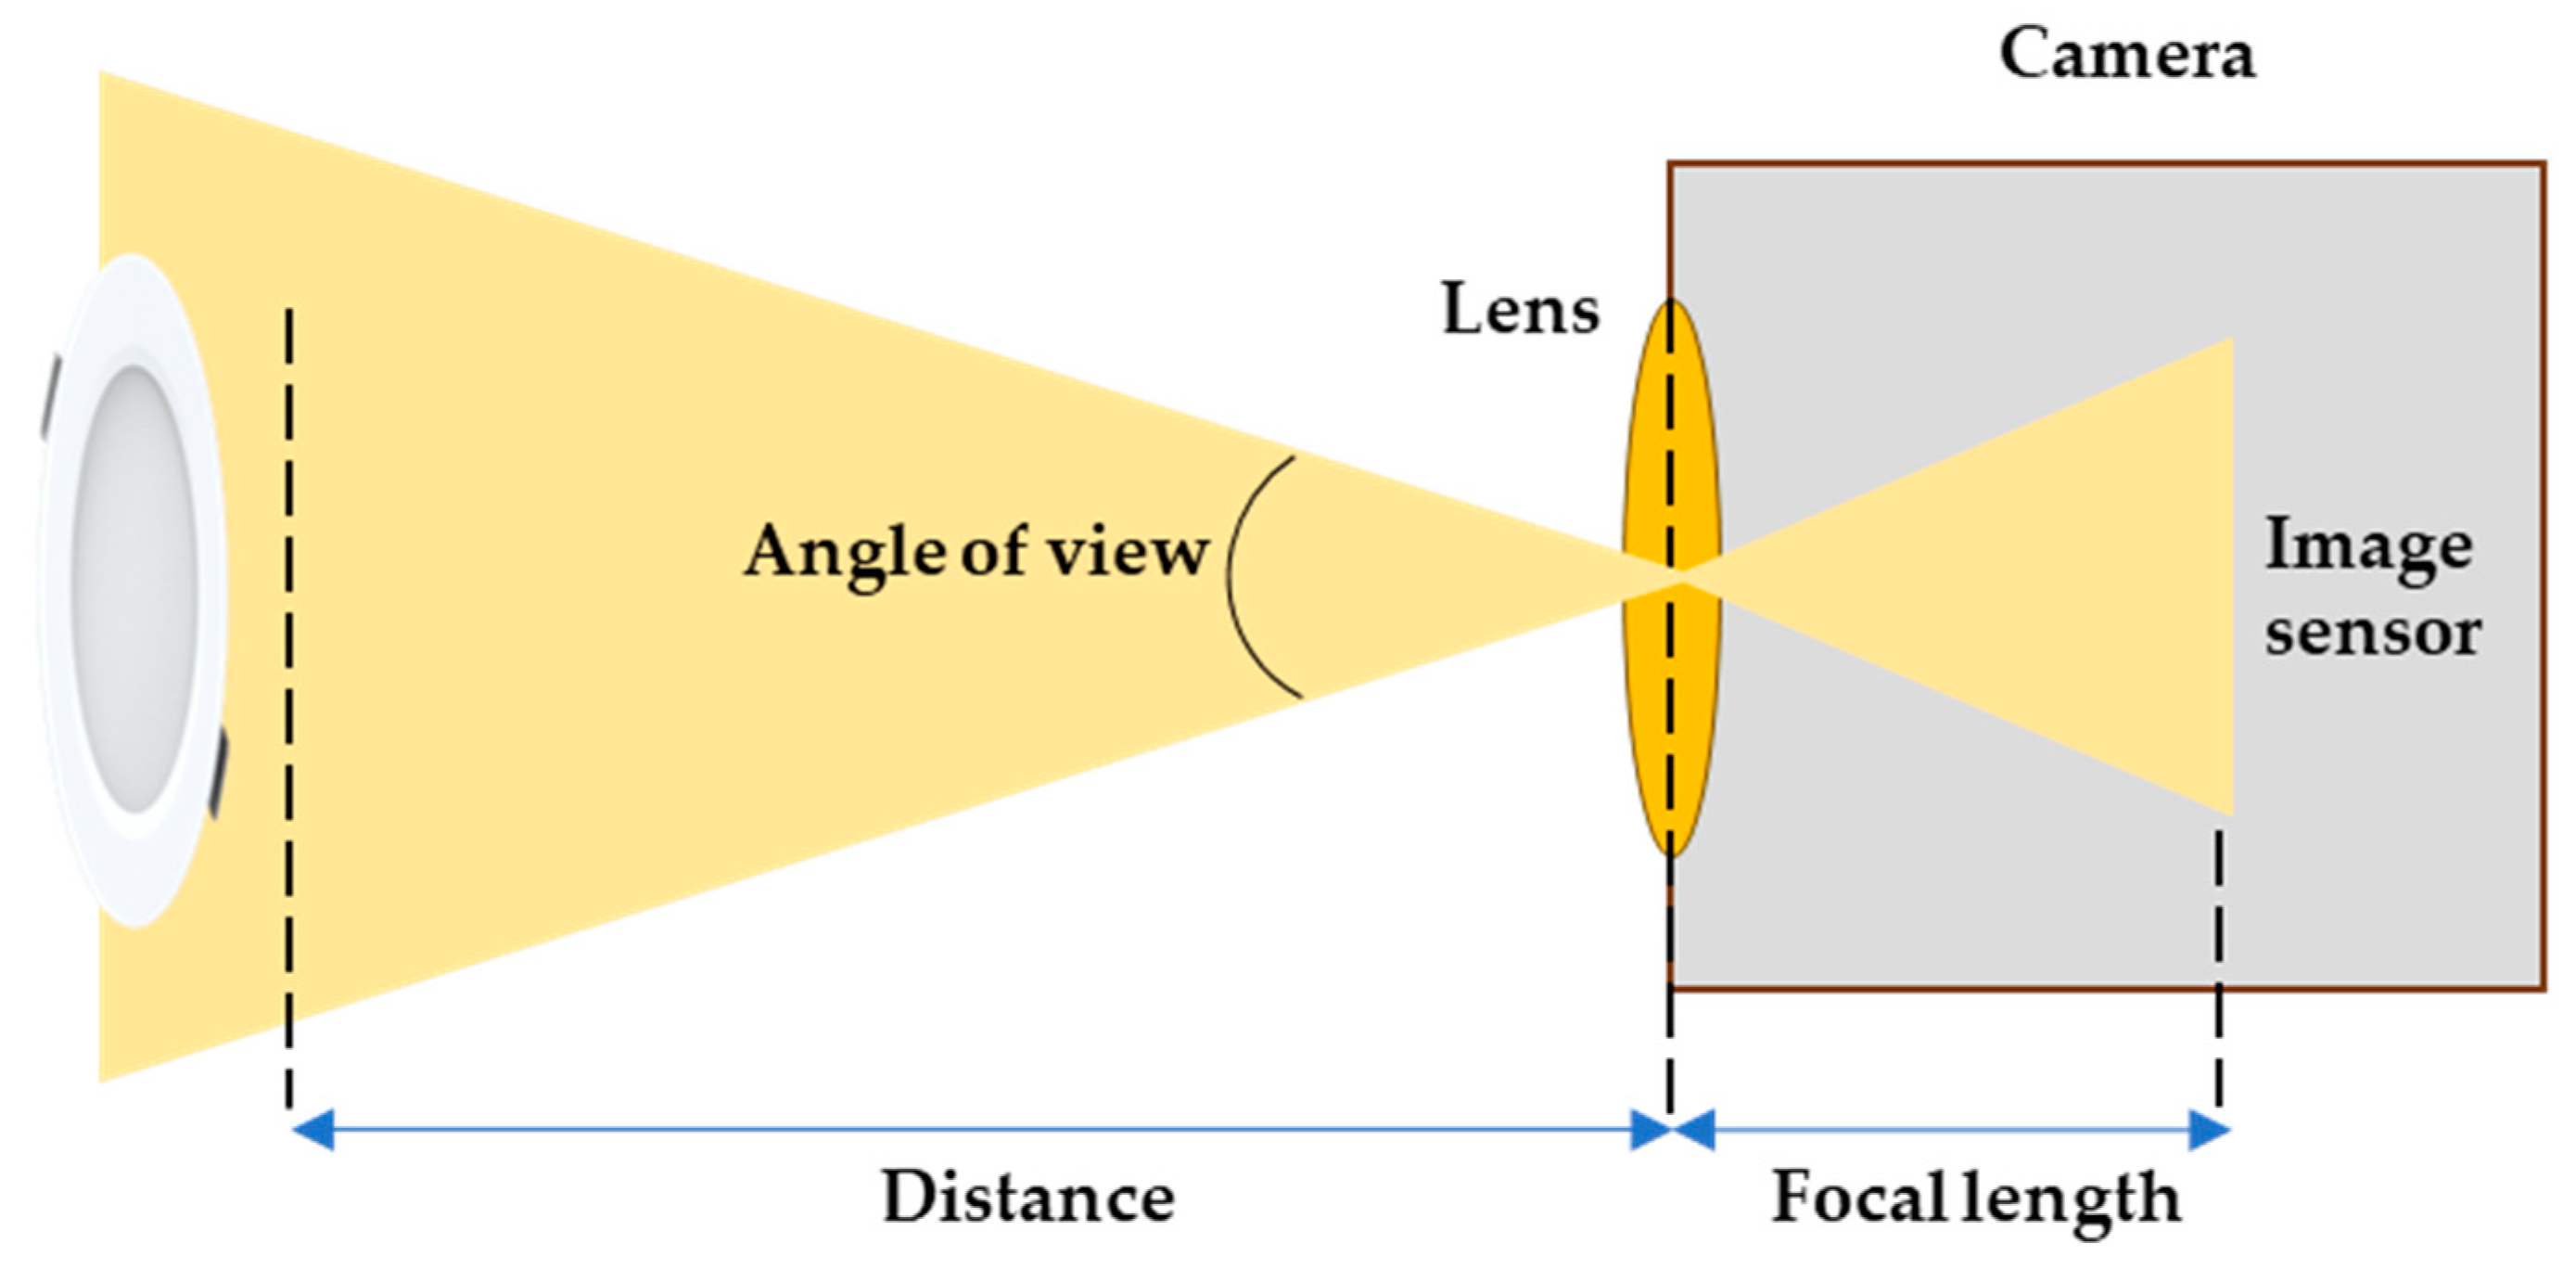
- Focal length
4.2.3. Smartphone Receiver
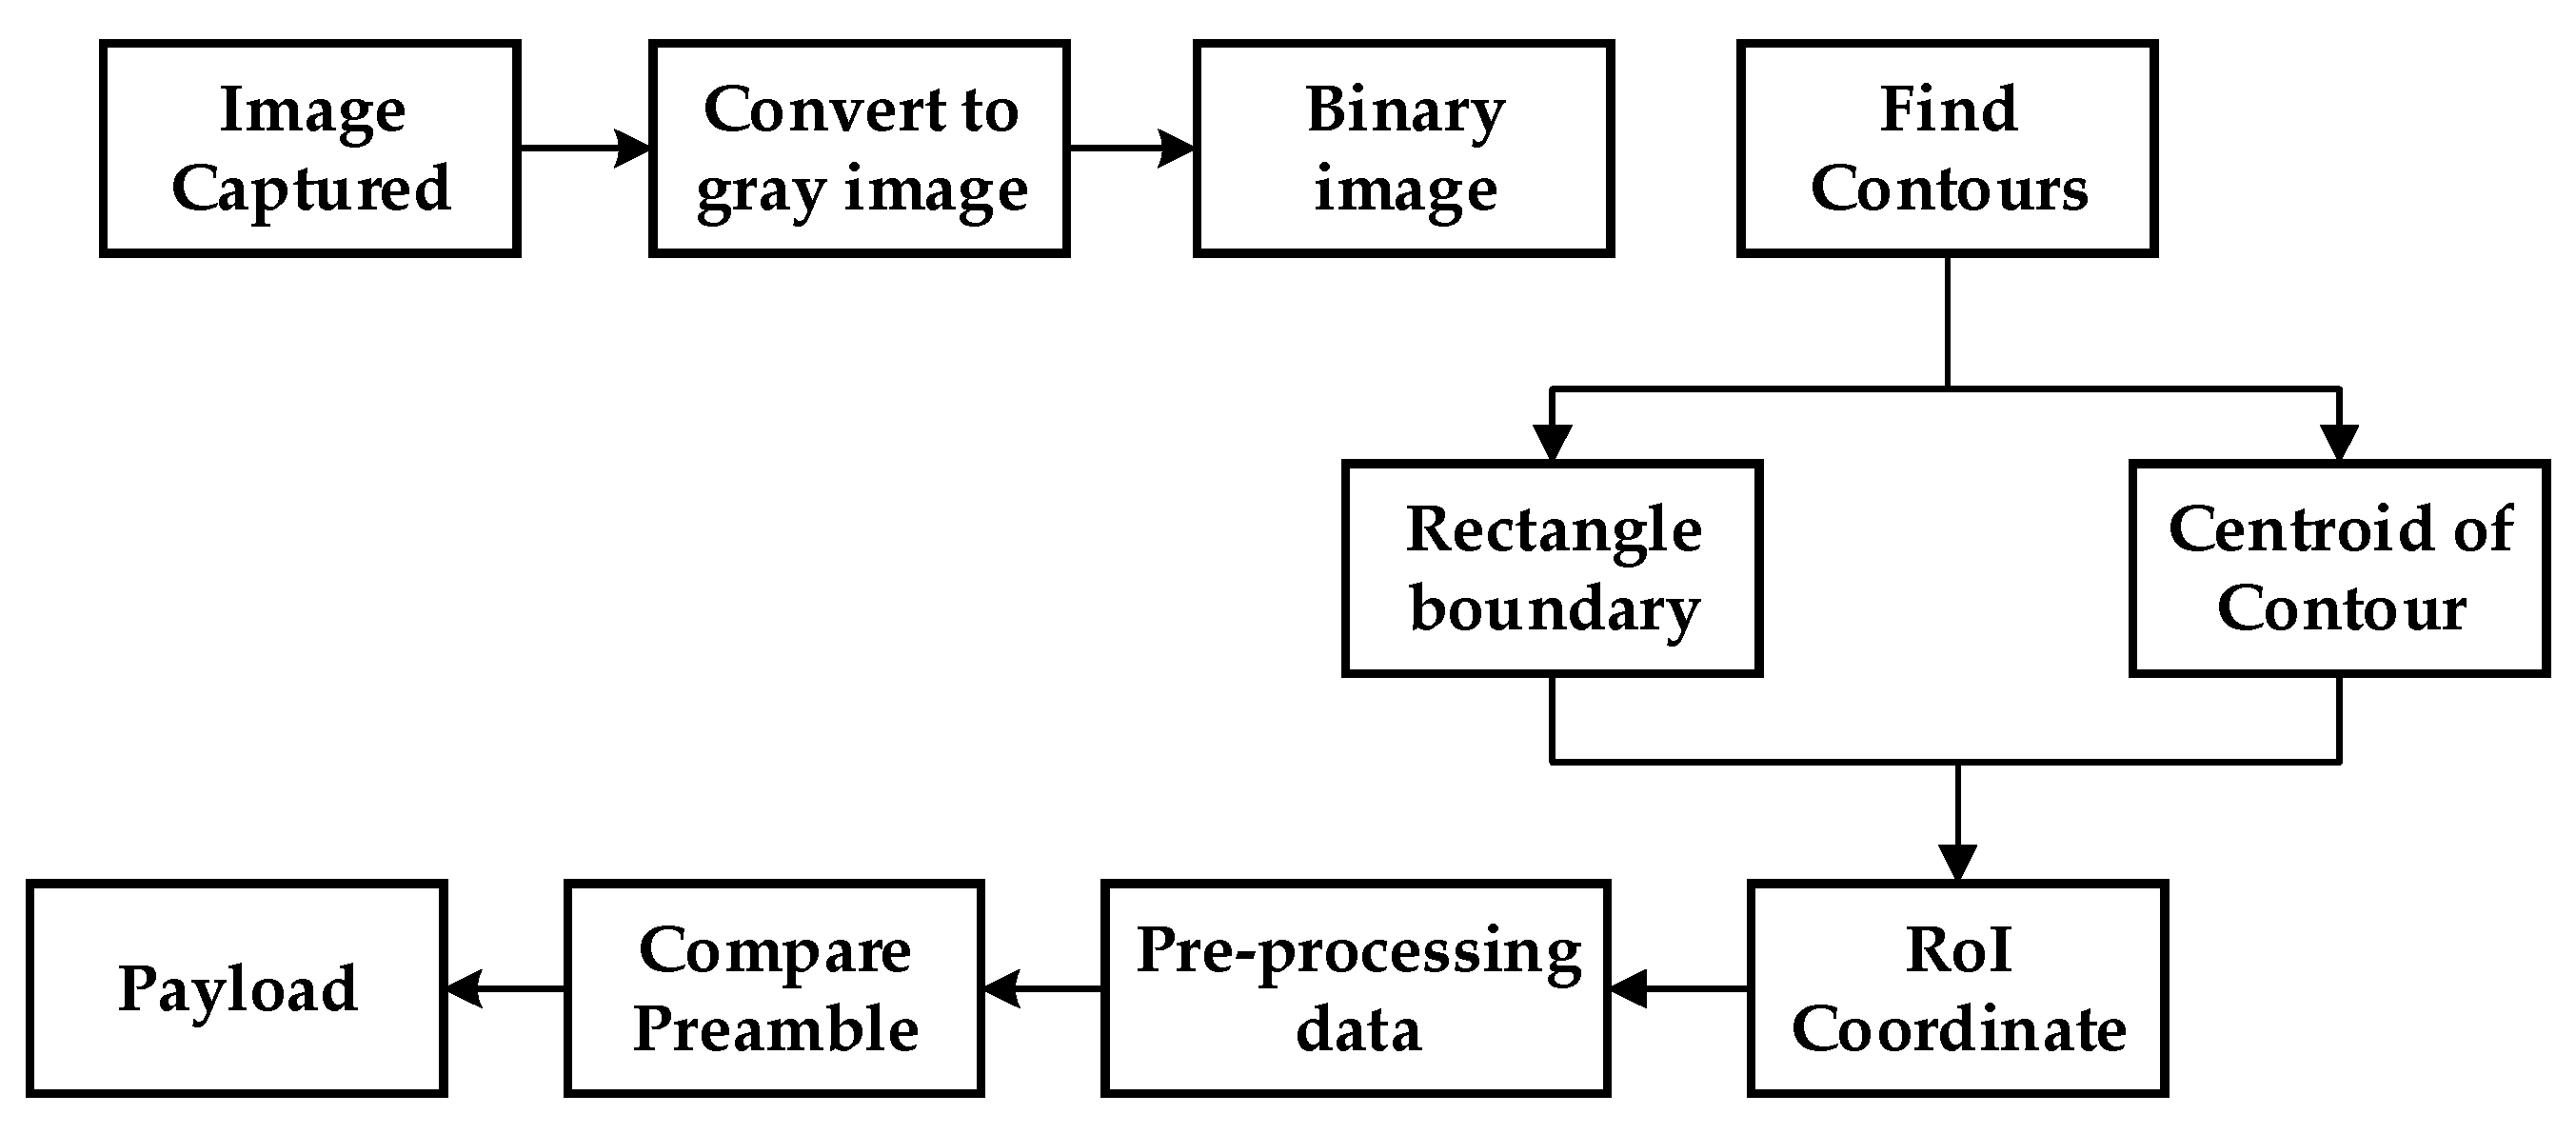
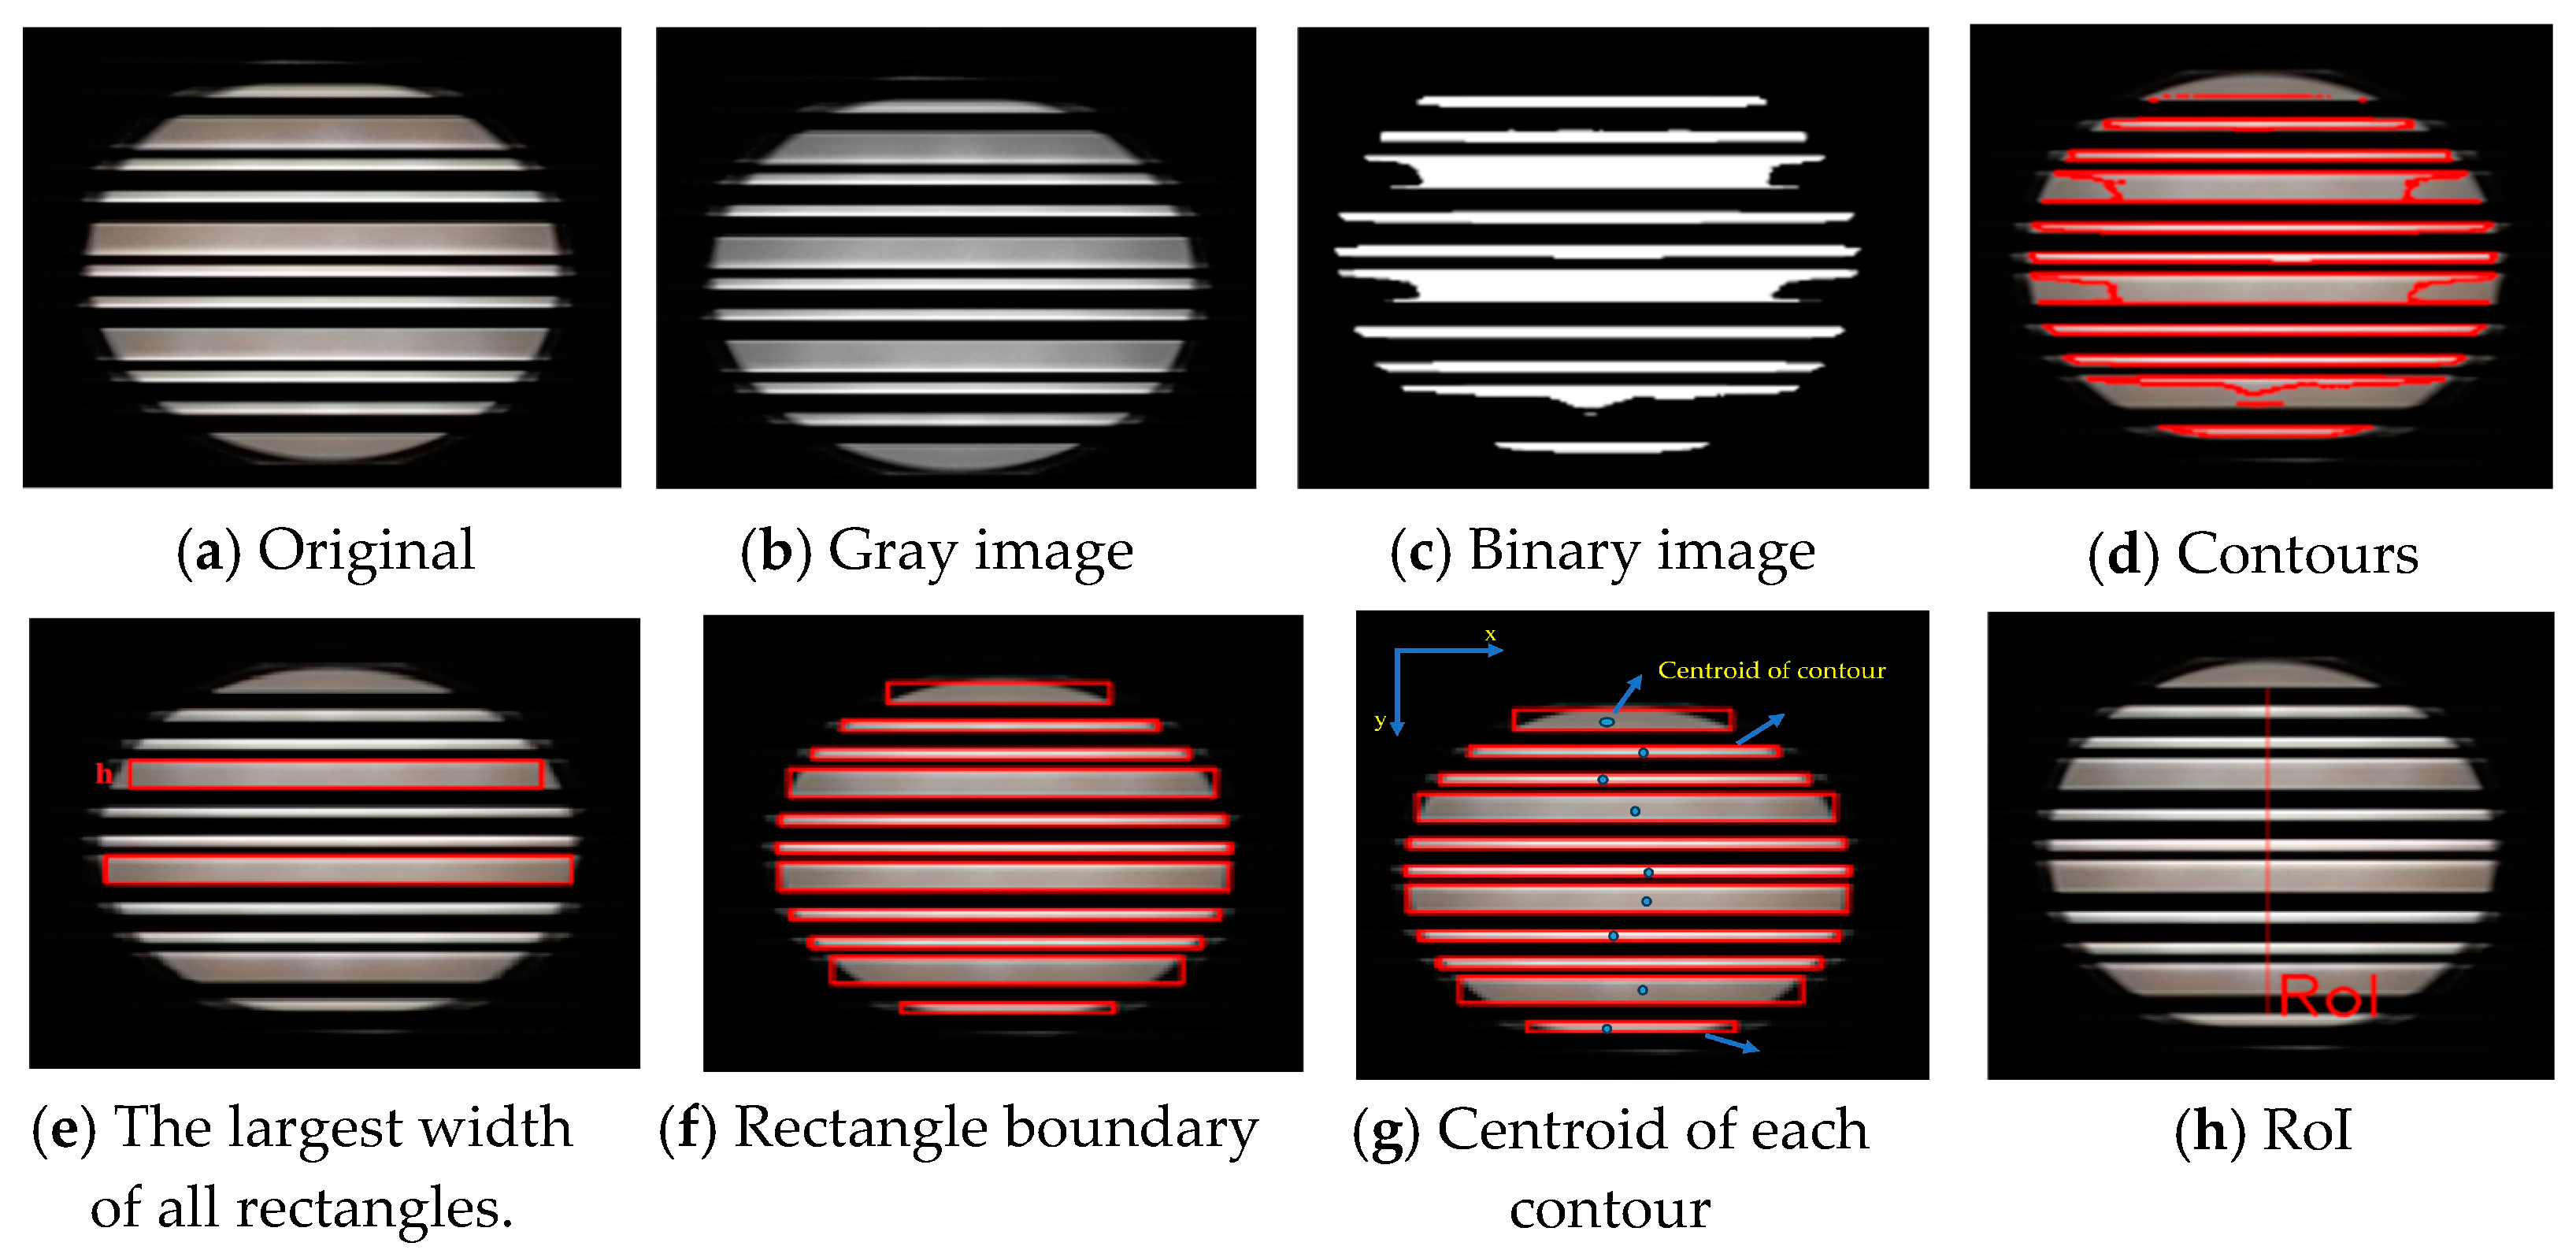
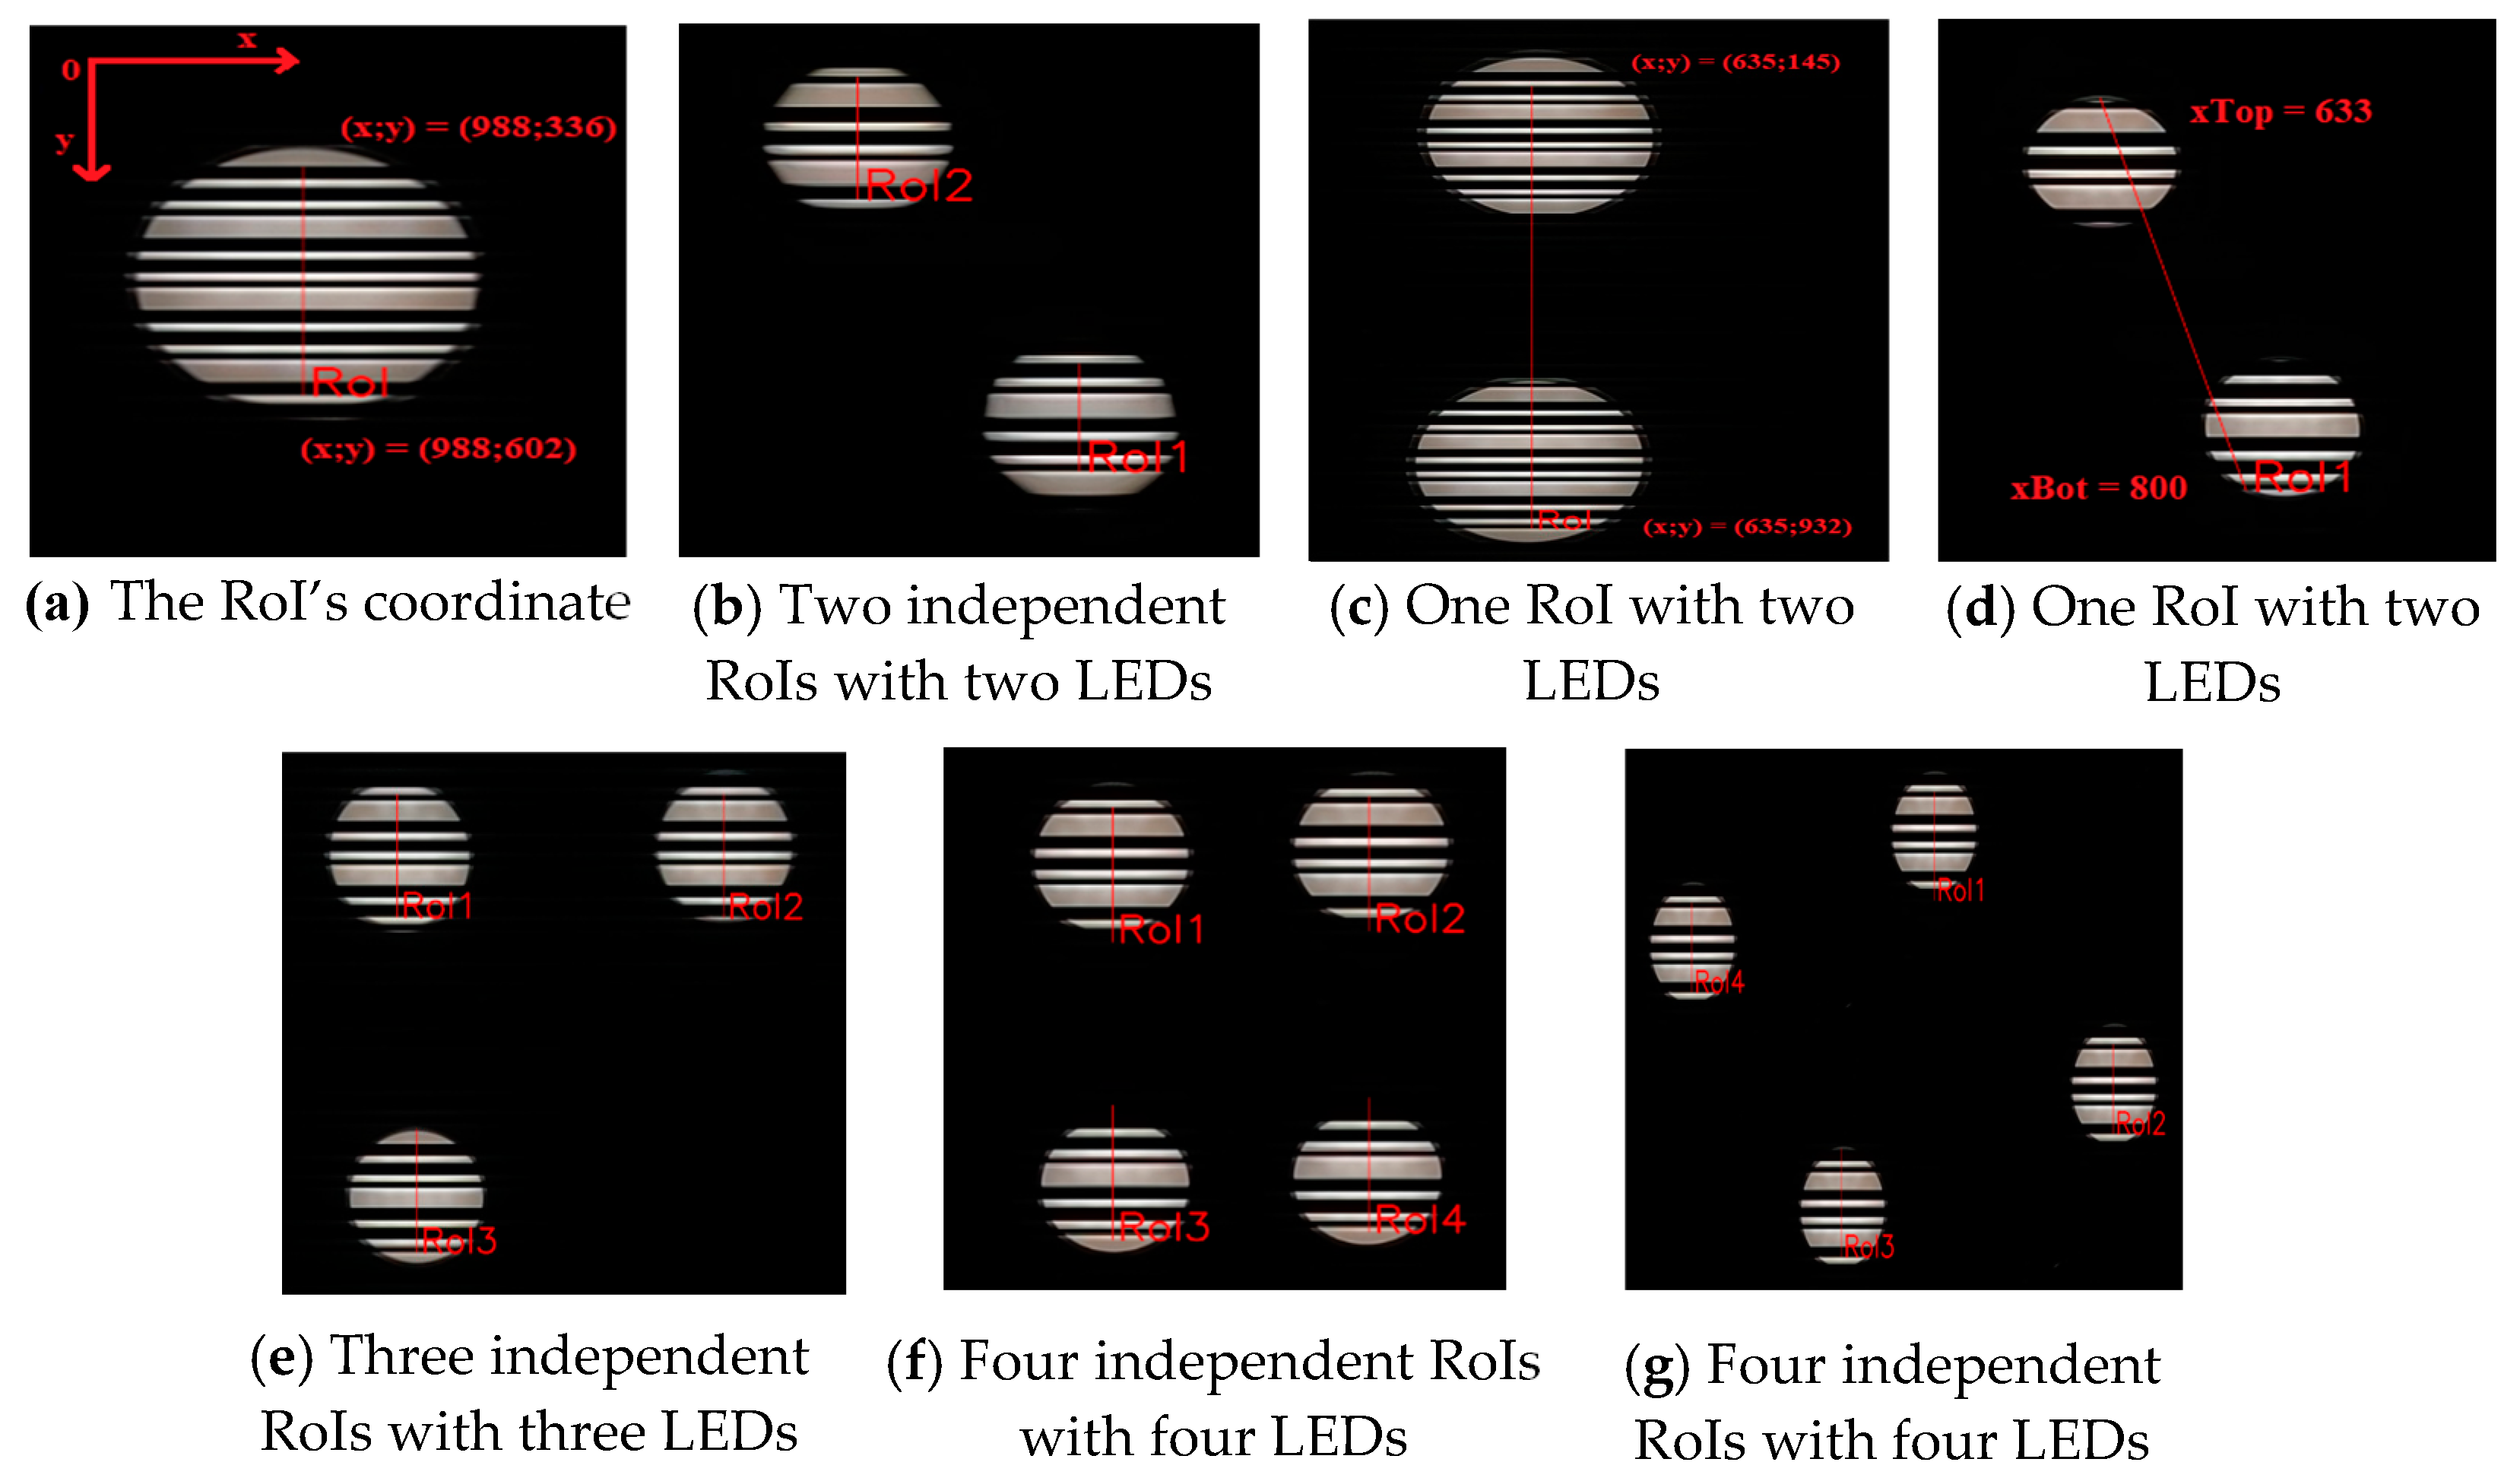
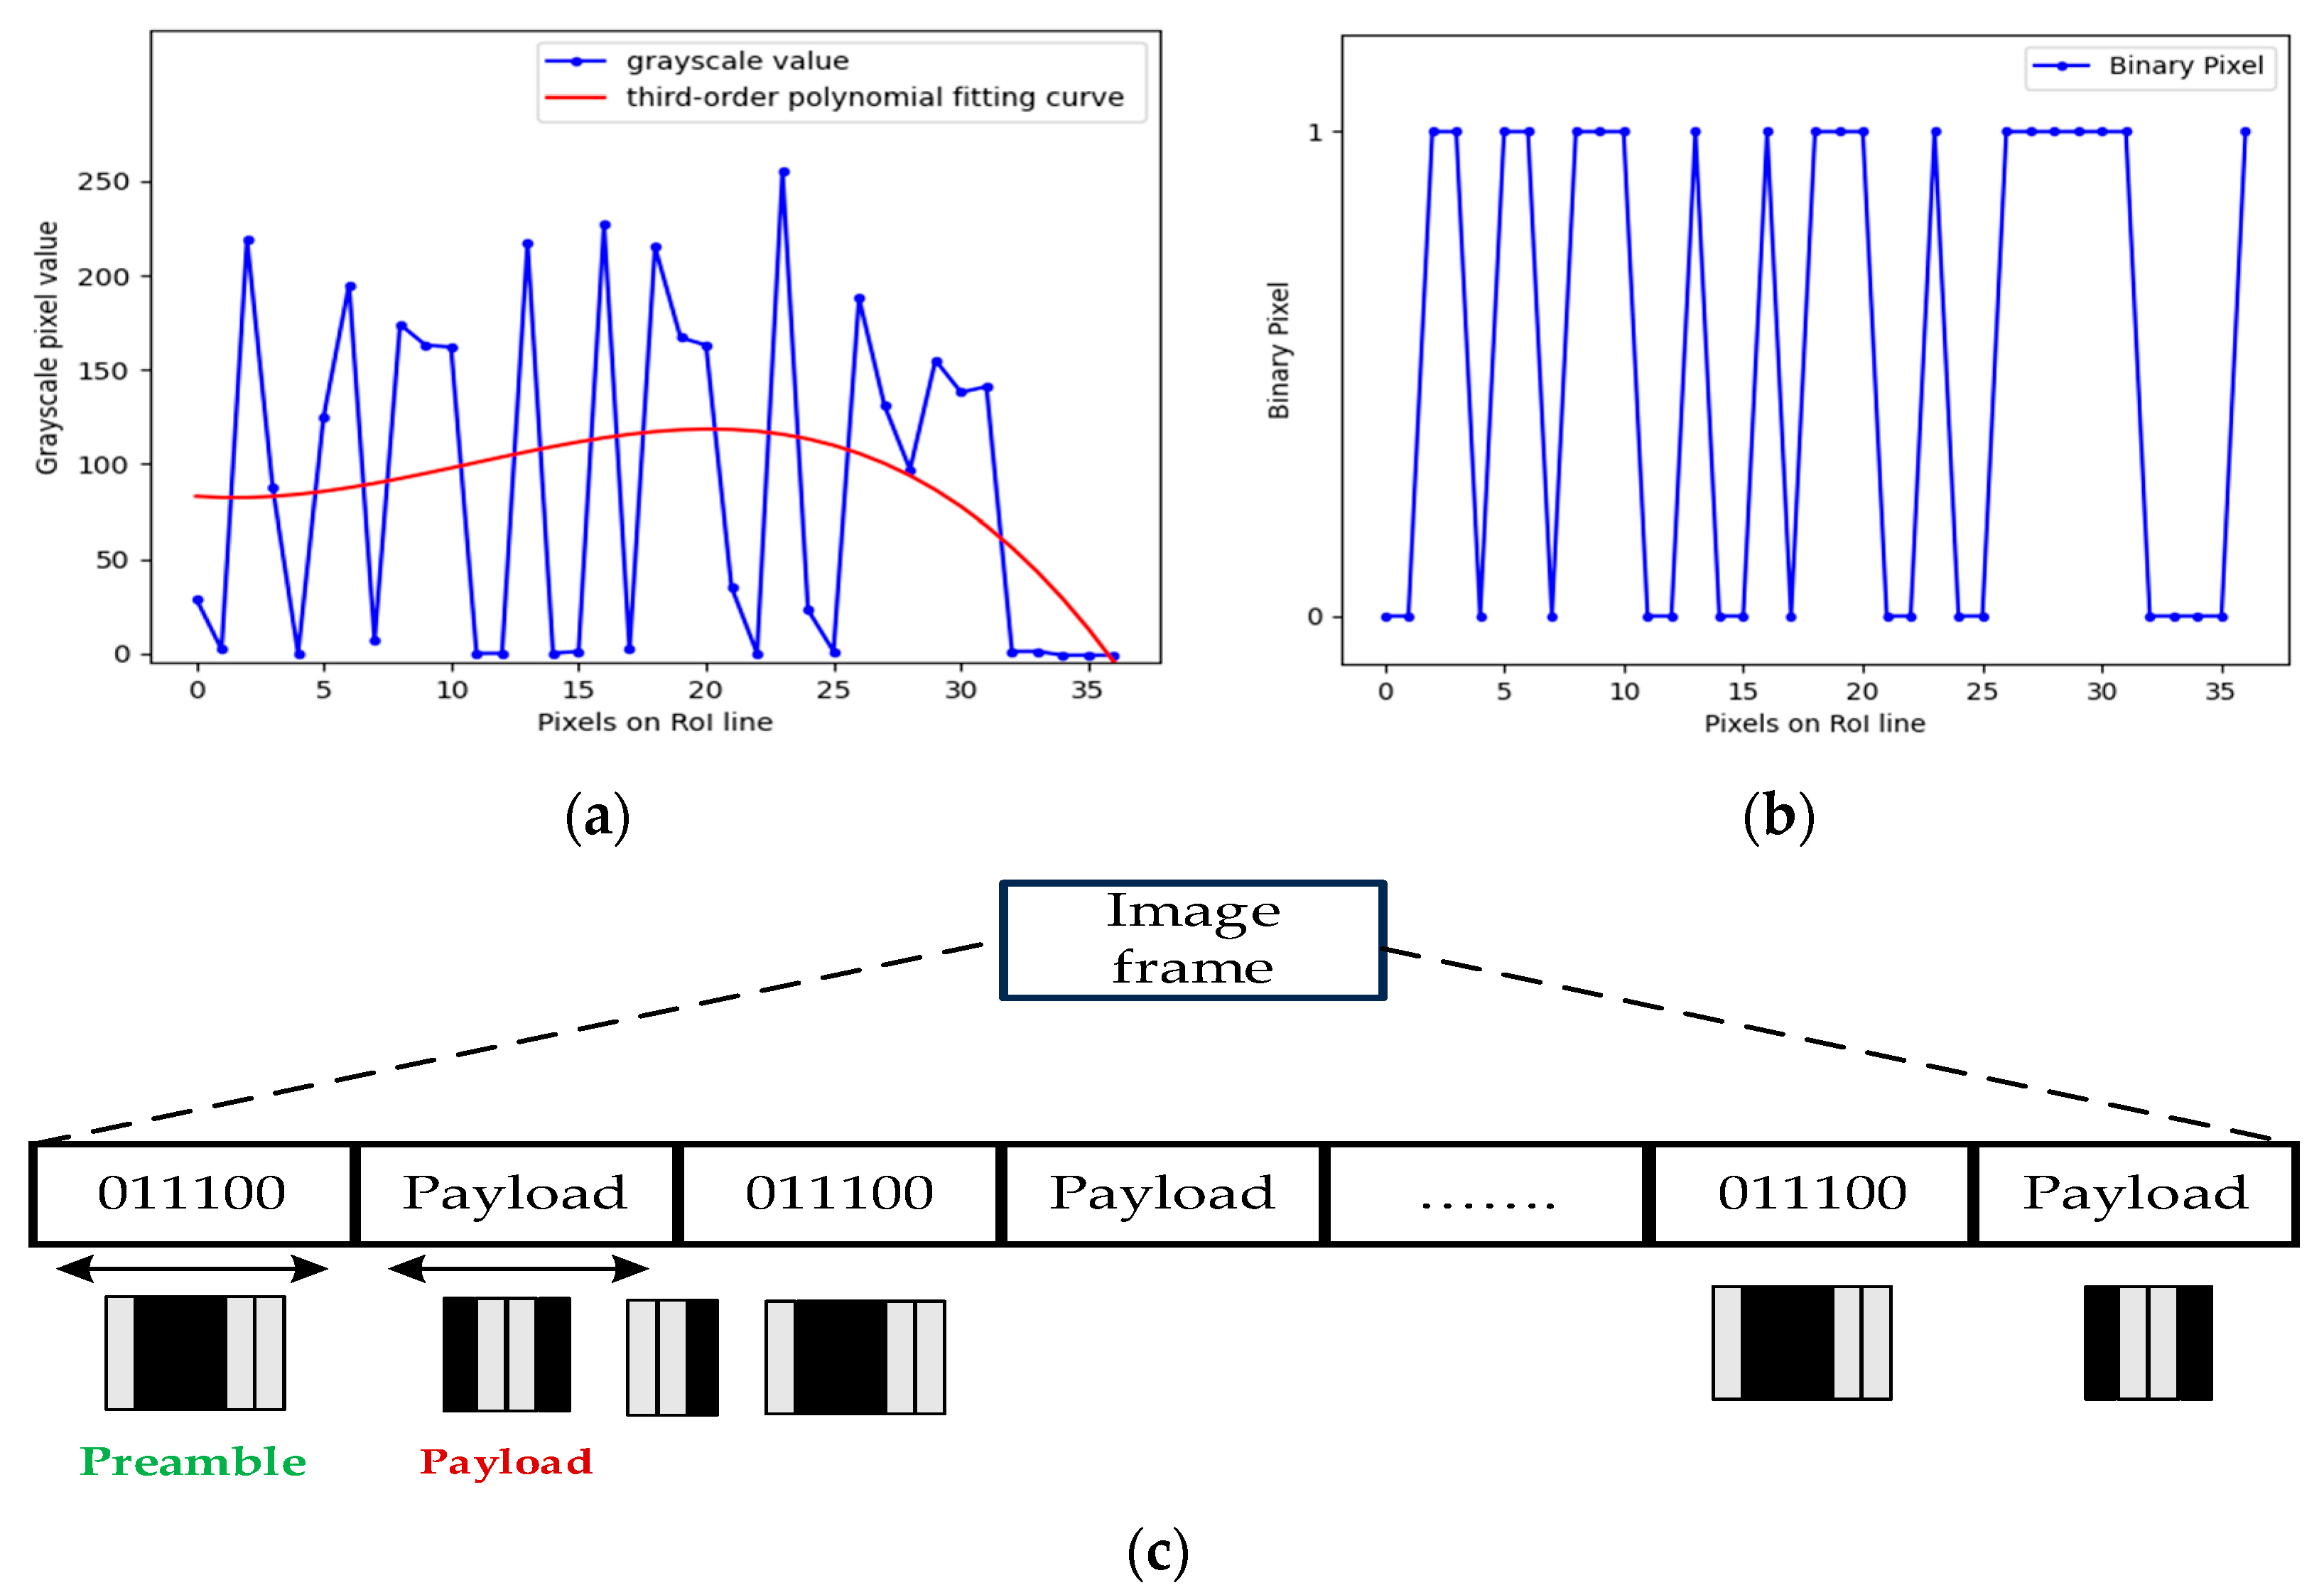
4.2.4. Light-Emitting Diodes Decoding Algorithms
5. Experiment and Results
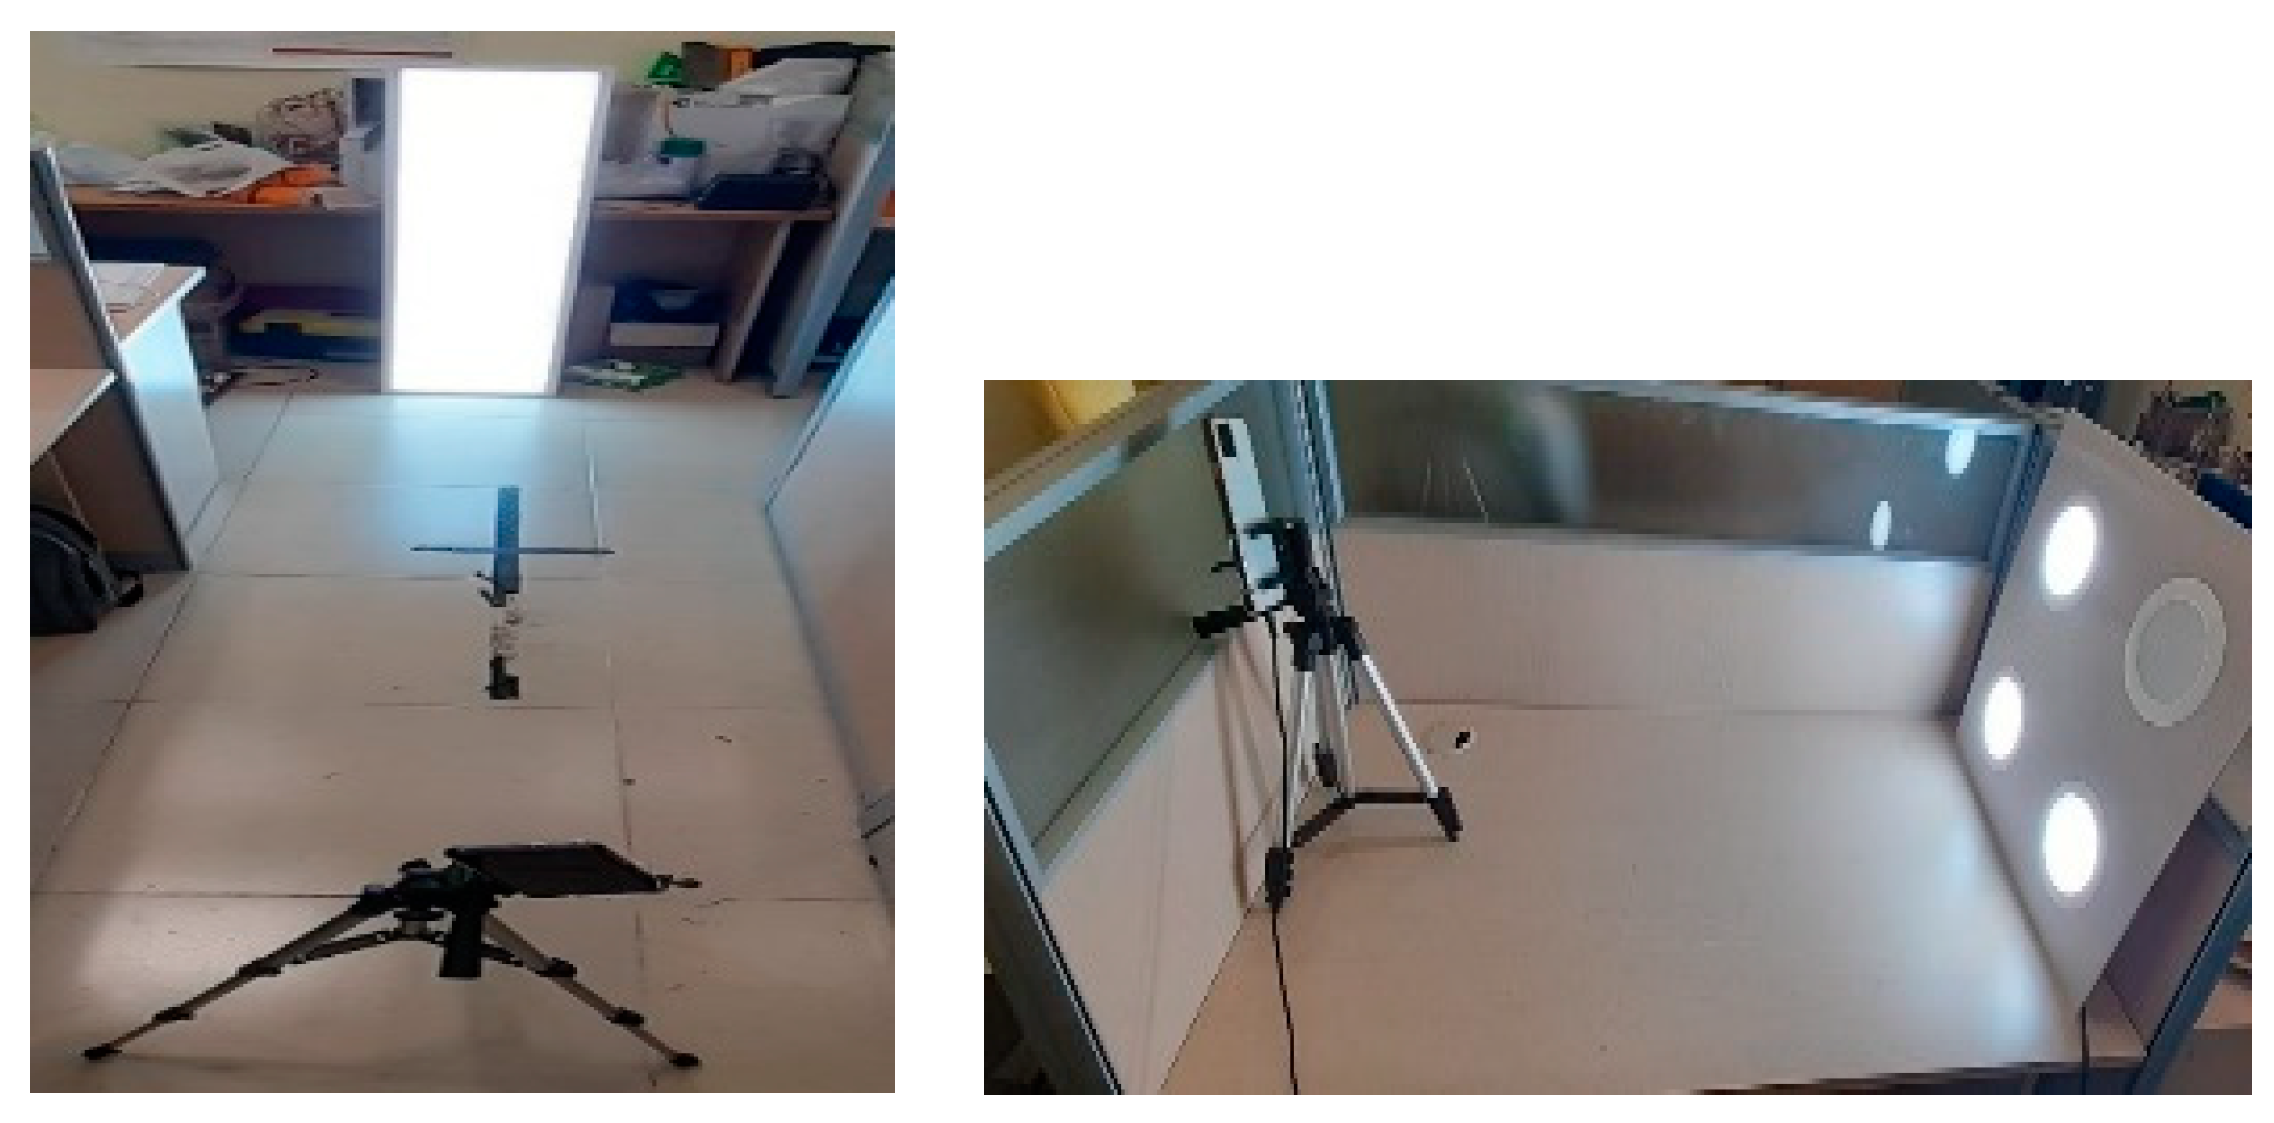
5.1. Experimental Setup
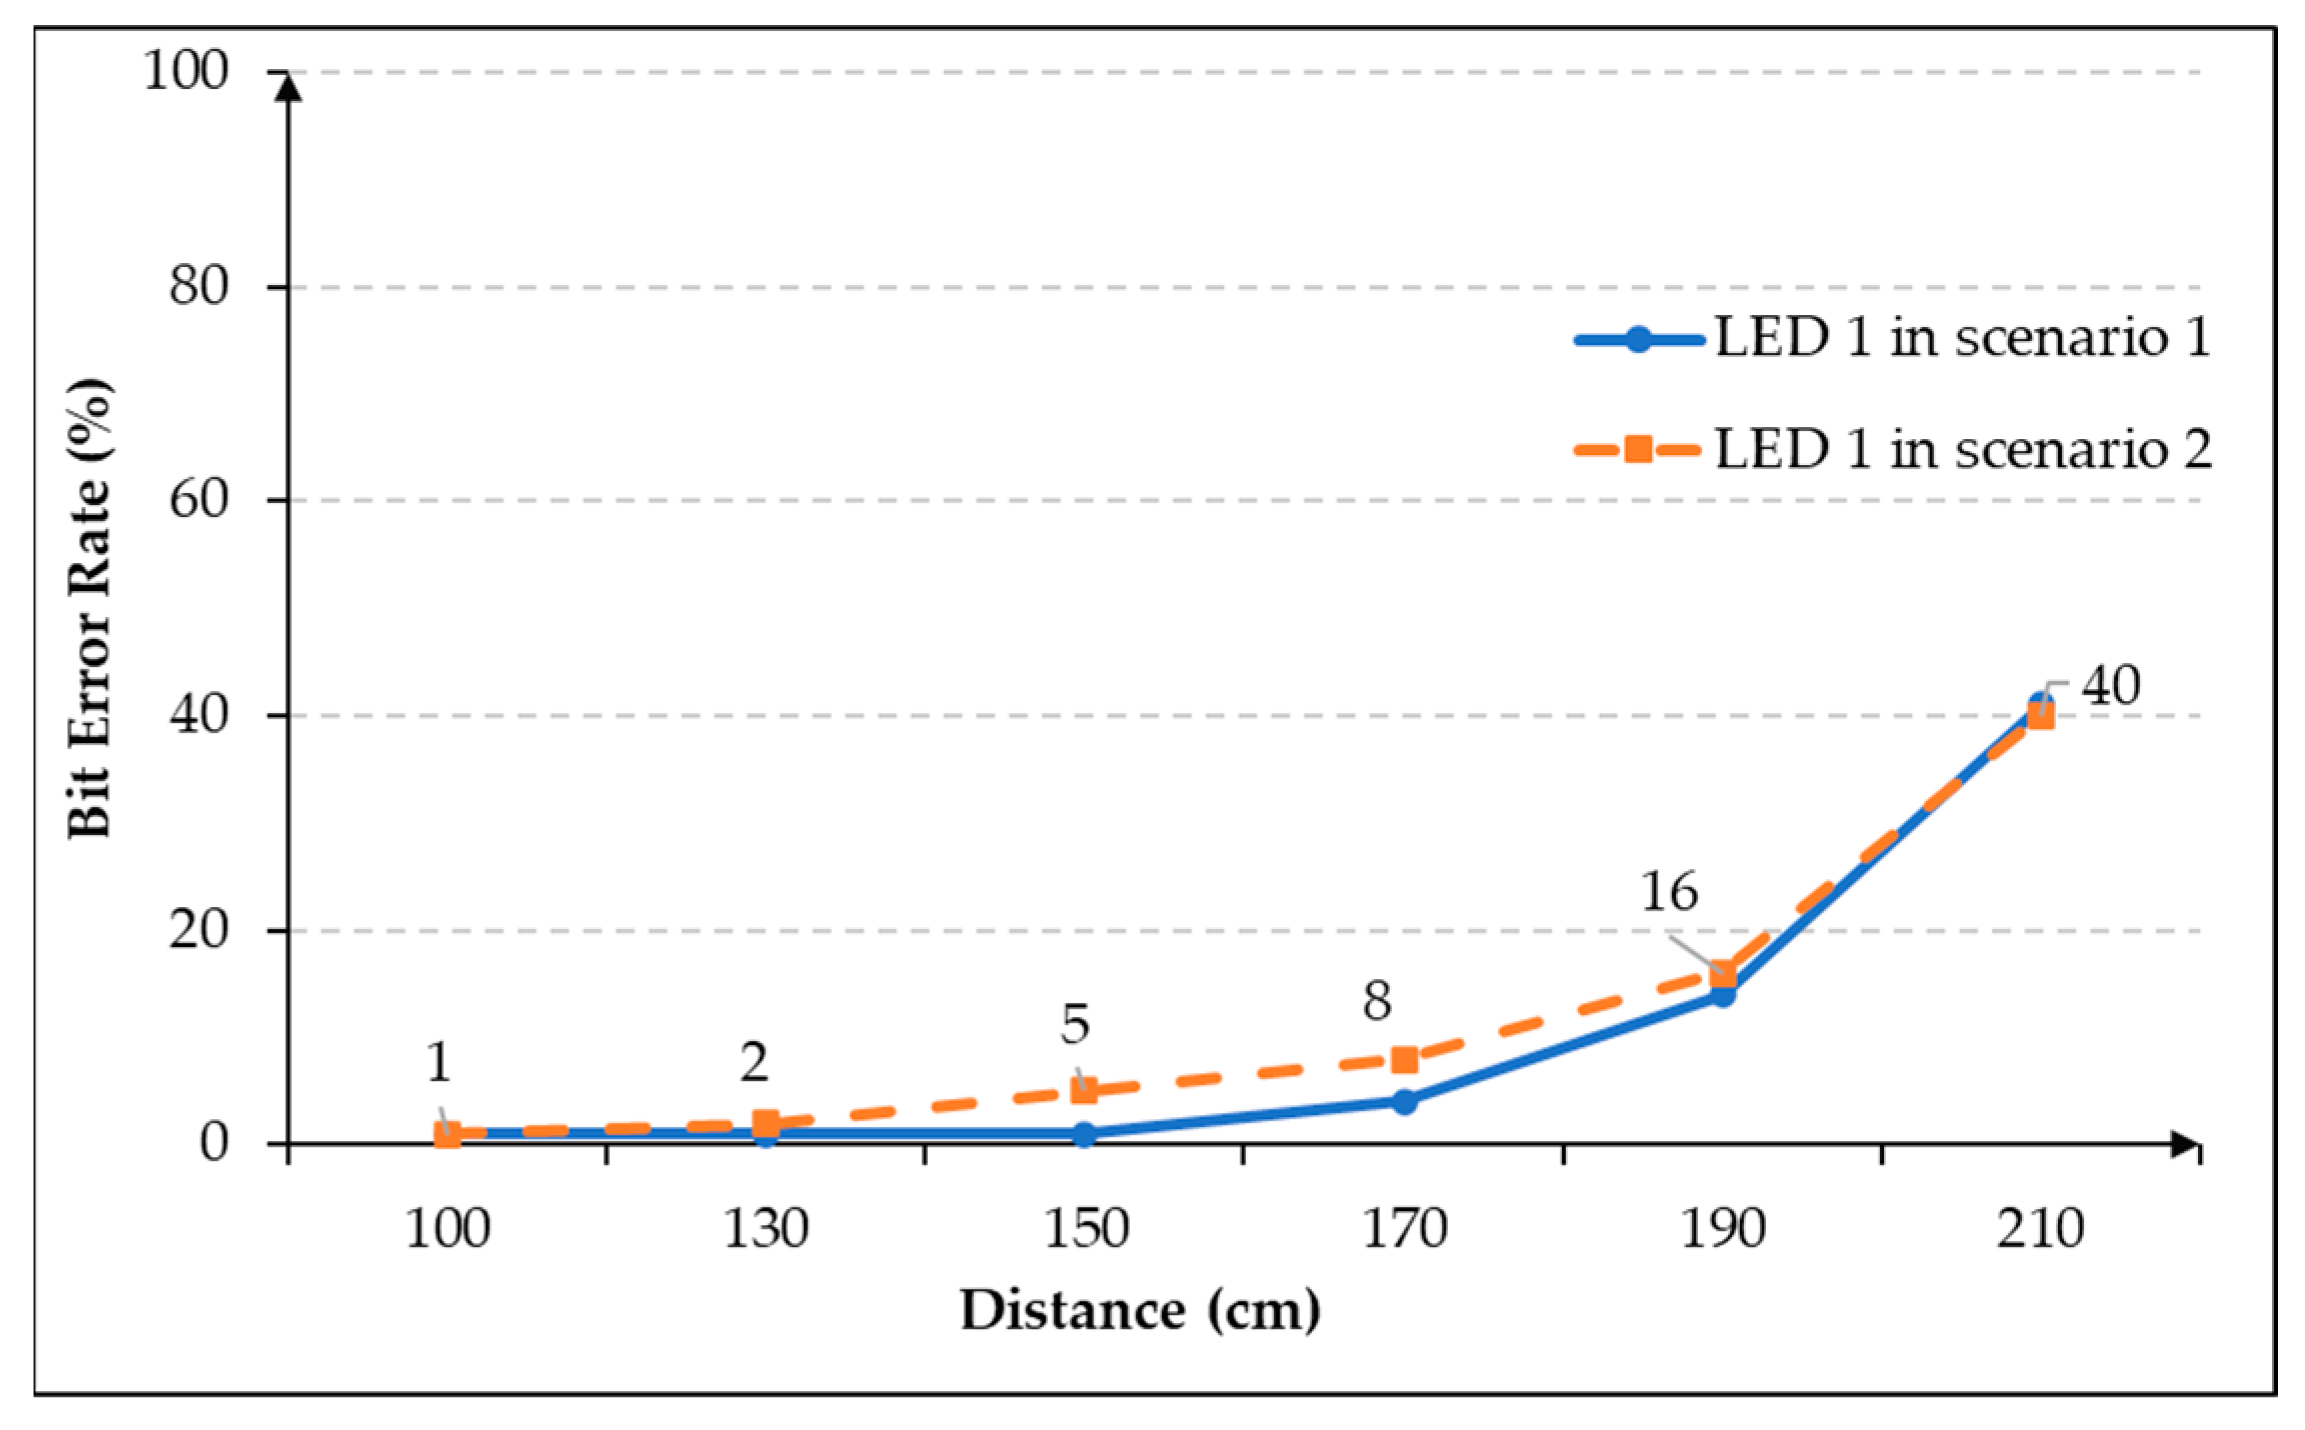
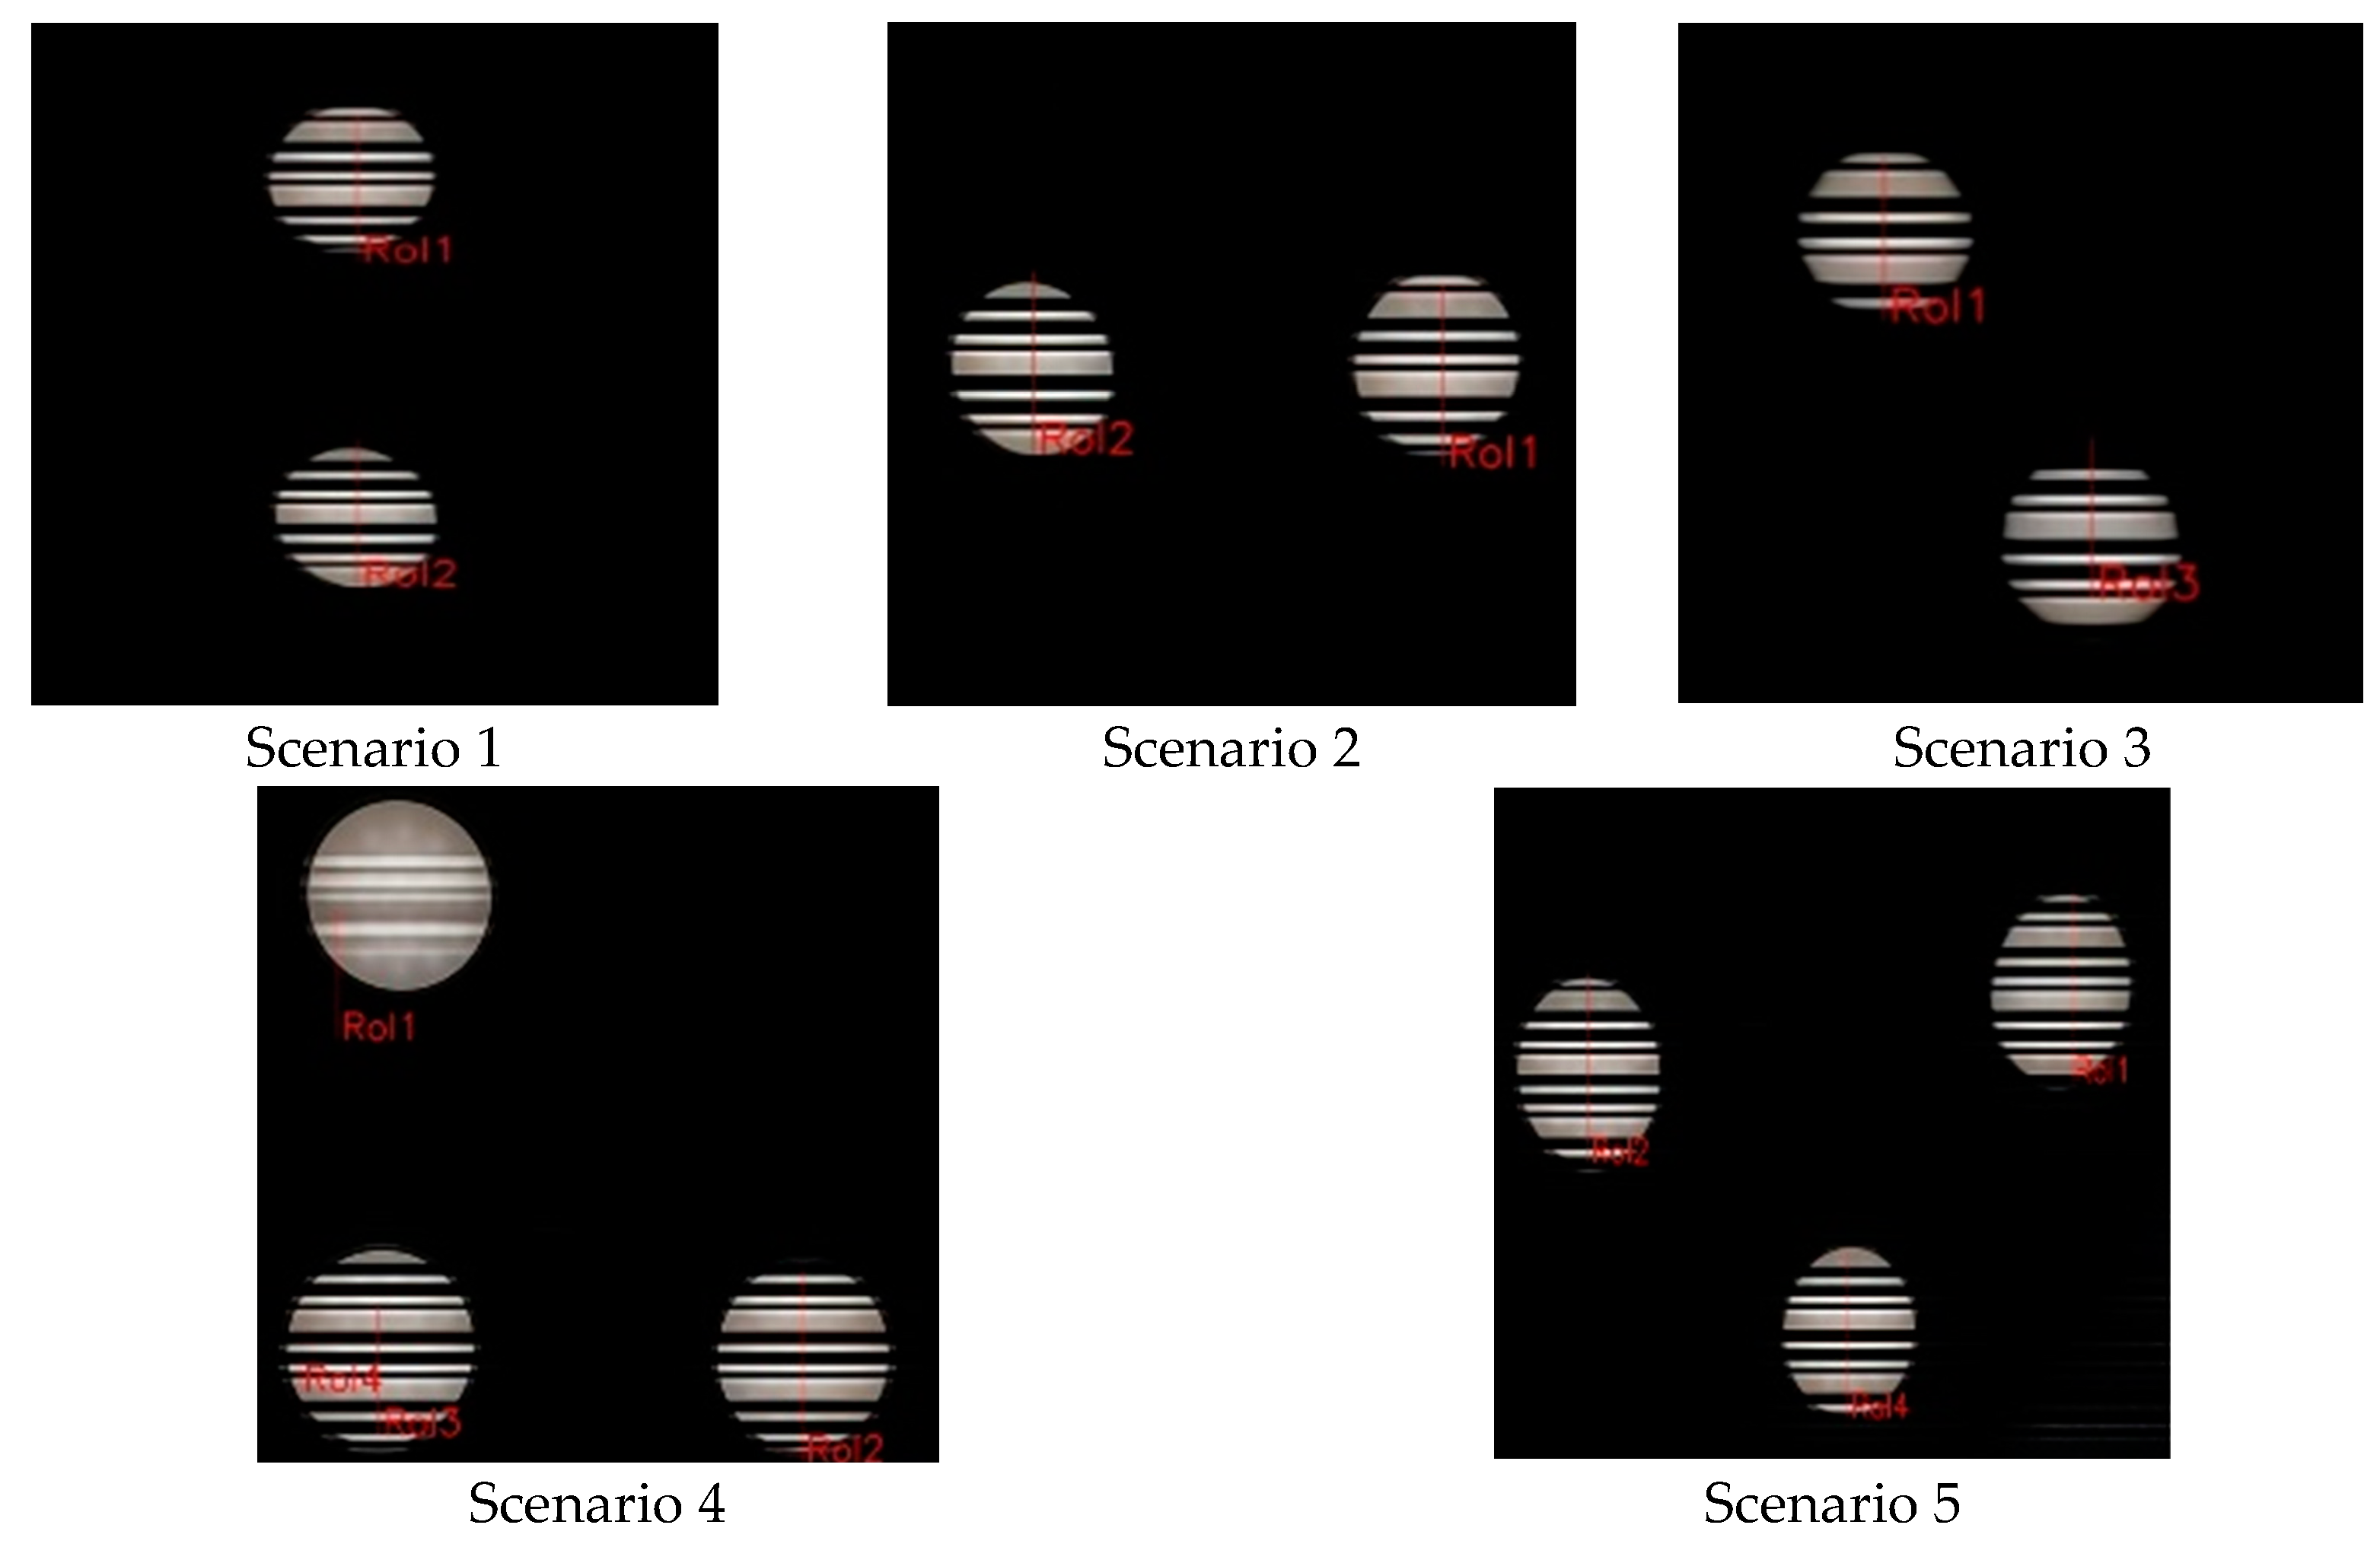
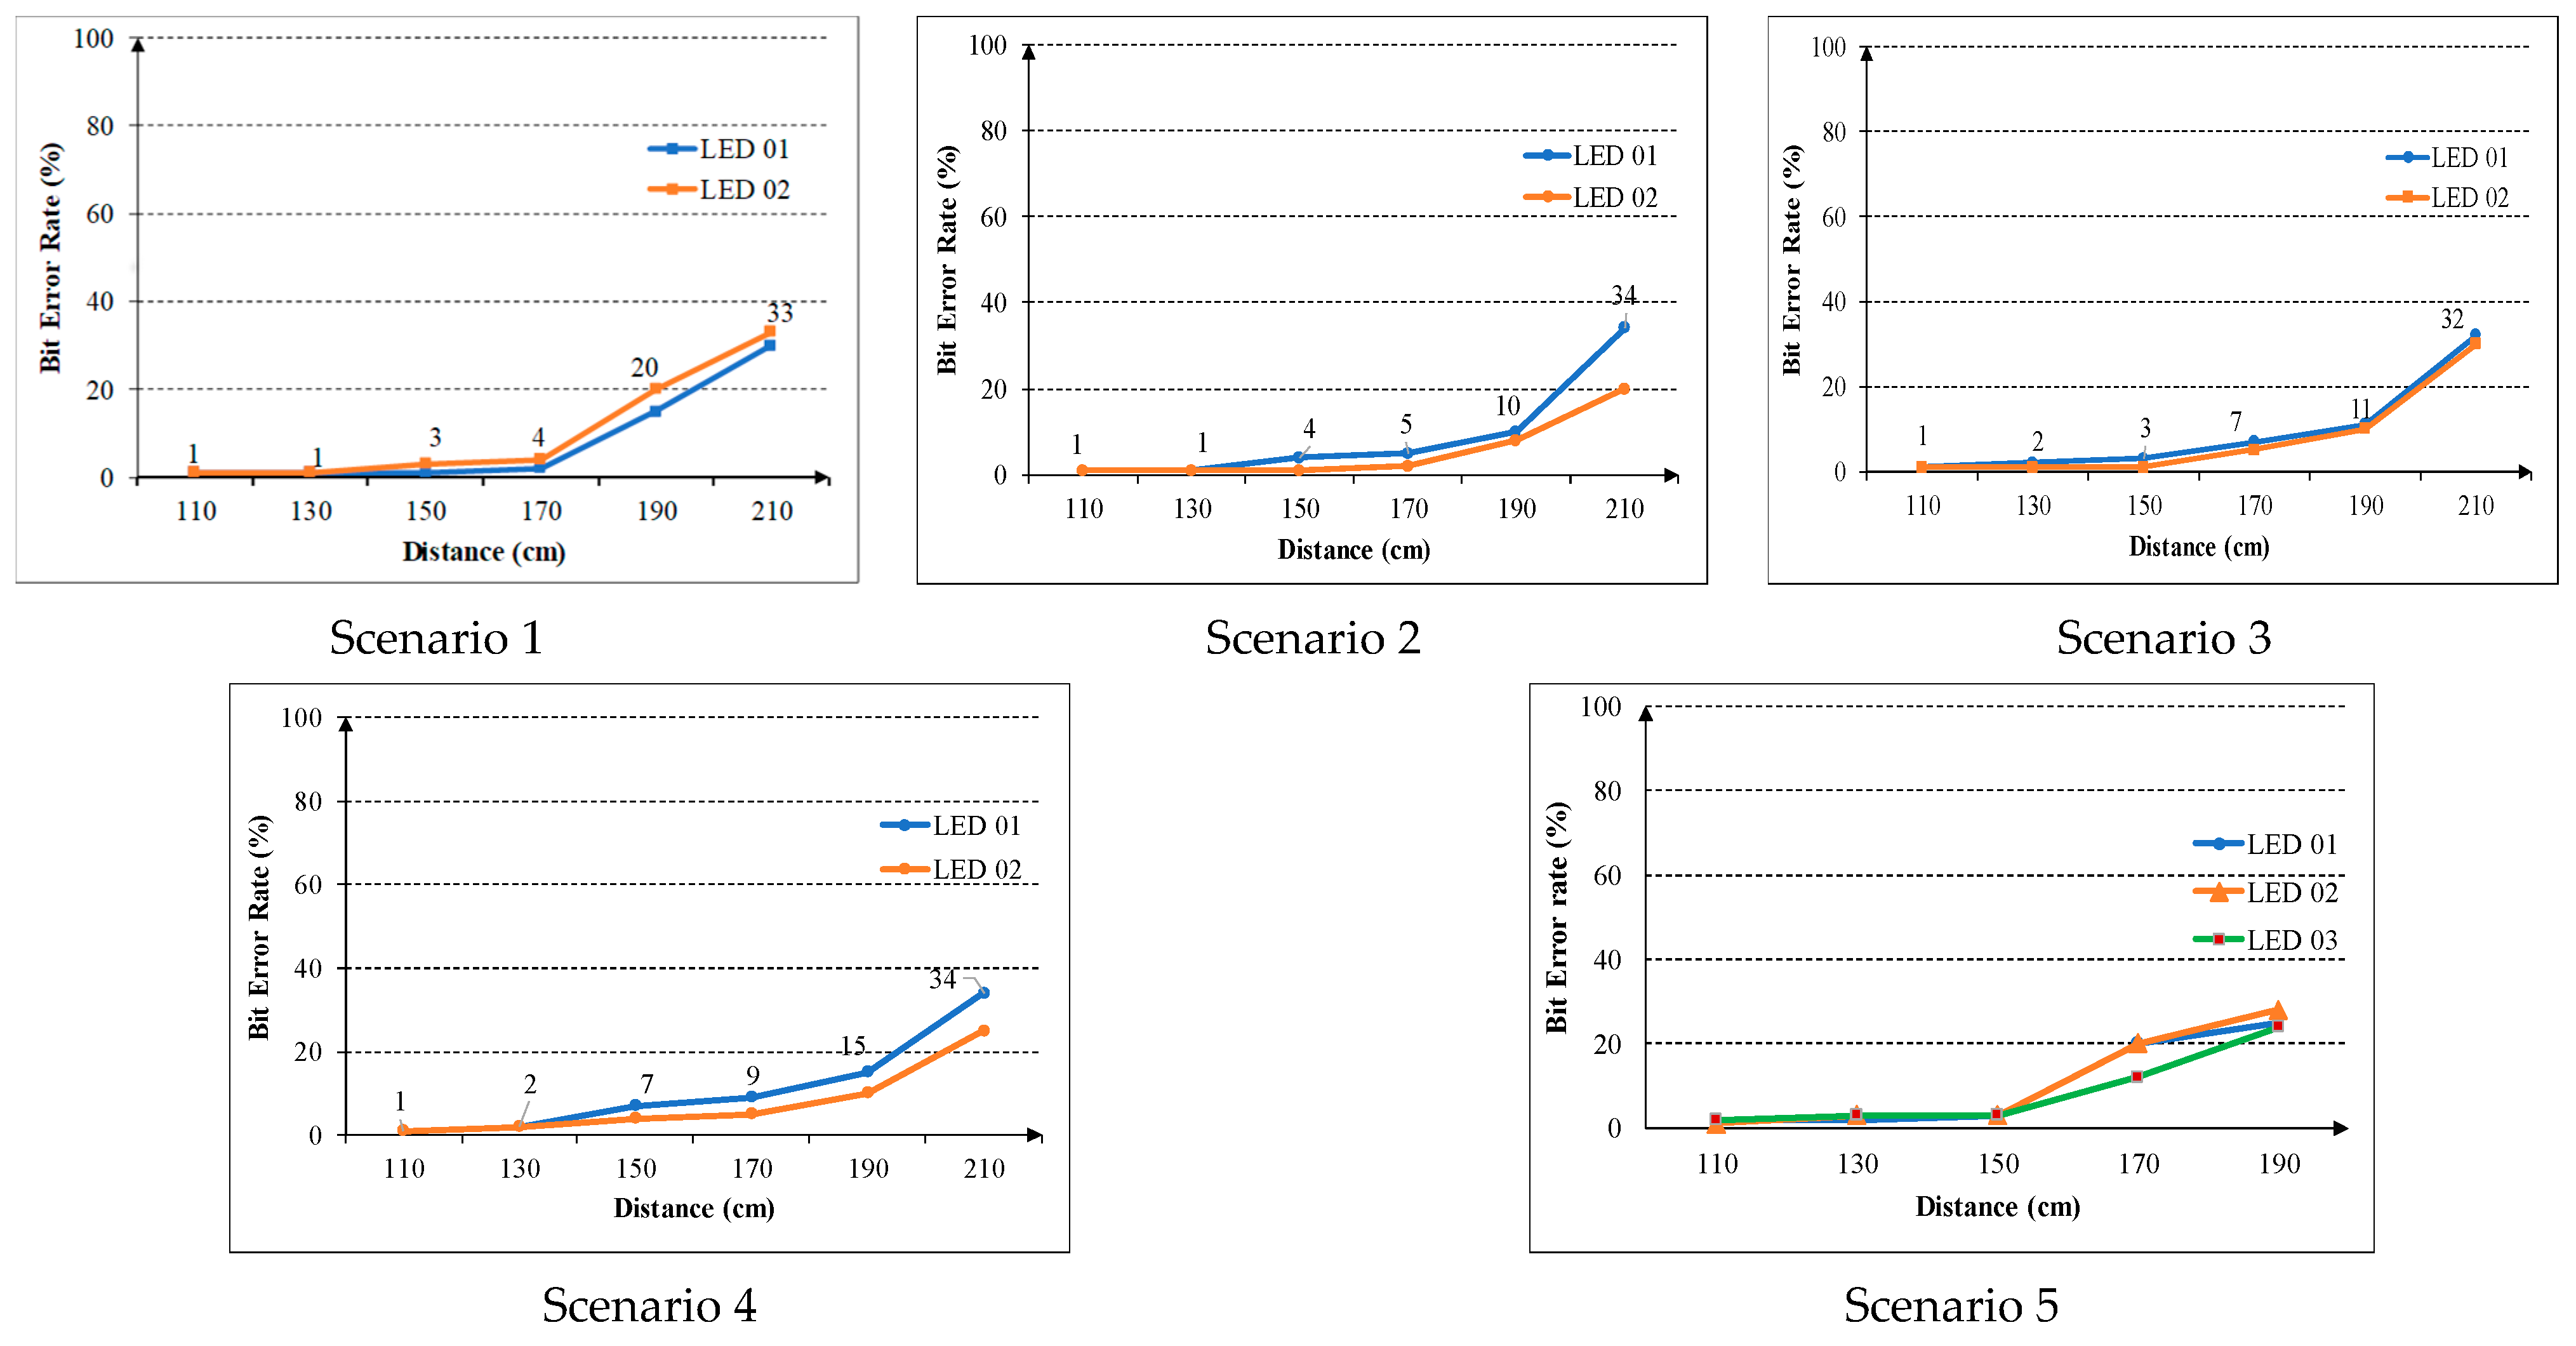
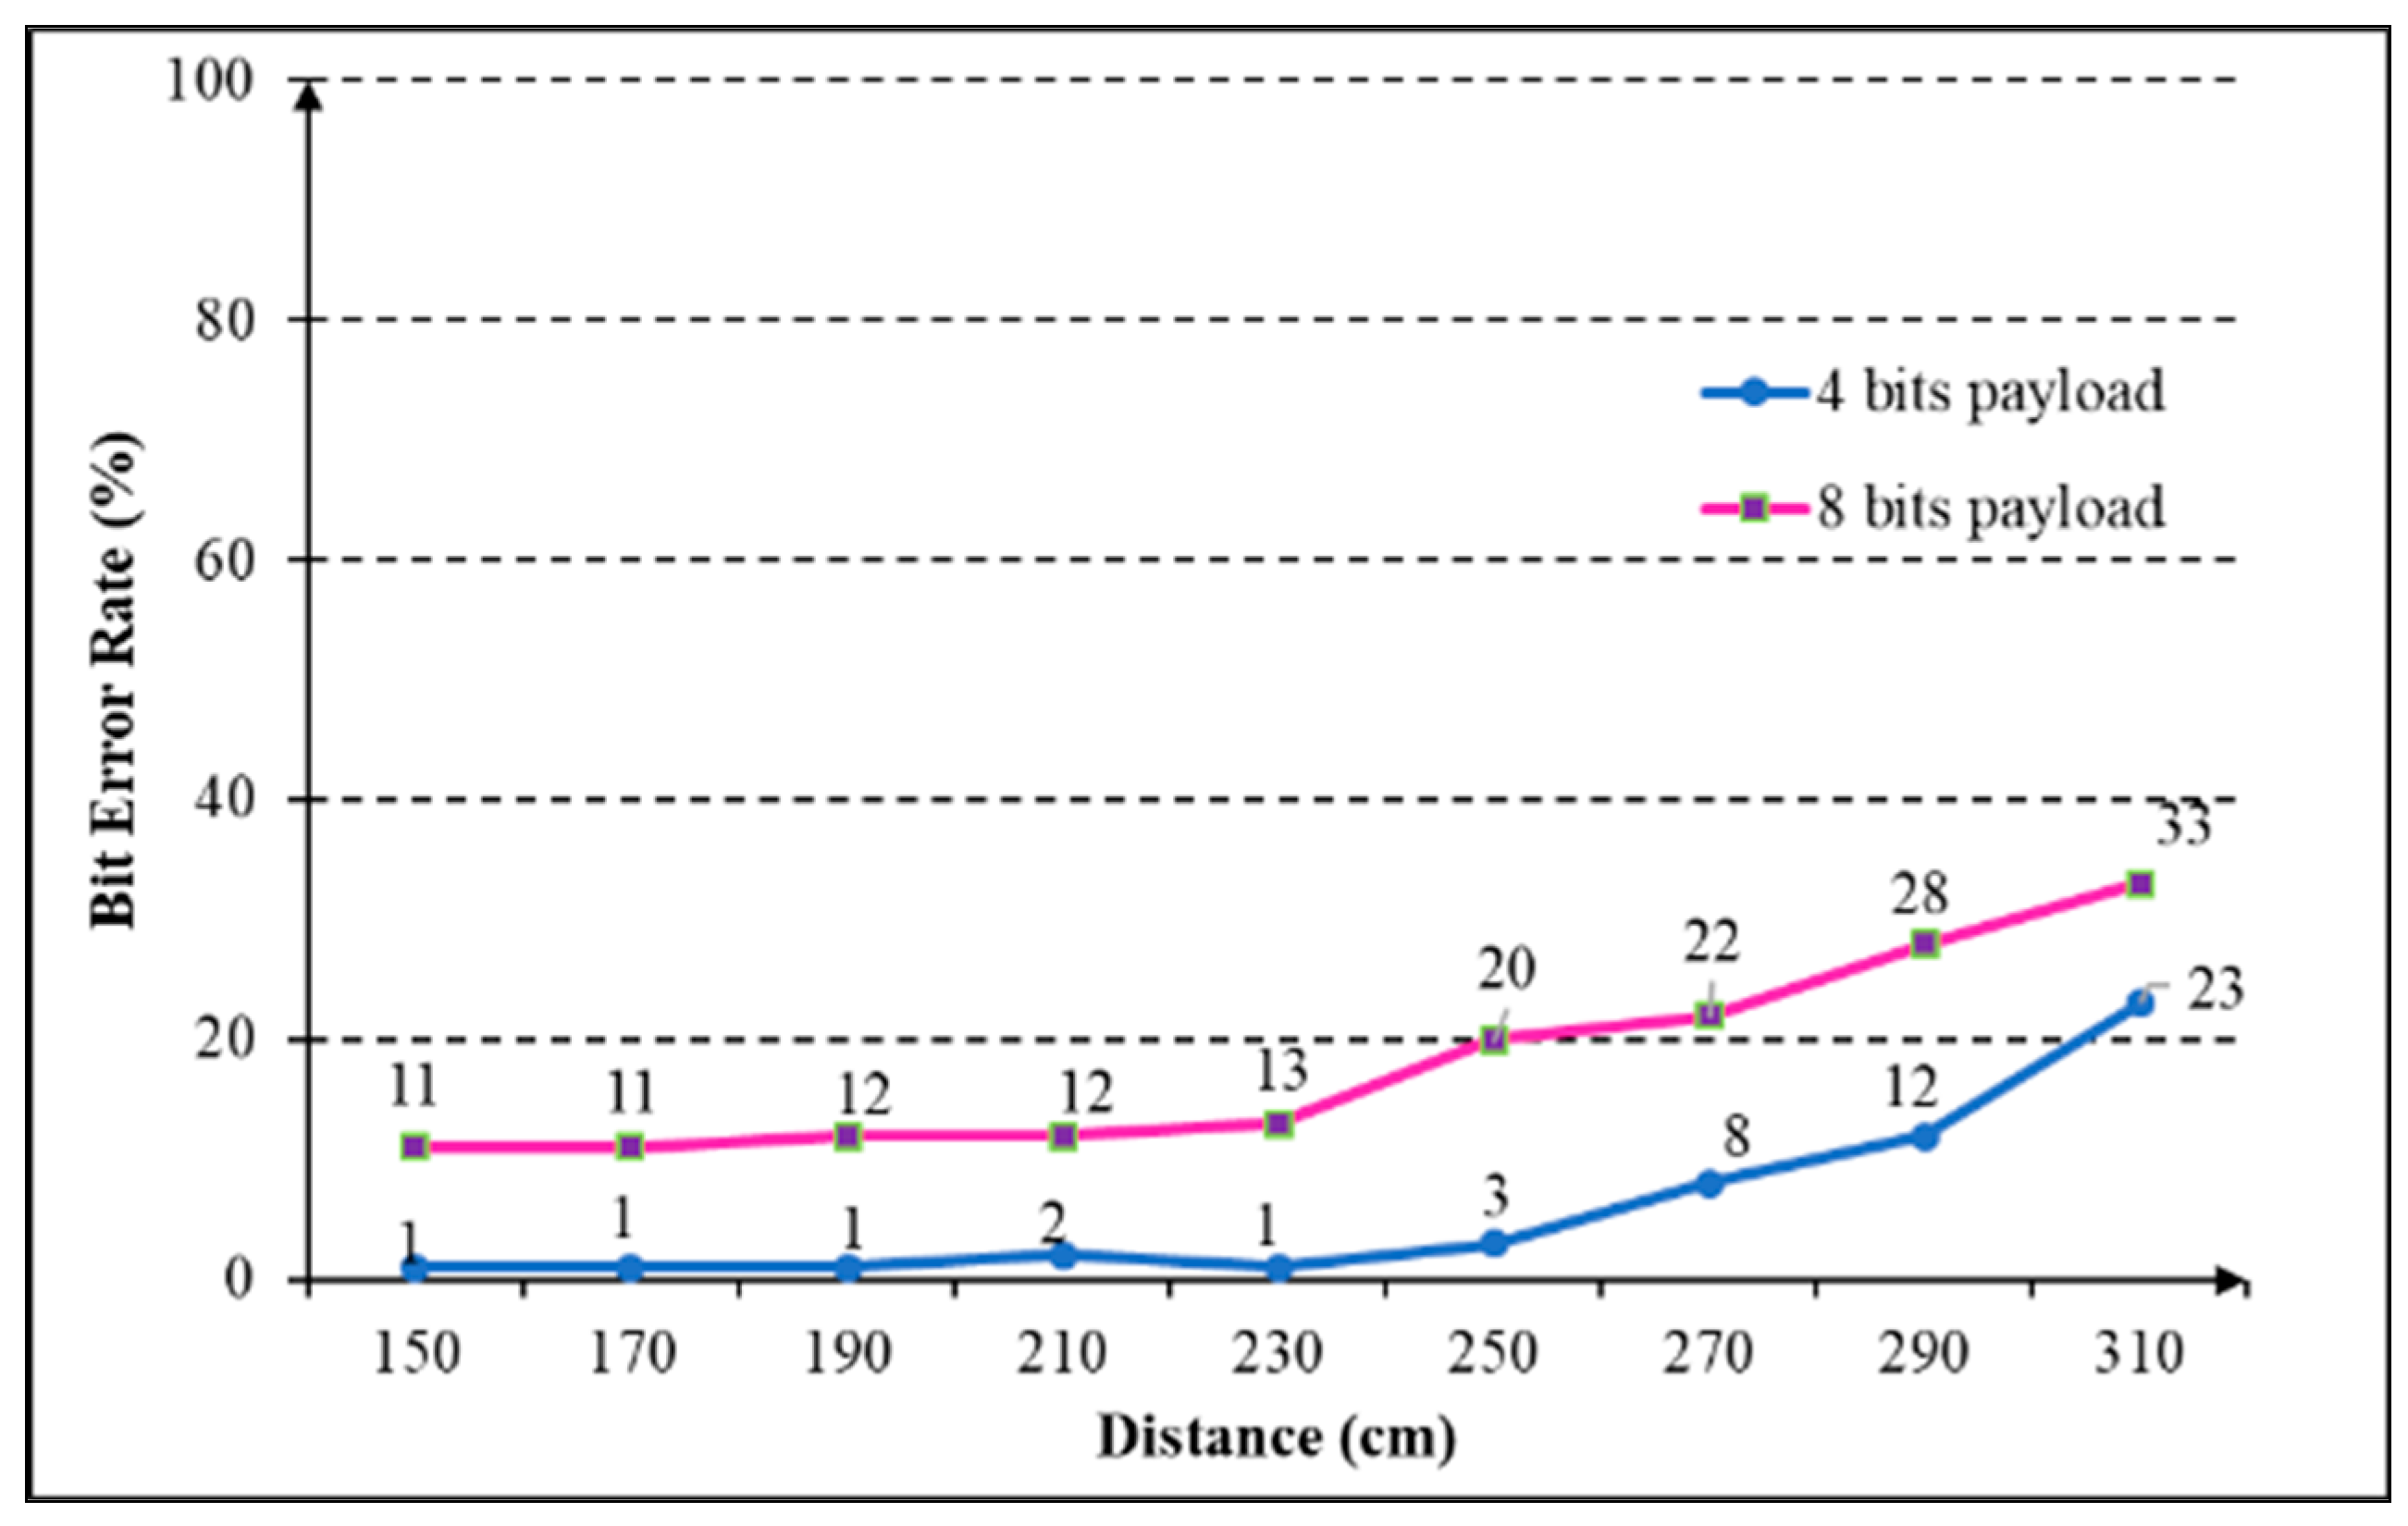
5.2. Experimental Results
6. Discussion and Conclusions
Author Contributions
Funding
Institutional Review Board Statement
Informed Consent Statement
Data Availability Statement
Conflicts of Interest
References
- Pathak, P.H.; Feng, X.; Hu, P.; Mohapatra, P. Visible Light Communication, Networking, and Sensing: A Survey, Potential and Challenges. IEEE Commun. Surv. Tutor. 2015, 17, 2047–2077. [Google Scholar] [CrossRef]
- Ghassemlooy, Z.; Popoola, W.; Rajbhandari, S. Optical Wireless Communications; CRC Press: Boca Raton, FL, USA, 2013. [Google Scholar]
- Nguyen, T.; Islam, A.; Hossan, T.; Jang, Y.M. Current Status and Performance Analysis of Optical Camera Communication Technologies for 5G Networks. IEEE Access 2017, 5, 4574–4594. [Google Scholar] [CrossRef]
- Koonen, T. Indoor Optical Wireless Systems: Technology, Trends, and Applications. J. Light. Technol. 2018, 36, 1459–1467. [Google Scholar] [CrossRef]
- Cahyadi, W.A.; Chung, Y.H.; Ghassemlooy, Z.; Hassan, N.B. Optical Camera Communications: Principles, Modulations, Potential and Challenges. Electronics 2020, 9, 1339. [Google Scholar] [CrossRef]
- Chen, H.; Guan, W.; Li, S.; Wu, Y. Indoor high precision three-dimensional positioning system based on visible light communication using modified genetic algorithm. Opt. Commun. 2018, 413, 103–120. [Google Scholar] [CrossRef]
- Begley, D.L. Free-space laser communications: A historical perspective. In Proceedings of the 15th Annual Meeting of the IEEE Lasers and Electro-Optics Society, Glasgow, UK, 10–14 November 2002; Volume 2, pp. 391–392. [Google Scholar]
- Gfeller, F.R.; Bapst, U. Wireless in-house data communication via diffuse infrared radiation. Proc. IEEE 1979, 67, 1474–1486. [Google Scholar] [CrossRef]
- Kahn, J.M.; Barry, J.R. Wireless infrared communications. Proc. IEEE 1997, 85, 265–298. [Google Scholar] [CrossRef]
- Pang, G.; Kwan, T.; Chan, C.-H.; Liu, H. LED traffic light as a communications device. In Proceedings of the 199 IEEE/IEEJ/JSAI International Conference on Intelligent Transportation Systems (Cat. No. 99TH8383), Tokyo, Japan, 5–8 October 1999; pp. 788–793. [Google Scholar]
- Rajagopal, S.; Roberts, R.D.; Lim, S.-K. IEEE 802.15.7 visible light communication: Modulation schemes and dimming support. IEEE Commun. Mag 2012, 50, 72–82. [Google Scholar]
- IEEE Std 802.15.7-2011; Short-Range Wireless Optical Communication Using Visible. IEEE: Piscataway, NJ, USA, 2011; pp. 1–399.
- Sheenam; Sangwan, S. Li-Fi: The Revolutionary Wi-Fi. Int. J. Eng. Res. Technol. (IJERT) 2017, 5, 1–4. [Google Scholar]
- Figueiredo, M.; Ribeiro, C.; Dobesch, A.; Alves, L.N.; Wilfert, O. Consumer LED lamp with ODAC technology for high-speed visible light communications. IEEE Trans. Consum. Electron. 2017, 63, 285–290. [Google Scholar] [CrossRef]
- Komine, T.; Nakagawa, M. Fundamental analysis for visible-light communication system using LED lights. IEEE Trans. Consum. Electron. 2004, 50, 100–107. [Google Scholar] [CrossRef]
- Jovicic, A.; Li, J.; Richardson, T. Visible light communication: Opportunities, challenges and the path to market. IEEE Commun. Mag. 2013, 51, 26–32. [Google Scholar] [CrossRef]
- Behdad, Z.; Mahdavi, M.; Razmi, N. A new relay policy in rf energy harvesting for IoT networks a cooperative network approach. IEEE Internet Things J. 2018, 5, 2715–2718. [Google Scholar] [CrossRef]
- Lim, S.; Ruling, K.G.; Kim, I.; Jang, I.S. Entertainment lighting control network standardization to support VLCservices. IEEE Commun. Mag. 2013, 51, 42–48. [Google Scholar] [CrossRef]
- Boucouvalas, A.C.; Chatzimisios, P.; Ghassemlooy, Z.; Uysal, M.; Yiannopoulos, K. Standards for indoor optical wireless communications. IEEE Commun. Mag. 2015, 53, 24–31. [Google Scholar] [CrossRef]
- Illuminating Engineering Society of North America. IESNA Lighting Handbook, 9th ed.; Illuminating Engineering Society of North America: New York, NY, USA, 1999. [Google Scholar]
- Zafari, F.; Gkelias, A.; Leung, K. A survey of indoor localization systems and technologies. IEEE Commun. Surv. Tutor. 2019, 21, 2568–2599. [Google Scholar] [CrossRef]
- Luo, J.; Fan, L.; Li, H. Indoor positioning systems based on visible light communication: State of the art. IEEE Commun. Surv. Tutor. 2017, 19, 2871–2893. [Google Scholar] [CrossRef]
- Schmid, S.; Corbellini, G.; Mangold, S.; Gross, T.R. LED-to-LED visible light communication networks. In Proceedings of the Fourteenth ACM International Symposium on Mobile ad Hoc Networking and Computing, Bangalore, India, 29 July–1 August 2013; pp. 1–9. [Google Scholar]
- Ley-Bosch, C.; Alonso-González, I.; Sánchez-Rodríguez, D.; Ramírez-Casañas, C. Evaluation of the effects of hidden node problems in IEEE 802.15.7 uplink performance. Sensors 2016, 16, 216. [Google Scholar] [CrossRef]
- Roberts, R.D.; Rajagopal, S.; Lim, S.K. IEEE 802.15.7 physical layer summary. In Proceedings of the 2011 IEEE GLOBECOM Workshops (GC Wkshps), Houston, TX, USA, 5–9 December 2011; pp. 772–776. [Google Scholar] [CrossRef]
- Wang, Y.; Wang, Y.; Chi, N.; Yu, J.; Shang, H. Demonstration of 575-Mb/s downlink and 225-Mb/s uplink bi-directional SCM-WDM visible light communication using RGB LED and phosphor-based LED. Opt. Express 2013, 21, 1203–1208. [Google Scholar] [CrossRef]
- Craford, M. Visible light emitting diode technology: High performance, more colors, and moving into incandescent lamp applications. In Proceedings of the Quantum Electronics and Laser Science Conference, Anaheim, CA, USA, 2–7 June 1996. [Google Scholar]
- Hashemi, H.; Yun, G.; Kavehrad, M.; Behbahani, F.; Galko, P.A. Indoor propagation measurements at infrared frequencies for wireless local area networks applications. IEEE Trans. Veh. Technol. 1994, 43, 563–576. [Google Scholar] [CrossRef]
- Kahn, J.M.; Krause, W.J.; Carruthers, J.B. Experimental characterization of non-directed indoor infrared channels. IEEE Trans. Commun. 1995, 43, 1613–1623. [Google Scholar] [CrossRef]
- Wang, A.; Ma, S.; Hu, C.; Huai, J.; Peng, C.; Shen, G. Enhancing reliability to boost the throughput over screen-camera links. In Proceedings of the 20th Annual International Conference on Mobile Computing and Networking, Maui, Hi, USA, 7–11 September 2014. [Google Scholar]
- Gamal, A.E.; Eltoukhy, H. CMOS Image Sensors. IEEE Circuits Devices Mag. 2005, 21, 6–20. [Google Scholar] [CrossRef]
- Chen, Z.; Wang, X.; Pacheco, S.; Liang, R. Impact of CCD camera SNR on polarimetric accuracy. Appl. Opt. 2014, 53, 7649–7656. [Google Scholar] [CrossRef]
- Grubor, J.; Lee, S.C.J.; Langer, K.-D.; Koonen, T.; Walewski, J.W. Wireless high-speed data transmission with phosphorescent white-light LEDs. In Proceedings of the 33rd European Conference and Exhibition of Optical Communication-Post-Deadline Papers, Berlin, Germany, 16–20 September 2007. [Google Scholar]
- Park, S.-B.; Jung, D.K.; Shin, H.S.; Shin, D.J.; Hyun, Y.-J.; Lee, K.; Oh, Y.J. Information broadcasting system based on visible light signboard. Proc. Wireless Opt. Commun. 2007, 30, 311–313. [Google Scholar]
- Vucic, J.; Kottke, C.; Nerreter, S.; Habel, K.; Buettner, A.; Langer, K.-D.; Walewski, J. 125 Mbit/s over 5 m wireless distance by use of OOK-modulated phosphorescent white LEDs. In Proceedings of the 35th European Conference on Optical Communication, Vienna, Austria, 20–24 September 2009; pp. 1–2. [Google Scholar]
- Minh, H.L.; O’Brien, D.; Faulkner, G.; Zeng, L.; Lee, K.; Jung, D.; Oh, Y. High-speed visible light communications using multiple resonant equalization. IEEE Photonics Technol. Lett. 2008, 20, 1243–1245. [Google Scholar] [CrossRef]
- Sugiyama, H.; Haruyama, S.; Nakagawa, M. Brightness Control Methods for Illumination and Visible-Light Communication Systems. In Proceedings of the Third International Conference on Wireless and Mobile Communications, Guadeloupe, France, 4–9 March 2007. [Google Scholar]
- Ntogari, G.; Kamalakis, T.; Walewski, J.; Sphicopoulos, T. Combining illumination dimming based on pulse-width modulation with visible-light communications based on discrete multinone. IEEE/OSA J. Opt. Commun. Netw. 2011, 3, 56–65. [Google Scholar] [CrossRef]
- Kunhoth, J.; Karkar, A.; Al-Maadeed, S.; Al-Ali, A. Indoor positioning and wayfinding systems: A survey. Hum. Cent. Comput. Inf. Sci. 2020, 10, 18. [Google Scholar] [CrossRef]
- Bouet, M.; dos Santos, A.L. RFID tags: Positioning principles and localization techniques. In Proceedings of the 2008 1st IFIP Wireless Days, Dubai, United Arab Emirates, 24–27 November 2008. [Google Scholar]
- Zhang, W.; Chowdhury, M.I.S.; Kavehrad, M. Asynchronous indoor positioning system based on visible light communications. Opt. Eng. 2014, 53, 045105. [Google Scholar] [CrossRef]
- Li, L.; Hu, P.; Peng, C.; Shen, G.; Zhao, F. Epsilon: A Visible Light-Based Positioning System. In Proceedings of the USENIX Symposium on Networked Systems Design and Implementation, Seattle, WA, USA, 2–4 April 2014; Volume 14, pp. 2–4. [Google Scholar]
- Zhao, Z.; Wang, J.; Zhao, X.; Peng, C.; Guo, Q.; Wu, B. NaviLight: Indoor localization and navigation under arbitrary lights. In Proceedings of the IEEE INFOCOM 2017—IEEE Conference on Computer Communications, Atlanta, GA, USA, 1–4 May 2017. [Google Scholar]
- Kuo, Y.S.; Pannuto, P.; Hsiao, K.J.; Dutta, P. Luxapose: Indoor positioning with mobile phones and visible light. In Proceedings of the 20th Annual International Conference on Mobile Computing and Networking, New York, NY, USA, 7–11 September 2014; pp. 447–458. [Google Scholar]
- Rahman, A.B.M.M.; Li, T.; Wang, Y. Recent Advances in Indoor Localization via Visible Lights: A Survey. Sensors 2020, 20, 1382. [Google Scholar] [CrossRef]
- Shiu, R.-J.; Liu, Y.-C.; Chow, C.-W. Visible Light Communication Using Advertisement-Light-Board and Rolling-Shutter-Effect based CMOS Mobile-Phone Camera. In Proceedings of the 23rd Opto Electronics and Communications Conference, Jeju, Republic of Korea, 2–6 July 2018. [Google Scholar]
- Nguyen, H.; Thieu, M.D.; Pham, T.L.; Nguyen, H.; Jang, Y.M. The Impact of Camera Parameters on Optical Camera Communication. In Proceedings of the 2019 International Conference on Artificial Intelligence in Information and Communication (ICAIIC), Okinawa, Japan, 11–13 February 2019. [Google Scholar]
- Nguyen, N.H.; Pham-Nguyen, L.; Thi, H.N.; Viet, S.N.; Lan HN, T.; Si, H.H. Performance Analysis and Experiment of Data Transmission Rate of LEDs in Optical Camera Communication for Indoor Positioning System. In Proceedings of the International Conference on Control, Automation and Information Sciences (ICCAIS), Hanoi, Vietnam, 21–24 November 2022. [Google Scholar]


| RGB LEDs | Phosphor-Based LEDs | |
|---|---|---|
| Data rates | Up to 100 Mbps | Up to 50 Mbps |
| Price | More expensive | Less expensive |
| Modulation | Complex | Low complexity |
| Bandwidth | High | Low |
| Parameter Name | Values |
|---|---|
| Smartphone Model | Google Pixel 4 |
| CPU | 1 × 2.84 GHz and 3 × 2.42 GHz and 4 × 1.78 GHz (Qualcomm Snapdragon 855) |
| GPU | 257 MHz |
| Image Sensor | Rolling Shutter CMOS |
| Frame Rate | 30 fps |
| Camera | Front camera: 8 megapixels Back camera: 16 megapixels |
| Focal length | 28 mm—f/1.7 48 mm—f/2.4 |
| Aperture | f/1.7; f/2.4 |
| Camera API | Camera2 API level 30 |
| Camera Image Resolution | 1080 × 2220 px |
Disclaimer/Publisher’s Note: The statements, opinions and data contained in all publications are solely those of the individual author(s) and contributor(s) and not of MDPI and/or the editor(s). MDPI and/or the editor(s) disclaim responsibility for any injury to people or property resulting from any ideas, methods, instructions or products referred to in the content. |
© 2024 by the authors. Licensee MDPI, Basel, Switzerland. This article is an open access article distributed under the terms and conditions of the Creative Commons Attribution (CC BY) license (https://creativecommons.org/licenses/by/4.0/).
Share and Cite
Nguyen, Q.D.; Nguyen, N.H. Mobile Application for Visible Light Communication Systems: An Approach for Indoor Positioning. Photonics 2024, 11, 293. https://doi.org/10.3390/photonics11040293
Nguyen QD, Nguyen NH. Mobile Application for Visible Light Communication Systems: An Approach for Indoor Positioning. Photonics. 2024; 11(4):293. https://doi.org/10.3390/photonics11040293
Chicago/Turabian StyleNguyen, Quan Dinh, and Nam Hoang Nguyen. 2024. "Mobile Application for Visible Light Communication Systems: An Approach for Indoor Positioning" Photonics 11, no. 4: 293. https://doi.org/10.3390/photonics11040293
APA StyleNguyen, Q. D., & Nguyen, N. H. (2024). Mobile Application for Visible Light Communication Systems: An Approach for Indoor Positioning. Photonics, 11(4), 293. https://doi.org/10.3390/photonics11040293