Abstract
Photoacoustic imaging (PAI) is a rapidly developing biomedical imaging technology. Linear array-based photoacoustic tomography (LA-PAT) is one of the most popular configurations of cross-sectional PAI due to its simplicity and clinical translatability. However, when using an optical fiber for LA-PAT, the optical beam shape is deformed due to rapid divergence and, therefore, a larger area on the tissue is illuminated (and the illumination across the linear array is non-uniform), leading to the acquisition of PA signals outside the desired cross-section, which generates artifacts and degrades image resolution. A Powell lens is an optical element that converts a circular beam profile to a nearly linear flat-top profile. In this paper, a Powell lens is used to generate a uniform line illumination scheme that is evaluated with Zemax OpticStudio 2023 R1.02. The system is then characterized experimentally, and the performance is compared with a conventional illumination scheme in LA-PAT.
1. Introduction
Photoacoustic imaging (PAI) relies on the phenomenon of the photoacoustic effect, which converts light energy to acoustic waves as follows: energy stemming from photons is assimilated by tissue chromophores leading to a thermoelastic expansion, which generates broad-spectrum ultrasonic (acoustic) waves. The amplitude of the initial pressure generated is related to the degree of thermal expansion encountered [1]. Subsequently, these waves will be captured by the ultrasound transducers, and various image reconstruction algorithms will be applied to reconstruct the photoacoustic image [2,3,4,5,6,7]. PAI has shown promise in many preclinical and clinical applications [8,9,10,11,12,13,14,15].
One of the most popular configurations for photoacoustic tomography (PAT) is side-by-side linear array-based photoacoustic tomography (LA-PAT) due to its simplicity and potential for clinical translatability. LA-PAT incorporates a linear array ultrasound transducer (UST) and a light delivery that usually includes two planar crossing optical fiber bundles attached to the UST [14,16,17]; see the design marketed by FujiFilm VisualSonics, Inc. [18,19]. For such LA-PAT systems, the angle at which light is introduced plays a pivotal role in determining imaging efficacy. It is well established that within biological tissue, photons undergo multiple rounds of absorption and scattering prior to reaching the desired imaging penetration. Given the side illumination configuration, photons must traverse an extended path before reaching the target, thus leading to attenuation and a decrease in fluence [16]. Integrating a powerful light source with the transducer in a compact unit facilitates scanning more area and dynamic contour, such as on a patient’s body surface.
To improve system performance, research groups have proposed different illumination schemes [14,16,20,21,22,23,24]. For instance, one team of researchers demonstrated a system employing a right-angle prism [22]. This prism effectively splits the light illumination and signal detection into separate directions. Light passes through the prism without obstruction, while acoustic waves are reflected at a 90° angle, achieving co-axial illumination and detection. However, this design, in which the transducer and fiber bundle are positioned orthogonally to each other, is not practical for handheld use. Alternatively, in [21], a design was introduced that utilizes polymethyl methacrylate (PMMA) as an optical/acoustic coupler. This material reflects the light beam twice and allows acoustic waves to pass through. The design accomplishes co-axial light delivery and acoustic detection by aligning the optical fiber bundle and transducer probe parallel to each other. Nevertheless, the difference in acoustic impedance between PMMA and soft tissue reduces the efficiency of acoustic wave propagation [16] A third approach is the use of a co-axial illumination method based on a double-reflector concept [16]. In comparison to the single-reflector design, this approach incorporates an additional glass component to reflect acoustic waves by an additional 90°. As a result, both the transducer array and fiber bundle are oriented in parallel. These systems all used optical fiber bundles, which caused the optical beam shape to be deformed due to rapid divergence. It is important to note that in LA-PAT, the intended imaging plane is meant to represent a cross-sectional view of the tissue beneath the transducer. However, when the optical beam shape is deformed due to rapid divergence, this linear arrangement has the potential to unintentionally record undesired signals from neighboring areas around the imaging plane, leading to artifacts and degrading image resolution.
Here, we present an easy-to-implement optical arrangement featuring a Powell lens to transform a collimated laser beam into a uniformly illuminated beamline. This low-cost design delivers nearly uniform laser light to the tissue surface chromophores, thereby increasing the efficiency of the light delivery. We anticipate that this method can prove valuable for examining surface and near-surface vasculatures, for instance in brain cortical vasculature mapping [25].
2. Materials and Methods
2.1. Brief Overview of Powell Lens
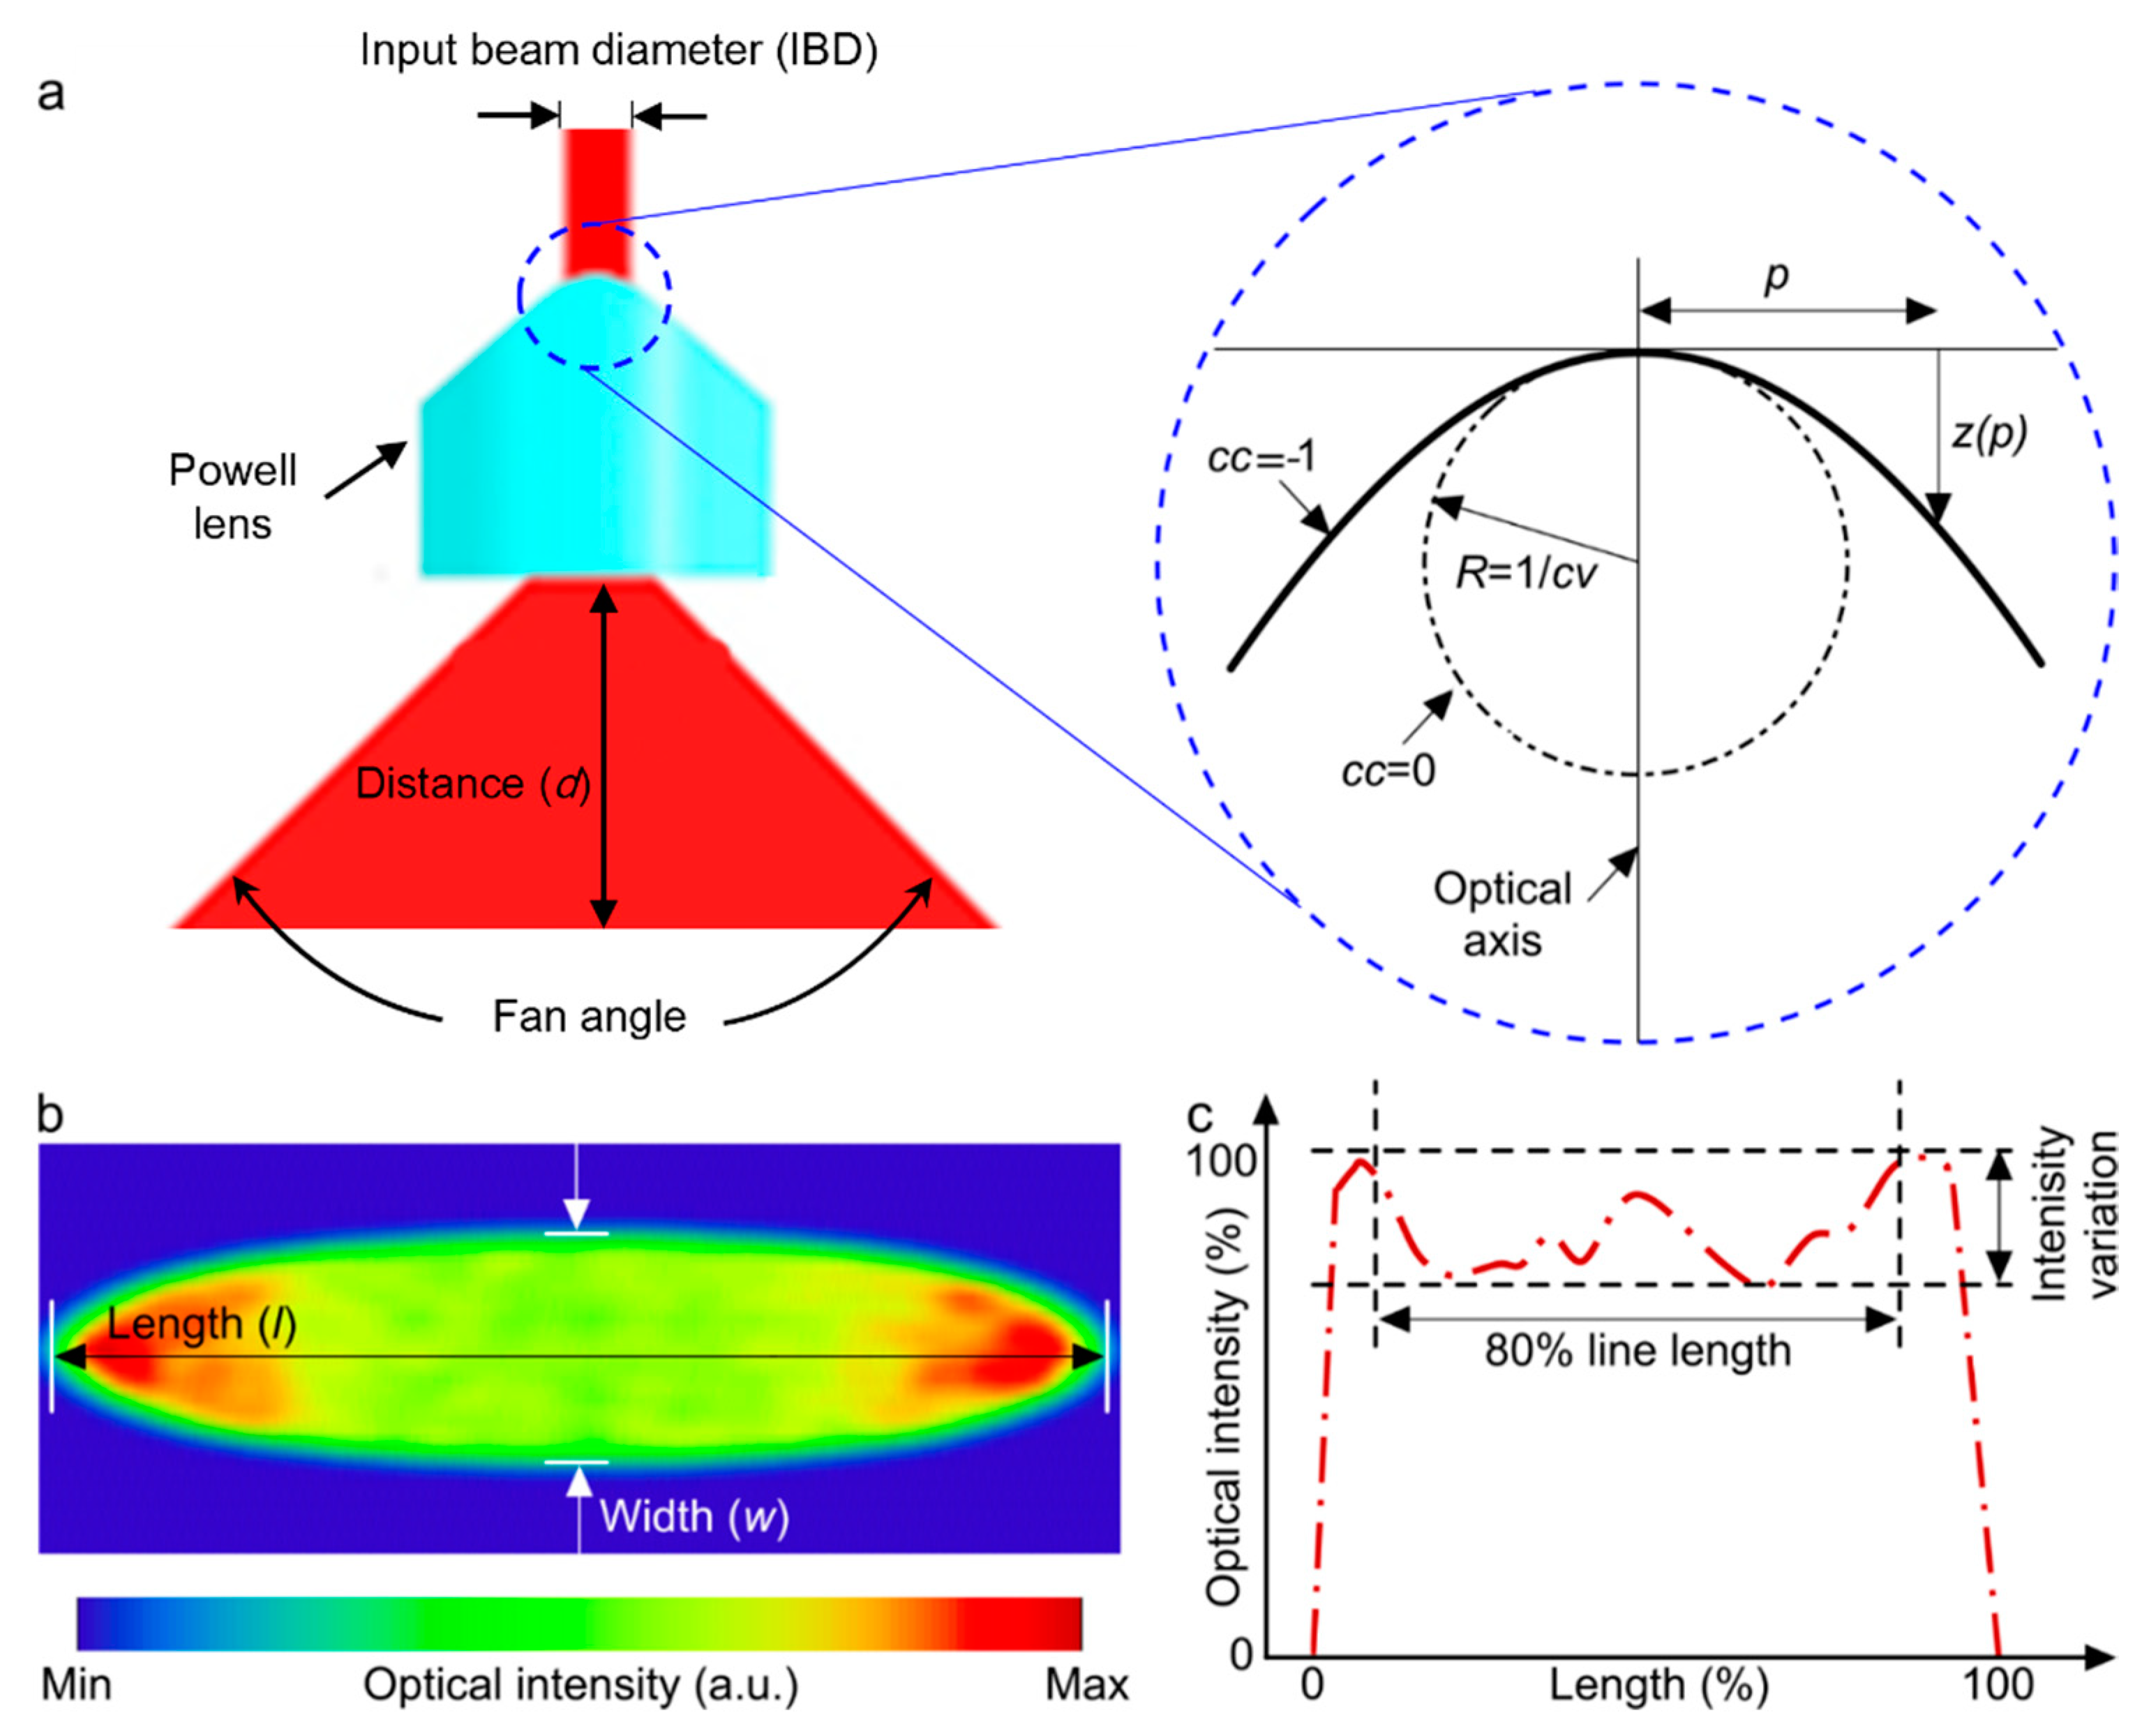
A Powell lens serves as a complex prism with an aspheric surface that redistributes a laser beam into a straight line with nearly uniform optical density (Figure 1). It is most useful in situations requiring the conversion of a laser beam into a consistent straight line with uniform brightness spanning its entire length [26]. The Powell lens can produce a more uniform intensity in comparison to the cylindrical lens [27] and in comparison with diffractive optical elements. Although they can achieve almost uniform intensity, the primary issue with these elements is their inherent loss. Diffractive elements often exhibit significant loss caused by the back-scattering effect of light. For example, the engineered diffuser in Thorlabs shows 10% loss [28]. Within the Powell lens, there are two key parameters to consider: the curvature radius (cv) and the conic constant (cc) (Figure 1b). These parameters play a crucial role in shaping both the intensity profile of the resulting beam and its fan angle [29], as depicted in Figure 1. Additionally, the choice of the input beam diameter (IBD) is made with the aim of optimizing the distribution of energy across the beam profile. The lens’s fan angle should be selected in such a way as to produce a beamline of equivalent length to the field of view of the transducer array at an appropriate distance relative to the location of the imaging target.
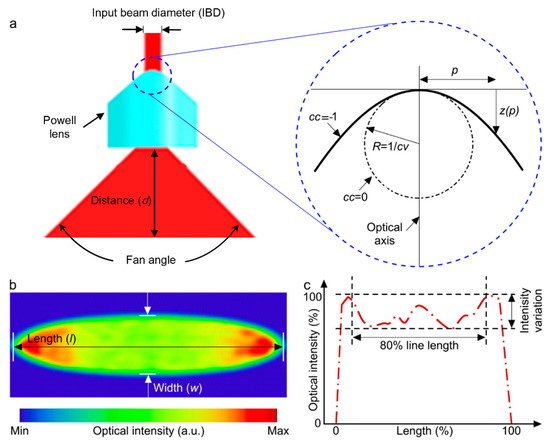
Figure 1.
(a) Illustration depicting beam expansion through the utilization of a Powell lens. The blue dotted circle is enlarged to highlight various design parameters of the Powell lens. (b) Simulated acquired beam profile following the passage through the Powell lens. (c) Normalized intensity line profile along the central axis of the beam profile depicted in (b). The evaluation of line variability (LV) and contained power (CP) utilizes the central 80% of the line length.
The mathematical expression for describing the surface of a Powell lens is shown in Equation (1). Standard aspherical surfaces can be formulated as follows [30]:
where z signifies the displacement along the optical axis starting from the vertex (surface profile), situated at a distance p away from the optical axis. The shape of the lens’s curved surface is dependent upon the magnitude and sign of cc, where specific values of cc (cc = 0, cc > −1, cc = −1, and cc < −1) correspond to a sphere, ellipse, parabola, and hyperbola, respectively, and Ai are polynomial terms. For Powell lenses, Ai values are set to zero, cc < −1, and [31].
There are two key parameters used to assess the performance of a Powell lens: (1) line variability (LV) and (2) contained power (CP). LV is defined as the , measured across the central 80% of the beam’s length. CP refers to the measured power encompassed within the central 80% of the beam’s line profile.
2.2. PAI System Specification
The PA system includes an Nd:YAG laser (SPL-532, Changchun Optoelectronics Inc., Changchun, China), which delivers optical pulses of 8 ns pulse duration at 10 Hz at 532 nm wavelength. The collimated beam from the laser was coupled to the 8.89 mm diameter Powell lens (PL0175, ThorLabs, Newton, NJ, USA) through an iris (SM2D25D, Thorlabs, Newton, NJ, USA). The Powell lens utilized in these experiments is crafted from N-SF6 (N-SF6, 805254.337), exhibiting minimal absorption at 532 nm, with over 97% transmittance at that wavelength. Additionally, the lens features an anti-reflective coating made of Magnesium Fluoride (MgF2), which reflects only 0.6863% at 532 nm. Consequently, the loss rate for the Powell lens used in this manuscript is less than 4% [27]. A 5 MHz center frequency and 128-element linear-array ultrasound transducer (L7-4, ATL Philips, Priority Medical, Inc., Hendersonville, TN, USA) with 70% bandwidth is utilized as the PA signal receiver. For data acquisition and image reconstruction, a 128-channel high-frequency ultrasound imaging system (Vantage 128, Verasonics, Inc., Kirkland, WA, USA) is used.
2.3. Simulation Study
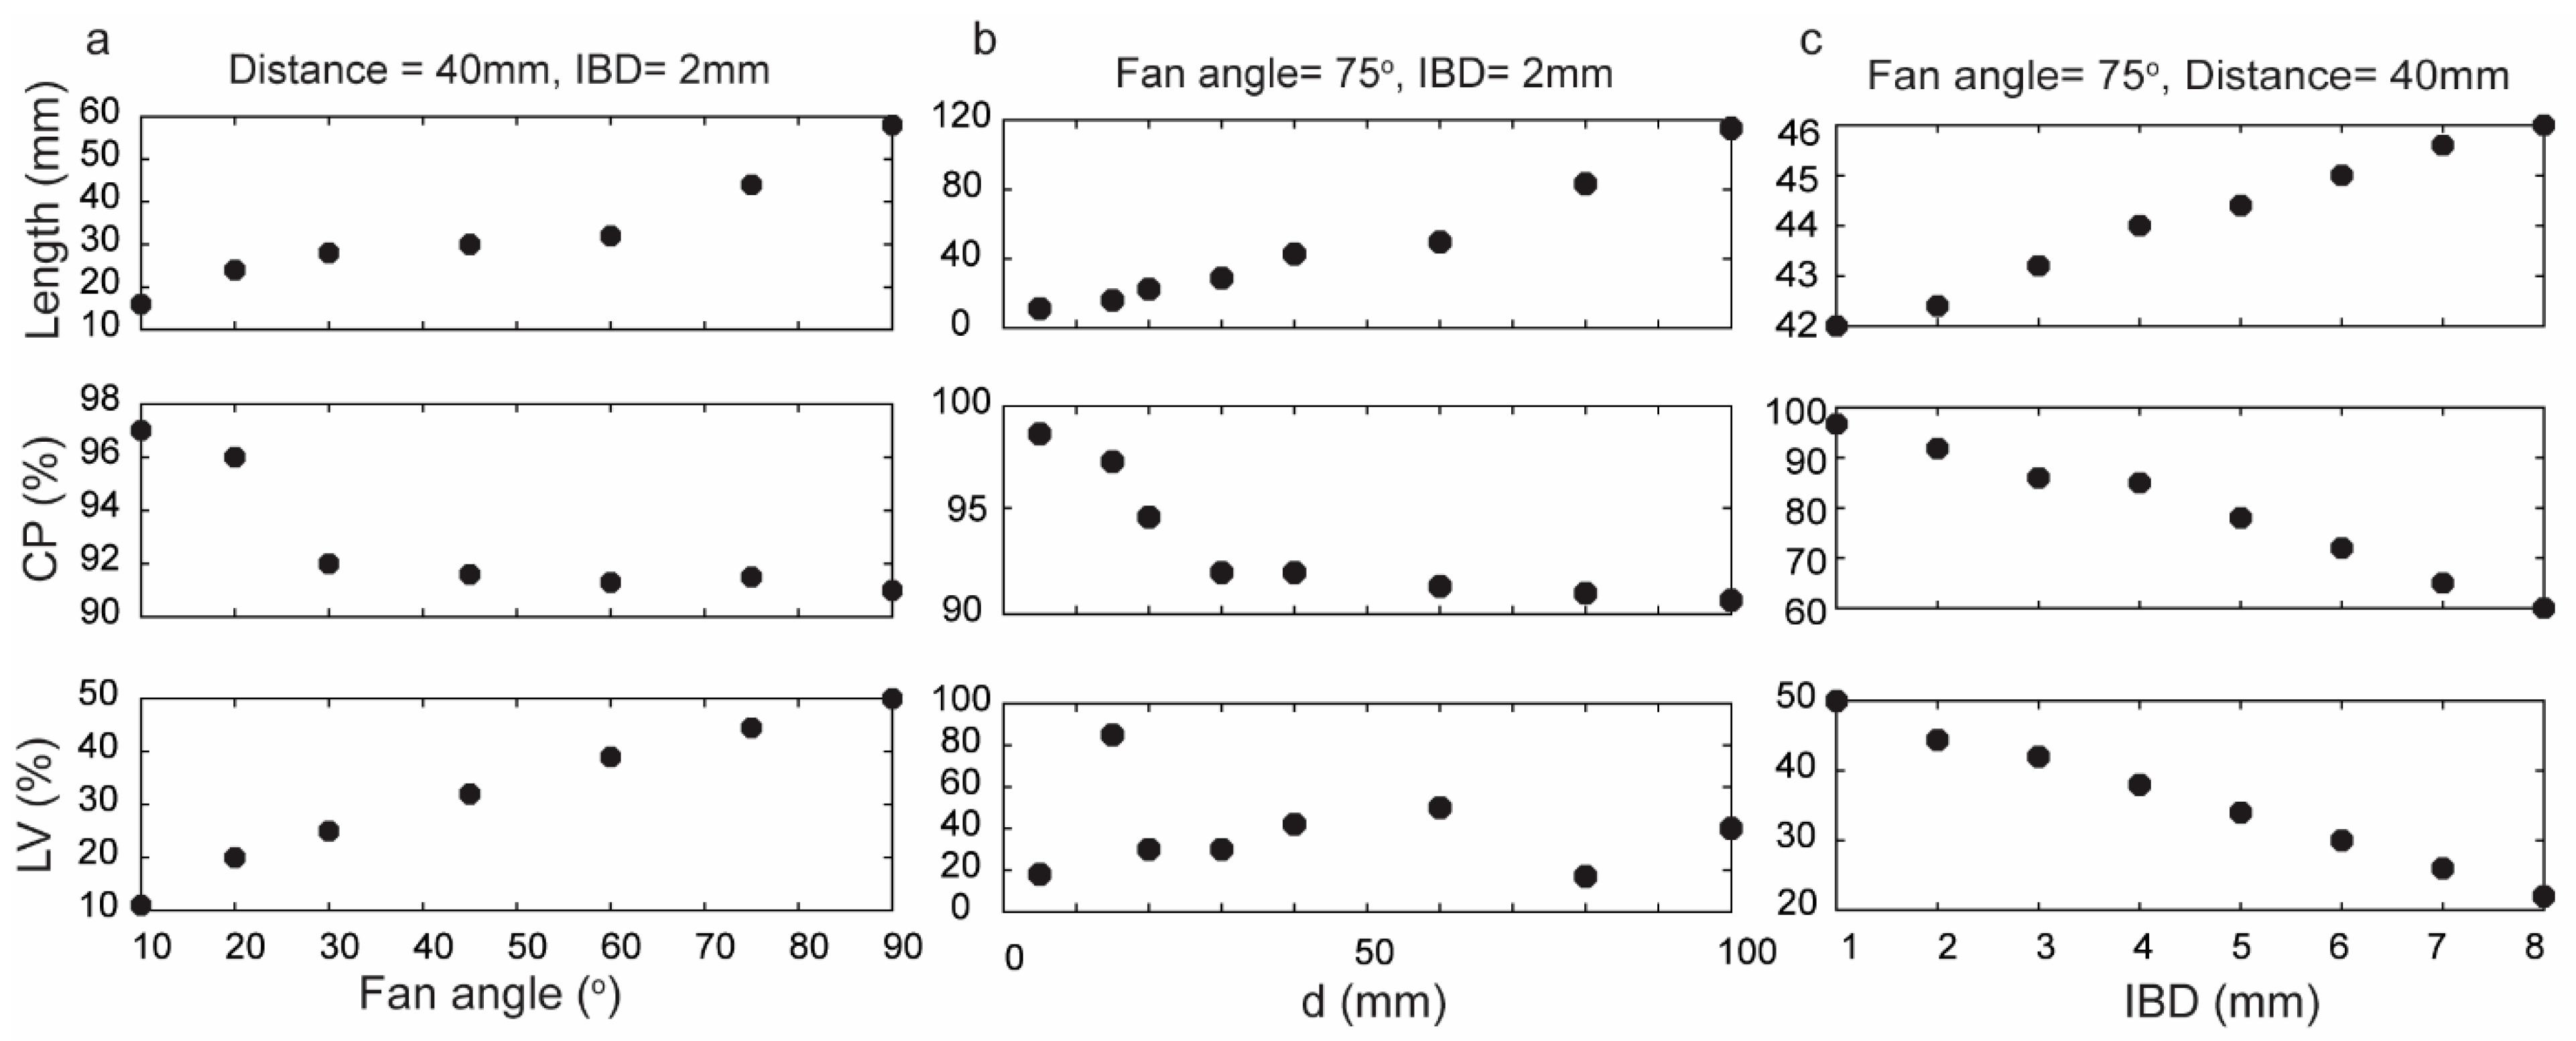
The impact of various design parameters of the Powell lens, including fan angle, the distance between the lens and the imaging target, and IBD, was investigated (Figure 2) through optical simulations using ZEMAX OpticStudio 2023 R1.02 with 100 million rays for tracing. In each simulation run, two of these parameters were held constant while the third one was systematically varied. The input energy for all cases was maintained at 1 millijoule, and a rectangular detector was employed to capture the 2D beam profile produced by the Powell lens. Initially, this study focused on examining the influence of different fan angles, specifically 10°, 20°, 30°, 45°, 60°, 75°, and 90°. The selection of these fan angles was based on the availability of Powell lenses from various companies, such as Thorlabs, Edmund Optics, Laserline Optics Canada, and Laser Tools Co., Inc. Subsequently, with the fan angle and IBD held constant, the investigation shifted to explore the effect of varying distances between the lens and the imaging target, ranging from 5 mm to 100 mm. Lastly, while maintaining a constant fan angle and distance between the lens and the imaging target, this study delved into the impact of different IBDs, encompassing values of 1, 2, 3, 4, 6, 7, and 8 mm.
2.4. Experimental Study
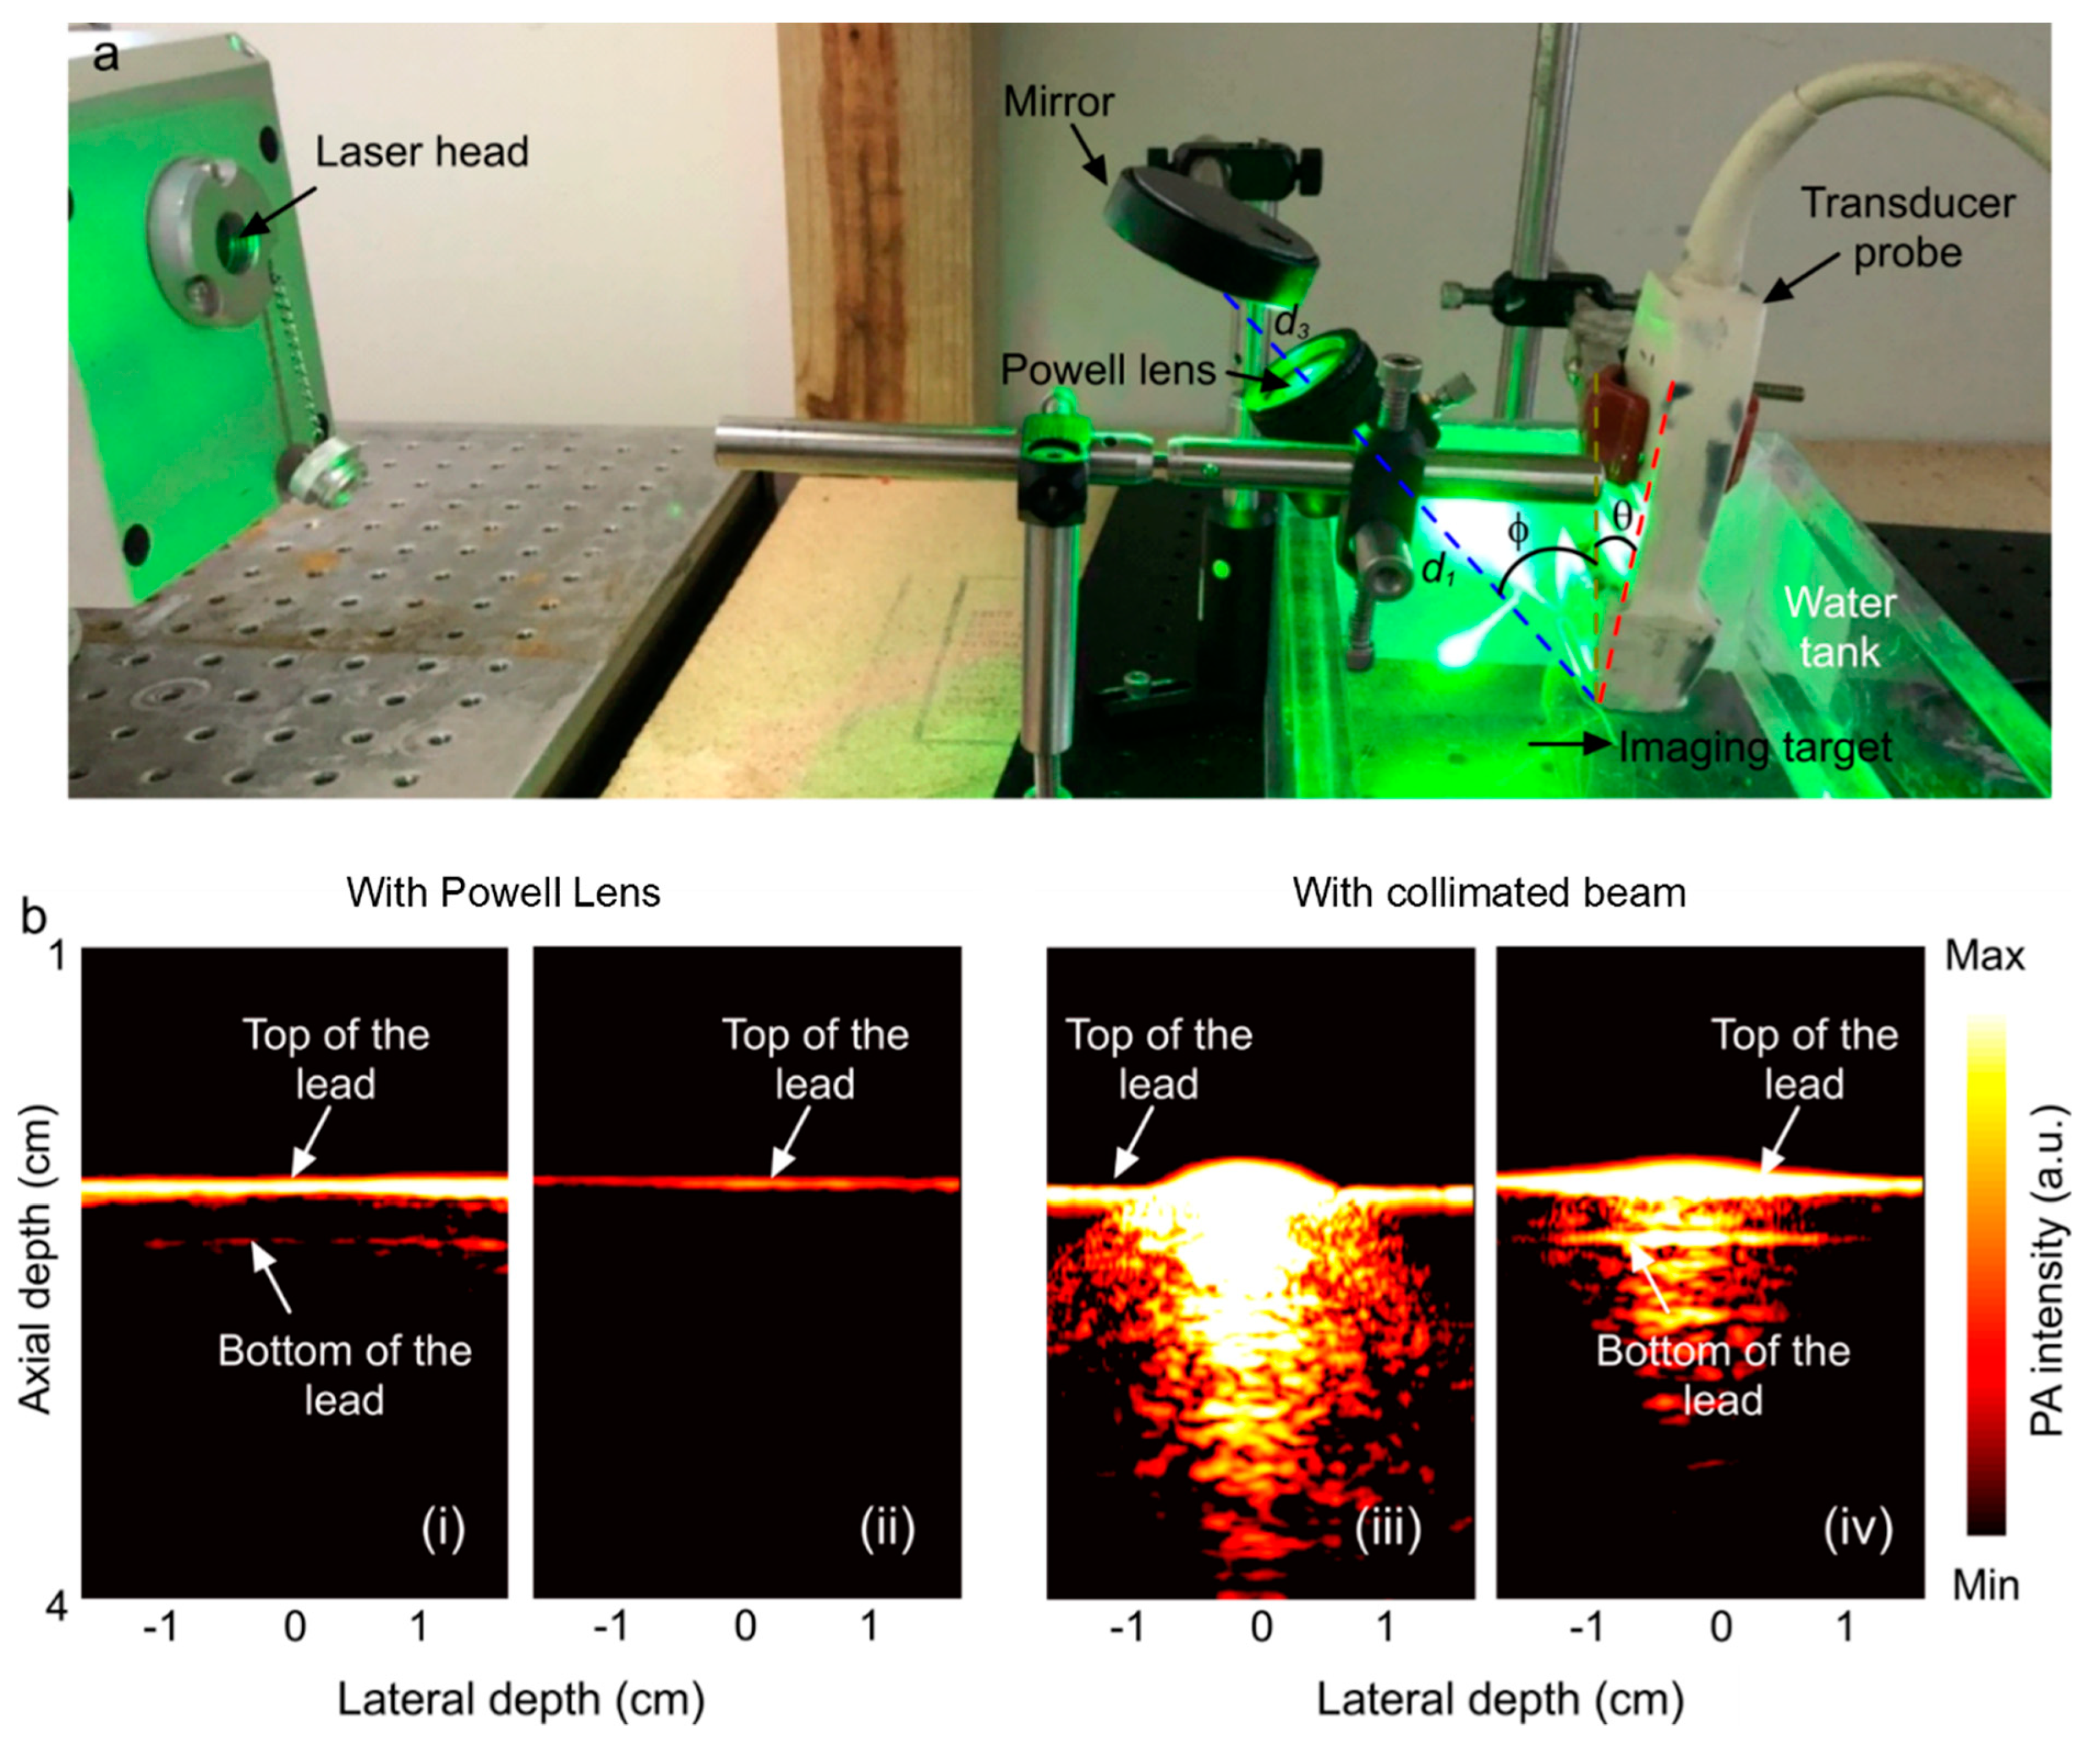
Two experiments were performed. First, to compare with the simulation, the beamline profile was investigated for a range of IBDs (1, 2, 3, 4 mm) by placing plain white paper at a 5 cm distance from the Powell lens and imaging the beamline with a smartphone camera (Figure 3). Second, a phantom made of pencil lead (composed of graphite with dimensions of 40 mm in length and 2 mm in diameter) in water and intralipid solution was imaged with two illumination schemes, collimated beam illumination off of a mirror (BB2-E02, Thorlabs, Newton, NJ, USA) with a ~2 inch diameter and Powell lens illumination off of the same mirror. (In the experiment employing the collimated beam, we utilized a 30 mm input beam diameter and 7 mJ laser power to illuminate the target. In contrast, for the Powell lens experiment, we adjusted the input beam diameter to 2 mm and reduced the laser power to 1 mJ to safeguard the lens.) Assuming a vertical plane at the location of the phantom, the transducer was angled at θ = 5° from this plane to image the phantom. The collimated beam and beamline illuminated the phantom at an angle of φ = −37° to the vertical plane at the location of the phantom. The transducer was 2 cm away from the phantom, and the Powell lens was 5 cm from the phantom with a light-guiding mirror 3 cm above the Powell lens. The setup configuration is shown in Figure 4. For the collimated beam illumination arm of the experiment, the setup is the same as shown in Figure 4 but with the Powell lens removed. For all experiments, a total illumination energy of 7 mJ was used and measured by an energy meter (QE12SP-H-MT-D0, Gentec-EO, Quebec, QC, Canada) either beyond the Powell lens or after the mirror.
3. Results
3.1. Simulation Results
Various fan angles were employed to illustrate their impact on the performance of the Powell lens, as depicted in Figure 2a (for these simulations, IBD was maintained at 2 mm, and the distance between the Powell lens and the detector was 40 mm). Smaller fan angles yielded maximum CP but at the expense of a shorter beam length. In other words, for cases where the transducer field of view (FOV) is less than approximately 15 mm, better Powell lens performance can be achieved by utilizing smaller fan angles. Moreover, LV decreased from 50% to 11% as the fan angle decreased from 90° to 10°, indicating that smaller fan angles show better uniformity. For example, Figure 2a indicates that a Powell lens with a 10° fan angle exhibits excellent CP of 97%, and LV of approximately 11%. Nonetheless, the resulting line length is only 16 mm, which is insufficient for utilization in LA-PAT when large aperture-size ultrasound transducers, such as L7-4, are used.
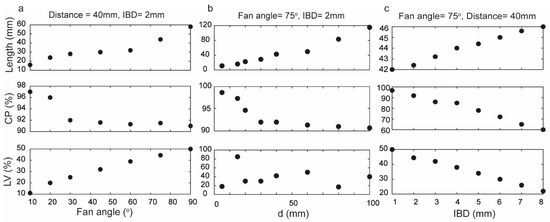
Figure 2.
Assessment of Powell lens performance in terms of contained power (CP), beam profile length (length), and line variability (LV) when varying fan angle, distance to target d, and input beam diameter (IBD). (a) Fan angles varied 10–90° (d = 40 mm, IBD = 2 mm), (b) d varied 5–100 mm (fan angle = 75°, IBD = 2 mm), and (c) IBD varied 1–8 mm (fan angle = 75°, d = 40 mm).
For this work, we used an L7-4 as an ultrasound transducer (128 elements with an element size of 7 mm × 0.283 mm (height × width) and a kerf width of 0.025 mm), and according to the simulation results, the most suitable fan angle for this transducer with these conditions is 75°. Figure 2b illustrates the impact of altering the distance between the Powell lens and the imaging target (d) while maintaining a constant fan angle of 75°. As the distance increases, the energy contained within the beamline decreases. LV exhibits fluctuation at different distances between the tissue and the Powell lens. Consequently, we cannot use LV to design a suitable distance and must rely instead on CP and beam profile length. Moreover, when selecting the distance, it is crucial to factor in the working distance specifications of the PAI imaging system, considering both the system’s requirements and the optimal working distance necessary for precise and effective imaging. Consequently, the working distance can be impacted by the desired illuminated area for efficient imaging, a factor determined by the field of view of the transducer. Throughout the simulations described in Figure 2a,b, the beam profile width (Figure 1c) equaled IBD, which was set at 2 mm. In Figure 2c, we varied IBD from 1 to 8 mm and observed a direct relationship between beam profile length and IBD, an inverse relationship between LV and IBD, and an inverse relationship between CP and IBD. Although a higher IBD results in improved uniformity, it also leads to a drop in contained power.
3.2. Experimental Results
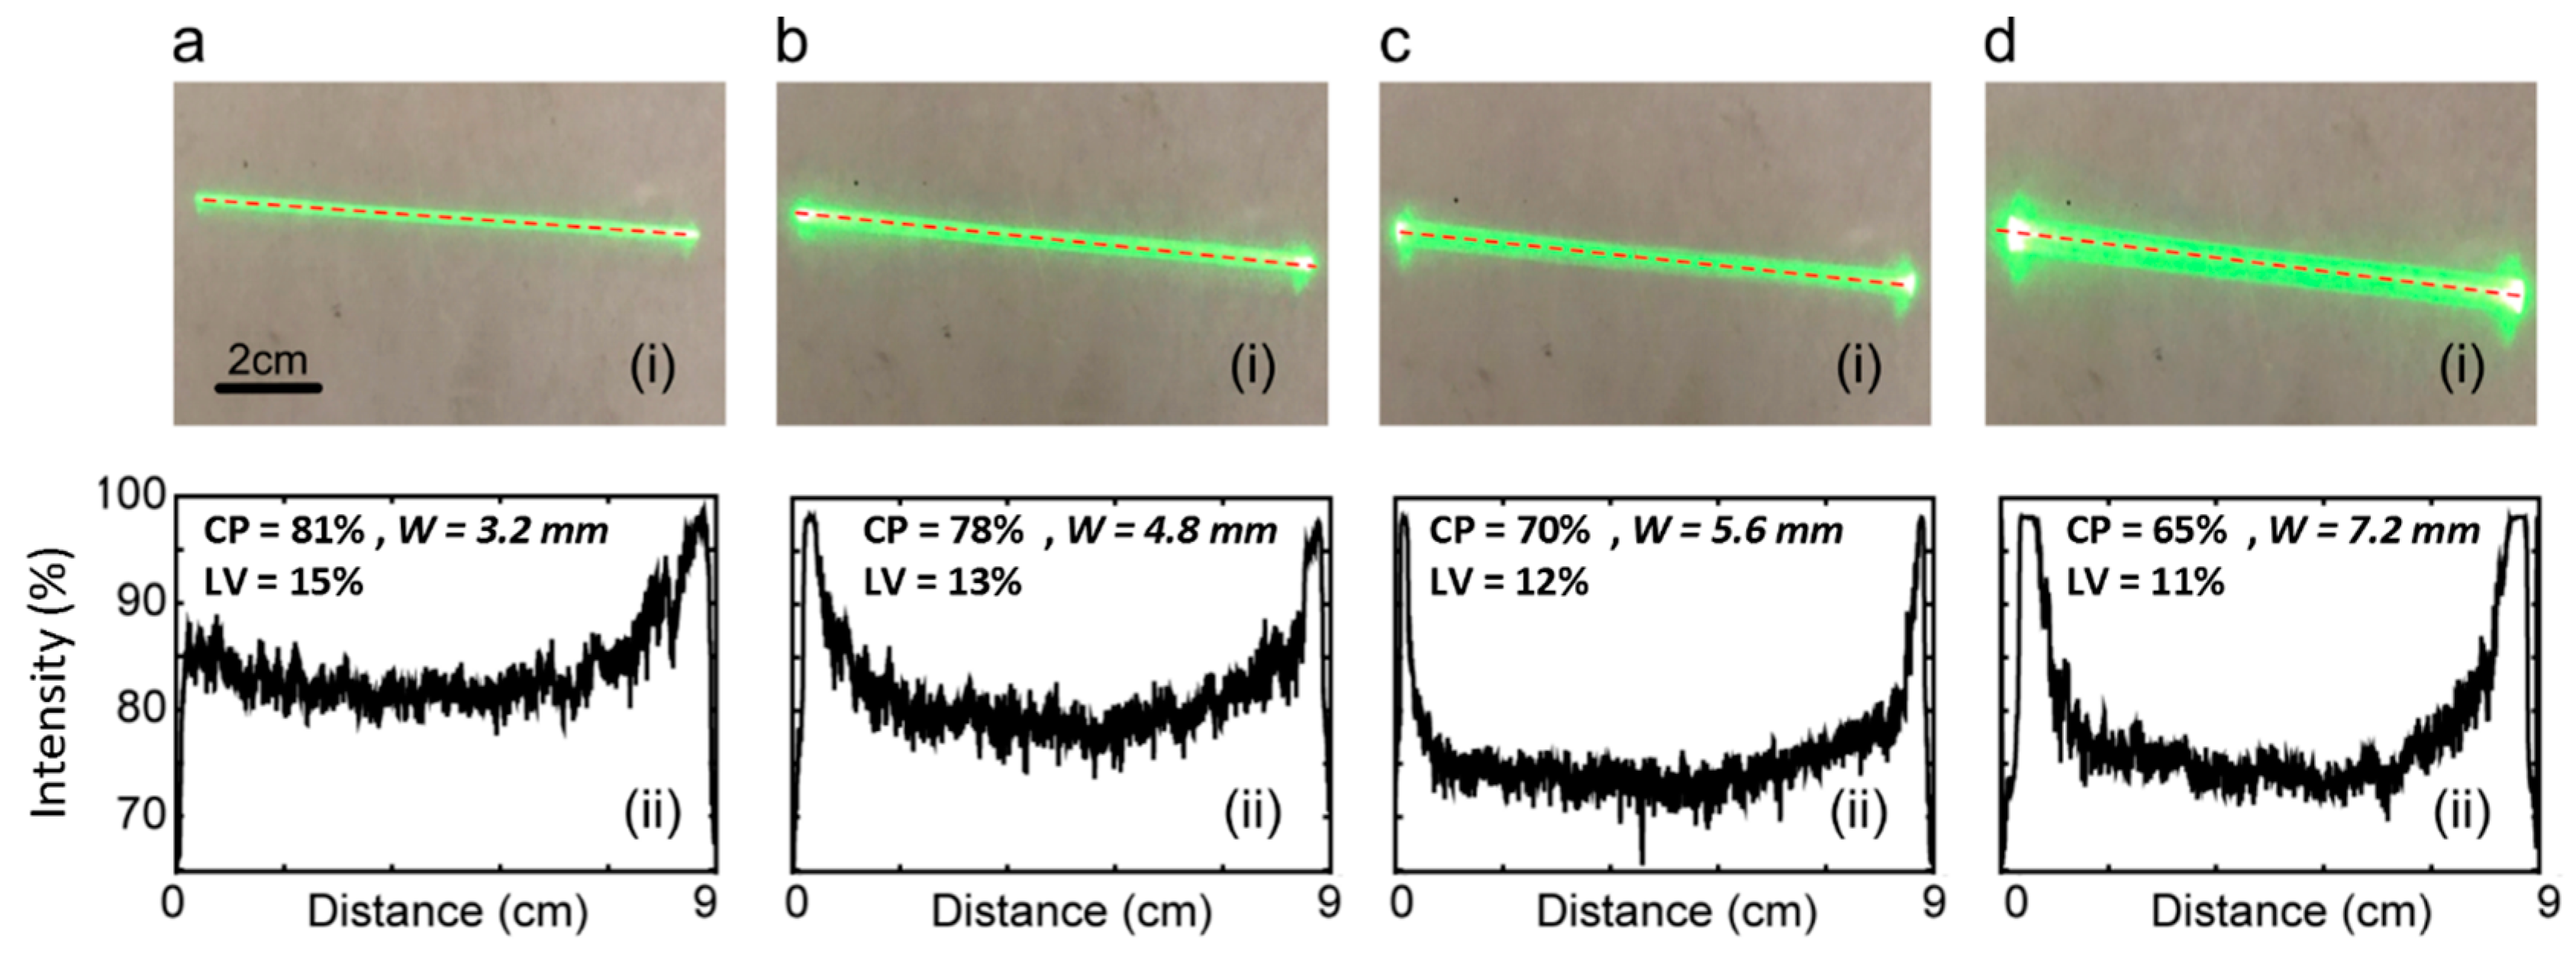
Figure 3 (i) displays the actual beam shape obtained from the experiment, while Figure 3 (ii) presents the corresponding line profiles (the Powell lens utilized in the experiment is the PL0175 model from ThorLabs. The simulated outcomes pertaining to this experiment are illustrated in Figure 2b). Visual inspection shows that increasing IBD values correspond to increasing beam widths. Reviewing the line profiles, we note that an increase in IBD causes a notable rise in the energy concentration at the two ends of the beamline, resulting in a reduction in CP (central 80% in line profile, as shown in Figure 1c). Specifically, for IBDs of 1 mm, 2 mm, 3 mm, and 4 mm, the contained power values are 81%, 78%, 70%, and 65%, respectively. Concurrently, LV values are 15%, 13%, 12%, and 11%, respectively. The optimized input beam diameter is capable of producing a narrower width profile, effectively confining the energy within a slimmer line. Nevertheless, according to the experimental findings depicted in Figure 3, a thinner input beam diameter results in an increased contained power but also leads to higher line variability, which is a drawback. Therefore, there exists a trade-off when choosing between contained power and line variability, solely considering the input beam diameter. In the next experiment, we employed a 2 mm input beam diameter in alignment with the thickness of the lead phantom utilized in this study.
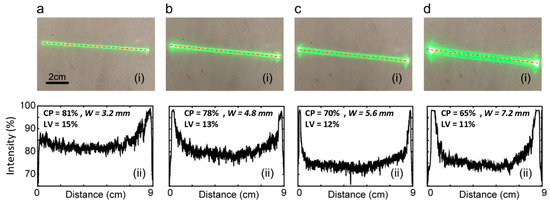
Figure 3.
Beam profiles (i) and line intensity profiles-collected across the center line of beam length, shown by dotted lines in beam profiles (ii). Images collected on white paper at a 50 mm distance from the Powell lens (75° fan angle). IBD was varied as follows: (a) 1 mm, (b) 2 mm, (c) 3 mm, and (d) 4 mm. IBD = input beam diameter, CP = contained power, LV = line variability.
3.3. Experimental Comparison between Collimated Beam Illumination and Powell Lens Illumination
Figure 4 provides real-time reconstructions of the lead phantom using a Verasonics platform with either collimated beam illumination or Powell lens illumination. PAT images were collected in both non-scattering water media and scattering intralipid solution. In non-scattering water, the Powell lens illumination demonstrates greatly improved homogeneity of illumination along the lead length, where collimated beam illumination saturates the spot of illumination. The introduction of scattering media improves saturation. As previously stated, our experiments utilized the L7-4 ultrasound transducer, featuring an imaging plane length of 45 mm. According to the initial simulation findings illustrated in Figure 2a, a Powell lens with a fan angle of 75 degrees satisfies this criterion. In this experimental setup, the transducer was positioned 2 cm away from the phantom, while the Powell lens was placed 5 cm from the phantom, with a light-guiding mirror situated 3 cm above the Powell lens. Based on the results presented in Figure 3b, the contained power and line variability were measured at 78% and 13%, respectively. It is worth mentioning that we intentionally reduced the laser energy to safeguard the Powell lens from potential damage. As a result, the decreased laser power restricted the visibility of the bottom portion of the sample, in contrast to the collimated beam method, which utilizes higher energy levels. Specifically, in the collimated beam experiment, we utilized a 30 mm input beam diameter and 7 mJ laser power. However, in the Powell lens experiment, we adjusted the input beam diameter to 2 mm and the laser power to 1 mJ to ensure the lens’s safety.
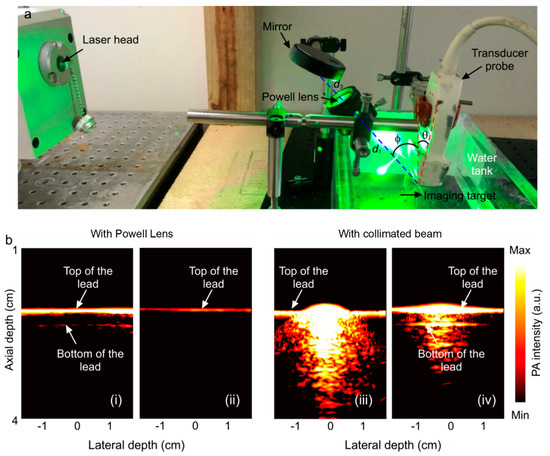
Figure 4.
(a) Experimental setup (θ = 5°, φ = 37°, d1= distance from the Powell lens to phantom = 10 cm, d3 = distance from the mirror to the Powell lens = 3 cm). The imaging target is a phantom comprising pencil lead in water or an intralipid solution (water shown). The setup for collimated beam illumination is the same, except the Powell lens has been removed. (b) Reconstructed PA image of the phantom acquired with Powell lens illumination (i) in water and (ii) in intralipid solution; reconstructed PA image of the phantom acquired with collimated beam illumination (iii) in water and (iv) in intralipid.
4. Discussion
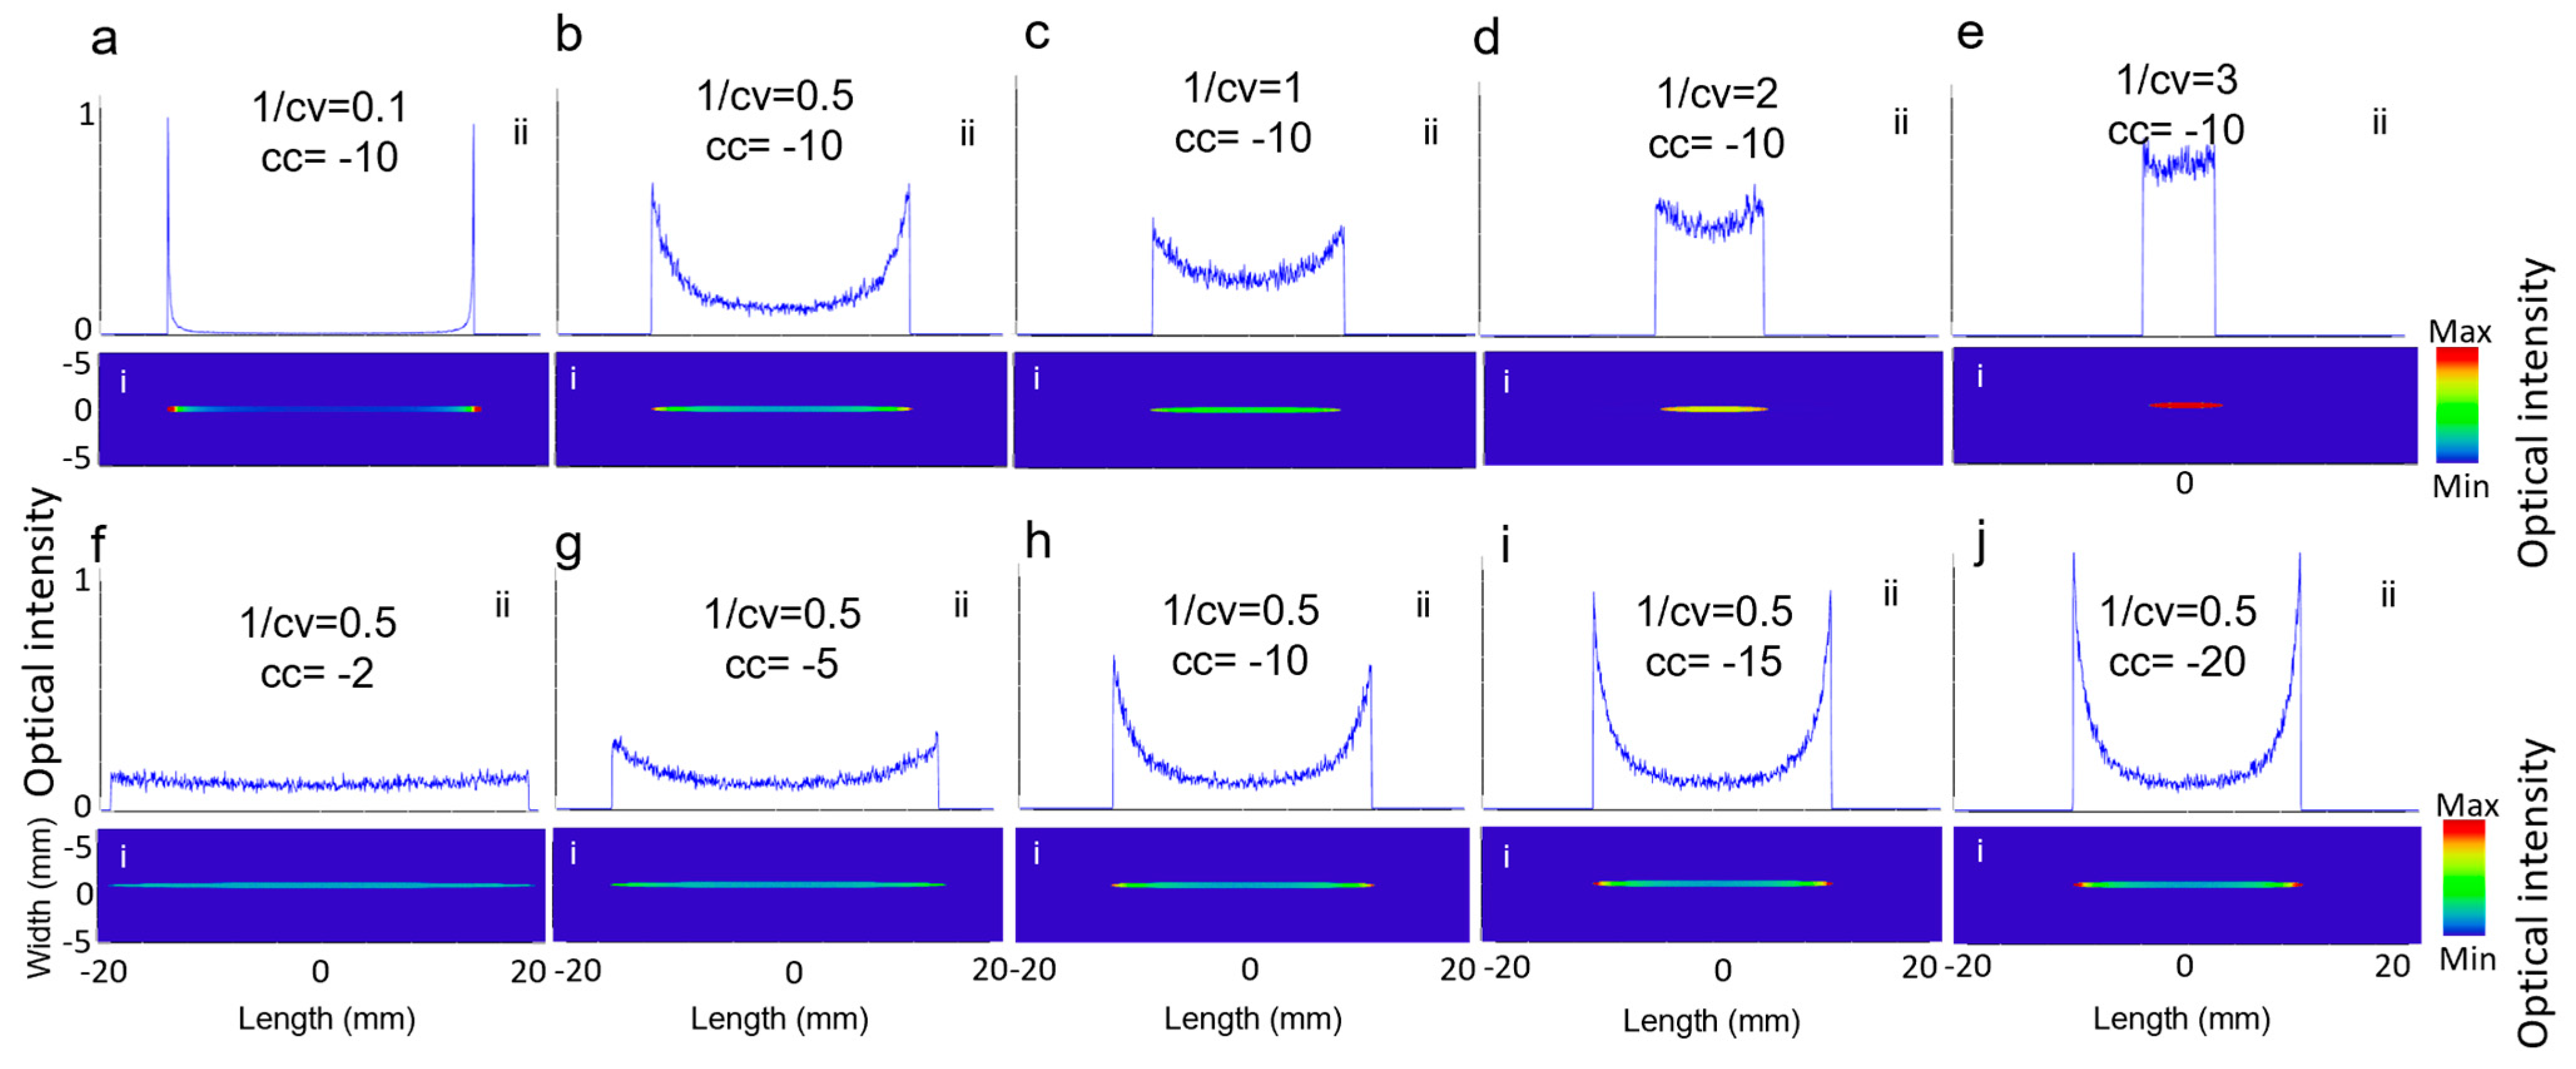
As described in Equation (1), the two key parameters in designing the Powell lens are conic constant, shown with cc, and 1/radius of curvature, shown with cv, which are visually represented in Figure 1a. To understand their impact on the beam profile generated by the Powell lens, we conducted simulations under two scenarios. In the first scenario, we set cc to −10 and varied cv, while in the second scenario, we set cv to 2 and varied cc. Figure 5 illustrates the influence of cc and cv on the resulting beam profile. In Figure 5a–e, cc remained constant, and as cv decreased, CP increased, but the intensity length decreased. Figure 5f–j show that cv remained unchanged and as cc decreased, both CP and intensity line length decreased, while LV increased. Therefore, choosing a lower cc shows better performance. The right and optimized cv is based on achieving the desired intensity profile length and is dependent on the transducer field of view.
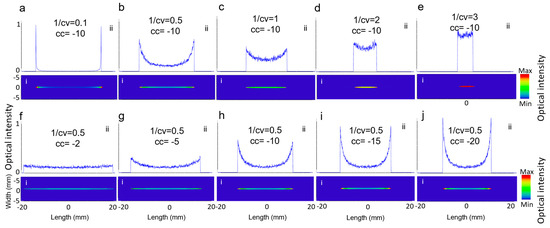
Figure 5.
(i) The 2D beam profiles and (ii) 1D intensity across the central horizontal lines for (a–e) varying cv and (f–j) varying cc.
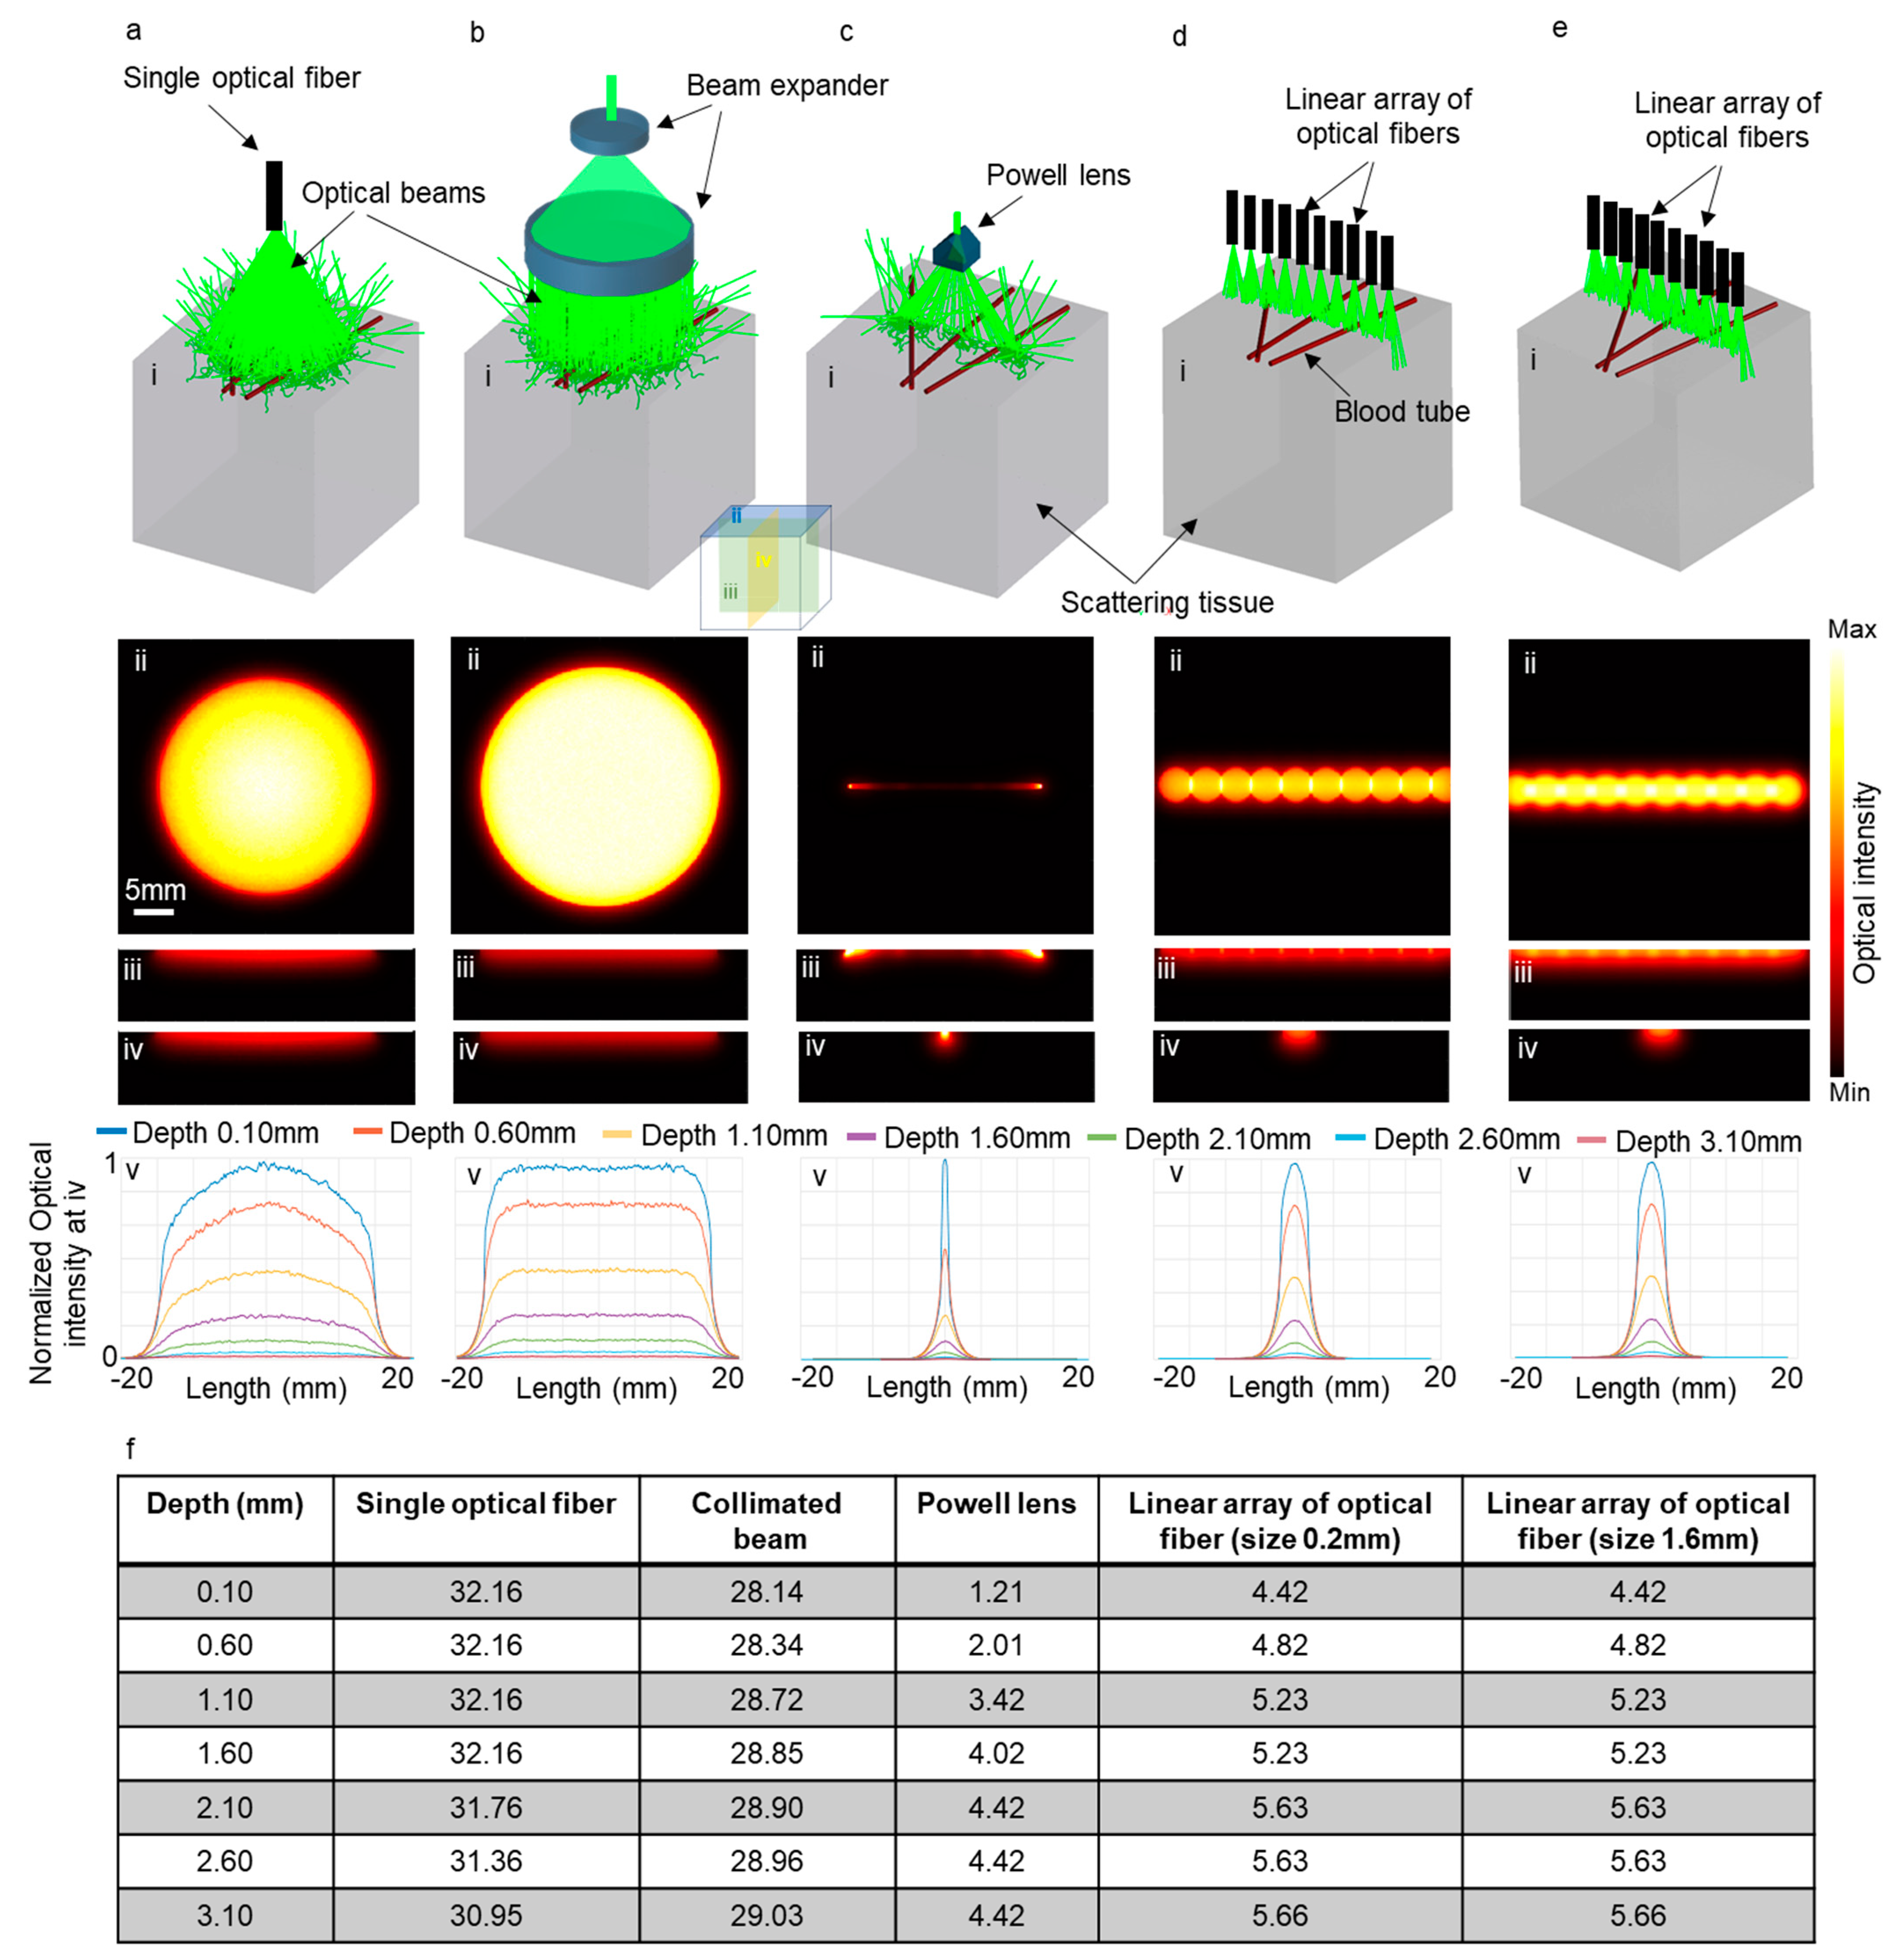
To evaluate the effectiveness of our proposed method in improving elevational resolution in scattering tissues, we conducted several simulations using Zemax. These simulations entailed modeling brain tissue with optical properties at 532 nm. We explored five scenarios, employing an optical fiber with a numerical aperture of 0.65 and diameter of 6 mm (illustrated in Figure 6a(i)), a collimated beam with a beam expander (Figure 6b(i)), the PL0175 Powell lens from ThorLabs (Figure 6c(i)), and a linear arrangement of optical fibers, comprising ten fibers with a numerical aperture of 0.22 and a diameter of 0.2 mm, as depicted in Figure 6d(i). Another linear array of optical fibers also consisting of ten fibers with a numerical aperture of 0.22 and a diameter of 1.6 mm is illustrated in Figure 6e(i). In all scenarios, the distance between the tissue surface and the output of the illuminating system remained fixed at 2 cm.
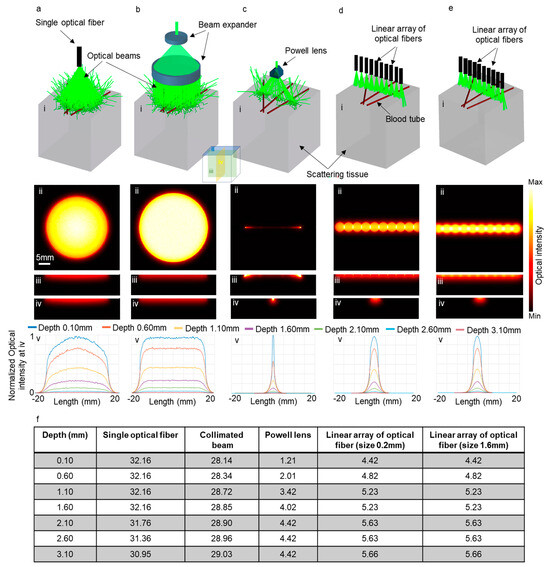
Figure 6.
Five different illumination scenarios utilizing (a) a large single optical fiber, (b) a collimated beam, (c) Powell lens, (d) a linear array of optical fibers with a size of 0.2 mm, and (e) a linear array of optical fibers with a size of 1.6 mm. Panel (i) presents a schematic of the illumination setups, while panels (ii), (iii), and (iv) display the optical intensity on the transverse, sagittal, and coronal planes, respectively. Panel (v) is the normalized one-dimensional optical intensity at various depths on the coronal planes, and (f) is a table showcasing the full width at half maximum (FWHM) of the graphs presented in panel (v).
Figure 6a(ii)–e(ii) depict the optical intensity on the surface of the tissue (transverse plane shown as ii in Figure 6) for the corresponding scenarios. Figure 6a(iii)–e(iii) and Figure 6a(iv)–e(iv) indicate the optical intensity on the sagittal (iii) and coronal (iv) planes, respectively. Figure 6a(v)–e(v) depict the normalized one-dimensional optical intensity on the coronal planes (iv) for all scenarios at various depths. Additionally, Figure 6f presents a table detailing the full width at half maximum (FWHM) of optical intensity corresponding to the graphs in Figure 6a(v)–e(v). It is evident that the use of the Powell lens effectively confines light within a narrow line, contrasting with the use of a single optical fiber and collimated beam, which undesirably expands light in the elevational direction (coronal plane (iv planes in Figure 6)). Comparing the elevational resolution achieved using the Powell lens and the linear array of optical fibers, we observe that at depths near the surface (less than 1 mm), the Powell lens provides better elevational resolution (3.65 times more). For depths exceeding 1 mm, the Powell lens still exhibits superior elevational resolution (between 1.2 to 1.5 times). Furthermore, we experimented with two different sizes for the optical fibers in the linear array and determined that there is minimal variation in the full width at half maximum (FWHM) on the elevation plane. Both configurations exhibited nearly identical performance in the elevational direction.
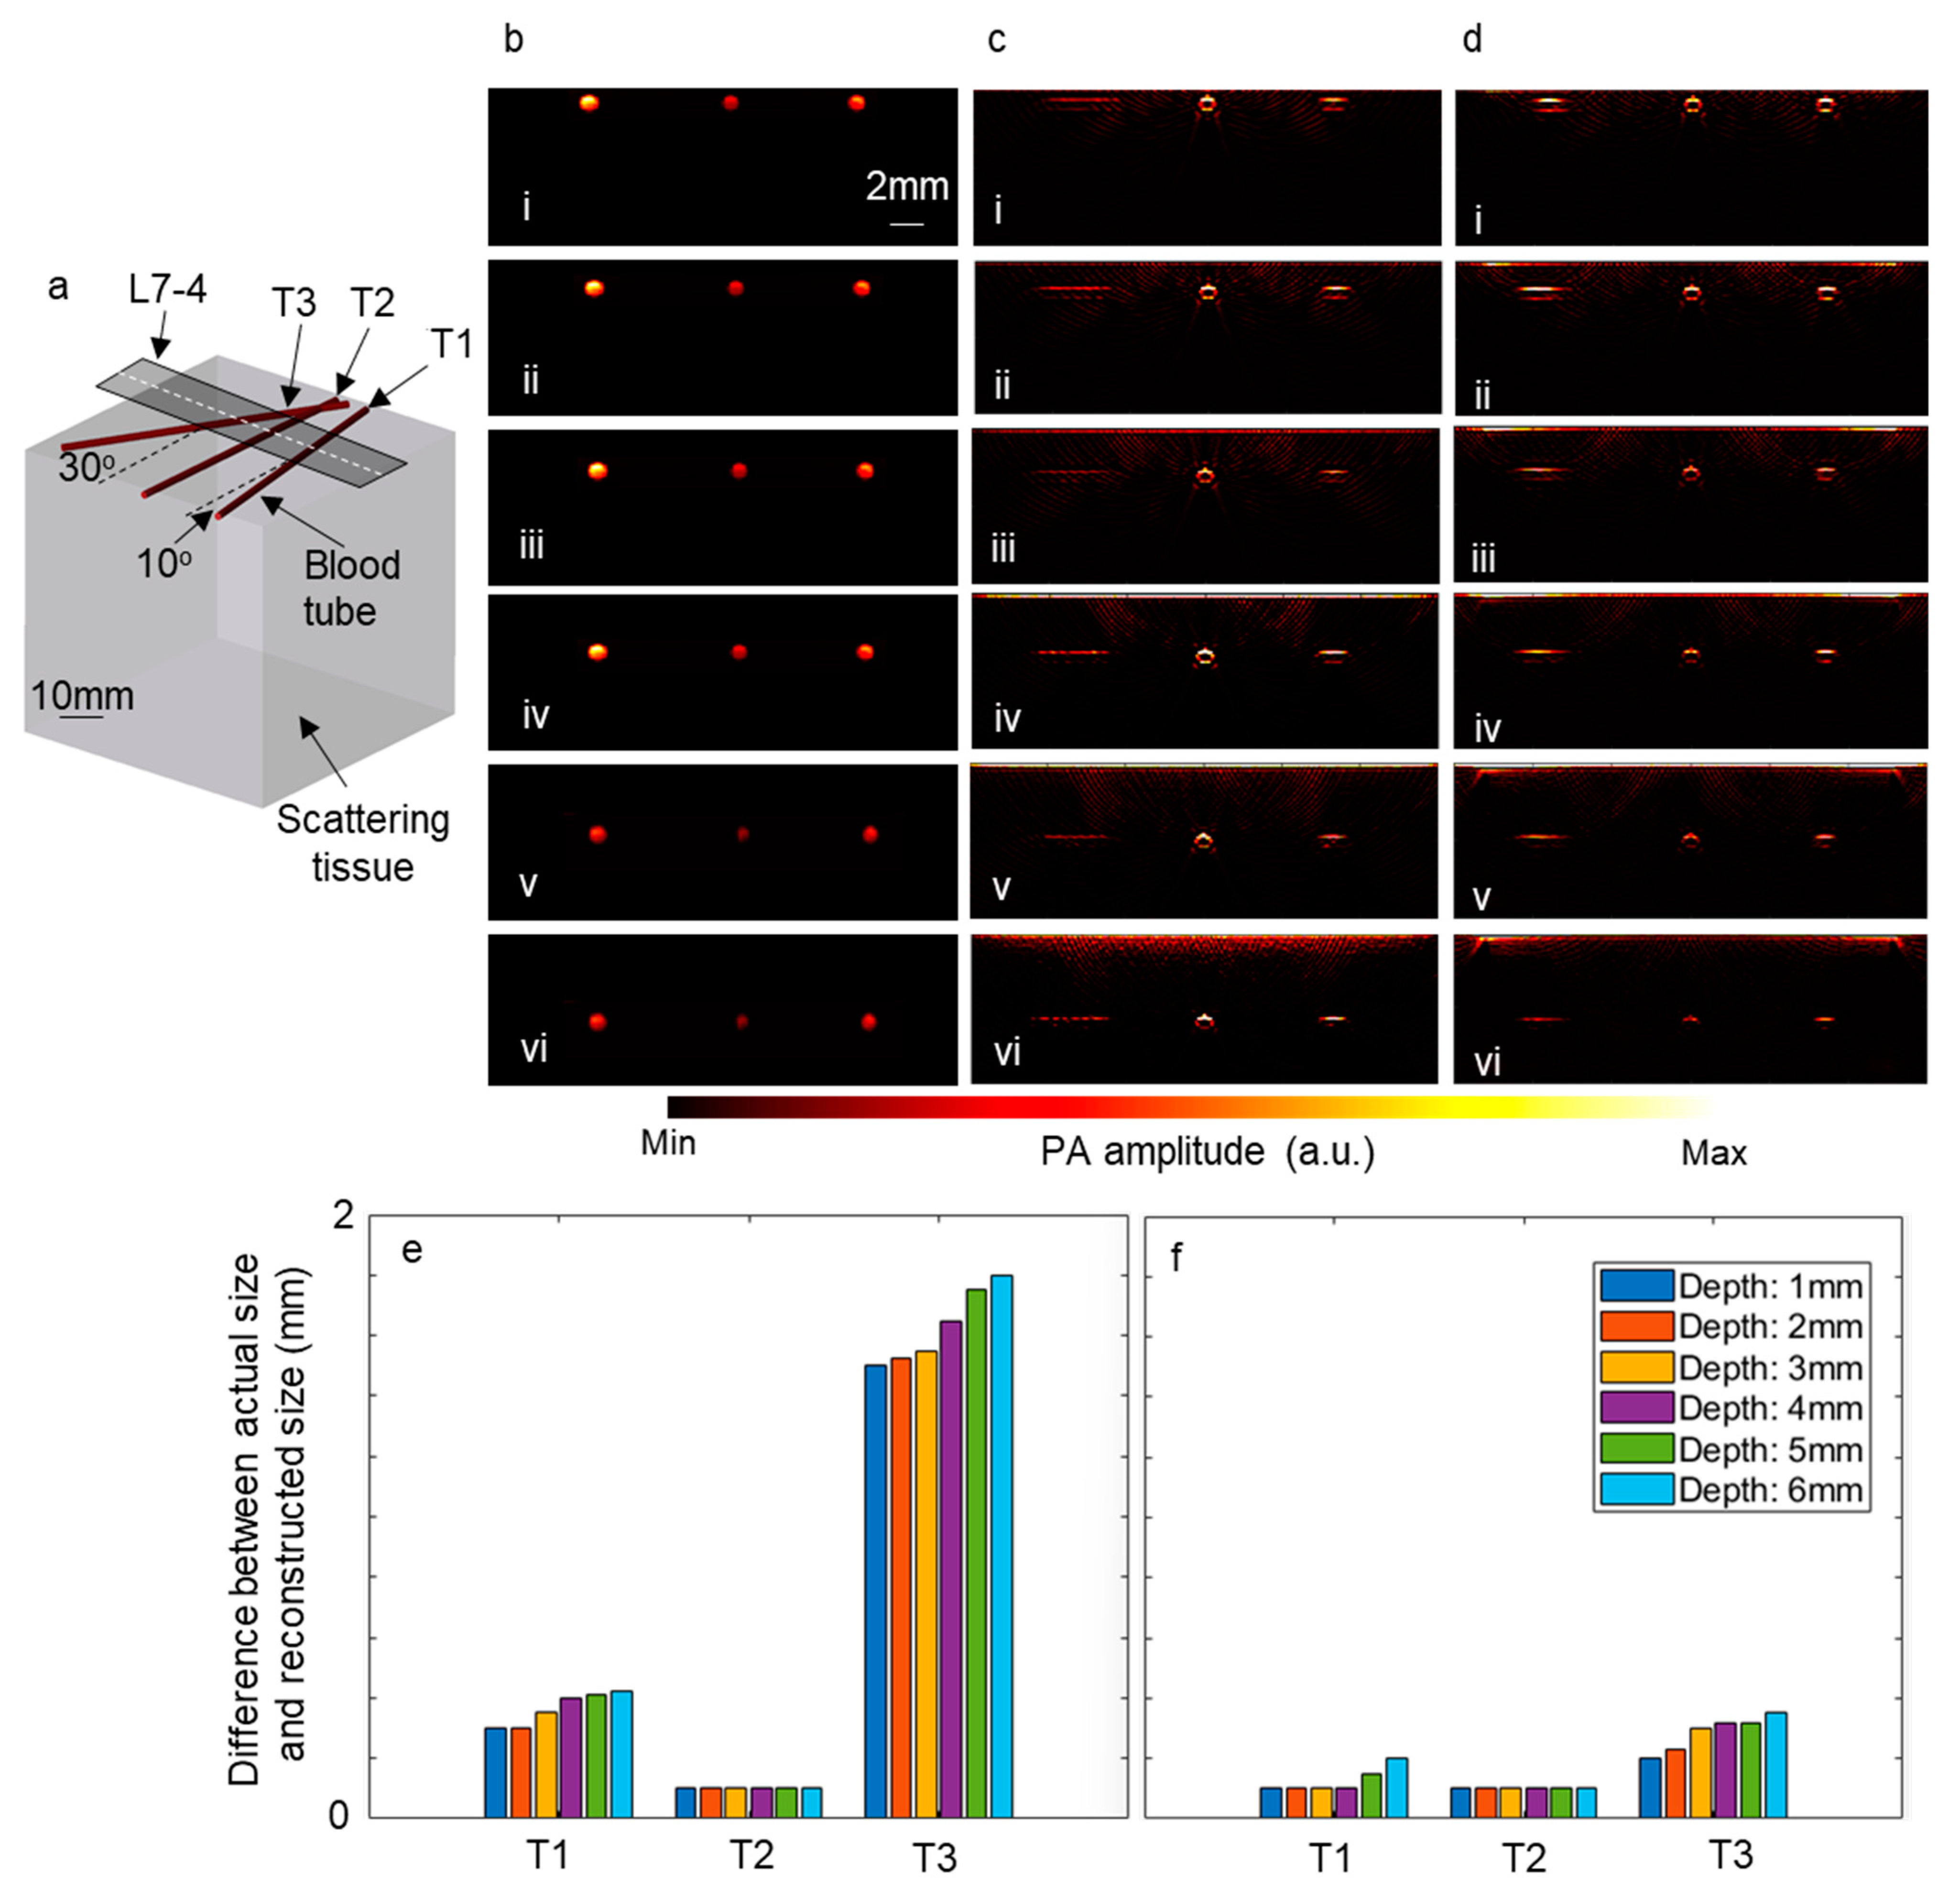
Furthermore, to explore the impact of employing a linear array of optical fibers and a Powell lens on the reconstructed images, simulations were conducted using the k-Wave toolbox (Version 1.4). In these simulations, three blood tubes were inserted into a scattering medium at three different angles, as depicted in Figure 7a. Subsequently, the tubes were moved to deeper depths, and the time reversal algorithm was utilized to reconstruct the image directly beneath the ultrasound transducer. The computational grid size was set to 600 × 600 × 600 voxels, with each voxel measuring 90 μm. L7-4 ultrasound transducers comprising 128 elements were modeled for these simulations. Figure 7b–d display the initial pressure, reconstructed images using a linear array of optical fibers, and those using a Powell lens, respectively, on the slice underneath the white dashed line in Figure 7a. Figure 7b(i–vi) represent the initial pressure generated by blood tubes at depths ranging from 1 mm to 6 mm, with increments of 1 mm. Additionally, the difference between the diameter of the blood tubes in the reconstructed images and the diameter of the blood tubes in the initial pressure image was calculated for each depth, with the results depicted in Figure 7e (using a linear array of optical fibers) and Figure 7f (using a Powell lens). It is observed that for blood tubes positioned at a 0° angle, both scenarios exhibit similar performance, while for blood tubes positioned at 10° and 30° angles, the Powell lens demonstrates superior performance.
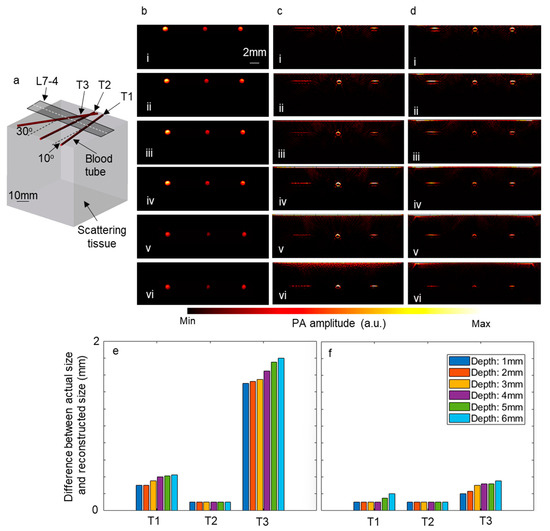
Figure 7.
The impact of employing a linear array of optical fibers and a Powell lens on reconstructed images. (a) Depicts the schematic of the modeled tissue and blood tubes. Panel (b) shows the initial pressure map beneath the dashed line in (a). Reconstructed images beneath the dashed line are depicted when using (c) a linear array of optical fibers and (d) a Powell lens. The blood tubes are positioned at depths of (i) 1 mm, (ii) 2 mm, (iii) 3 mm, (iv) 4 mm, (v) 5 mm, and (vi) 6 mm. (e) Illustrates the error between the actual size and reconstructed size of blood tubes when using a linear array of optical fibers, while (f) shows the error when using a Powell lens. L7-4: linear array ultrasound transducer.
An optimized setup in laboratory conditions produced excellent beamlines advantageous for PAI. Powell lenses of different fan angles were characterized in simulation by Zemax using different input beam diameters and different distances to the target. The actual implementation of the setup produced results comparable to simulations, as demonstrated by comparing CP, LV, and W trends in Figure 2c and Figure 3.
Positioning the optics in close proximity to the transducer face improves field-of-view characteristics. The proposed arrangement of a Powell lens improves the transmission of light to target objects by improving the distribution of light intensity. In PAI, the volume of thermal expansion determines the pressure generated and thus the acoustic signal. Improved distribution of light intensity generates a more accurate PA signal, thus improving the signal-to-noise ratio. Analysis and image reconstruction benefit from increased signal-to-noise ratios. This results in greater optical contrast and resolution. The optimized uniform illumination of tissue boosts ultrasonic signal amplitude (and reduces noise from non-specific scatter signals) and, therefore, improves the image resolution of biomolecules [32]. Clinically, the improved image quality of deep-seated lesions can assist in diagnosis, monitoring, and treatment planning [33].
Current deep tissue imaging by PAI is employed in the evaluation of therapy efficacy (e.g., chemotherapy, photodynamic therapy, radiation therapy, and antiangiogenic therapy) [34,35,36]. Biological processes and molecules are examined in metabolic imaging, pH detection, enzyme monitoring, reactive oxygen species (ROS) analysis, and metal ion detection [37]. Image-guided needle insertion for biopsy and delivery of fluids or blood drawing can also be facilitated with PAI systems [38]. PAI image guidance may also promote the accuracy of brachytherapy applicator insertion. The portability and minimization of a high-quality PAI system may expand clinical applications. These applications and many others could benefit from the proposed illumination scheme.
5. Conclusions
This study delves into the optimization of LA-PAT, a widely adopted approach for cross-sectional PAI due to its simplicity and potential for clinical applicability. An inherent challenge in this technique is the deformation of the optical beam shape caused by rapid divergence between the optical fiber and the imaging target. Divergence results in the distribution of light inside the desired cross-sectional region and the acquisition of signals outside the desired cross-sectional region in an elevational direction, thus diminishing the overall specificity of PAI. This paper introduces an innovative solution in the form of an efficient and uniform line illumination scheme based on the application of a Powell lens. Our thorough investigation into Powell lenses for elevational resolution enhancement in photoacoustic imaging has yielded significant quantitative insights and promising outcomes. Through systematic simulations, we quantified the impact of the conic constant and reciprocal of the radius of curvature variations on beam profile characteristics, revealing clear dependencies crucial for optimal design. Comparative analyses against alternative illumination setups provided numerical evidence of Powell lenses’ superiority, particularly at depths less than 1 mm, demonstrating 2.4 to 3.6 times improved performance compared to using a linear arrangement of optical fibers. Utilizing the k-Wave toolbox for image reconstruction allowed for quantitative assessment, showcasing Powell lenses’ practical advantages over linear arrays of optical fibers, such as the superior performance observed for blood tubes positioned at 10° and 30° angles. Empirical validation further confirmed theoretical predictions, reinforcing the Powell lenses’ efficacy in improving image quality. Our findings underscore the transformative potential of Powell lenses in biomedical imaging, offering versatile solutions for overcoming current limitations and paving the way for innovation in healthcare.
Author Contributions
Conceptualization, S.M.R. and K.A.; methodology, S.M.R., K.K. and R.M.; software, S.M.R., K.K. and R.M.; validation, S.M.R., K.K., R.M. and K.A.; formal analysis, S.M.R. and K.K.; resources, K.A.; writing—original draft preparation, S.M.R., K.K. and R.M.; writing—review and editing, S.M.R., R.M. and K.A.; visualization, S.M.R., R.M. and K.A.; supervision, K.A. All authors have read and agreed to the published version of the manuscript.
Funding
This research was funded by the National Institutes of Health, R01EB027769-01 and R01EB028661-01.
Institutional Review Board Statement
Not applicable.
Informed Consent Statement
Not applicable.
Data Availability Statement
Data will be provided upon reasonable request.
Conflicts of Interest
The authors declare no conflicts of interest.
References
- Wang, L.V.; Hu, S. Photoacoustic tomography: In vivo imaging from organelles to organs. Science 2012, 335, 1458–1462. [Google Scholar] [CrossRef]
- Kim, M.; Jeng, G.-S.; Pelivanov, I.; O’Donnell, M. Deep-learning image reconstruction for real-time photoacoustic system. IEEE Trans. Med. Imaging 2020, 39, 3379–3390. [Google Scholar] [CrossRef] [PubMed]
- Paul, S.; Mulani, S.; Daimary, N.; Singh, M.S. Simplified-delay-multiply-and-sum-based promising beamformer for real-time photoacoustic imaging. IEEE Trans. Instrum. Meas. 2022, 71, 1–9. [Google Scholar] [CrossRef]
- Ranjbaran, S.M.; Aghamiry, H.S.; Gholami, A.; Operto, S.; Avanaki, K. 2D-FC-ADMM reconstruction algorithm for quantitative optoacoustic tomography in a highly scattering medium: Simulation study. In Proceedings of the Photons Plus Ultrasound: Imaging and Sensing 2022, San Francisco, CA, USA, 22 January–28 February 2022; pp. 202–211. [Google Scholar]
- Ranjbaran, S.M.; Aghamiry, H.S.; Gholami, A.; Operto, S.; Avanaki, K. Quantitative Photoacoustic Tomography Using Iteratively Refined Wavefield Reconstruction Inversion: A Simulation Study. IEEE Trans. Med. Imaging 2023, 43, 874–885. [Google Scholar] [CrossRef]
- Wang, Y.; Yuan, C.; Jiang, J.; Peng, K.; Wang, B. Photoacoustic/ultrasound endoscopic imaging reconstruction algorithm based on the Approximate Gaussian acoustic field. Biosensors 2022, 12, 463. [Google Scholar] [CrossRef]
- Prakash, R.; Manwar, R.; Avanaki, K. Evaluation of 10 current image reconstruction algorithms for linear array photoacoustic imaging. J. Biophotonics 2023, 17, e202300117. [Google Scholar] [CrossRef]
- Fakhoury, J.W.; Lara, J.B.; Manwar, R.; Zafar, M.; Xu, Q.; Engel, R.; Tsoukas, M.M.; Daveluy, S.; Mehregan, D.; Avanaki, K. Photoacoustic imaging for cutaneous melanoma assessment: A comprehensive review. J. Biomed. Opt. 2024, 29, S11518. [Google Scholar] [CrossRef]
- Gonzalez, E.A.; Bell, M.A.L. Photoacoustic Imaging and Characterization of Bone in Medicine: Overview, Applications, and Outlook. Annu. Rev. Biomed. Eng. 2023, 25, 207–232. [Google Scholar] [CrossRef]
- Lee, H.; Han, S.; Kye, H.; Kim, T.-K.; Choi, W.; Kim, J. A Review on the Roles of Photoacoustic Imaging for Conventional and Novel Clinical Diagnostic Applications. Photonics 2023, 10, 904. [Google Scholar] [CrossRef]
- Mahmoodkalayeh, S.; Kratkiewicz, K.; Manwar, R.; Shahbazi, M.; Ansari, M.A.; Natarajan, G.; Asano, E.; Avanaki, K. Wavelength and pulse energy optimization for detecting hypoxia in photoacoustic imaging of the neonatal brain: A simulation study. Biomed. Opt. Express 2021, 12, 7458–7477. [Google Scholar] [CrossRef] [PubMed]
- Manwar, R.; Gelovani, J.G.; Avanaki, K. Bilirubin–biliverdin concentration measurement using photoacoustic spectroscopic analysis for determining hemorrhage age. J. Biophotonics 2023, 16, e202200316. [Google Scholar] [CrossRef]
- Manwar, R.; Kratkiewicz, K.; Mahmoodkalayeh, S.; Hariri, A.; Papadelis, C.; Hansen, A.; Pillers, D.-A.M.; Gelovani, J.; Avanaki, K. Development and characterization of transfontanelle photoacoustic imaging system for detection of intracranial hemorrhages and measurement of brain oxygenation: Ex-vivo. Photoacoustics 2023, 32, 100538. [Google Scholar] [CrossRef]
- Manwar, R.; Lara, J.B.; Prakash, R.; Ranjbaran, S.M.; Avanaki, K. Randomized multi-angle illumination for improved linear array photoacoustic computed tomography in brain. J. Biophotonics 2022, 15, e202200016. [Google Scholar] [CrossRef]
- Zafar, M.; McGuire, L.S.; Ranjbaran, S.M.; Matchynski, J.I.; Manwar, R.; Conti, A.C.; Perrine, S.A.; Avanaki, K. Spiral laser scanning photoacoustic microscopy for functional brain imaging in rats. Neurophotonics 2024, 11, 015007. [Google Scholar] [CrossRef]
- Wang, Y.; Lim, R.S.A.; Zhang, H.; Nyayapathi, N.; Oh, K.W.; Xia, J. Optimizing the light delivery of linear-array-based photoacoustic systems by double acoustic reflectors. Sci. Rep. 2018, 8, 13004. [Google Scholar] [CrossRef] [PubMed]
- Uliana, J.H.; Sampaio, D.R.; Fernandes, G.S.; Brassesco, M.S.; Nogueira-Barbosa, M.H.; Carneiro, A.A.; Pavan, T.Z. Multiangle long-axis lateral illumination photoacoustic imaging using linear array transducer. Sensors 2020, 20, 4052. [Google Scholar] [CrossRef]
- Xu, M.; Wang, L.V. Photoacoustic imaging in biomedicine. Rev. Sci. Instrum. 2006, 77, 041101. [Google Scholar] [CrossRef]
- FujiFilm VisualSonics. MS Series Transducers. Available online: https://www.visualsonics.com/product/transducers/ms-series-transducers (accessed on 7 July 2023).
- Bai, Y.; Cong, B.; Gong, X.; Song, L.; Liu, C. Compact and low-cost handheld quasibright-field linear-array probe design in photoacoustic computed tomography. J. Biomed. Opt. 2018, 23, 121606. [Google Scholar] [CrossRef] [PubMed]
- Li, M.; Liu, C.; Gong, X.; Zheng, R.; Bai, Y.; Xing, M.; Du, X.; Liu, X.; Zeng, J.; Lin, R. Linear array-based real-time photoacoustic imaging system with a compact coaxial excitation handheld probe for noninvasive sentinel lymph node mapping. Biomed. Opt. Express 2018, 9, 1408–1422. [Google Scholar] [CrossRef] [PubMed]
- Montilla, L.G.; Olafsson, R.; Bauer, D.R.; Witte, R.S. Real-time photoacoustic and ultrasound imaging: A simple solution for clinical ultrasound systems with linear arrays. Phys. Med. Biol. 2012, 58, N1. [Google Scholar] [CrossRef]
- Alijabbari, N.; Alshahrani, S.S.; Pattyn, A.; Mehrmohammadi, M. Photoacoustic tomography with a ring ultrasound transducer: A comparison of different illumination strategies. Appl. Sci. 2019, 9, 3094. [Google Scholar] [CrossRef] [PubMed]
- Li, M.; Lan, B.; Liu, W.; Xia, J.; Yao, J. Internal-illumination photoacoustic computed tomography. J. Biomed. Opt. 2018, 23, 030506. [Google Scholar] [CrossRef]
- Zhang, P.; Li, L.; Lin, L.; Hu, P.; Shi, J.; He, Y.; Zhu, L.; Zhou, Y.; Wang, L.V. High-resolution deep functional imaging of the whole mouse brain by photoacoustic computed tomography in vivo. J. Biophotonics 2018, 11, e201700024. [Google Scholar] [CrossRef]
- Powell, I. Design of a laser beam line expander. Appl. Opt. 1987, 26, 3705–3709. [Google Scholar] [CrossRef]
- Powell Lenses. Available online: https://www.thorlabs.com/newgrouppage9.cfm?objectgroup_id=13875&pn=LGL175 (accessed on 27 February 2024).
- Engineered Diffusers™. Available online: https://www.thorlabs.com/newgrouppage9.cfm?objectgroup_id=1660 (accessed on 27 February 2024).
- Bewsher, A.; Powell, I.; Boland, W. Design of single-element laser-beam shape projectors. Appl. Opt. 1996, 35, 1654–1658. [Google Scholar] [CrossRef] [PubMed]
- Homburg, O.; Mitra, T. Gaussian-to-top-hat beam shaping: An overview of parameters, methods, and applications. In Proceedings of the Laser Resonators, Microresonators, and Beam Control XIV, San Francisco, CA, USA, 21–26 January 2012; p. 82360A. [Google Scholar]
- Powell, I. Linear Deiverging Lens. Appl. Opt. 1987, 26, 3705–3709. [Google Scholar] [CrossRef]
- Ma, S.; Yang, S.; Guo, H. Limited-view photoacoustic imaging based on linear-array detection and filtered mean-backprojection-iterative reconstruction. J. Appl. Phys. 2009, 106, 123104. [Google Scholar] [CrossRef]
- Salehi, H.S.; Wang, T.; Kumavor, P.D.; Li, H.; Zhu, Q. Design of miniaturized illumination for transvaginal co-registered photoacoustic and ultrasound imaging. Biomed. Opt. Express 2014, 5, 3074–3079. [Google Scholar] [CrossRef]
- Cao, Z.; Feng, L.; Zhang, G.; Wang, J.; Shen, S.; Li, D.; Yang, X. Semiconducting polymer-based nanoparticles with strong absorbance in NIR-II window for in vivo photothermal therapy and photoacoustic imaging. Biomaterials 2018, 155, 103–111. [Google Scholar] [CrossRef]
- Gao, S.; Wang, G.; Qin, Z.; Wang, X.; Zhao, G.; Ma, Q.; Zhu, L. Oxygen-generating hybrid nanoparticles to enhance fluorescent/photoacoustic/ultrasound imaging guided tumor photodynamic therapy. Biomaterials 2017, 112, 324–335. [Google Scholar] [CrossRef]
- Mallidi, S.; Watanabe, K.; Timerman, D.; Schoenfeld, D.; Hasan, T. Prediction of tumor recurrence and therapy monitoring using ultrasound-guided photoacoustic imaging. Theranostics 2015, 5, 289. [Google Scholar] [CrossRef] [PubMed]
- Liu, Y.; Nie, L.; Chen, X. Photoacoustic molecular imaging: From multiscale biomedical applications towards early-stage theranostics. Trends Biotechnol. 2016, 34, 420–433. [Google Scholar] [CrossRef] [PubMed]
- Bychkov, A.; Zarubin, V.; Karabutov, A.; Simonova, V.; Cherepetskaya, E. On the use of an optoacoustic and laser ultrasonic imaging system for assessing peripheral intravenous access. Photoacoustics 2017, 5, 10–16. [Google Scholar] [CrossRef] [PubMed]
Disclaimer/Publisher’s Note: The statements, opinions and data contained in all publications are solely those of the individual author(s) and contributor(s) and not of MDPI and/or the editor(s). MDPI and/or the editor(s) disclaim responsibility for any injury to people or property resulting from any ideas, methods, instructions or products referred to in the content. |
© 2024 by the authors. Licensee MDPI, Basel, Switzerland. This article is an open access article distributed under the terms and conditions of the Creative Commons Attribution (CC BY) license (https://creativecommons.org/licenses/by/4.0/).

