Article

Attitude Determination of Photovoltaic Device by Means of Differential Absorption Imaging

Laboratory for Future Interdisciplinary Research of Science and Technology (FIRST), Institute of Innovative Research (IIR), Tokyo Institute of Technology, R2-39, 4259 Nagatsuta, Midori-ku, Yokohama 226-8503, Japan
*
Author to whom correspondence should be addressed.
Photonics 2024, 11(1), 32; https://doi.org/10.3390/photonics11010032
Submission received: 29 November 2023 / Revised: 19 December 2023 / Accepted: 23 December 2023 / Published: 29 December 2023

Abstract

:
Future wireless power transmission will cover power levels up to kilowatts or more and transmission distances up to the scale of kilometers. With its narrow beam divergence angle, optical wireless power transmission (OWPT) is a promising candidate for such system implementations. In the operation of OWPT, it is necessary to estimate the position, direction (azimuth, elevation), and attitude of the target photovoltaic device before the power supply. The authors have proposed the detection of targets using differential absorption imaging and positioning with a combination of stereo imagery. In the positioning by stereo imagery, a condition regarding the consistency of the left and right images can be defined. This corresponds to the certain value of the exposure time of the image sensor, and this depends on the target’s attitude angle. In this paper, we discuss target attitude estimation using this minimum exposure time at which the integrity measure converges. A physical model was derived under general conditions of target position and experimental configuration. Target attitudes were estimated within an error range of 10 to 15 degrees in approximately 60 degrees range. On the other hand, there is an attitude estimation method based on the apparent size of the target. When using this method to estimate the attitude angle, errors are significantly large for specular and diffuse mixed targets like the PV. The method proposed in this paper is a robust attitude estimation method for the photovoltaic device in OWPT.

1. Introduction

Wireless power transmission in the future is expected to cover power ranging from several watts to kilowatts or more and transmission distances from a few meters to large-scale systems spanning kilometers [1,2,3,4]. Due to its narrow beam divergence angle, Optical Wireless Power Transmission (OWPT) is a strong candidate for such system constructions [5,6,7,8]. Achieving high power transmission efficiency on the receiver requires sophisticated beam alignment and shaping [9]. Therefore, obtaining information about the position, direction, and attitude of the photovoltaic device (hereinafter referred to as the ‘PV’ or ‘target’) before power transmission is essential. While satellite or indoor navigation systems can provide location and direction information, it is not certain that such infrastructure is always available for OWPT operations. Additionally, the use of such navigation systems is limited for attitude estimation.
Some researchers proposed estimation of position from target images [10,11], but challenges have been reported, including variations in background light due to weather and diurnal changes, as well as misidentifications with surrounding objects [10]. In OWPT, a method for target detection with less dependence on background light conditions is desirable. As one of such methods, the authors have been proposing the detection of PV using differential absorption imaging. This method involves acquiring images of the target at its absorption (λON) and non-absorption wavelength (λOFF) and generating a differential image to extract it. Under the assumption that λON and λOFF are close enough to experience the same background illumination, etc., they are canceled out by generating the difference between the two [12]. Reflection characteristics for λOFF on the rear surface of the PV is an important parameter of this method and the angular characteristics of the determination of the center coordinates and the area in the pixel coordinate system of the target were reported. On the other hand, while the target’s attitude can be reliably estimated at angles deviating from its normal for diffuse targets, the estimation failed near the normal [13]. Based on these results, the position and direction determination based on stereo image methods and target apparent size measurements were reported. It was found that a set of consistency conditions (hereinafter referred to as the ‘integrity measure’) can be defined for the target’s center coordinates estimated from the left and right images. This is the necessary condition for the coordinates to correspond to the same point on the target. Furthermore, it was found that there exists a minimum exposure time for the image sensor for the integrity measure to hold, and this minimum exposure time (hereinafter referred to as the ‘minimum exposure time’) corresponds to the convergence of the position determination result [14].
This paper focuses on the determination of the attitude of non-diffuse targets, such as PV, using differential absorption imaging. This paper demonstrates that the minimum exposure time depends on the target’s attitude angle. Additionally, as the minimum exposure time varies depending on the target’s position and the experimental configuration, a physical model was derived to determine the minimum exposure time under general conditions, constructed based on the extension of the ‘threshold equation’ proposed in [13]. Based on this physical model, target attitude estimation was performed using the minimum exposure time for each target. The estimation error was less than 15 degrees for the target attitude angle range of 60 to 120 degrees. The accuracy of the estimation did not strongly depend on the target’s attitude angle, including near the normal. Moreover, in principle, it has a feature that does not depend on the size of the target image.
On the other hand, another method for estimating the target’s attitude involves measuring changes in the apparent size of the target with the attitude angle. When using this method to estimate the attitude angle for the PV with a mixed type of specular and diffuse reflection characteristics, errors were significant for targets as the target’s image is incomplete and strongly varies with the attitude. It is not practical to use such a method for a target like the PV. For the GaAs substrate with diffuse reflection characteristics, issues are that the accuracy and the range of attitude estimable depend on the size of the target image.
Consideration of operational scenes for OWPT, where estimation of the receiver (target)’s attitude angle is necessary, leads to the classification of cooperative and non-cooperative types. In the case of the cooperative type, the receiver can be aware of the relative direction measured by the transmitter and then, can adjust its relative attitude to the transmitter. Moreover, it is possible to operate by instructing the receiver to adjust its relative attitude when necessary. While the transmitter needs to confirm the relative attitude adjusted by the receiver, it is anticipated that the adjusted attitude angle will be near the normal and this makes the method presented in this paper effective as it ensures stable attitude angle estimation accuracy over a wide range of angles. On the other hand, in the non-cooperative type, it is often necessary for the transmitter to estimate the receiver’s attitude angle. In this case, as well, the method presented in this paper is effective.
The idea of attitude determination based on the integrity measure is roughly sketched in the manuscript [15] for the first time. This paper describes the details of the method, especially the derivation of its physical model used in attitude determination, and its error characteristics.
The rest of this paper is organized as follows. The principle of target attitude angle estimation using the minimum exposure time and its experiment is described in Section 2. To adapt attitude angle estimation to general situations, it is necessary to construct a physical model of the minimum exposure time using the target’s reflection model. The derivation of the model and attitude angle estimation based on it are described in Section 3. In Section 4, the error analysis of the method presented in this paper is compared with the attitude angle estimation using the apparent size of the target. The conclusion of this paper is described in Section 5.

2. Attitude Estimation of the GaAs Target

2.1. Review of Integrity Measure and Its Experiments

The detailed principle of target detection using differential absorption imaging is described and the introduction of the integrity measure in the position estimation using stereo imagery is discussed in the former research [12,14]. The content of this section is based on these papers.
The experiments of the target’s position estimation were conducted while varying the target’s position and attitude, as shown in Figure 1a.
On the optical bench used in the experiment, there were 23 (horizontal) × 31 (vertical) screw holes (pitch 25.4 mm). These screw holes were considered as grid points, defining 2D coordinates 11 x   11 , 3 y   27 . Throughout this paper, lengths are measured in units of the pitch.
The transmitter assembly consisted of 850 nm ( λ ON ) and 940 nm ( λ OFF ) LEDs [16,17]. For the camera assembly, two Intel D435TM depth cameras [18] were combined and captured the left/right image. Figure 1b shows the configuration of the camera assembly in which incoming λON and λOFF rays were separately detected by each camera. The camera assembly was installed at the origin (0, 0), and its front face was aligned to the +Y direction. Differential images of λON and λOFF are generated and binarized for both the left and right images. From these images, the center coordinates of the target were estimated, and the target’s position was estimated from the parallax between the left and right images. In the experiments, the positions of the targets were set as shown in Figure 1a. The target in the experiments was a GaAs PV (manufacturer: Advanced Technology Institute, Tokyo, Japan, five cells connected in series [19]). The definition of the attitude of the target is included in Figure 1a. When the normal vector is parallel to the negative X direction, the attitude is defined as 0 and 180 deg in case it is to the positive X direction. It was varied by rotating the stage on which it was installed. The attitude (the angle of the rotatable stage) ϕ increases counterclockwise and is defined as 90 degrees (deg) when the target faces the camera. The coordinates of the target were defined in the following Position Set 1, 2, and 3.
Position   Set   1 = ( 8 ,   27 ) ,   ( 4 ,   27 ) ,   ( 2 ,   27 ) ,   ( 1 ,   27 ) ,   ( 0 ,   27 ) ,   ( 1 ,   27 ) , ( 2 ,   27 ) ,   ( 4 ,   27 ) , ( 8 ,   27 ) Position   Set   2 = ( 0 ,   27 ) ,   ( 0 ,   26 ) ,   ( 0 ,   25 ) ,   ( 0 ,   23 ) ,   ( 0 ,   19 ) Position   Set   3 = ( 6 ,   9 ) ,   ( 4 ,   11 ) ,   ( 2 ,   13 ) ,   ( 1 ,   14 ) ,   ( 0 ,   15 ) ,   ( 1 ,   16 ) , ( 2 ,   17 ) ,   ( 4 ,   19 ) , ( 8 ,   23 )
Typical parameters in this experiment are summarized in Table 1. Further details are described in [14].
Since the rear surface of the PV used in the experiments was copper electrode and its reflection characteristics were mainly specular accompanied by a small diffuse component, the differential absorption image generated in the experiments was incomplete and varied largely by the target’s attitude angle (Figure 2). Its position using such images of the left/right sensors was estimated as follows. First, by differentiation and binarization of the images from the two infrared streams, target images from the left and right sensors were generated. Then, the left/right center coordinates of the PV were estimated. From the center coordinates of the target detected in each image, its range and azimuth (direction) were estimated by stereo imagery. Finally, the X and Y coordinates of the target were determined in the real 2D space.
The center coordinates of the target (ξL, ηL) and (ξR, ηR), viewed from the left and right optical axes of the cameras in Figure 1a, respectively, need to correspond to the same point on the target. Therefore, the consistency condition (‘integrity measure’) given by Equations (1) and (2) can be defined from the obtained pixel coordinates of the target image.
C1: ξLξR > 0
C2: ηLηR = 0
The integrity measure behaves randomly when the exposure time of the image sensor is short, but it converges rapidly above a certain threshold (Figure 3). Therefore, there exists a minimum exposure time associated with the convergence of the integrity measure.
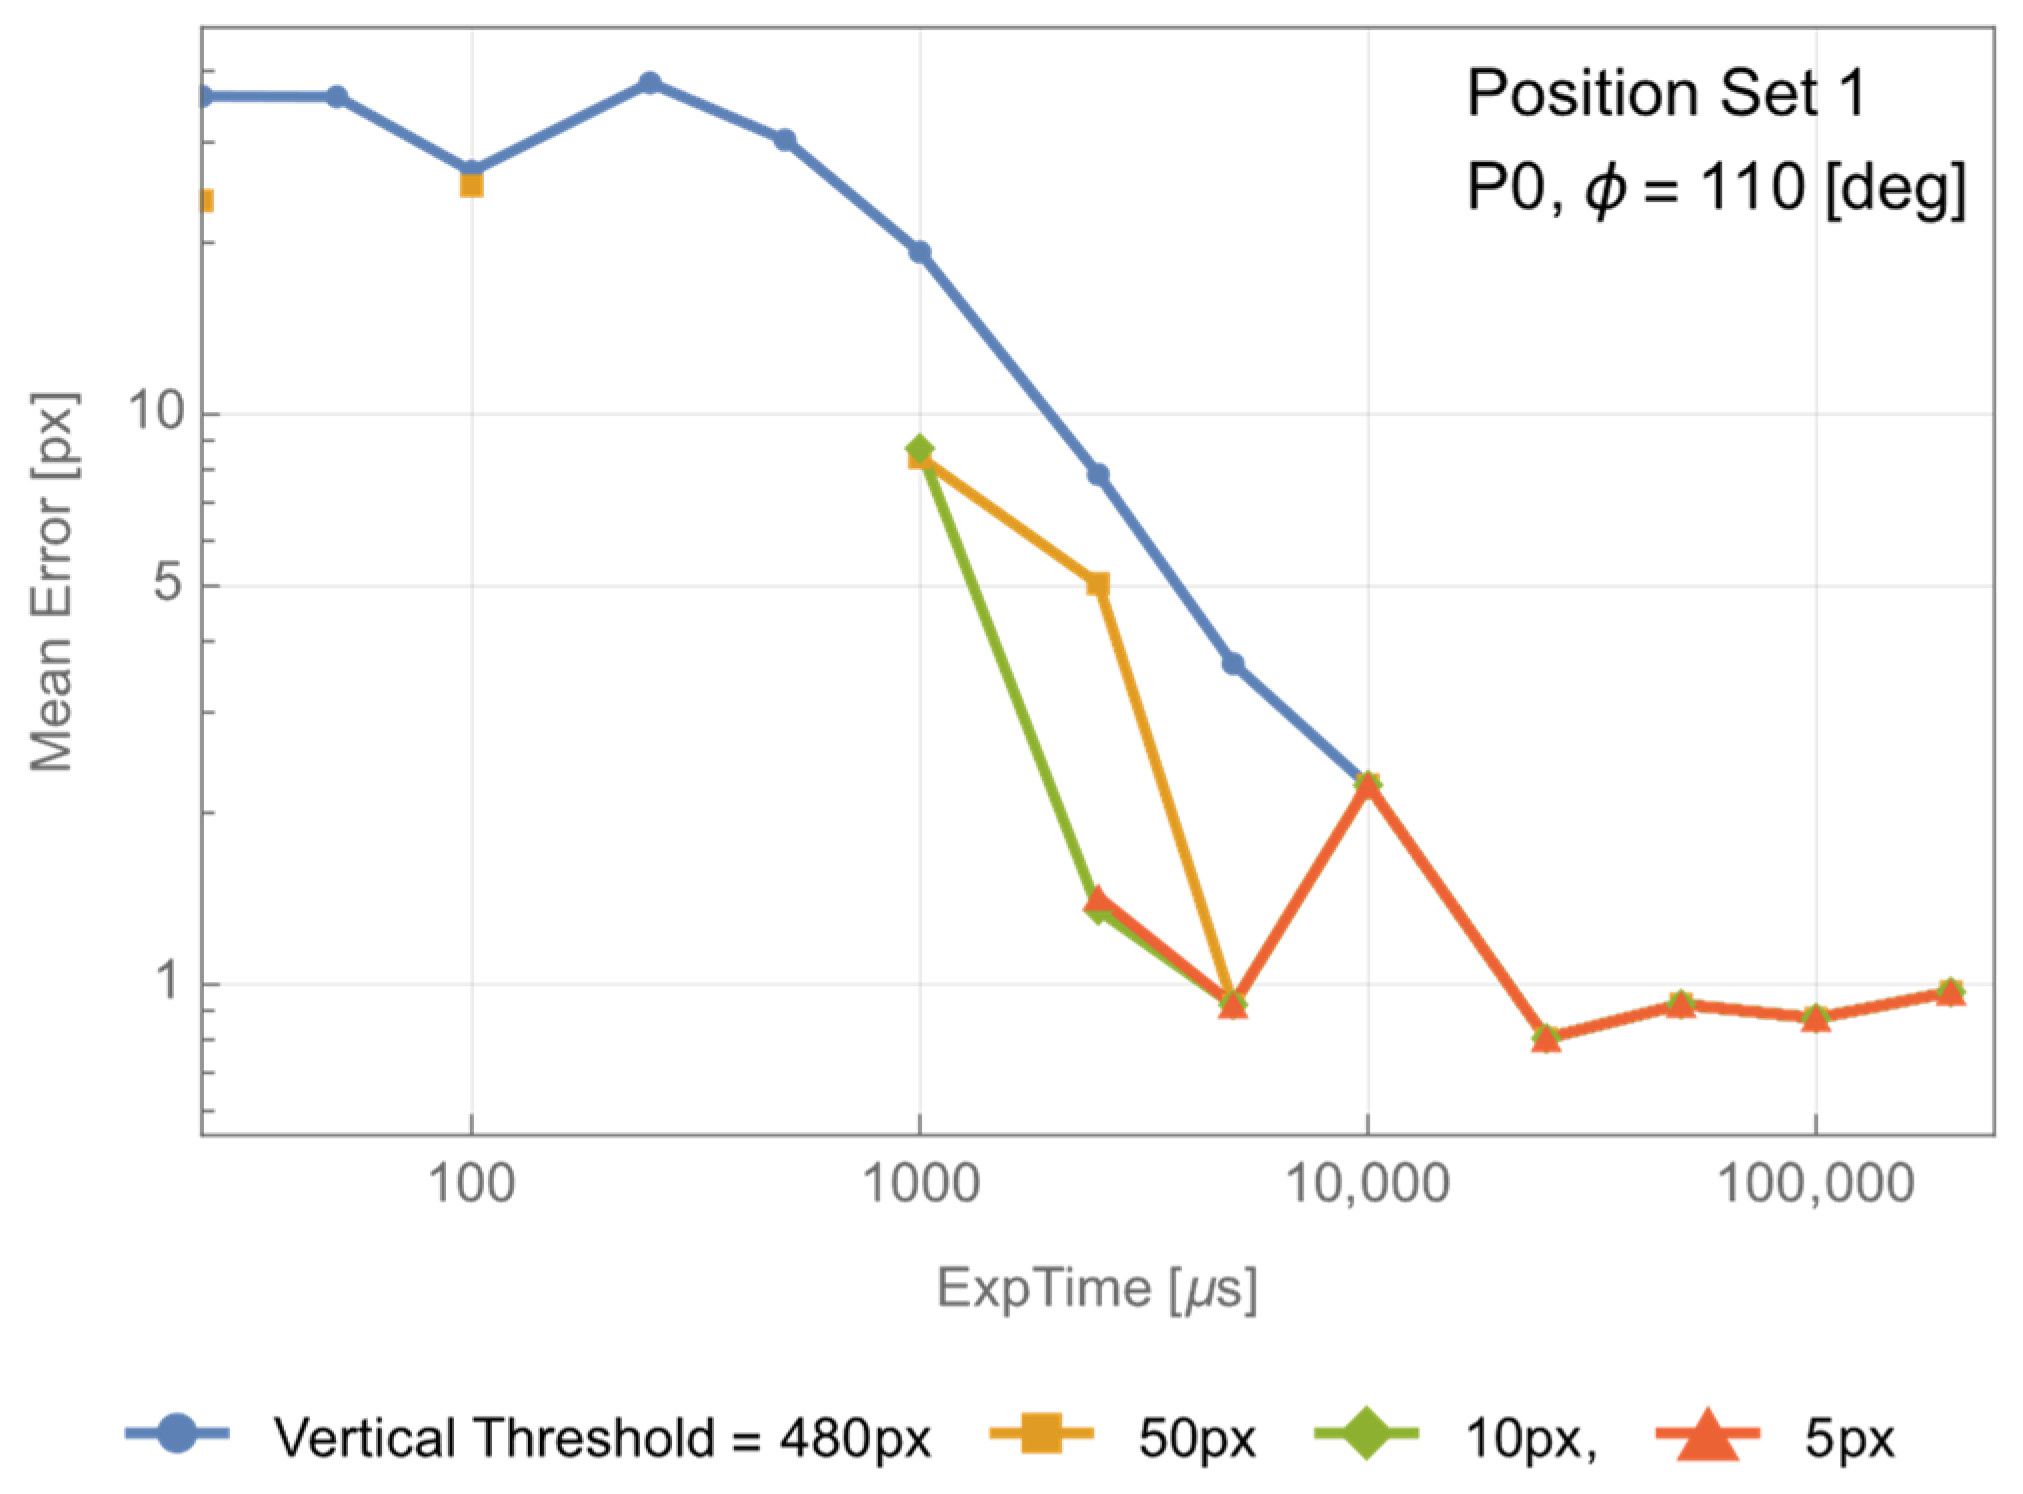
This minimum exposure time corresponds to the convergence of the position determination accuracy (Figure 4).

2.2. Preliminary Target Attitude Estimation Experiments

The target was fixed at (0, 27), and the estimation of the target position yielded the results shown in Figure 5.
Figure 5 shows that the position estimation accuracy depends on the target’s attitude angle, and Figure 3 and Figure 4 indicate that the convergence of the position accuracy is related to the convergence exposure time of the integrity measure. Therefore, it is conjectured that the target’s attitude angle is related to the minimum convergence exposure time of the integrity measure.
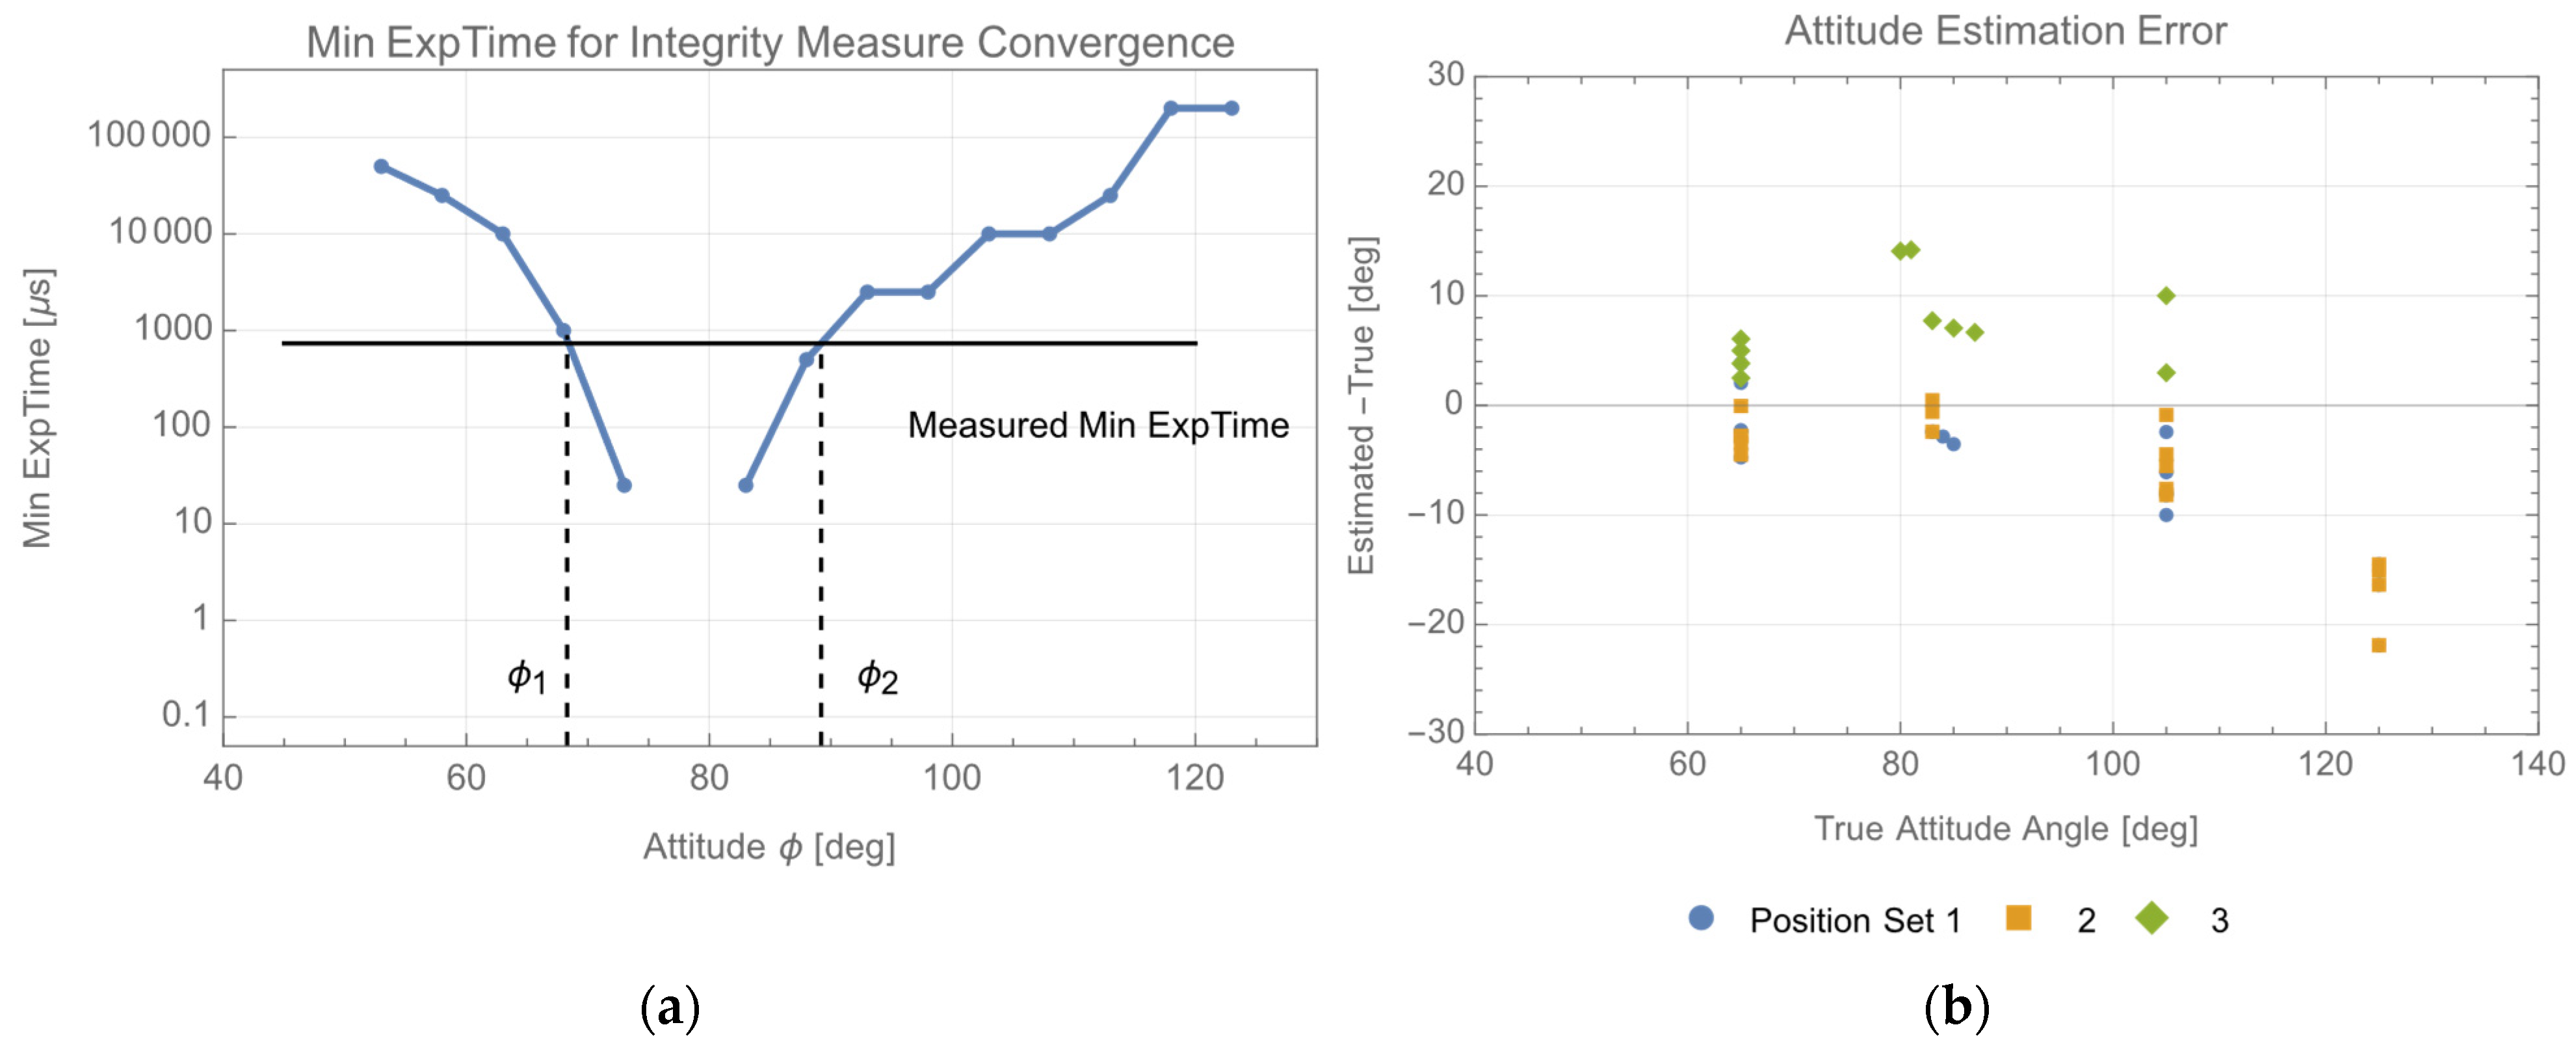
Using the data from Figure 5, it is possible to determine the minimum convergence time of the integrity measure for each attitude angle of the target placed at (0, 27). The results are shown in Figure 6a. The vertical axis of Figure 6a represents the minimum exposure time at which both C1 (Equation (1)) and C2 (Equation (2)) are satisfied, and the horizontal axis represents the target’s attitude angle. The minimum exposure time shows sharp dependence on the target’s attitude angle.
For a target with an unknown attitude angle, measuring the minimum exposure time at which the integrity measure converges, one can estimate the attitude angle using a curve similar to that shown in Figure 6a from the measured minimum exposure time. Although the determined attitude angles from the measured minimum exposure time yield two solutions, ϕ1 and ϕ2 shown in Figure 6a, due to the symmetry, this does not pose any problem in the case of beam shaping performed by the transmitter.
At points in Position Set 1, 2, and 3, by obtaining the minimum exposure time from the data and overlaying it on Figure 6a, the plot in Figure 6b shows that the estimated attitude angles at each point of Position Set 1, 2, and 3 are feasible, albeit with some outliers.
Figure 6a represents the curve of the minimum exposure time for the target fixed at (0, 27). The curves for the minimum exposure time and attitude angle at each target position would be different from those for the target fixed at (0, 27). Therefore, creating a model for the minimum exposure time corresponding to each position of the target and conducting attitude estimation based on it would likely improve the estimation accuracy shown in Figure 6b.

3. The Physical Model of the Integrity Measure’s Minimum Exposure Time and Attitude Estimation

3.1. Derivation of the Integrity Measure’s Minimum Exposure Time

The integrity measure converges at the target detection threshold. Therefore, the physical model of the minimum exposure time can be derived by modifying the ‘threshold equation’ proposed in [13] in the following manner.
  • The attitude angle of the target ( ϕ ), the irradiation (incident) angle of the beam ( θ i ), and the view angle from the camera ( θ r ) are extended to include non-zero values.
  • The reflection characteristics of the target are extended to include a non-diffuse one.
  • The profile of the irradiation beam is extended to Gaussian.
The ‘threshold equation’ takes the following form when the absorption wavelength is fully absorbed:
[ K   ( λ h c ) ρ I t η t η r η Q Δ σ Δ Ω Δ ω r E x p ] t h r e s h o l d = Δ I d i f f
Here, η Q : the quantum efficiency of the camera sensor, Δ σ / Δ Ω : the differential scattering cross-section of the target, Δ ω r : the solid angle of the receiver FOV, I t : the transmitted beam power density, η r : the efficiency of the receiving optics, h c / λ : the energy of a λ OFF photon, K : a constant dependent on the experimental setup, and Δ I d i f f : differential intensity between the target and the background at the threshold.
First, considering θ r is non-zero, Δ ω r is expressed as follows:
Δ ω r = A r c o s θ r ( R / c o s θ r ) 2 = A r R 2 c o s 3 θ r
Introducing θ i in addition to this, Equation (3) becomes as follows. It should be noted that θ i and θ r are functions of the target’s attitude angle ϕ.
[ K   ( λ h c ) f r I t   η t η r η Q Δ σ A r R 2 c o s θ i c o s 4 θ r E x p ] t h r e s h o l d = Δ I d i f f
Equation (5) is the general form of the ‘threshold equation’ taking θ i and θ r into account. Here, f r is defined as,
f r ρ Δ Ω   cos θ r
The expression for the minimum exposure time in the experimental setup is derived by considering the irradiation beam’s profile and the target’s reflectance characteristics. Taking into account that the irradiation beam profile is Gaussian, consider a 1 / e 2 beam radius: w , the irradiation beam power: P t , and the beam area on the target surface: A t r ,
I t ( r ) = I 0 e x p ( 2 r 2 w 2 ) = 2 η t P t A t r e x p ( 2 r 2 w 2 )
where η t : is the efficiency of the transmitter optics, and w is determined by the measurements of the irradiation beam used in the experiment. Taking R as the distance from the transmitter, it is measured as,
w ( R ) = 2.95 + 0.65   R
where r represents the length of the perpendicular dropped from the target position to the extension of the direction vector of the irradiation beam.
Δ σ = {   A t r     ( i f   A S C A t r )   A S C   ( i f   A S C < A t r )
Therefore, from Equations (5), (7) and (9), we have:
[ 2 K   ( λ h c ) E x p   f r η t   η r η Q A r R 2 F ( R ) P t exp ( 2 r 2 w 2 ) cos 4 θ r cos θ i ] t h r e s h o l d = Δ I d i f f
Here, F ( R ) is defined as
F ( R ) {   1     ( i f   A S C A t r ) A S C / A t r       ( i f   A S C < A t r )
The factor ‘Exp’ appearing on the left-hand side of Equation (10) is the minimum exposure time to be obtained. Therefore,
E x p = K R 2 R 2 f r cos 4 θ r c o s θ i exp ( 2 r 2 w 2 )
Here, based on the experimental conditions, the case A S C < A t r was selected in Equation (11), and in this case, F ( R ) is proportional to F ( R ) 1 / R 2 . The constants appearing in Equation (10) are collectively denoted as K .

3.2. Reflectance Model of the PV

The f r in Equation (10) represents the target’s reflectance characteristics, and this depends on the target reflectance ρ and θ i ,   θ r . According to [13], the target’s reflectance characteristics are mainly specular and accompanied by small diffuse component. To represent this, we introduce the Bidirectional Reflectance Distribution Function (BRDF) and express f r in the following Cook–Torrance form [20,21,22,23].
f r ( ρ , θ i ,   θ r   ) = D   G   F 4   c o s θ i c o s θ r
Here, D is the micro-surface distribution function, and G is the geometrical shadowing-masking function. F represents the Fresnel reflection function, which denotes the target’s Fresnel reflectance and is known for its simplified formula by Schlick [22]. On the other hand, G depends on D [23]. When considering the target as a set of micro surfaces forming a random rough surface, D is a distribution function dependent on the orientation and roughness of the micro surfaces. Although there are several variations of the micro surface distribution function D, two representative distribution functions are known. One is Beckmann distribution, which represents a Gaussian distribution of flat micro surface orientation whose correlation decays exponentially [24].
D B ( m ) = e x p ( t a n 2 θ m / m 2   ) π   m 2   c o s 4 θ m
Here, θ m is the angle between the macroscopic normal and the local (microscopic) normal and m is the surface roughness parameter. Another one is Trowbridge–Reitz distribution [23,25] (note Trowbridge–Reitz distribution is denoted as GGX in some literature [23]), which expresses the curved random surface as a quadratic mean one.
D T R ( m ) = m 2 π   c o s 4 θ m ( m 2 + t a n 2 θ m ) 2
Here, θ m and m are parameters similar to Beckmann distribution. For both distributions, a smaller m implies a stronger specular characteristic. Referring to the comparison provided in [22], m is approximately 0.5 for acid-etched glass and around 0.02 for anti-glare glass, and smaller m results in a smaller difference between Beckmann and Trowbridge–Reitz distributions. To determine whether D B ( m ) or D T R ( m ) is more suitable as a model representing the reflection characteristics of the PV, the BRDF was computed based on Equation (12). F and G were calculated using the equations proposed in [22] and [23], respectively. Assuming a strong specular component with m = 0.01, both distributions are plotted against θ m on the horizontal axis, resulting in the plot depicted in Figure 7.
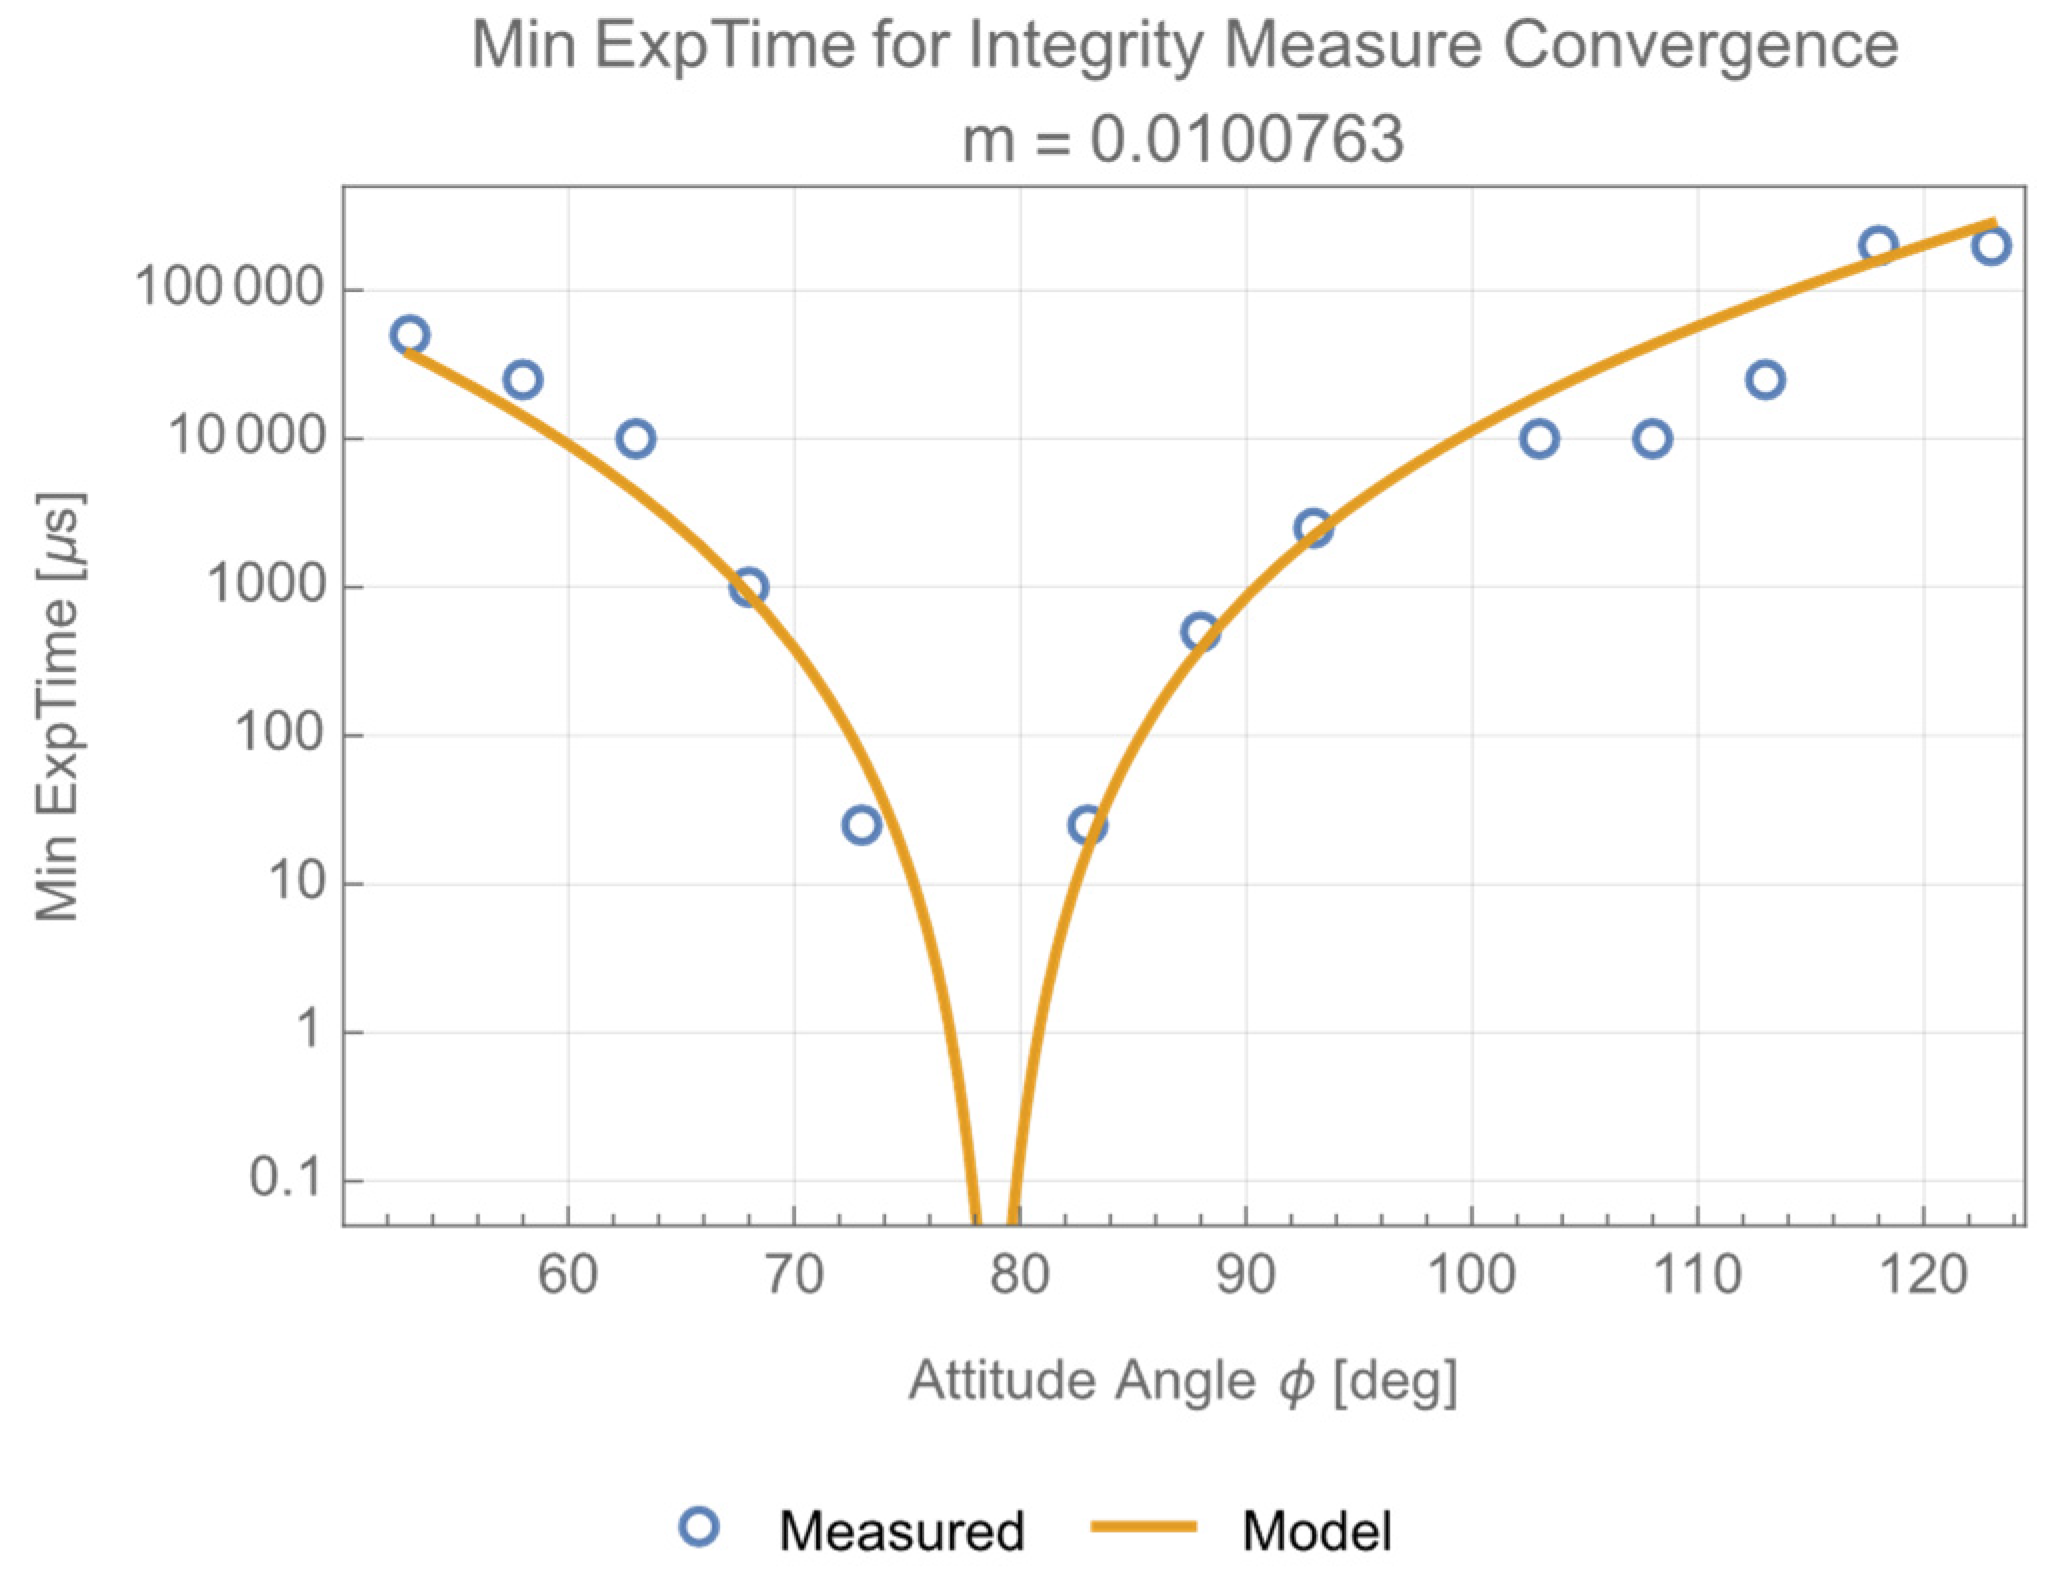
Both show minor differences within the range of around O (102) from the peak, but the disparity becomes significant within the range of approximately O (104) ~ O (105). In Figure 6a, due to the influence of the diffuse component in the target reflection characteristics, the range of O (104) from the bottom peak of the minimum exposure time needs to be considered in regions where the target attitude angles are large. Therefore, Trowbridge–Reitz distribution is suitable to be adopted for the PV instead of Beckmann. When attempting to fit the experimental data from Figure 6a to determine the constant K in Equation (12), successful fitting is achieved with m = 0.01 for Trowbridge–Reitz distribution, while Beckmann distribution fails the fitting and its value of m cannot be determined due to its short tail distribution in the range of around O (105). For both Beckmann and Trowbridge–Reitz distributions, when the value of m becomes large, the specular state represented by the BRDF should continuously become a diffuse state. To make such a continuous transition mathematically, the small constant term ρ / π can be included in Equations (14) and (15) [21,22]. However, even when attempting to fit including this additional term, the above results remain unchanged for the PV. When the model for the minimum exposure time derived from Trowbridge–Reitz distribution is overlaid and plotted in Figure 6a, it appears as shown in Figure 8.
The results of the estimated angular positions at each point of Position Set 1, 2, and 3, based on the model, are illustrated in Figure 9. This figure shows that the derived integrity measure model can be used to estimate the attitude of the target. The estimation errors were improved from Figure 6b and remain within the range of 10~15 deg except for the outlier at ϕ = 123 deg.

4. Discussion

4.1. Error Model of the Minimum Exposure Time Method

The error model of this minimum exposure time is constructed using the mode developed in Section 3. The attitude estimation error of this model comes from the measurement error of the minimum exposure time Δ E x p . The attitude estimation error Δ ϕ [deg] is expressed by the following equation.
E x p + Δ E x p = K R 2 R 2 f r ( ϕ + Δ ϕ ) cos 4 θ r ( ϕ + Δ ϕ ) c o s θ i ( ϕ + Δ ϕ ) exp ( 2 r 2 w 2 )
Equation (16) is plotted in Figure 10 for the case of Δ E x p E x p = 0.3 , 0.6 , 0.9 , 1.0 . In the case that Δ E x p E x p is in the range 0.6 ~ 0.9 , Figure 10 agrees with Figure 9.
Even though this indicates that the measurement of the minimum exposure time suffered large errors, considering the resolution of the exposure time setting for the camera was coarse as shown in Table 1, this can be regarded as possible. This indicates the validity of the model developed in Section 3.

4.2. Attitude Estimation by the Apparent Size of the Target

There is another method for estimating the target’s angular position based on the variation in the apparent width of the target, aside from the one proposed in this paper. Let the size of the target be denoted as x 0 and y 0 , respectively. Assume the target is tilted around the y-axis, and the measured apparent size at a certain distance is x and y , the change in the target’s attitude angle change Δ ϕ from its normal can be expressed as:
Δ ϕ = c o s 1 [ x x 0 ( y 0 y ) ]
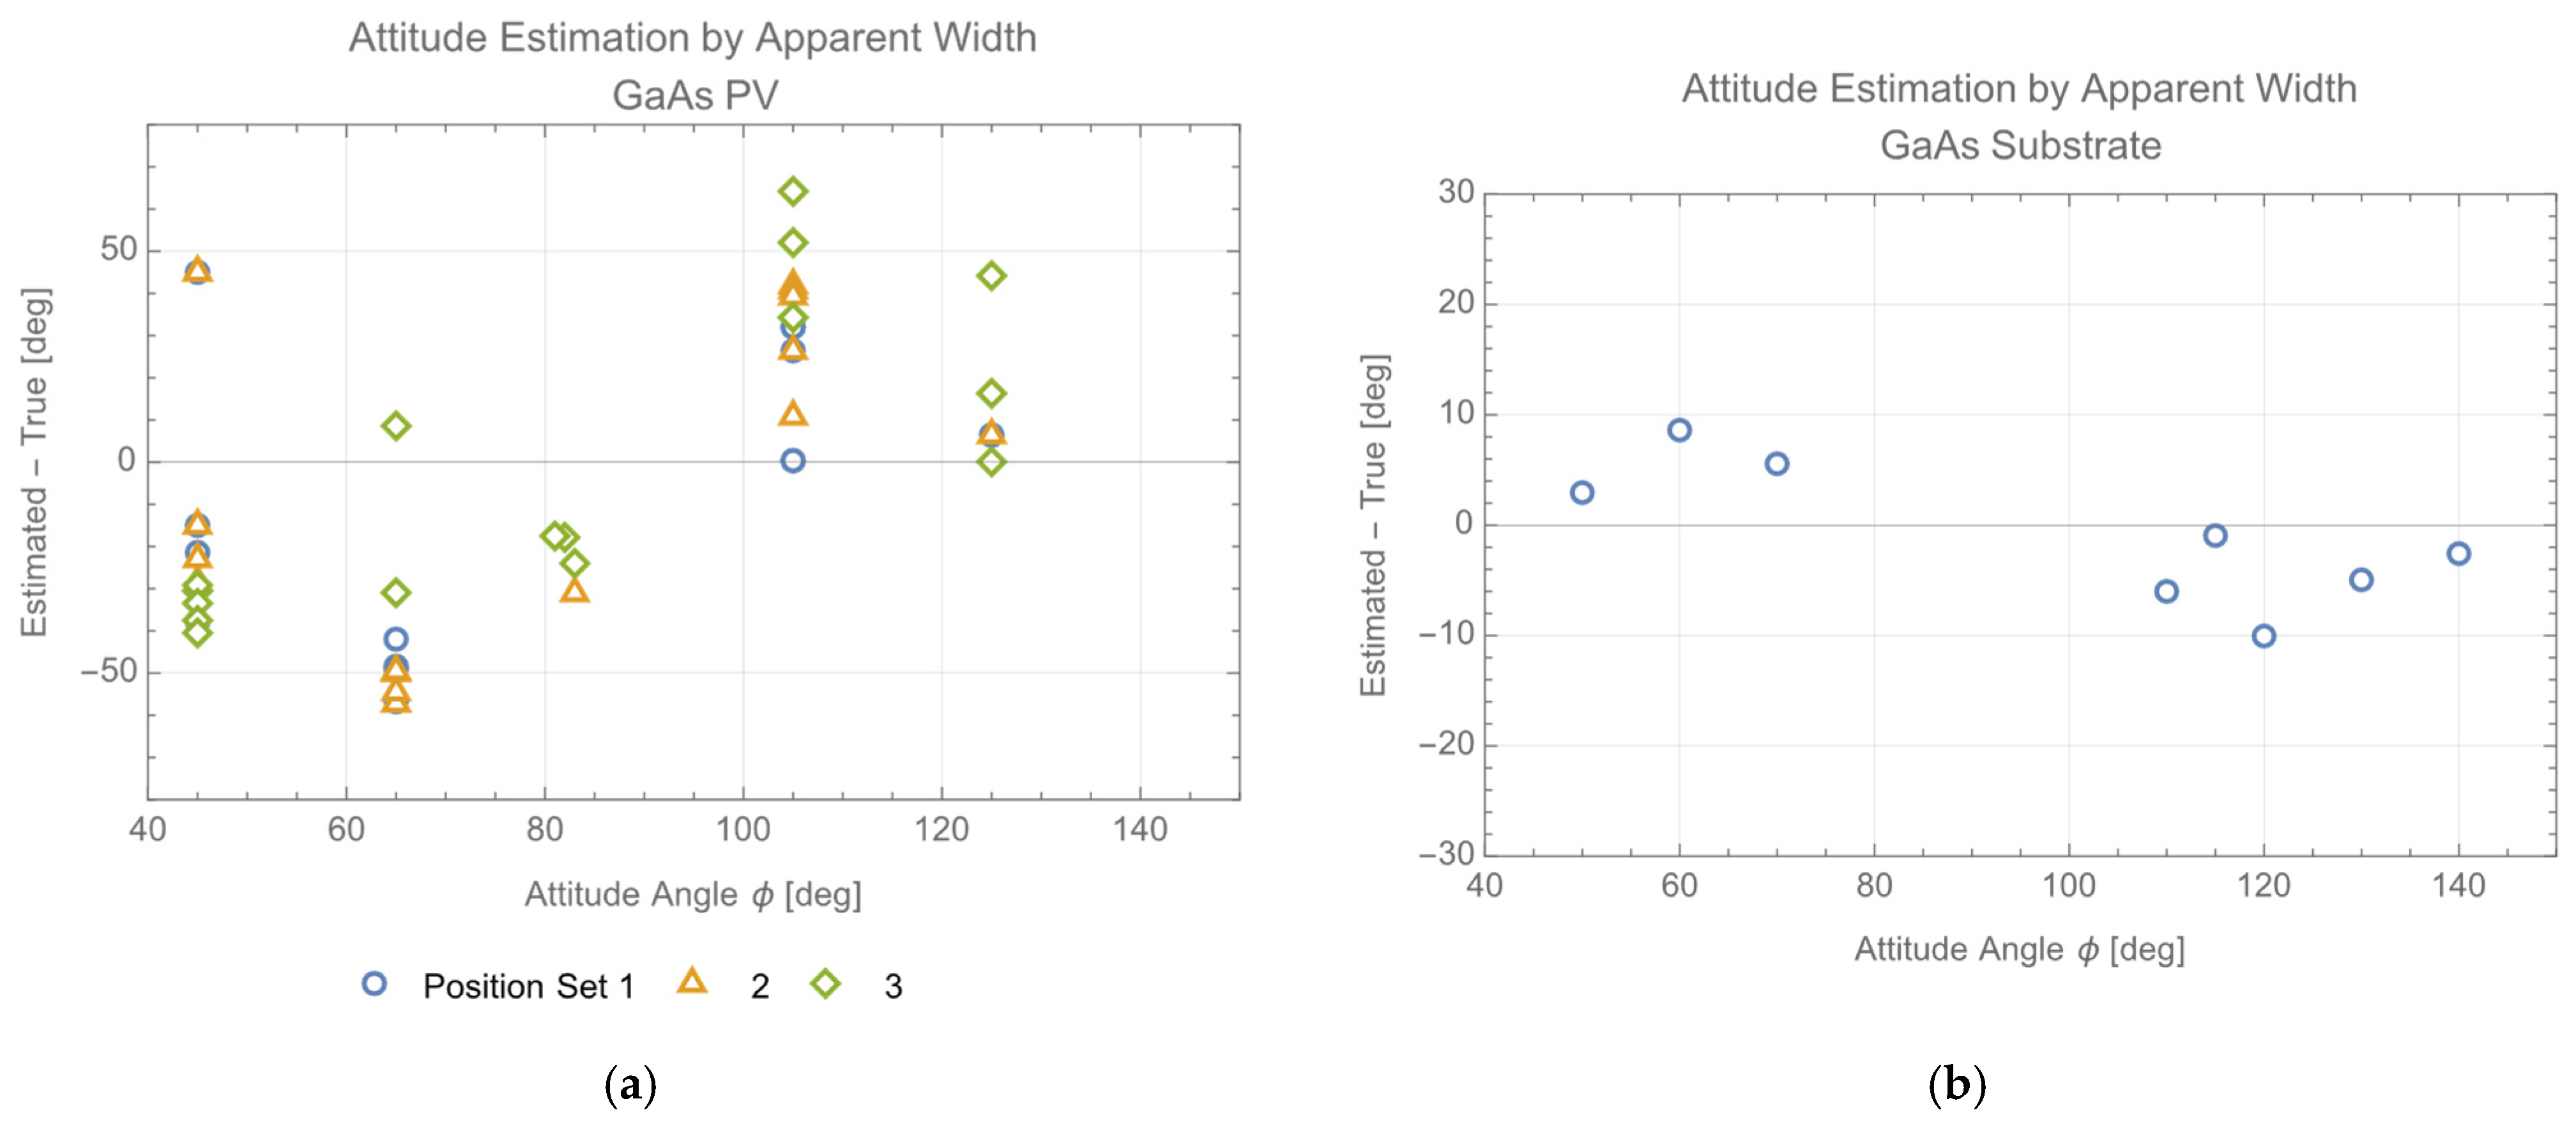
The results of the estimation of the attitude of the PV based on this method using the images obtained from the left image sensor are shown in Figure 11a. A comparison with Figure 9 reveals a significant increase in estimation error. While Figure 9 estimates the attitude based on the estimated left and right center coordinates of the target and their integrity condition, Figure 11a estimates based on the apparent size of the target. Therefore, when measuring the apparent size of the target from an incomplete image, as depicted in Figure 2, it is expected that the error will increase. On the other hand, when the target is a GaAs substrate that is close to an ideal diffuse reflector, a complete image of the target can be obtained. The results of a similar estimation for a GaAs substrate [26] are shown in Figure 11b. Figure 11b was plotted using the data for the GaAs substrate fixed at (0, 27) obtained in the experiments in [13]. Overall, the errors are smaller, but estimation fails at ±20 degrees around the normal. The estimation limit of Δ ϕ can be expressed as:
x 0 ( 1 c o s Δ ϕ ) 1   p x
In the experiment, x 0 was measured to be 35 px, which results in Δ ϕ ≥ 13.8 deg. The true value of the estimation limit for Δ ϕ in the experiment lies between 15 and 20 deg, which is close to 13.8 deg. Thus, the estimation failure near the normal in Figure 11b can be understood to be due to the estimation limit imposed by the target’s size within the captured image. Additionally, the estimation accuracy at angular positions away from the normal is dependent on the target’s size in the image. In summary, when the target’s image is incomplete, the method of estimating the target’s attitude based on the apparent size of the target, as shown in Figure 11a, results in decreased accuracy. Even in cases where the target’s reflectance characteristics closely resemble those of an ideal diffusing reflector, as depicted in Figure 11b, constraints imposed by the target’s size within the captured image are still present.
The method proposed in this paper, which utilizes the minimum exposure time associated with the convergence of the integrity measure, enables the estimation of the angular position even from an incomplete image. Moreover, in principle, it is not constrained by the target’s size within the captured image. However, this method relies on the steep variation of the minimum exposure time regarding the attitude of the PV. In the case where the target closely resembles an ideal diffusing reflector, as suggested by the data presented in [13], this minimum exposure time is expected to exhibit minimal changes regarding the attitude. It is anticipated that such target angular position estimations using this approach could lead to significant errors.
Comparing Figure 10, Figure 9 with Figure 11b, the error characteristics of the former are complementary to that of the latter. While in Figure 9 and Figure 10, the absolute value of the estimation error reaches a minimum in the neighborhood of 80 to 90 deg and increases with angle deviation from the normal, it behaves contrary in Figure 11b.

5. Conclusions

In OWPT operations, it is essential to estimate the position, orientation, and attitude of the PV before supplying power. In this paper, we studied the method for estimating the target’s attitude using the infrared differential absorption imaging and stereo image technique proposed by the authors. In the stereo image technique, the ‘integrity measure,’ a necessary condition ensuring consistency between left and right images, can be defined. The ‘integrity measure’ rapidly converges when the exposure time of the image sensor exceeds a certain value, and this minimum exposure time depends on the target’s posture angle. Using this characteristic of the minimum exposure time, the target’s attitude angles were estimated within a range of approximately 60 degrees, including its normal, with an error of 10 to 15 degrees for 15 dispersed positions on the optical bench. Additionally, the minimum exposure time varies depending on the target position and experimental configuration. A physical model for determining the minimum exposure time under general conditions was derived based on the previously proposed ‘threshold equation’.
Another method of estimating the target’s attitude is measuring the change in the apparent size of the target with its attitude angle. When using this method to estimate the attitude, errors are significant for PV cases where the target’s image is incomplete and changes significantly with the attitude variations, since the estimation of the apparent size is erroneous for such targets. Furthermore, in the case of GaAs substrate with diffuse reflection characteristics, the feasible range of attitude estimation depends on the target’s size within the image, and for the target and configuration used in the experiment, the attitude could not be estimated within the range of ±20 degrees from the normal. This range is dependent on the relative size of the target in the captured image. The smaller the relative size becomes, the wider this inestimable range. On the other hand, the method proposed in this paper estimates the attitude around the normal, and this is a favorable characteristic for OWPT operation. Thus, the method proposed in this paper is a robust way to estimate the attitude of the target with the required accuracy for OWPT when applied to specular and diffuse mixed reflection targets such as the PV.

Author Contributions

Conceptualization, K.A. and T.M.; methodology, K.A. and T.M.; formal analysis, K.A.; investigation, K.A.; data curation, K.A.; software, K.A.; writing—original draft preparation, K.A.; writing—review and editing, T.M.; project administration, T.M.; funding acquisition, T.M. All authors have read and agreed to the published version of the manuscript.

Funding

This work was partially supported by the Tsurugi-Photonics Foundation (No. 20220502) and the Takahashi Industrial and Economic Research Foundation (No. I2-003-13). In addition, part of this paper is based on the project commissioned by the Mechanical Social Systems Foundation and Optoelectronics Industry and Technology Development Association (“Formulation of strategies for market development of optical wireless power transmission systems for small mobilities”).

Institutional Review Board Statement

Not applicable.

Informed Consent Statement

Not applicable.

Data Availability Statement

Data is contained within the article.

Acknowledgments

The authors thank Kenta Moriyama, members of the T. Miyamoto Lab for discussion and assistance, and Yota Suzuki of the Open Facility Center of Tokyo Institute of Technology for design support and manufacturing of the equipment for the experiments.

Conflicts of Interest

The authors declare no conflicts of interest.

References

  1. Frolova, E.; Dobroskok, N.; Morozov, A. Critical Review of Wireless Electromagnetic Power Transmission Methods; Atlantis Press International B.V.: Saint-Petersburg, Russia, 2022. [Google Scholar]
  2. Hajimiri, A. Wireless Power Transfer at Distance. In Proceedings of the 2023 IEEE Custom Integrated Circuits Conference (CICC), San Antonio, TX, USA, 23–26 April 2023; pp. 1–4. [Google Scholar]
  3. Armenta, J.M.R.; Bazmohammadi, N.; Saha, D.; Vasquez, J.C.; Guerrero, J.M. Optimal Multi-Site Selection for a PV-Based Lunar Settlement Based on A Novel Method to Estimate Sun Illumination Profiles. Adv. Space Res. 2023, 71, 2059–2074. [Google Scholar] [CrossRef]
  4. Mishra, R.K.; Mishra, A.K. Space Based Solar Power: Feasibility Microwave Based Wireless Power System. J. Mar. Sci. Res. 2023, 2. [Google Scholar] [CrossRef] [PubMed]
  5. Nguyen, D.H. Dynamic Optical Wireless Power Transfer for Electric Vehicles. IEEE Access 2023, 11, 2787–2795. [Google Scholar] [CrossRef]
  6. Marko, I.P.; Duffy, D.A.; Misra, R.; Dattani, K.; Sweeney, S.J. Optical Wireless Power Transfer for Terrestrial and Space-Based Applications (Conference Presentation). In Proceedings of the Physics, Simulation, and Photonic Engineering of Photovoltaic Devices XII, SPIE OPTO, San Francisco, CA, USA, 30 January–1 February 2023; p. PC1241608. [Google Scholar]
  7. Liu, Q.; Xiong, M.; Liu, M.; Jiang, Q.; Fang, W.; Bai, Y. Charging A Smartphone Over the Air: The Resonant Beam Charging Method. IEEE Internet Things J. 2022, 9, 13876–13885. [Google Scholar] [CrossRef]
  8. Lahmeri, M.-A.; Kishk, M.A.; Alouini, M.-S. Charging Techniques for UAV-Assisted Data Collection: Is Laser Power Beaming the Answer? IEEE Commun. Mag. 2022, 60, 50–56. [Google Scholar] [CrossRef]
  9. Asaba, K.; Miyamoto, T. System Level Requirement Analysis of Beam Alignment and Shaping for Optical Wireless Power Transmission System by Semi–Empirical Simulation. Photonics 2022, 9, 452. [Google Scholar] [CrossRef]
  10. Setiawan Putra, A.W.; Kato, H.; Maruyama, T. Infrared LED Marker for Target Recognition in Indoor and Outdoor Applications of Optical Wireless Power Transmission System. Jpn. J. Appl. Phys. 2020, 59, SOOD06. [Google Scholar] [CrossRef]
  11. Imai, H.; Watanabe, N.; Chujo, K.; Hayashi, H.; Yamauchi, A. Beam-Tracking Technology Developed for Free-Space Optical Communication and Its Application to Optical Wireless Power Transfer. In Proceedings of the 4th Optical Wireless and Fiber Power Transmission Conference (OWPT2022), Yokohama, Japan, 18–21 April 2022; p. OWPT-5-01. [Google Scholar]
  12. Asaba, K.; Moriyama, K.; Miyamoto, T. Preliminary Characterization of Robust Detection Method of Solar Cell Array for Optical Wireless Power Transmission with Differential Absorption Image Sensing. Photonics 2022, 9, 861. [Google Scholar] [CrossRef]
  13. Asaba, K.; Miyamoto, T. Solar Cell Detection and Position, Attitude Determination by Differential Absorption Imaging in Optical Wireless Power Transmission. Photonics 2023, 10, 553. [Google Scholar] [CrossRef]
  14. Asaba, K.; Miyamoto, T. Positioning of a Photovoltaic Device on a Real Two-Dimensional Plane in Optical Wireless Power Transmission by Means of Infrared Differential Absorption Imaging. Photonics 2023, 10, 1111. [Google Scholar] [CrossRef]
  15. Asaba, K.; Miyamoto, T. Solar Cell Position, Attitude Determination by Differential Absorption Imaging in Optical Wireless Power Transmission. In Proceedings of the Physics, Simulation, and Photonic Engineering of Photovoltaic Devices XIII, SPIE OPTO, San Francisco, CA, USA, 29–30 January 2024; p. 12881-33. [Google Scholar]
  16. OS13CA5111A. Available online: https://www.optosupply.com/uppic/20211028118028.pdf (accessed on 29 December 2022).
  17. OSI5FU511C-40. Available online: https://akizukidenshi.com/download/OSI5FU5111C-40.pdf (accessed on 29 December 2022).
  18. Depth Camera D435. Available online: https://www.intelrealsense.com/depth-camera-d435/ (accessed on 15 May 2023).
  19. ATI—Advanced Technology Institute, Inc.—BioInformatics/Mathematical Information Engineering. Available online: http://www.advanced-tech-inst.co.jp/ (accessed on 14 February 2023).
  20. Cook, R.L.; Torrance, K.E. A Reflectance Model for Computer Graphics. ACM Trans. Graph. 1982, 1, 7–24. [Google Scholar] [CrossRef]
  21. Gregory, J. Ward Measuring and Modeling Anisotropic Reflection. Comput. Graph. 1992, 26, 8. [Google Scholar]
  22. Schlick, C. An Inexpensive BRDF Model for Physically-Based Rendering. In Computer Graphics Forum; Blackwell Science Ltd.: Edinburgh, UK, 1994; Volume 13, pp. 233–246. [Google Scholar]
  23. Walter, B.; Marschner, S.R.; Li, H.; Torrance, K.E. Microfacet Models for Refraction through Rough Surfaces. In Proceedings of the 18th Eurographics Conference on Rendering Techniques, Eurographics Association, Aire-la-Ville, Switzerland, 25–27 June 2007; pp. 195–206. [Google Scholar]
  24. Beckmann, P.; Spizzichino, A. The Scattering of Electromagnetic Wave from Rough Surfaces; Pergamon Press: New York, NY, USA, 1963. [Google Scholar]
  25. Trowbridge, T.S.; Reitz, K.P. Average Irregularity Representation of a Rough Surface for Ray Reflection. J. Opt. Soc. Am. 1975, 65, 531. [Google Scholar] [CrossRef]
  26. N- and p-Type GaAs|AXT Inc. Available online: http://www.axt.com/site/index.php?q=node/37 (accessed on 14 February 2023).
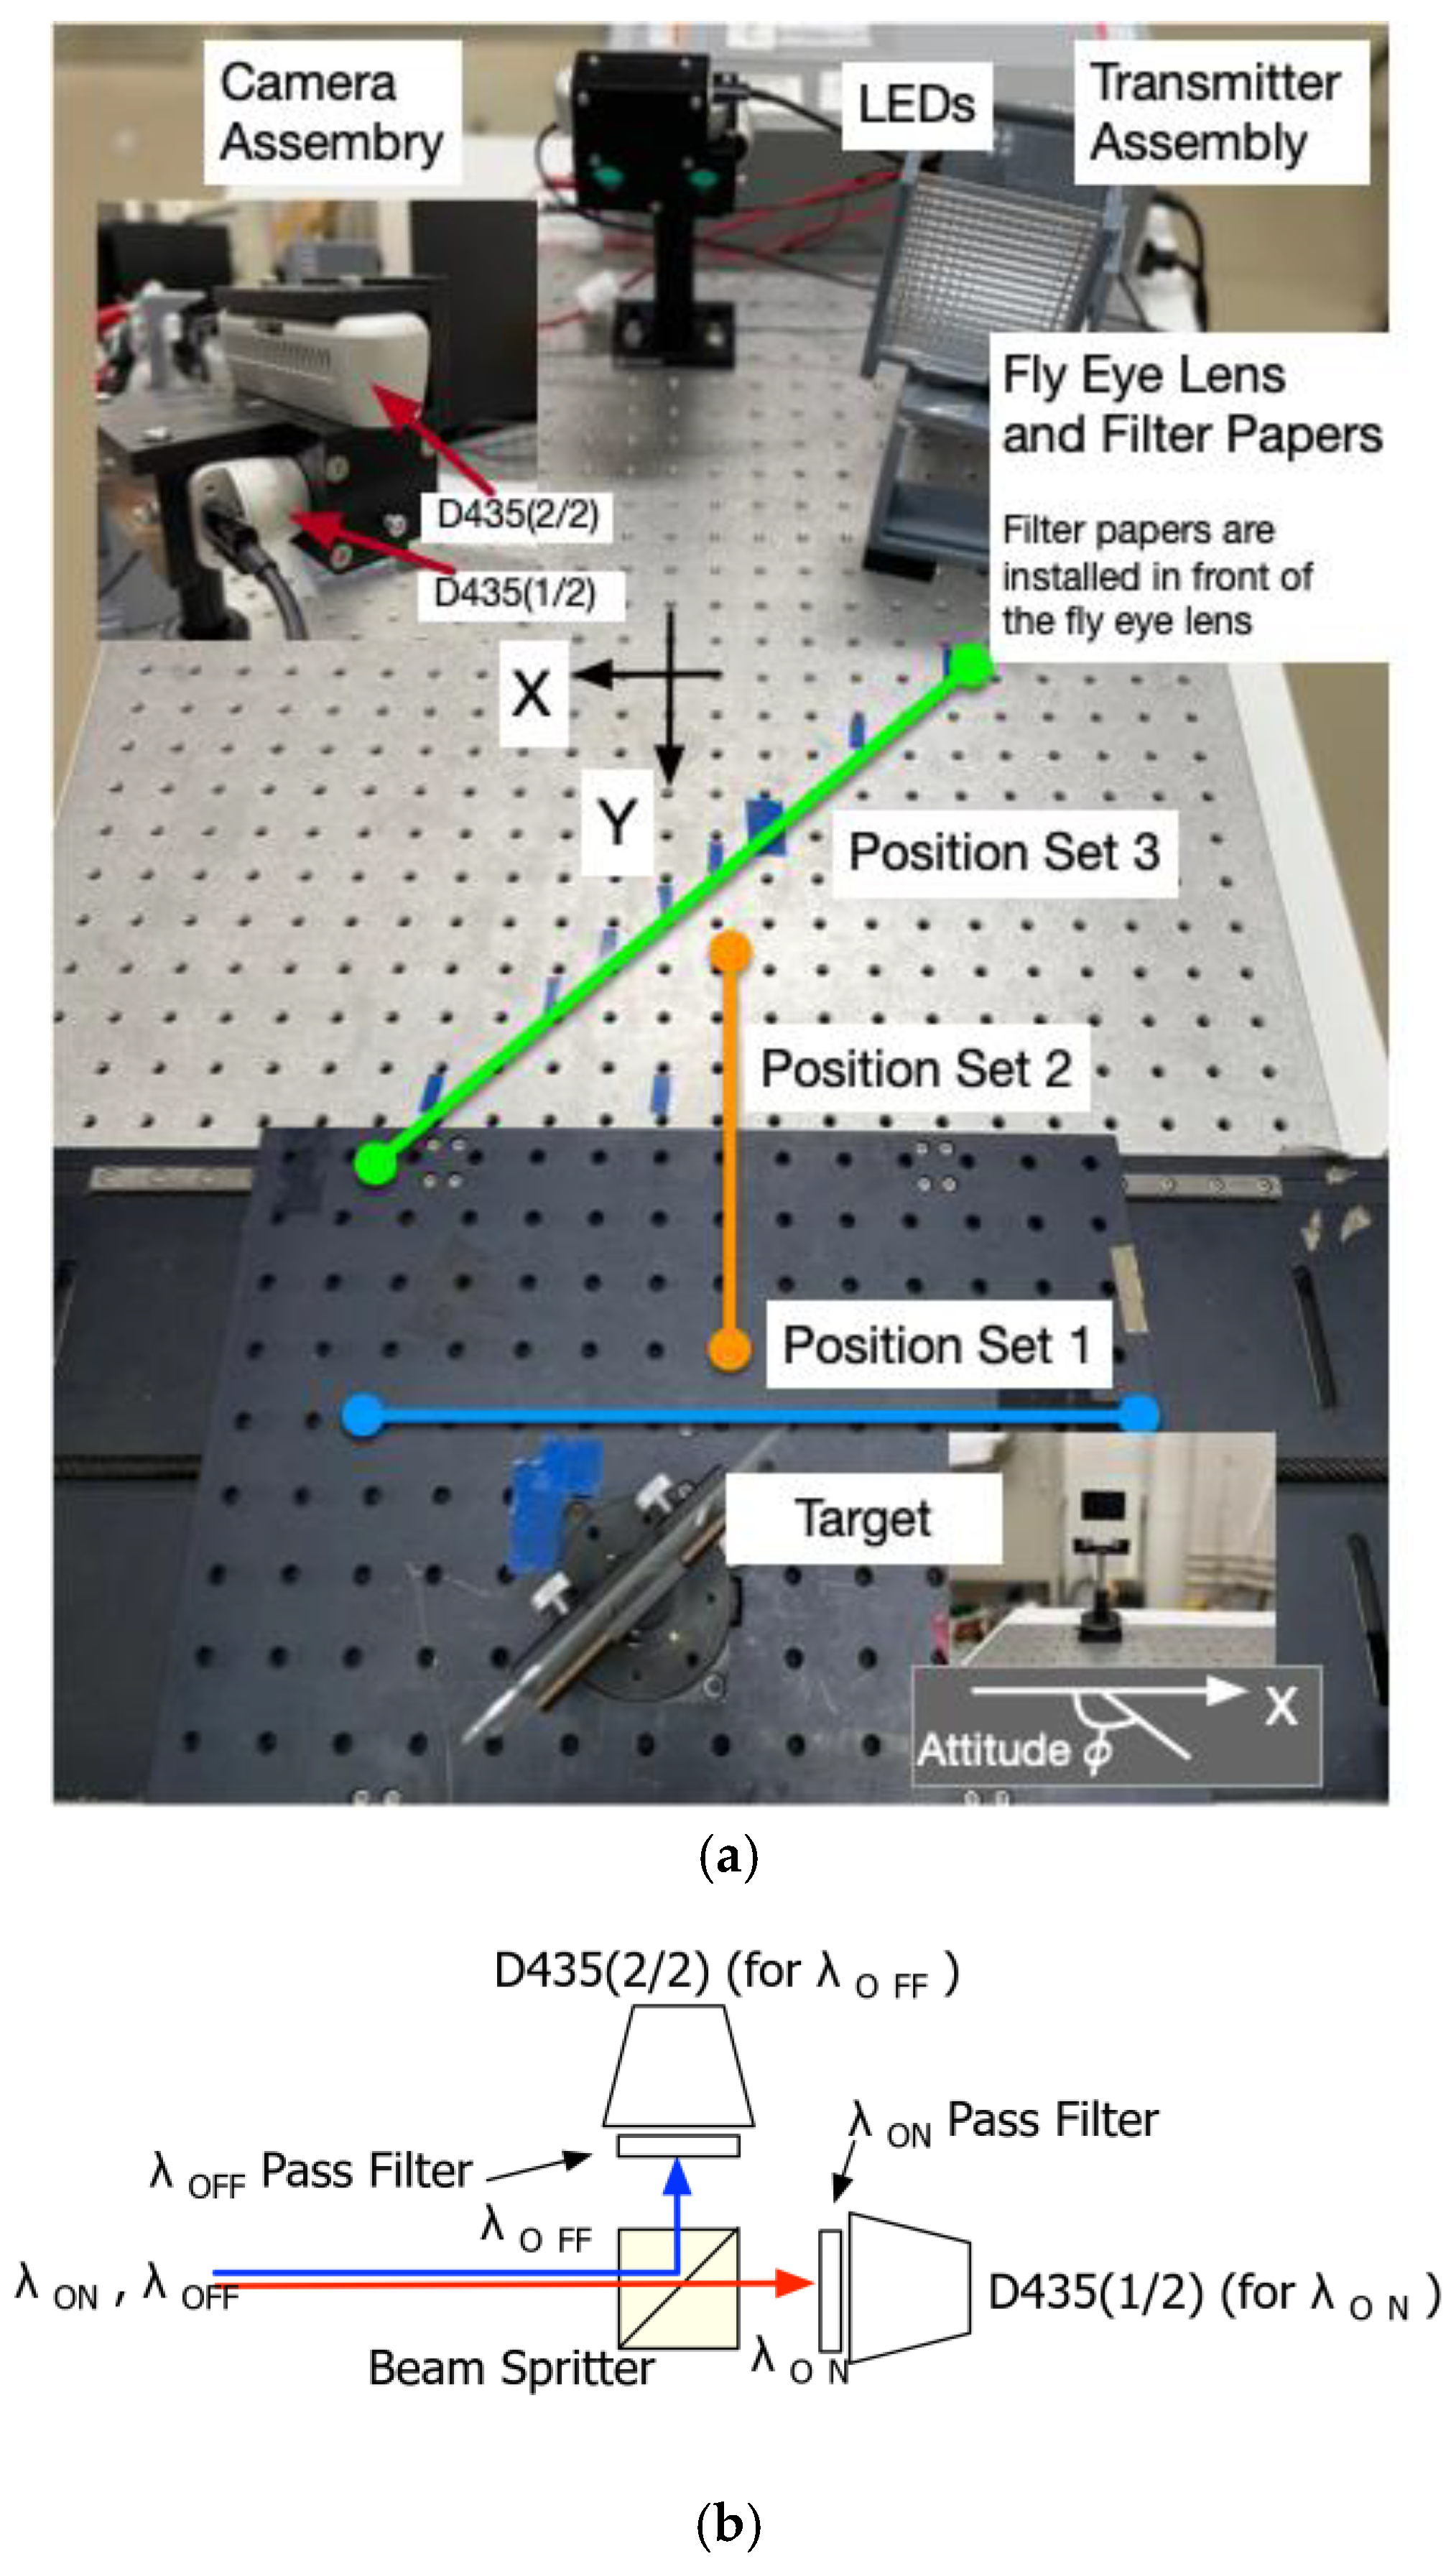
Figure 1. Configuration of the experiments. (a) Layout; (b) Camera Assembly configuration.
Photonics 11 00032 g001
Figure 2. Differential binarized images of the PV. The target was located at (0, 27).
Photonics 11 00032 g002
Figure 3. Convergence of the integrity measure. (a): C1, (b): C2.
Photonics 11 00032 g003
Figure 4. Convergence of positioning accuracy.
Photonics 11 00032 g004
Figure 5. Position estimation of the target at (0, 27).
Photonics 11 00032 g005
Figure 6. Minimum exposure time for integrity measure to converge. (a) Attitude dependence of the target at (0, 27); (b) Attitude estimation of the target at Position Set 1, 2, 3.
Photonics 11 00032 g006
Figure 7. Comparison of Beckmann and Trowbridge-Reitz distribution.
Photonics 11 00032 g007
Figure 8. Minimum exposure time model for integrity measure convergence.
Photonics 11 00032 g008
Figure 9. Attitude estimation of the points of Position Set 1, 2, and 3 based on the integrity measure model.
Photonics 11 00032 g009
Figure 10. Attitude angle error model.
Photonics 11 00032 g010
Figure 11. Attitude estimation based on the apparent width of the target. (a) GaAs PV at the points of Position Set 1, 2, and 3; (b) GaAs substrate at (0, 27).
Photonics 11 00032 g011
Table 1. Parameters in the experiments.
Transmitter Assembly
LED power4 mW (2 mW × 2) for both λ = 850 nm and 940 nm
Beam divergence85 deg (full angle)
Filter paper transmittance50%/paper(typical)
Target Assembly
GaAs substrate2-inch diameter
GaAs PV6 cm × 4 cm
Distance from the camera assembly660 mm(typical)
Attitude angle43~123 deg (typical)
Camera Assembly
CameraIntel D435TM × 2
Exposure time25, 50, 100, 250, 500, 1000, 2500, 5000, 10,000, 25,000, 50,000, 100,000 and 200,000 μ s
Image size640 × 480 px
Disclaimer/Publisher’s Note: The statements, opinions and data contained in all publications are solely those of the individual author(s) and contributor(s) and not of MDPI and/or the editor(s). MDPI and/or the editor(s) disclaim responsibility for any injury to people or property resulting from any ideas, methods, instructions or products referred to in the content.