Article

A Machine Learning Approach for Automated Detection of Critical PCB Flaws in Optical Sensing Systems

School of Computer Electronic and Information, Guangxi University, Nanning 530004, China
*
Author to whom correspondence should be addressed.
Photonics 2023, 10(9), 984; https://doi.org/10.3390/photonics10090984
Submission received: 10 August 2023 / Revised: 23 August 2023 / Accepted: 25 August 2023 / Published: 29 August 2023
(This article belongs to the Special Issue Optical Sensors: Science and Applications)

Abstract

:
The circuit boards in the fields of optical sensors and optical devices require extremely high levels of precision and performance. For instance, applications such as fiber optic communication, optical computing, biomedical devices, and high-performance computing devices all necessitate meticulous optical components. Any minute defect on the circuit boards of these components has the potential to adversely impact the performance of the entire device. Traditional circuit defect detection methods require manual inspection, which is very labor-intensive and time-consuming. The defect detection method based on deep learning can automatically learn features and more accurately find defects in printed circuit boards, improve detection efficiency, and reduce the workload, bringing better economic and social benefits. Based on the popular YOLOv8 model, this paper uses the open-source circuit defect dataset, introduces Wise IoU, proposes the W–YOLOv8 model, and uses the gradient gain allocation strategy of a dynamic non-monotonic focusing mechanism to make the model focus on ordinary-quality anchor boxes, which improves the performance of the original model. Experimental data show that the mAP50 of W–YOLOv8 is 97.3%, which is 1.35% higher than that of YOLOv8, and the mAP50-95 is 55.4%, which is 3.94% higher than that of YOLOv8.

1. Introduction

In the design of optical sensors and optical devices, printed circuit boards (PCBs) are a critical component, widely used in various optoelectronic products. In the actual pro-duction process, due to the numerous and complex manufacturing steps involved with the PCBs for optical sensors and optical devices, defects might occur on the surface of the circuit board at any given stage. These defects could potentially affect the performance, and even the safety, of the optical sensors and optical devices. The traditional printed circuit board defect detection methods include manual visual inspection and mechanical testing, of which the manual detection method is the most traditional method. With this method, one directly observes the panel using the human eye; although the cost is low, due to the manual detection, limited worker experience, emotions, physiology, and other subjective factors, the detection error rate is usually higher. In mechanical testing, contact detection is usually used and the position of the object needs to be adjusted during the detection process to achieve the best detection effect; however, the efficiency is also relatively low [1]. Therefore, it is more interesting to study how to improve the detection efficiency of surface defects of PCBs for optical sensors and optical devices.
In the current research on defect identification, the main methods used include traditional image algorithms, machine learning, and deep learning. In terms of image algorithms, a hybrid algorithm using morphological segmentation and image differentiation is proposed. For this, researchers use single-layer, bare, and grayscale computers to generate PCB templates and test images and use a morphological image segmentation algorithm and PCB defect detection and classification system that simplifies image processing theory to improve the image processing algorithm by applying segmentation exercises to achieve defect detection [2]. In addition, combined with image difference, image subtraction, image addition, image comparison, and other methods, the comprehensive algorithm is used to process the defect image on the circuit surface from different angles, and five kinds of defects such as missing hole, pinhole, under-etch, short-circuit, and open-circuit are successfully detected [3]. In machine learning, support vector machines are used to classify the types of defects and median filtering, background removal, morphological manipulation, segmentation, and labeling are used in the detection phase. A support vector machine (SVM) is used to identify the defect pattern after size adjustment, but this method requires complex feature engineering on the dataset, screening out the main features that are conducive to providing model detection capabilities, and removing useless features [4]. The deep learning method uses neural networks to automatically extract target features by learning multiple times on sample pictures and can obtain a detection model with high accuracy. To enrich the dataset, a semi-supervised defect detection method based on a data expansion strategy (DE-SSD) can be adopted and the model of YOLOV5 can be used to identify circuit defects. The specific implementation of the data expansion (DE) strategy is to use labeled samples of other datasets to extend the target dataset to improve the detection accuracy [5]. When training with labeled and unlabeled data, perturbing the unsupervised loss of unlabeled data with two different augmentations helps improve the performance of the model in the case of insufficient or incorrect data labeling [6]. With the continuous development of deep learning combined with the advantages of conditional GAN, Trans GAN, and YOLOV5, the trained model can generate high-quality synthetic images conditional on class embedding, enhance the number and diversity of the original training set, further improve the accuracy of PCB electronic component identification, and detect, classify, and locate multiple defects in low-resolution bare board PCB images [7,8].
In terms of the improvement of the detection algorithm, it is improved based on YOLOV3; the algorithm uses real PCB pictures and synthetic PCB pictures as a joint training dataset, adjusts the original three YOLO output layers to four YOLO output layers, generates 12 anchor frames for electronic component detection, improves the recognizability of training electronic components, and provides certain help for data enhancement, thus having a certain effect on improving the model. The improved Kmeans++ algorithm is adopted to reduce the possibility of unstable anchor box clustering results caused by random selection of a clustering center so that the model can obtain a reasonable original anchor box and, at the same time, add a coordinate attention mechanism to design the CA-PAN network and use it for the neck network of the YOLO model. Multidimensional modeling of image feature channel relationships is realized [9,10].
Aiming at the problem of defect detection of printed circuit boards, combined with the research work of relevant literature, the small target detection problem in detection is studied and a defect detection improvement model, W–YOLOv8, that introduces the Wise-IoU loss function and improves the performance of the existing model is proposed. The highlights of this study are as follows.
(1) Using the defect dataset of the open-source printed circuit board, the characteristics of the image were studied, the image data were statistically processed, and the VOC format data of the dataset were converted into YOLO format and divided into the training set and test set at the same time, which is convenient for better training of the model.
(2) based on YOLOv8, the Wise-IoU loss function mechanism is introduced, which helps the model effectively reduce the contribution of simple examples to the loss value, effectively reduce the competitiveness of easy examples, perform tasks more accurately and flexibly, and selectively focus on some features, thereby improving the performance of the model during complex tasks.
(3) Through the improvement of the existing model, the ability of printed circuit board defect detection is improved, which has a certain theoretical reference value in the field of industrial production.

2. Materials and Methods

2.1. Datasets

The experimental dataset is based on the open-source printed circuit board defect dataset from Peking University [11,12]. The dataset contains 6 kinds of defects: missing hole, mouse bite, open-circuit, short, spur, and spurious copper. A total of 1386 images can be used for detection, classification, and labeling tasks. The resolution of each image is 3034 × 1586; the horizontal and vertical resolution is 72 dpi and the bit depth is 24. A total of 693 images were selected as the dataset and the number of images in each category is as follows: during the model training process, 544 images in the dataset were used as the training set and 149 as the test set [13,14]. The original format of the dataset is VOC, which includes two folders: Annotations and JPEGImages, storing annotation files and original images, respectively. In the subsequent experiments reported in this article, it is necessary to convert the data from VOC format to the format for the YOLO model. The overview of the dataset is shown in Table 1; examples of six defects in the image are shown in Figure 1.

2.2. Related Defect Detection Algorithm

2.2.1. OpenCV

OpenCV is an open-source cross-platform computer vision and machine learning software library [15] that is used for the comprehensive processing of images, can complete detection and recognition tasks, and can track targets, widely used in the field of computer vision. In terms of defect detection, it can be processed according to the process in Figure 2, and these small-area defects can be extracted using morphological algorithms in OpenCV, such as corrosion, expansion, open operation, closed operation, etc. The implementation methods include: delimiting the region of interest, resizing the image, processing the edge and outline of the image, converting the color space, and performing open and closed operations on the target area [16,17]. However, this method has relatively poor performance compared with deep learning models such as TensorFlow or PyTorch in the implementation of object detection scenarios. In addition, while OpenCV has begun to integrate deep learning capabilities, its support in this area is still not as comprehensive as other frameworks that specialize in deep learning such as YOLO or Faster R-CNN.

2.2.2. Deep Learning

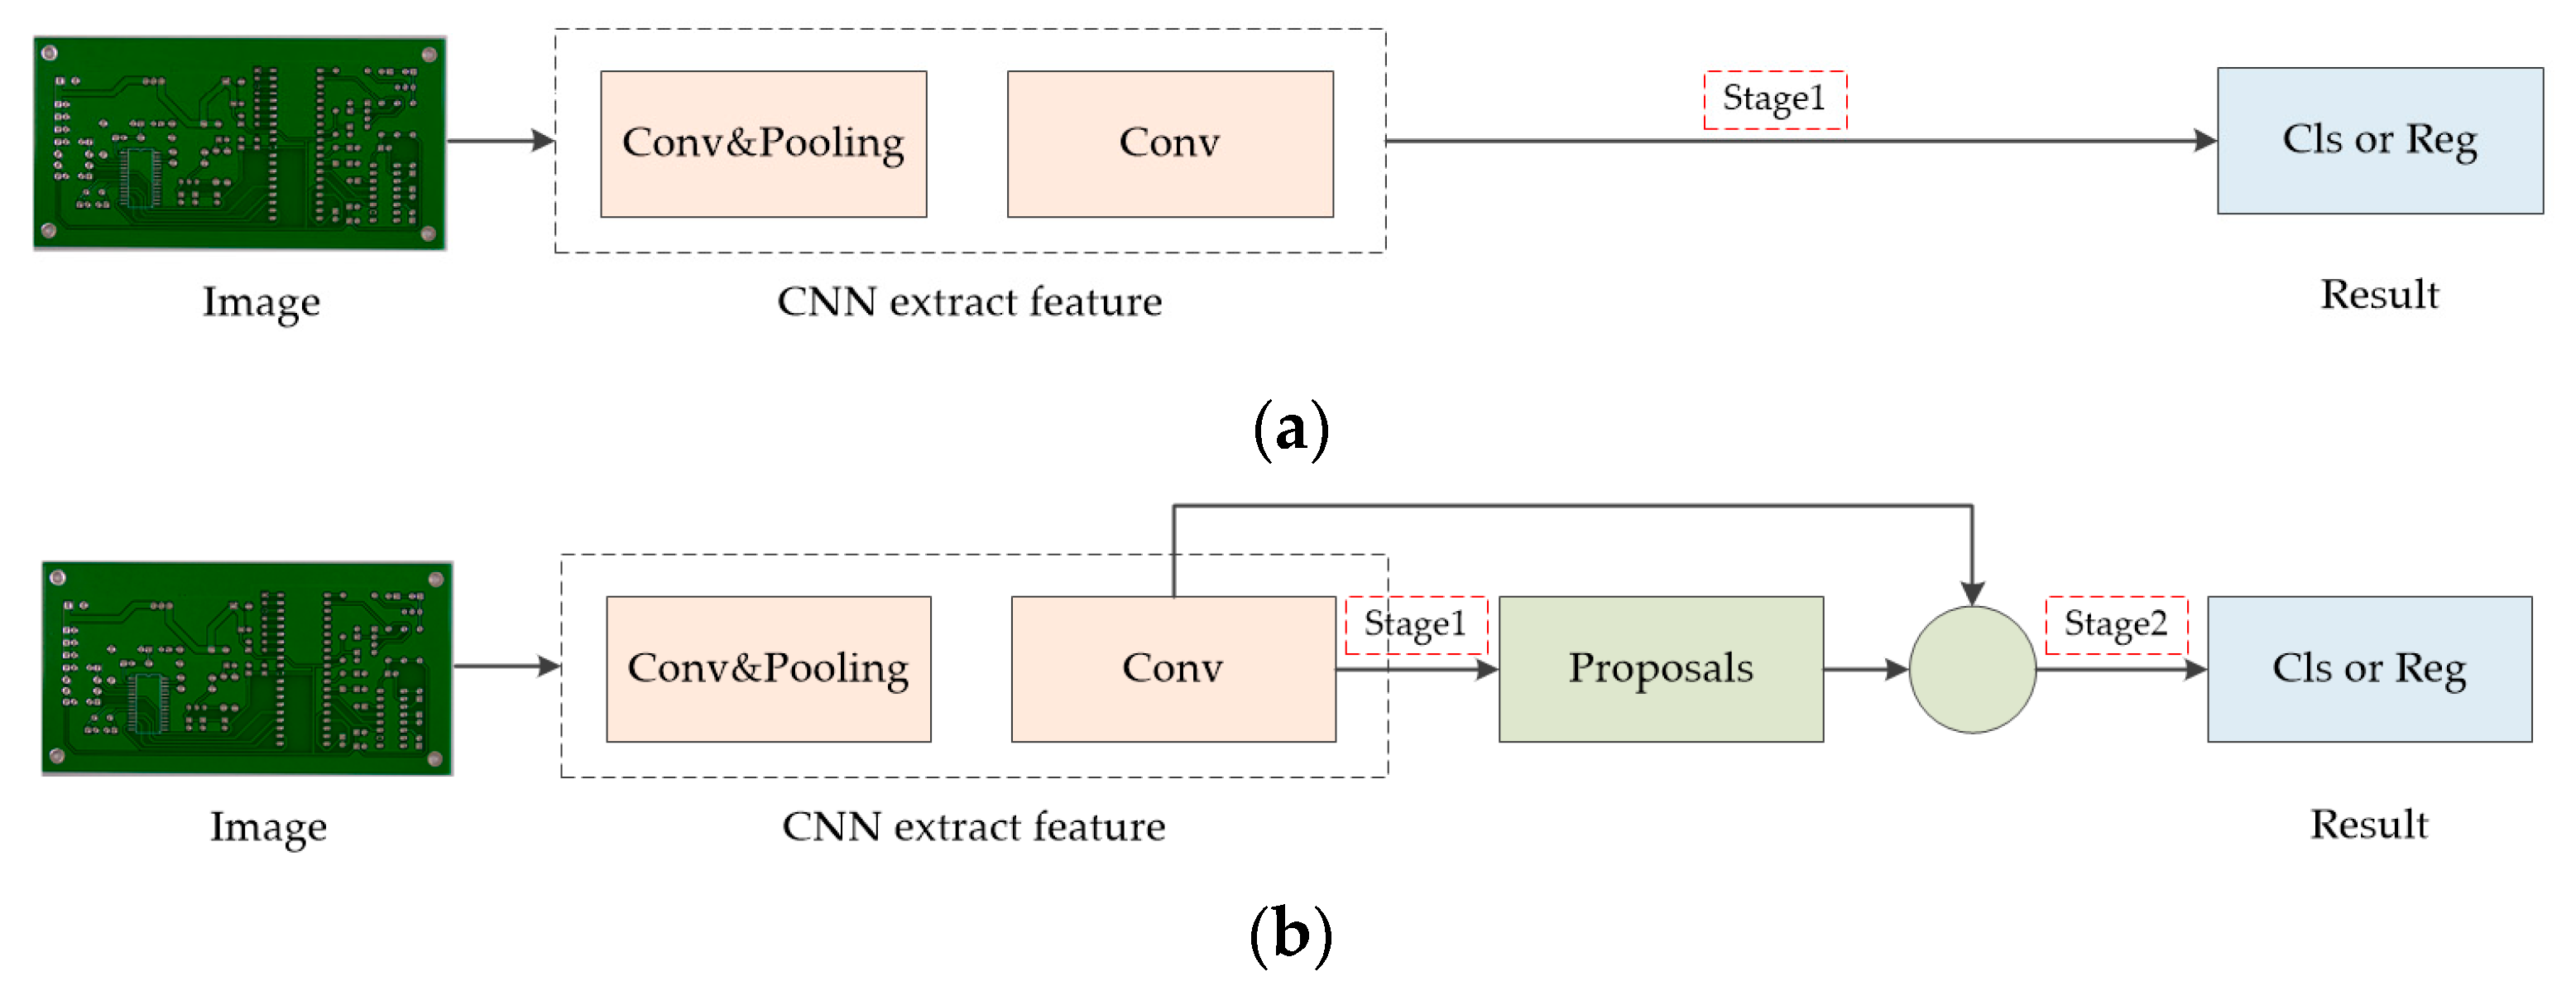
Deep learning is based on continuous learning of sample data and involves using multi-layer neural networks to mine the internal rules and representation levels of data, summarizing the characteristics of sample data, relying on algorithms to automatically extract features, imitating the operation mode of the human brain, and learning from experience. Knowledge is widely used in many fields such as natural language processing, image processing, object detection, style transfer, and so on. The field involved in this paper is target detection. Mainstream deep learning target detection algorithms can be classified as one- or two-stage. The one-stage algorithms mainly include SSD [18,19], YOLO, G-CNN, etc. Their main feature is fast speed but low accuracy. The two-stage algorithms mainly include RCNN [20], Fast RCNN [21], Faster RCNN [22], etc. Figure 3 compares the process differences between the two algorithms.
Through the comparison of the two algorithms, it can be seen that the one-stage algorithm is fast and can easily learn the generalization characteristics of the object to avoid false positives caused by background errors. The two-stage algorithm adds a step so the speed is slower. The one-stage algorithm is the preferred method for detecting defects in printed circuit boards because in the field of industrial production, it is hoped to be able to quickly detect printed circuit boards so as not to affect production efficiency. YOLO is one of the most popular one-stage algorithms.

2.3. Model

2.3.1. YOLOv8

The YOLO algorithm is a fast and accurate object detection algorithm that works by taking the entire image as input and dividing each pixel into multiple bounding boxes of different sizes to detect multiple objects in the picture [23,24]. Each bounding box has a confidence level that indicates the presence or absence of an object in that frame and the location and category of all targets are outputted at once via a convolutional neural network. The algorithm is an end-to-end algorithm. Using a fully connected layer to predict boxes and categories, it can process the entire image without pre-processing steps, effectively reducing computing resources and time overhead during training and testing, and can adjust the model faster, which is widely used in the field of real-time object detection. Compared to other detection models, The YOLO model boasts the advantage of exceptional speed without significantly compromising accuracy. Unlike traditional methods that apply classifiers to various regions of an image, YOLO performs object detection in a single forward pass of the network, allowing it to operate in real-time. Additionally, by treating object detection as a regression problem, YOLO can predict both object classes and their respective bounding box coordinates simultaneously, which results in a holistic understanding of images and potentially fewer false positives.
YOLOV8 is the latest algorithm of the YOLO series; it adopts a new SOTA model and a new network backbone structure and provides N/S/M/L/X scale models of different sizes, which can meet the needs of industries in different fields. Figure 4 is the overall network structure diagram of YOLOv8.
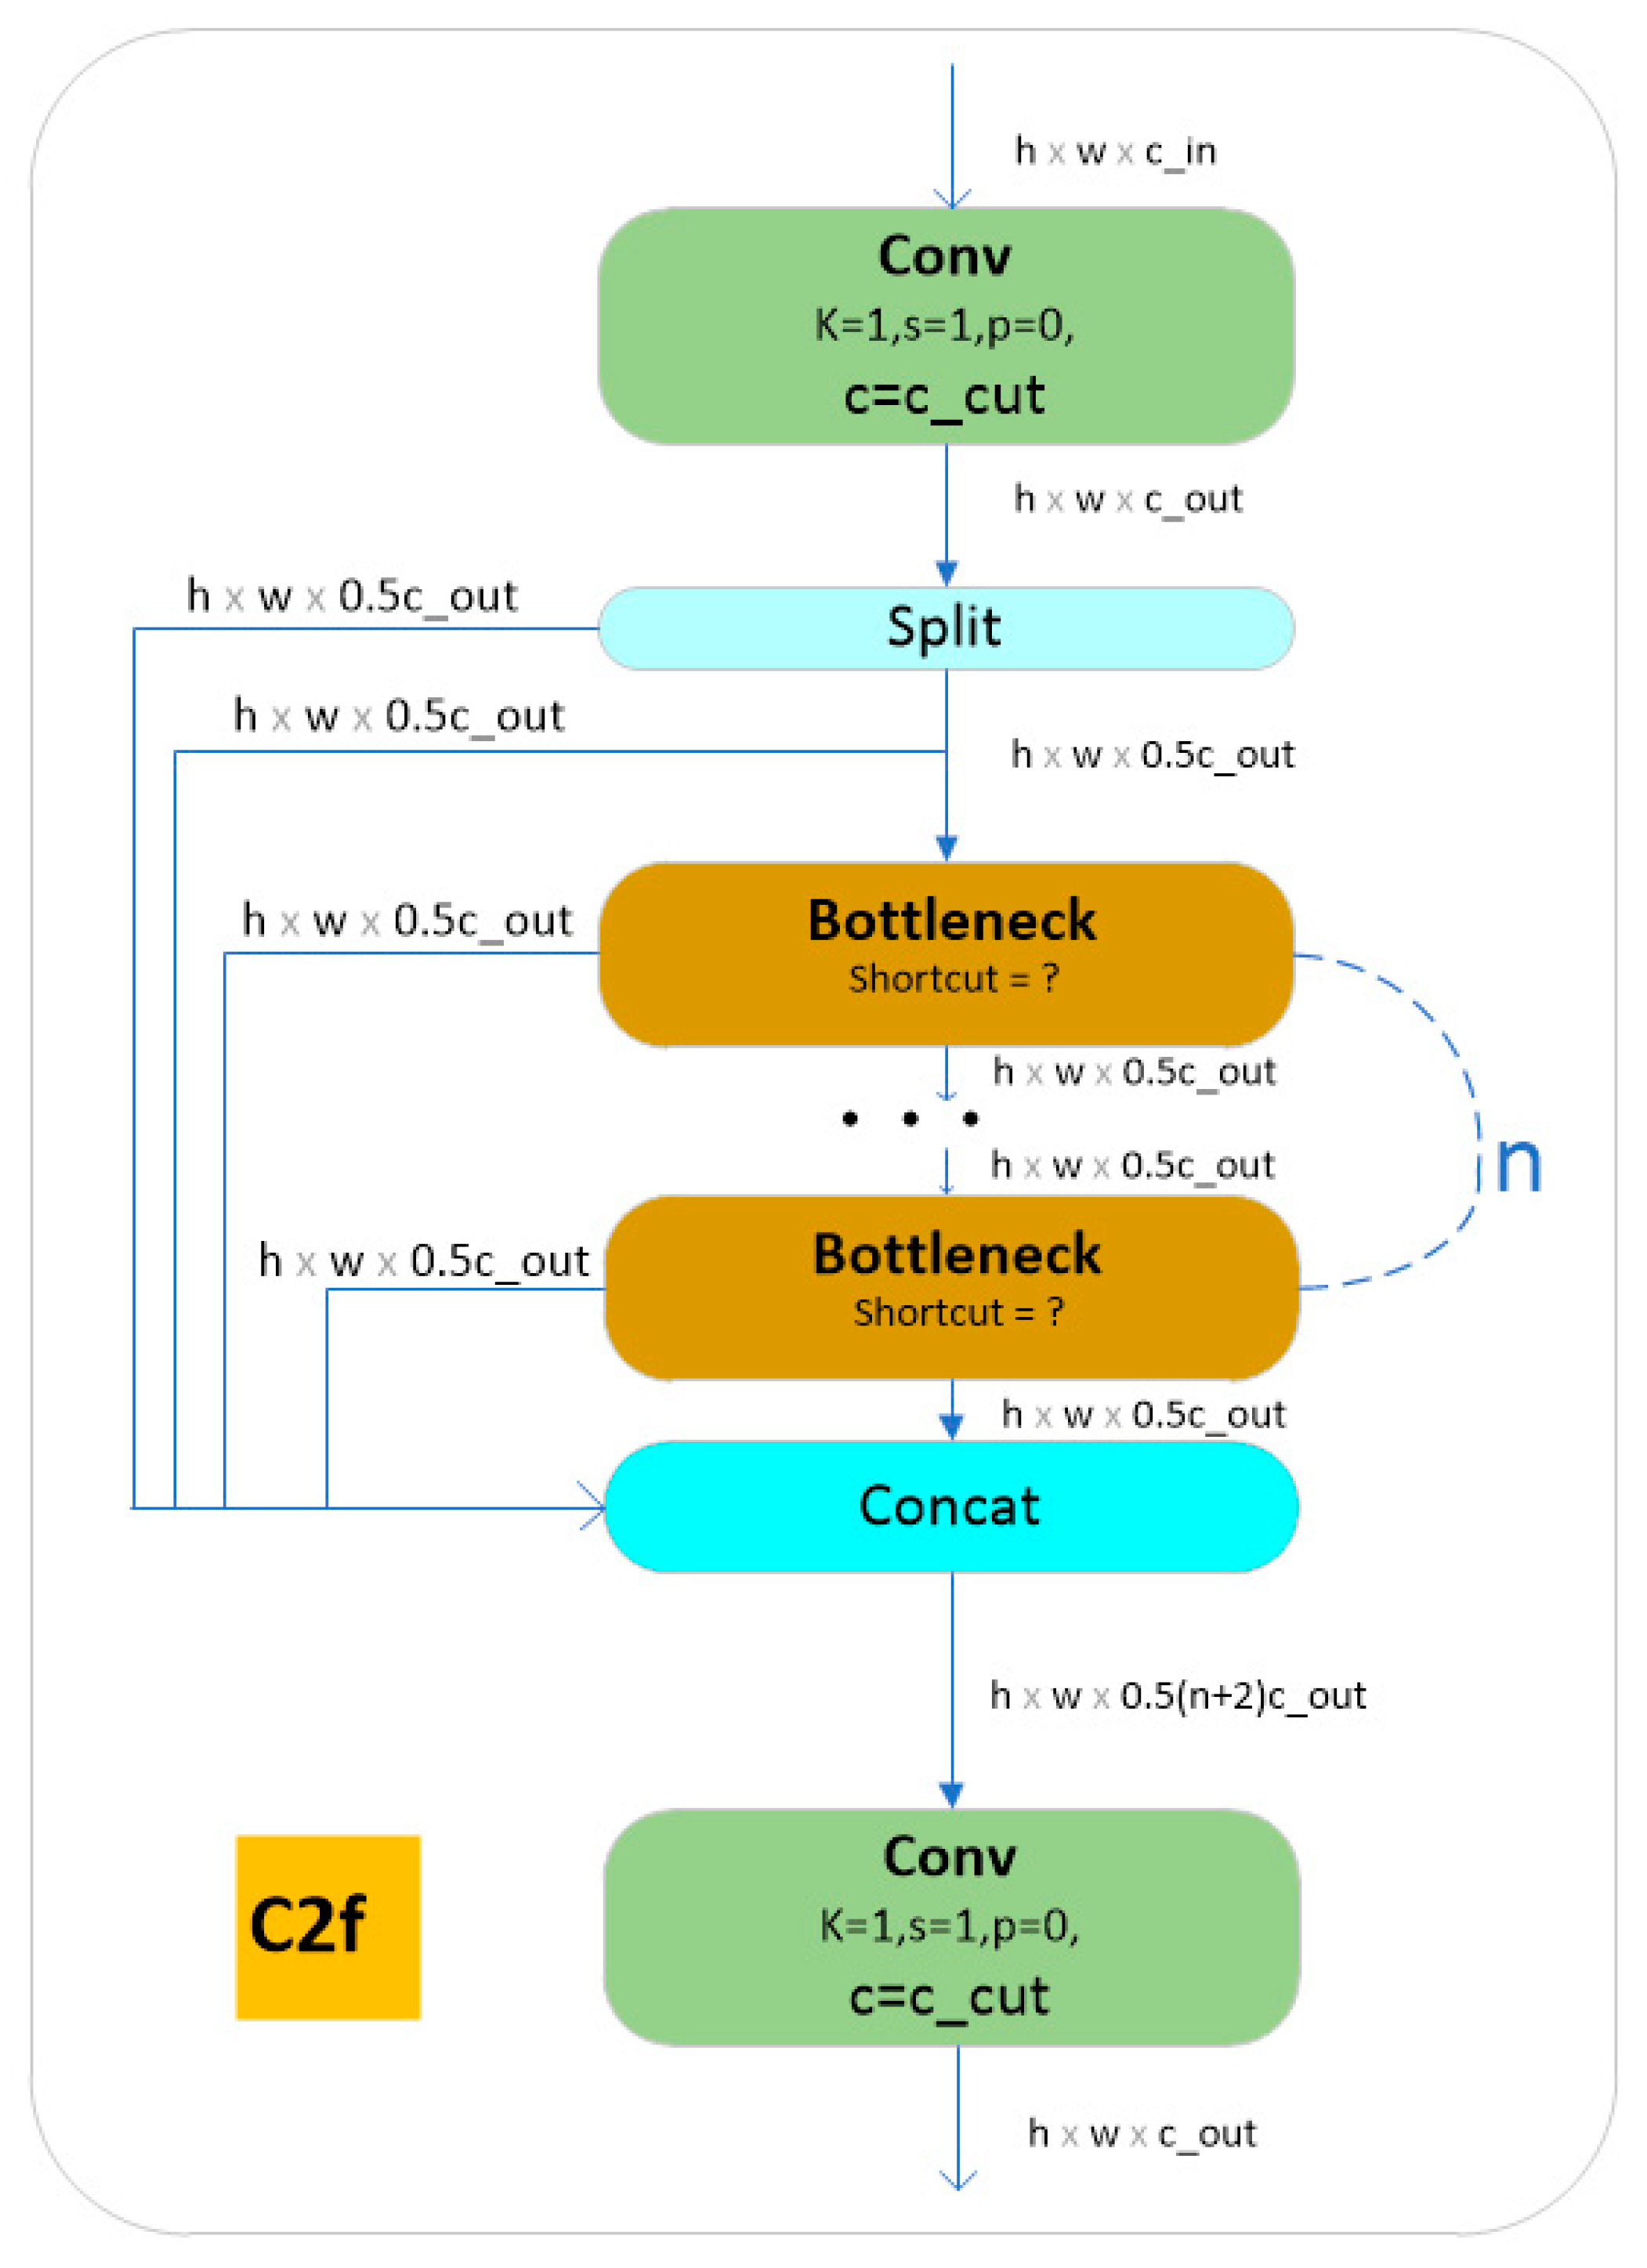
YOLOv8 draws on the excellent features of previous generations of networks. The backbone network and Neck partially follow the ideas of CSP, replacing the C3 module in YOLOv5 with a gradient flow richer C2f module, as shown in Figure 5. The convolutional structure in the PAN-FPN upsampling stage in YOLOv5 is removed [25,26,27], the outputs of the features by different stages of Backbone are directly fed into the upsampling operation, and different channel numbers are set for different scale models, enabling more flexible structural adaptability.
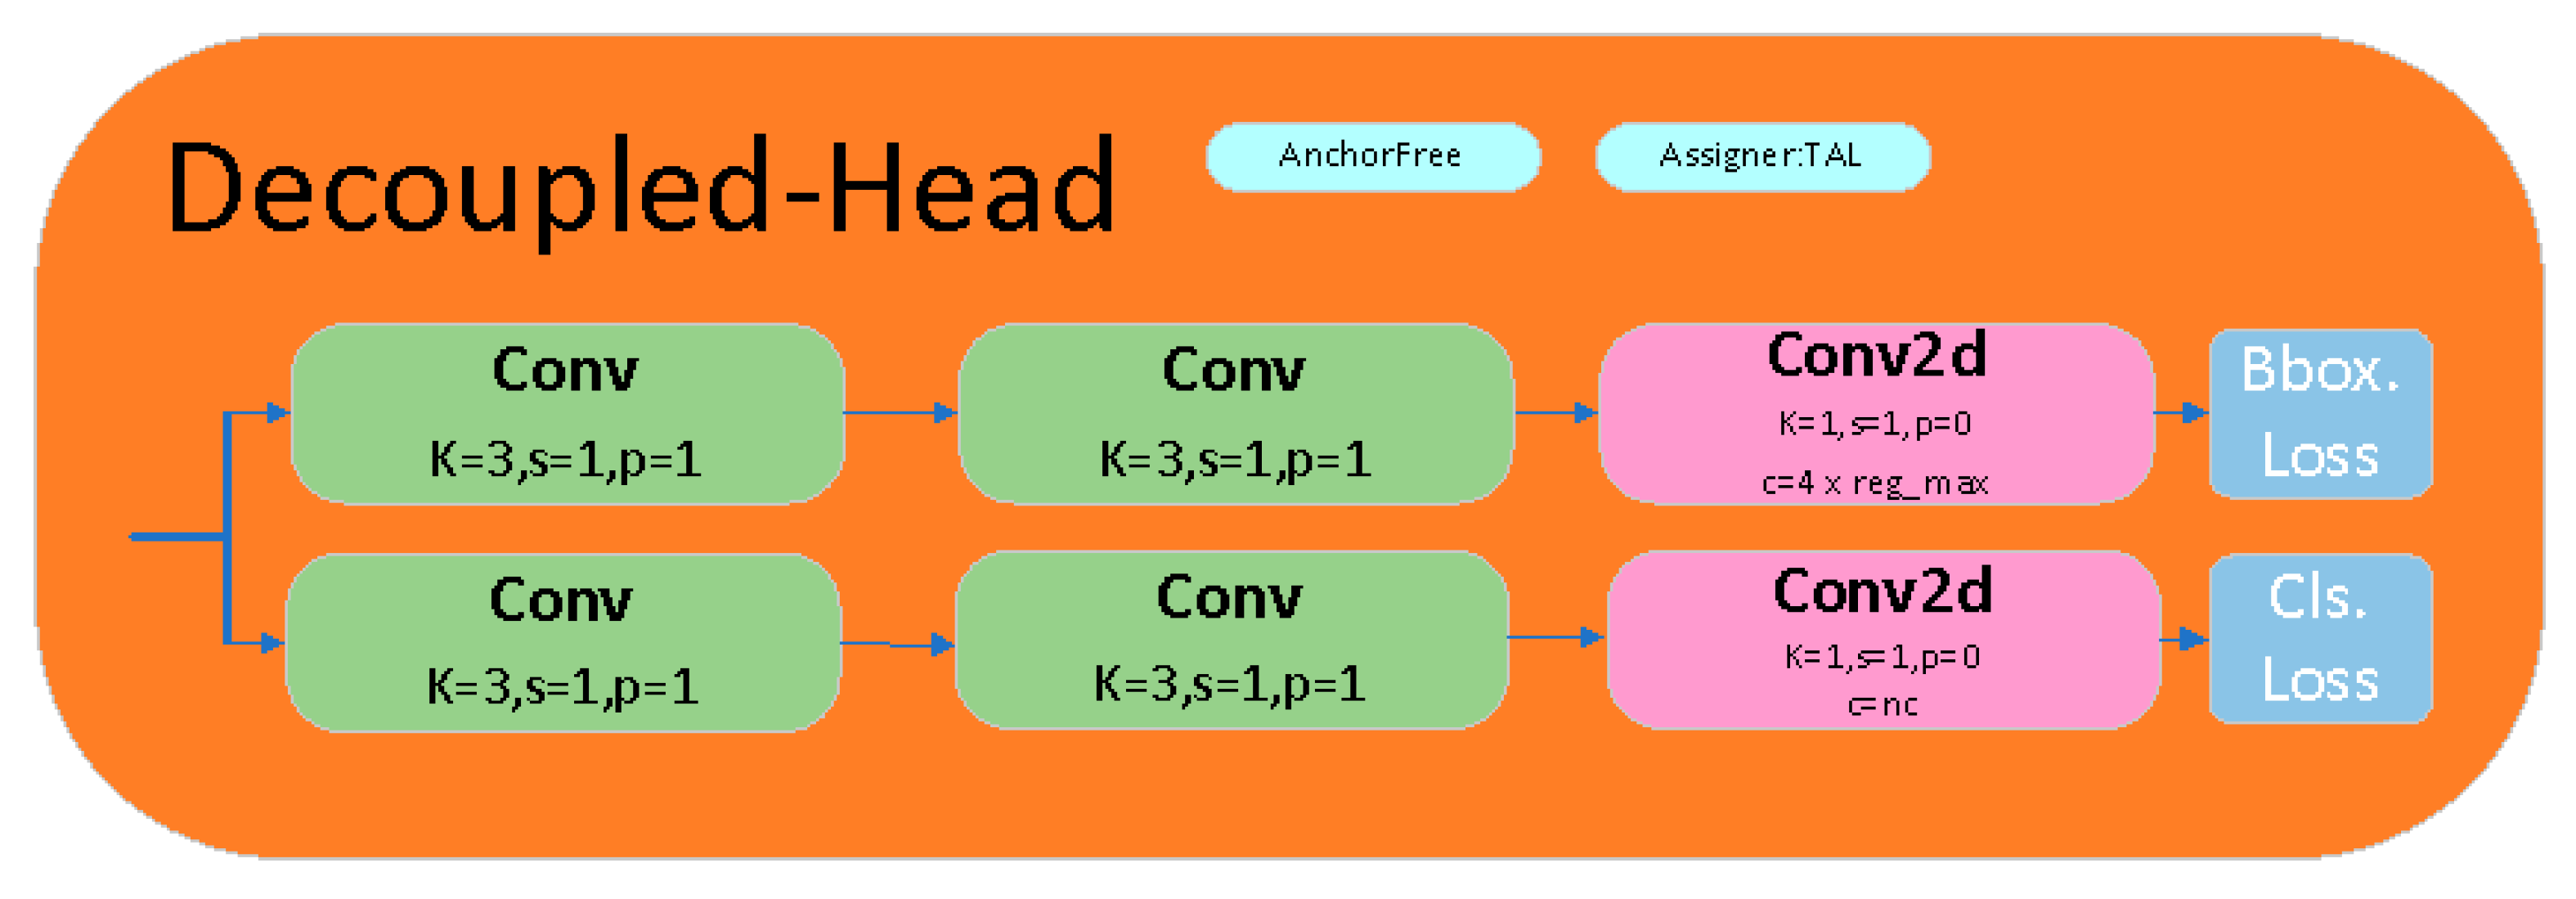
The part of HEAD is updated to Decoupled Head as shown in Figure 6, separating the classification and detection heads, and from the Anchor-Based YOLOv5 to Anchor-Free, which integrates multiple deep learning techniques and employs a variety of strategies to improve the accuracy of object detection [28,29].
The SPPF module shown in Figure 7 is proposed by Glenn Jocher. Although based on SPP, it is much faster than SPP [30,31,32], so it is called SPP-Fast. For the three MaxPool serial connections in the module, the kernel size is 5*5; the overall effect is equivalent to SPP, but it reduces the amount of computation and improves the model operation speed.
In terms of loss calculation, the previous IOU matching or unilateral proportional allocation method is abandoned and Task-Aligned Assigner is used, BEC Loss is used for classification tasks, and CIoU Loss is used for regression tasks. Through the improvement of the previous model version, YOLOv8 is more extensible as it not only supports the previous version but also facilitates users switching to different versions according to different business scenarios. This makes it one of the best object detection algorithms available as it can complete object detection, instance segmentation, and image classification tasks.

2.3.2. W–YOLOv8

The full name of IOU is intersection over union, which is a common parameter in the field of object detection mainly used to calculate the overlap rate of “predicted border” and “real border”, which is a method to measure positioning accuracy [33]. The IoU was computed as follows:
I o U = T P FP + TP + FN  
where FP, FN, and TP denote the number of false positives, false negatives, and true positives, respectively, for the defect class. IoU through GioU [34,35] and then DIoU and finally developed to CioU. CIoU takes into account the distance between the target and the frame anchor, overlap rate, scale, and penalty terms, making the target box regression more stable [36,37]. YOLOv8 also uses CIoU, which is defined as follows:
C I o U = I o U ρ 2 ( b , b g t ) c 2 α υ
α = υ 1 I o U + υ
υ = 4 π 2 ( arctan ω g t h g t arctan ω h ) 2
where b is a parameter that predicts central coordinates, b g t represents the parameter of the center of the real target bounding box, ρ 2 ( b , b g t ) represents the Euclidean distance between the center point of the prediction box and the real box, c represents the diagonal distance of the minimum closure region that can contain both the prediction box and the real box, and ω , h, ω g t , and h g t represent the height and width of the prediction box and the height and width of the real box, respectively.
CIoU loss involves inverse trigonometric functions, which consume a certain amount of computing power during the calculation process and reduce the overall training time. In order to solve this problem, WIoU is introduced in YOLOv8, and the gradient gain distribution strategy of the dynamic non-monotonic focusing mechanism is used to optimize the performance of the model. There are three different versions of WIoU, with certain differences between each version [38].
(1) Wise-IoU v1
It is inevitable that the training dataset will contain low-quality sample data, and geometric measures such as distance and aspect ratio will increase the penalty for low-quality sample data, thereby reducing the generalization performance of the model. A good loss function should weaken the penalty of geometric metrics when the anchor frame and the target frame coincide well, avoid excessive intervention, and ensure that the model has better generalization ability [39]. Based on this, distance attention is constructed according to the distance metric, and WIoU v1 with a two-layer attention mechanism is obtained, which is defined as follows:
L W I o U v 1 = R W I o U L IoU  
R W I o U = exp ( ( x x g t ) 2 + ( y y g t ) 2 W g 2 + H g 2   )
L I o U = 1 I o U
where W g and H g are the size of the smallest enclosing box.
(2) Wise-IoU v2
Focal loss designs a monotonic focusing mechanism for cross entropy, which effectively reduces the contribution of simple examples to the loss value. This allows the model to focus on difficult examples and obtain improved classification performance. WIoU v2 is based on this construction, which solves the problem of slow convergence in the later stage of training; the equation is defined as follows:
L W I o U v 2 = L I o U γ * L W I o U v 1 ( γ > 0 )
where L * I o U is the monotonic focusing coefficient for L I o U .
(3) Wise-IoU v3
W–YOLOv8 uses Wise-IoU v3 for loss regression, which is defined as follows:
L W I o U v 3 = r R W I o U L I o U
r = β δ α β δ    
The equation contains two hyperparameters, β and δ . Different hyperparameters may be suitable for different models and datasets, and if β = δ , r = 1, the anchor box will achieve the highest gradient gain when the outlier of the anchor box meets β = C (C is fixed). Because the quality division standard of the anchor frame is dynamic, WIoU v3 can make the gradient gain distribution strategy that is most in line with the current situation at each moment [40]. In the experiment, by modifying the source code of YOLOv8, replacing the content of the bbox_iou function with the content of WioU, and selecting different versions of WioU through configuration, the flexibility and scalability of W–YOLOv8 are improved.

2.3.3. Model Evaluation

To objectively reflect the performance of the improved algorithm, the model is evaluated by multiple parameter standards, including precision, recall rate, AP, and mAP.
Precision represents the probability of precision positive samples in all predicted positive samples and measures the probability that the positive examples predicted by the model are real positive examples [41,42]. Recall refers to the probability of being predicted as a positive sample in the actual positive sample, which measures the ability of the model to find all positive examples [43]. Accuracy and recall rate are contradictory measures. In general, high accuracy means a low recall rate and low precision means a high recall rate. Precision alone cannot measure the quality of the classifier. mAP (mean average precision). The AP value of multiple classes is averaged to measure the detection of multiple classes. The larger the mAP, the better the model.
A P = P ( r ) d r
m A P = 1 N 1 N A P i

3. Experimental Results and Discussion

The operating system used in this experiment is Ubuntu 18.04, the CPU is Inter (R) Core TM i7-10700, the main frequency is 2.9 GHz, the graphics card is NVIDIA GeForce RTX 2060 SUPER, and the memory is 7974 M. The length and width of the images trained by the input model are uniformly set to 640 px, the batch size is set to 6, the optimizer is SGD, and the number of iterations is 1000. If the results after model training are not improved in the last 100 rounds, the training is terminated in advance to save time. In this experiment, YOLOv8 ended early after 695 rounds and W–YOLOv8 stopped after 1000 rounds, indicating that YOLOv8 is unable to improve model performance with continued training, while W–YOLOv8 has more room for improvement.

3.1. Model

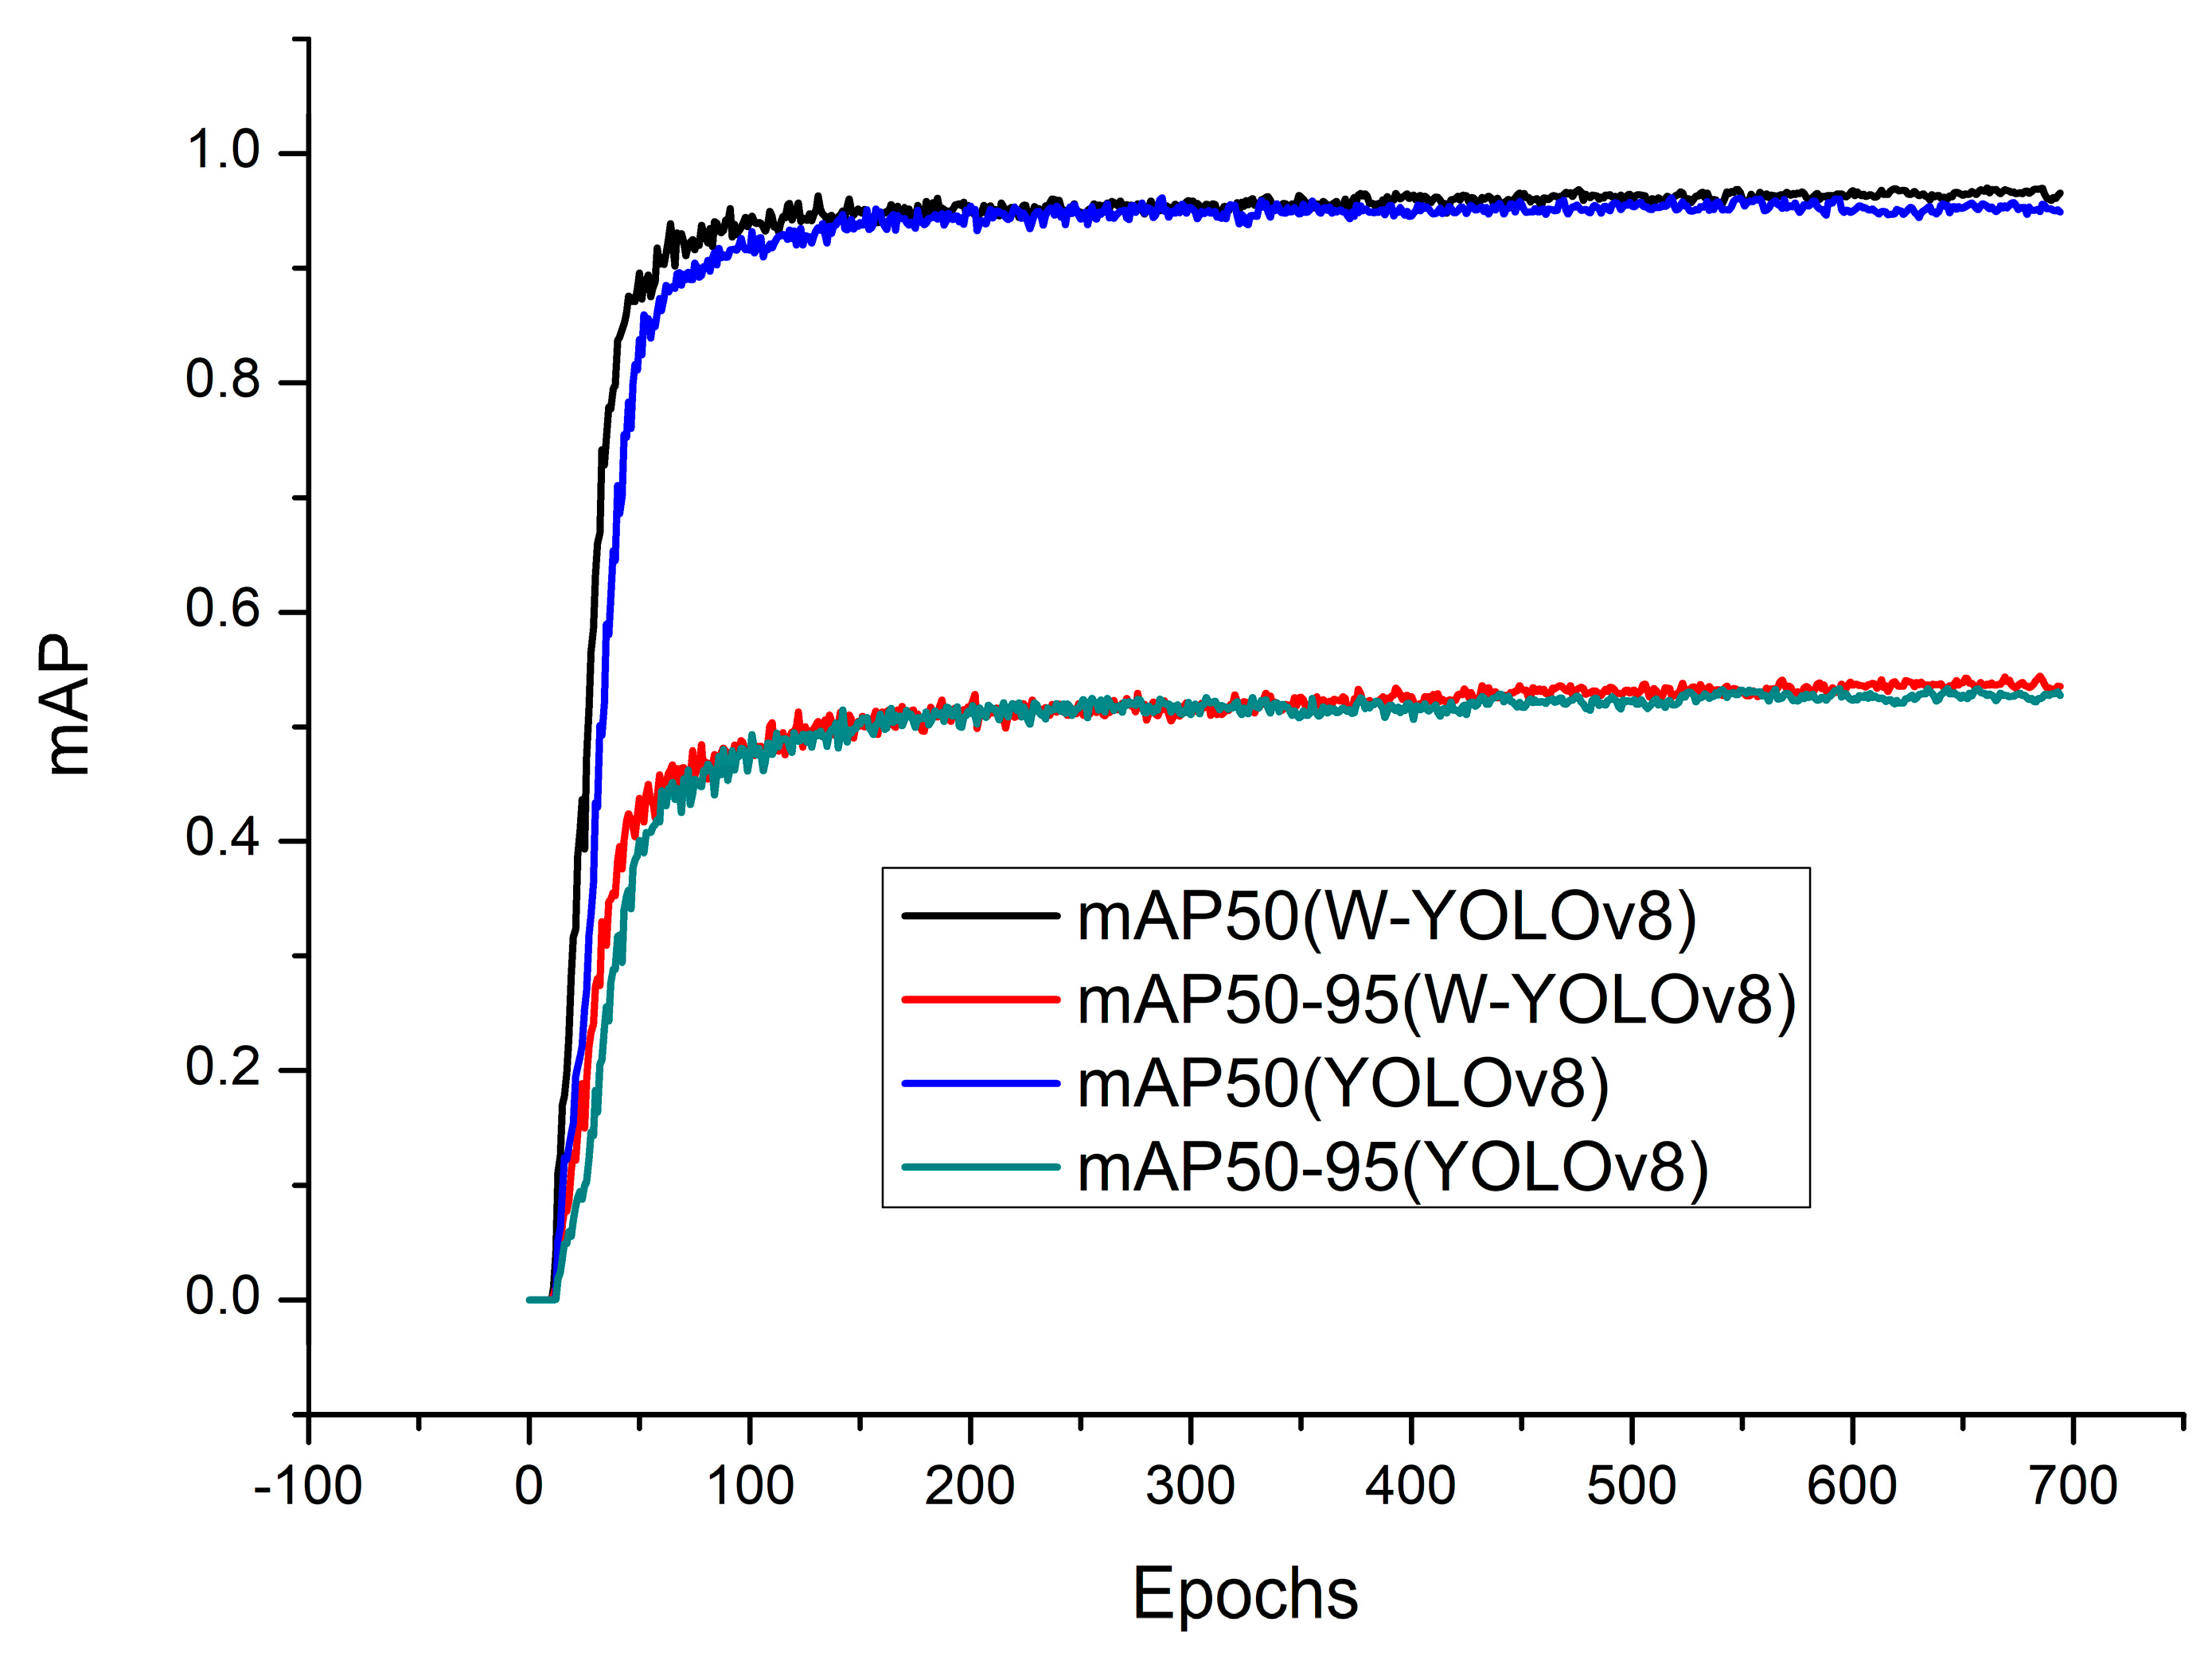
Figure 8 shows the results of the learning curves between YOLOv8 and W–YOLOv8. The improved YOLOv8 model has stronger overall learning ability and can converge faster. The value of mAP50 of W–YOLOv8 is 97.3%, which is 1.54% higher than that of YOLOv8 before improvement, and the value of mAP50-95 is 55.4%, which is 3.94% higher than that of YOLOv8 before improvement, which proves the effectiveness of introducing Wise IoU to improve the model. In this paper, the W–YOLOv8 model has a good detection effect on printed circuit defect detection in an industrial production environment, which improves the performance of YOLOv8 to a certain extent and solves the problems of complicated processes and low recognition rate of traditional printed circuit defect detection.
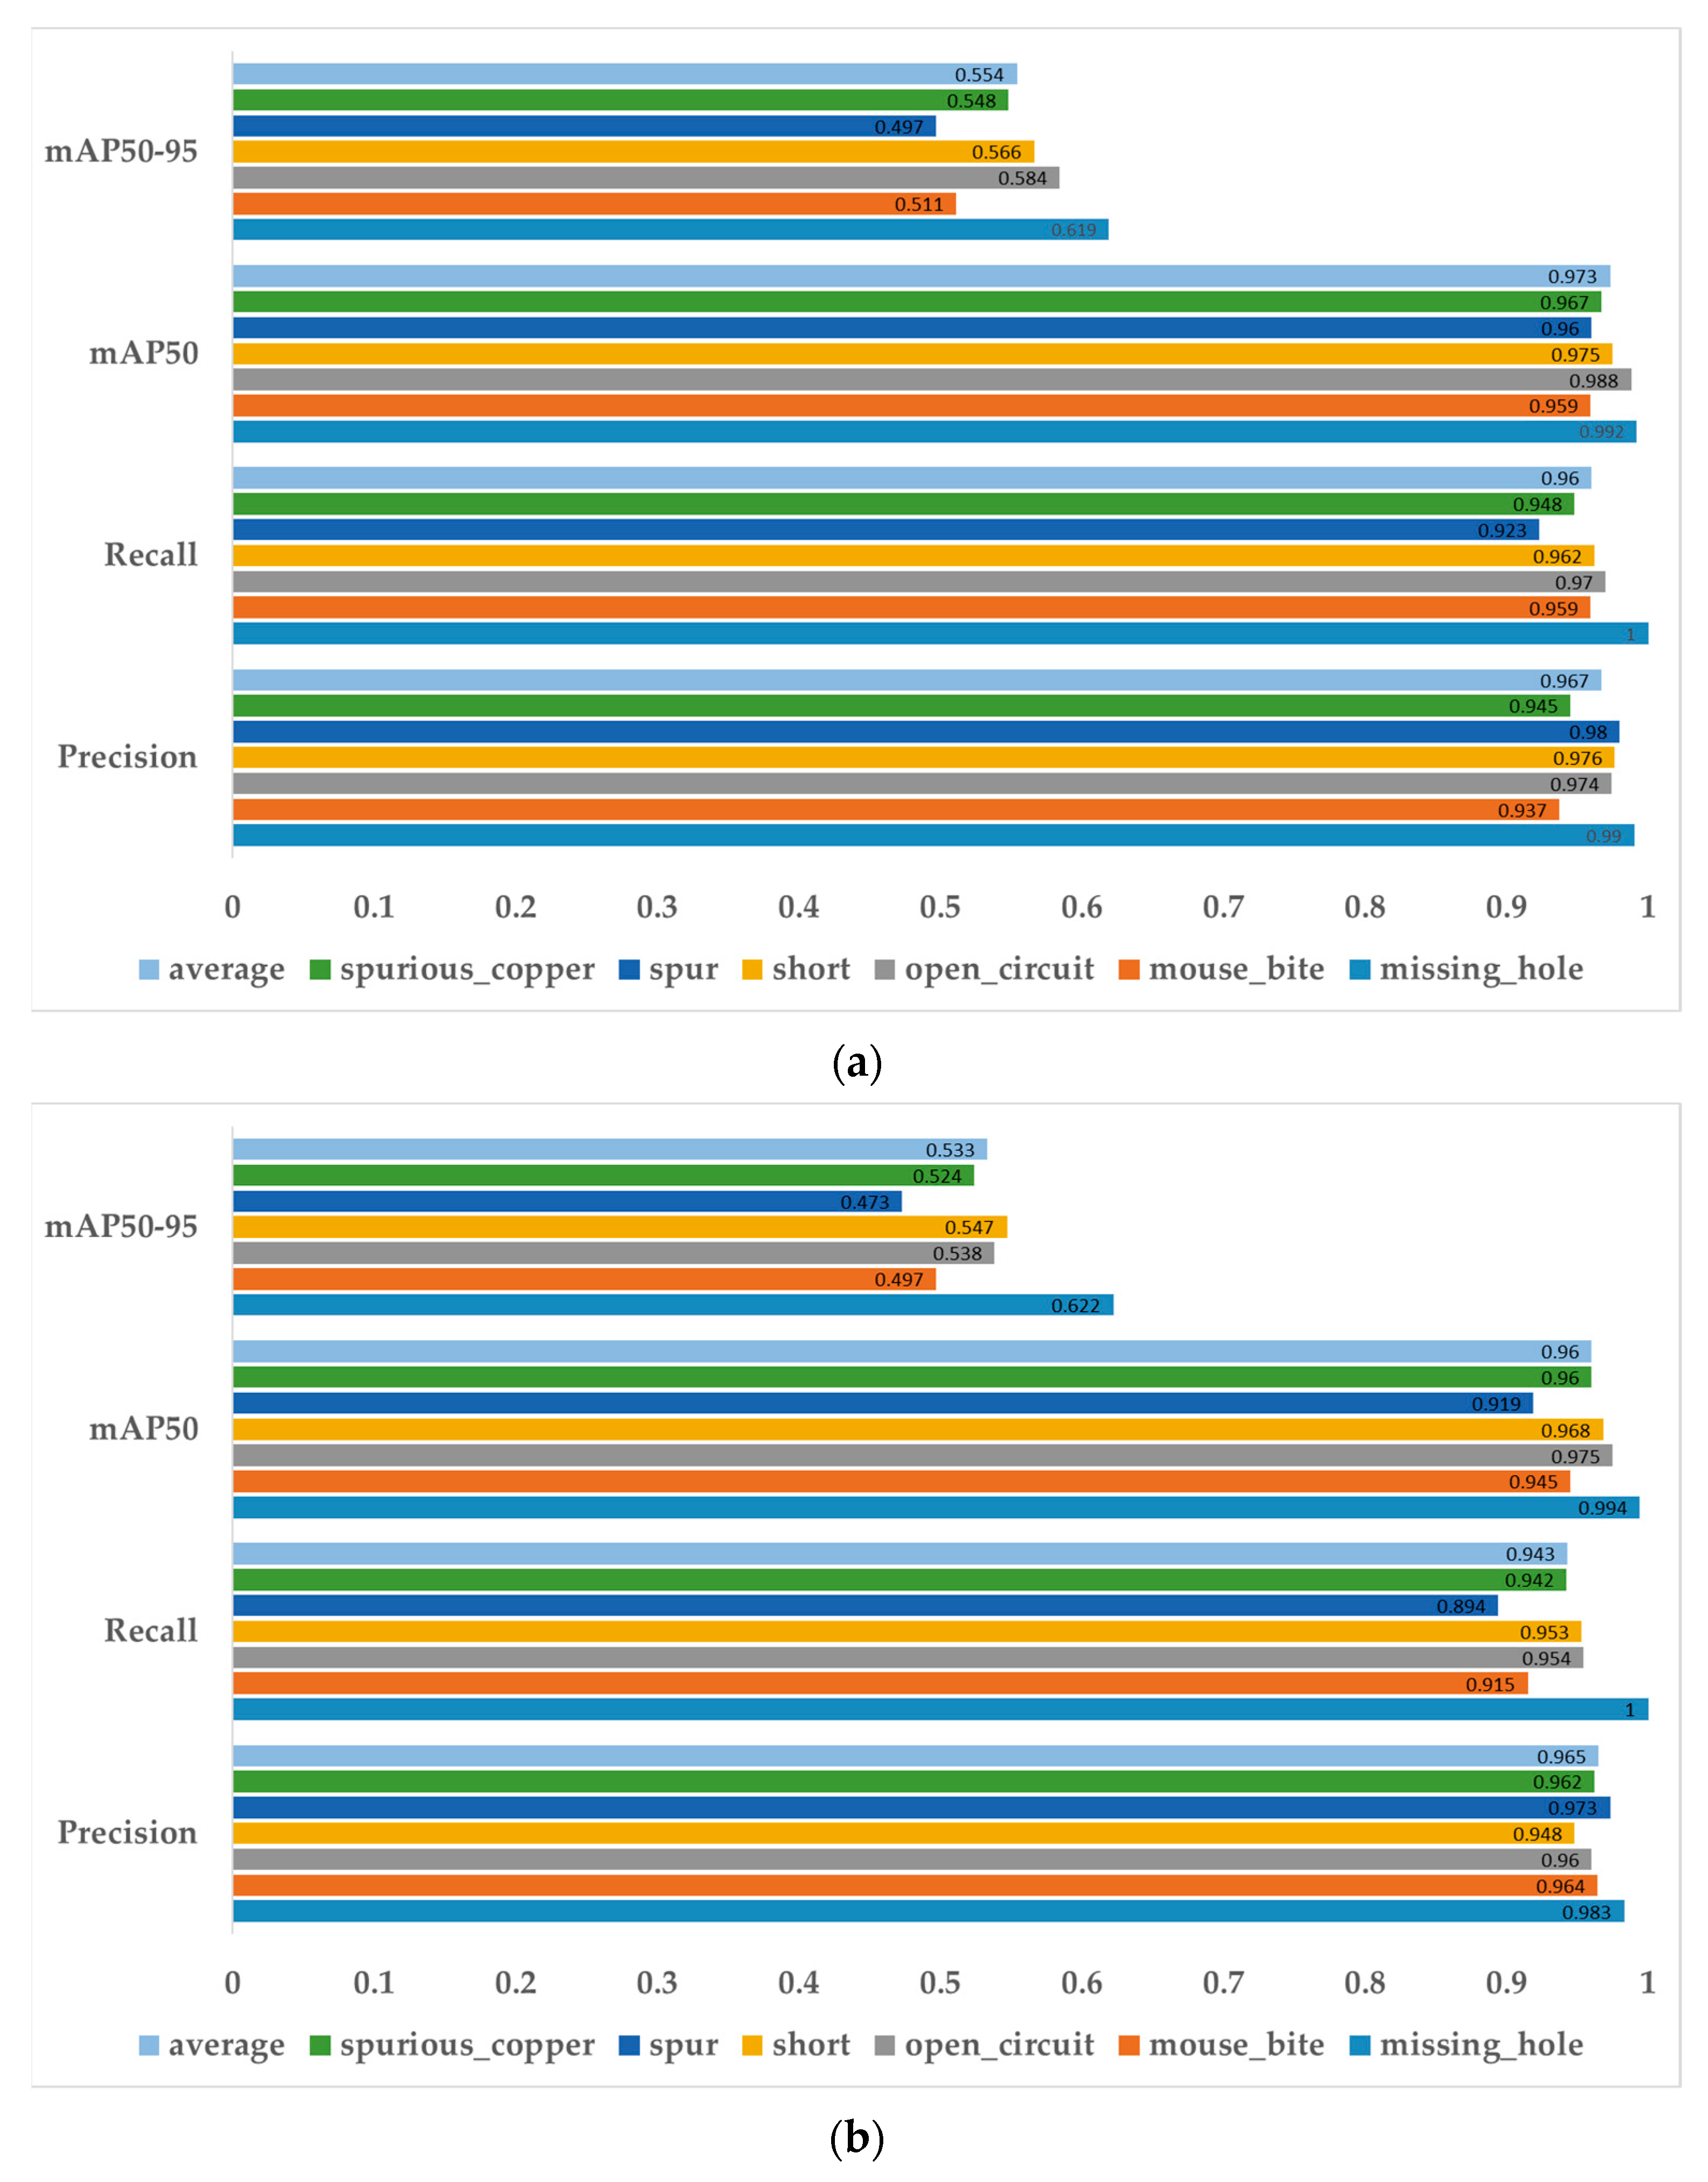
The experiments used YOLOv8 and W–YOLOv8 in the test set of the printed circuit defect dataset, and the results of precision, recall, and average accuracy for six categories are shown in Table 2 and Figure 9. According to the results, the mAP50-95 of W–YOLOv8 outperformed YOLOv8 in six categories, and the performance of six defects in the missing hole, mouse bite, open-circuit, short, spur, and spurious copper improved by −0.48%, 2.82%, 8.55%, 3.48%, 5.07%, and 4.58%, respectively. The experimental data can further show that the detection performance of the W–YOLOv8 algorithm after integrating Wise IoU is better than that of YOLOv8 for the more difficult defects. The detection performance of the algorithm is better than that of YOLOv8.

3.2. Training Results of W–YOLOv8

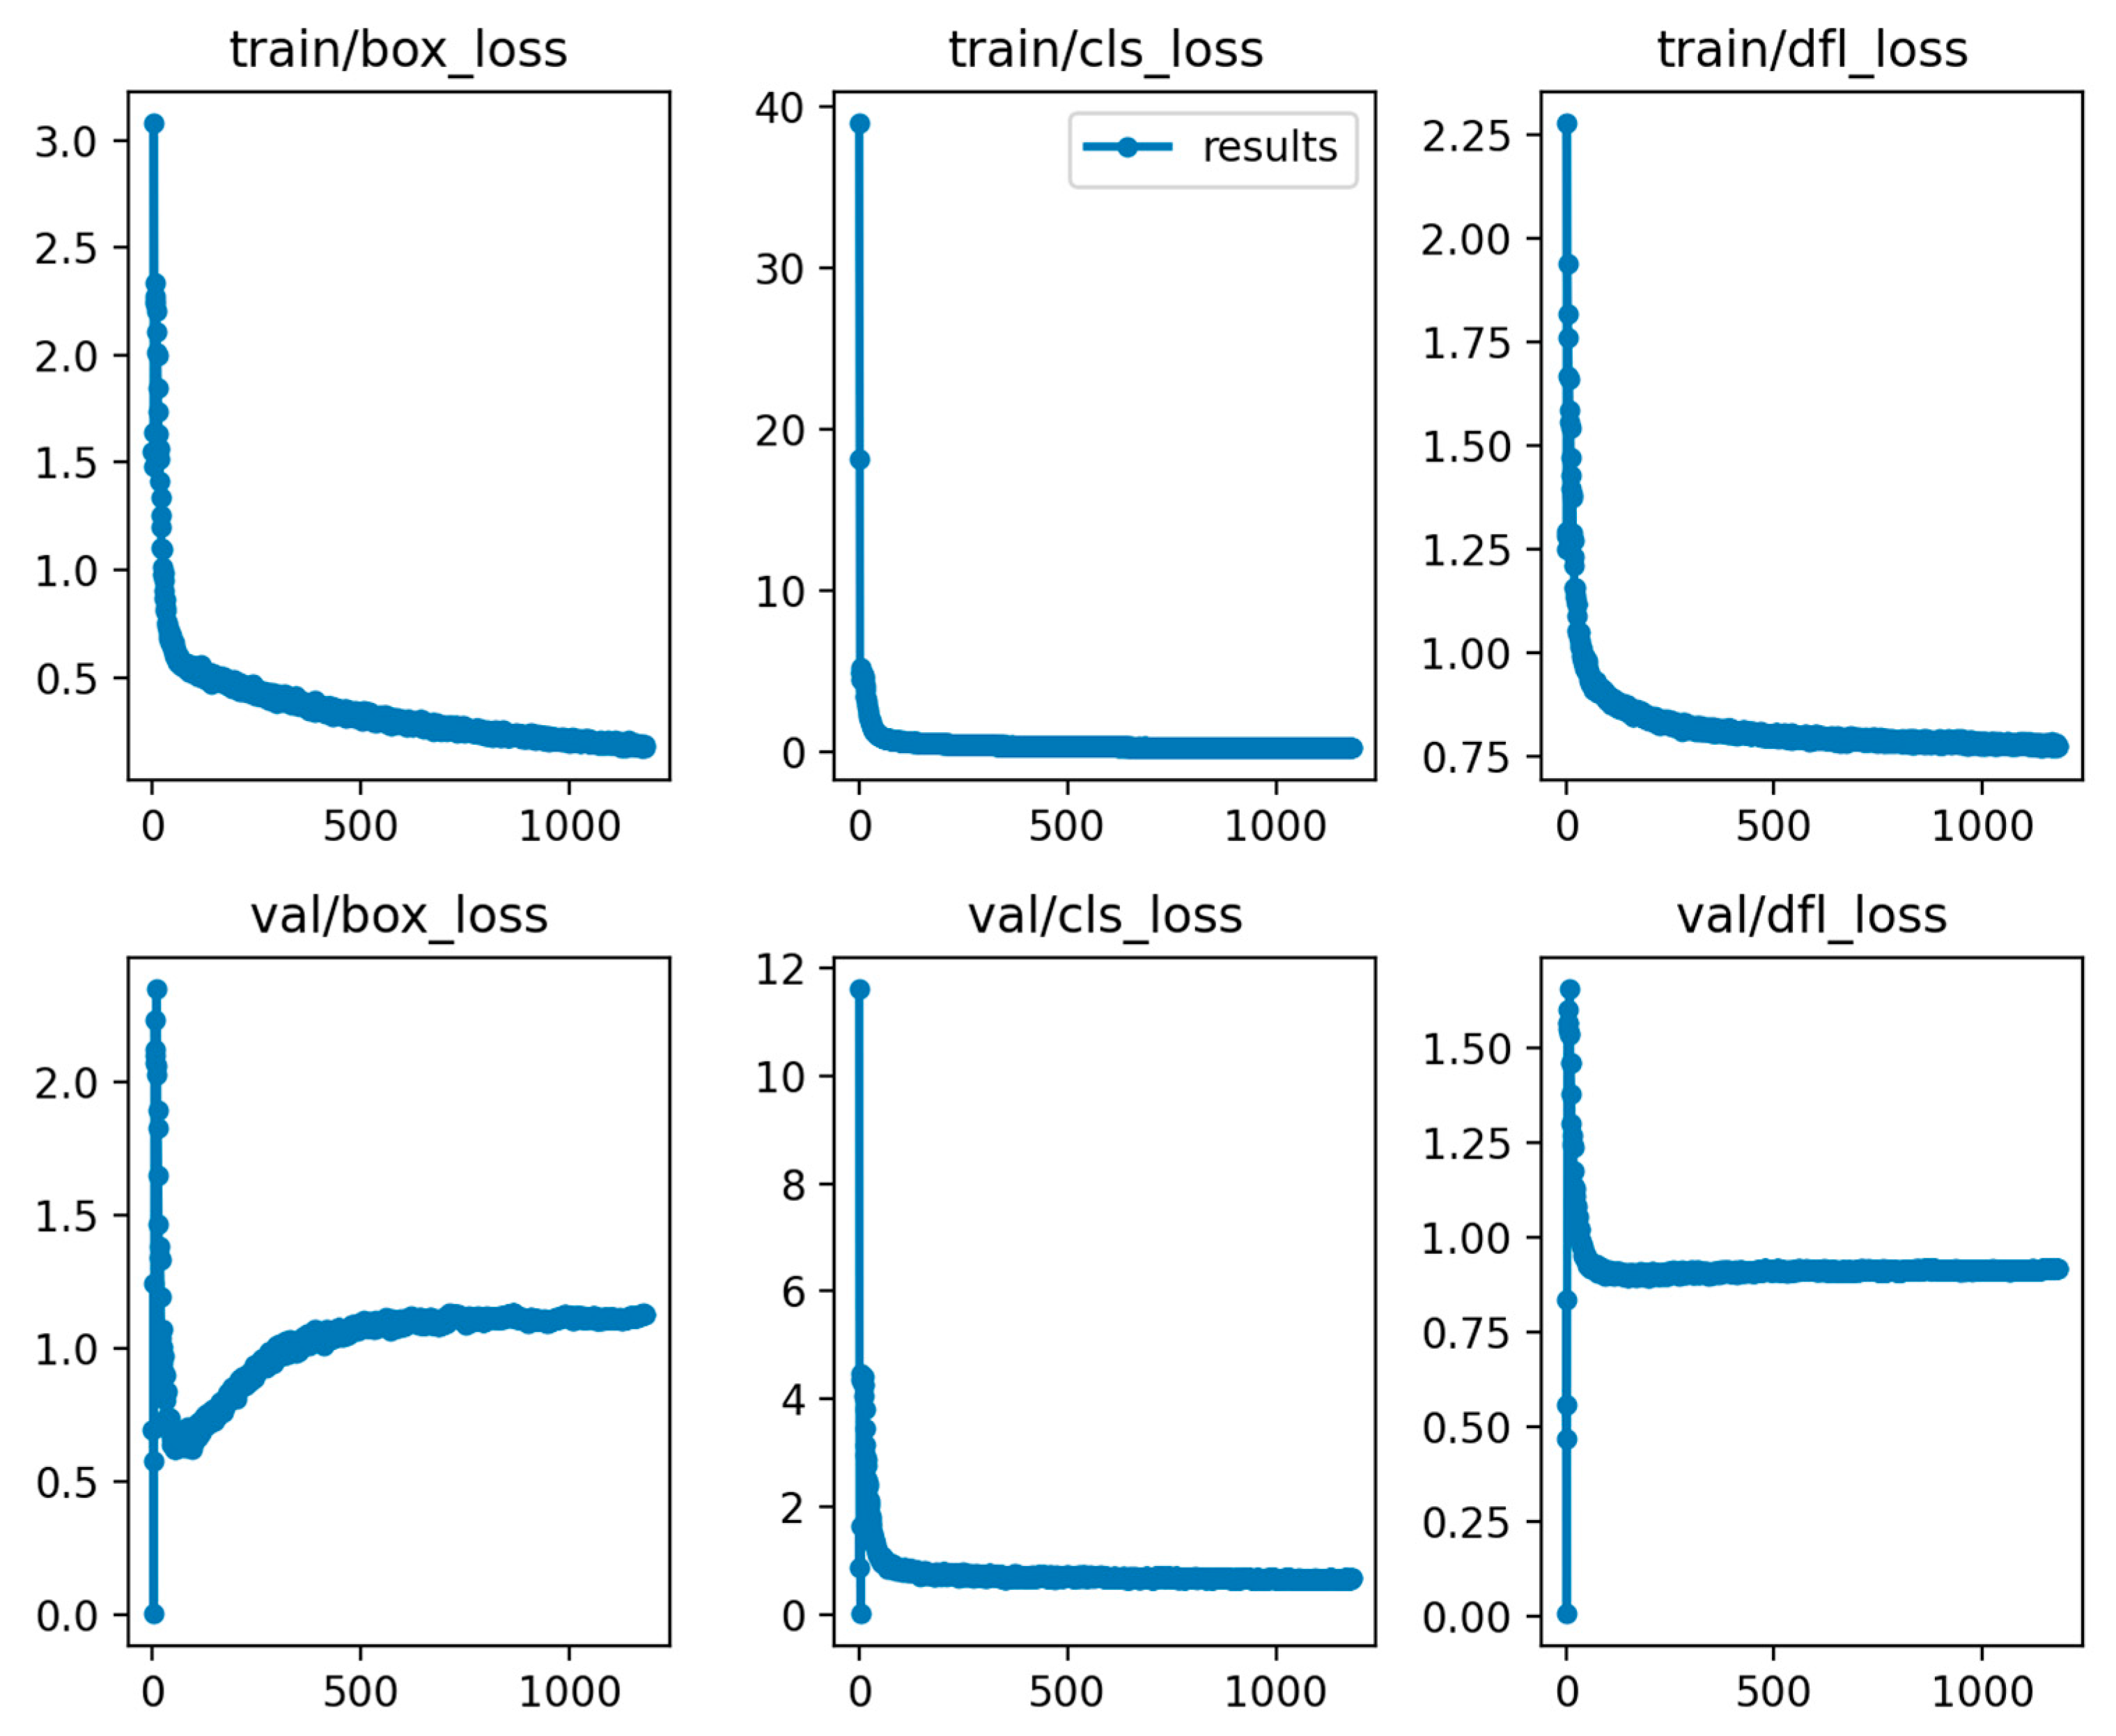
W–YOLOv8 set up 1000 epochs of testing on the training set. Figure 10 shows the loss curve during training; the loss includes box_loss, obj_loss, and cls_loss, which were formed during the training process and the verification process. As the number of iterations gradually increases, the loss value of the model gradually decreases. At the beginning of training, the loss rate of the model is still very high, but due to the use of a higher learning rate, the loss curve converges quickly. About 60 iterations later, the loss rate curve slowly converges, and as the number of rounds continues to increase, the curve tends to stabilize. After training, only the best weights from the training process and the final weights are retained.
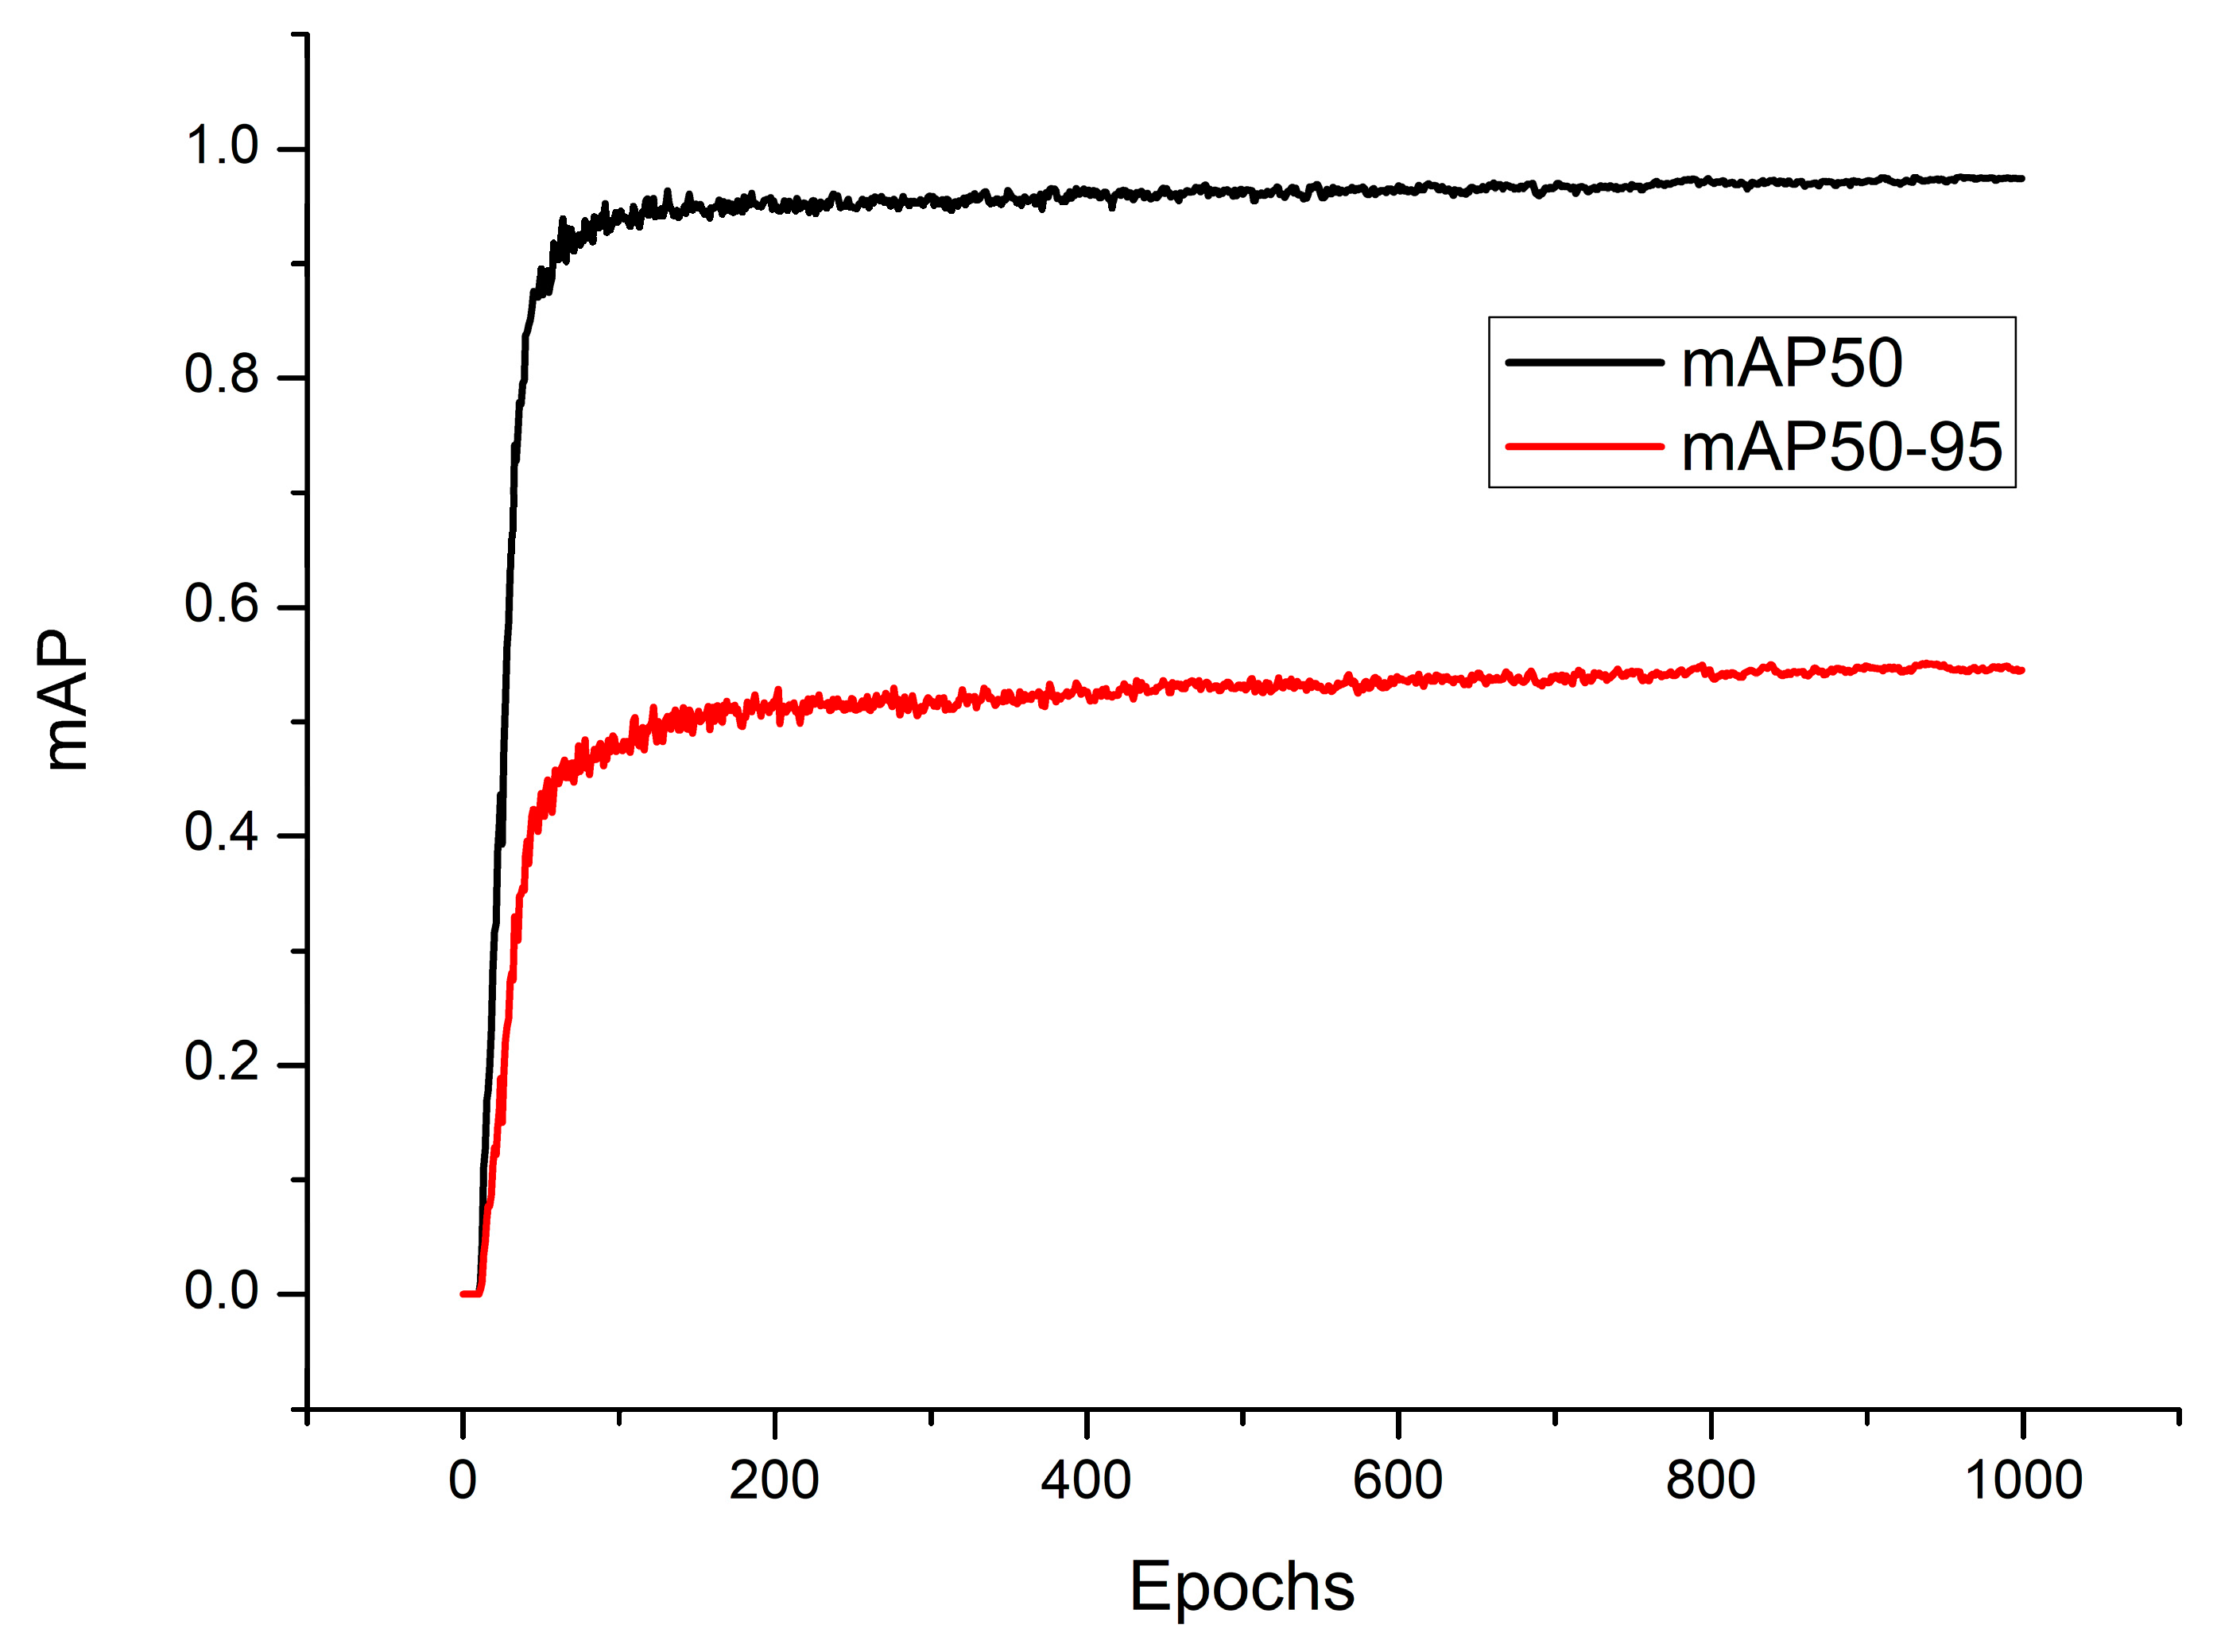
Figure 11 shows the change in mAP during the training process of the model, and it can be seen from the figure that with the increase in training rounds, mAP shows an increasing trend and eventually tends to stabilize.
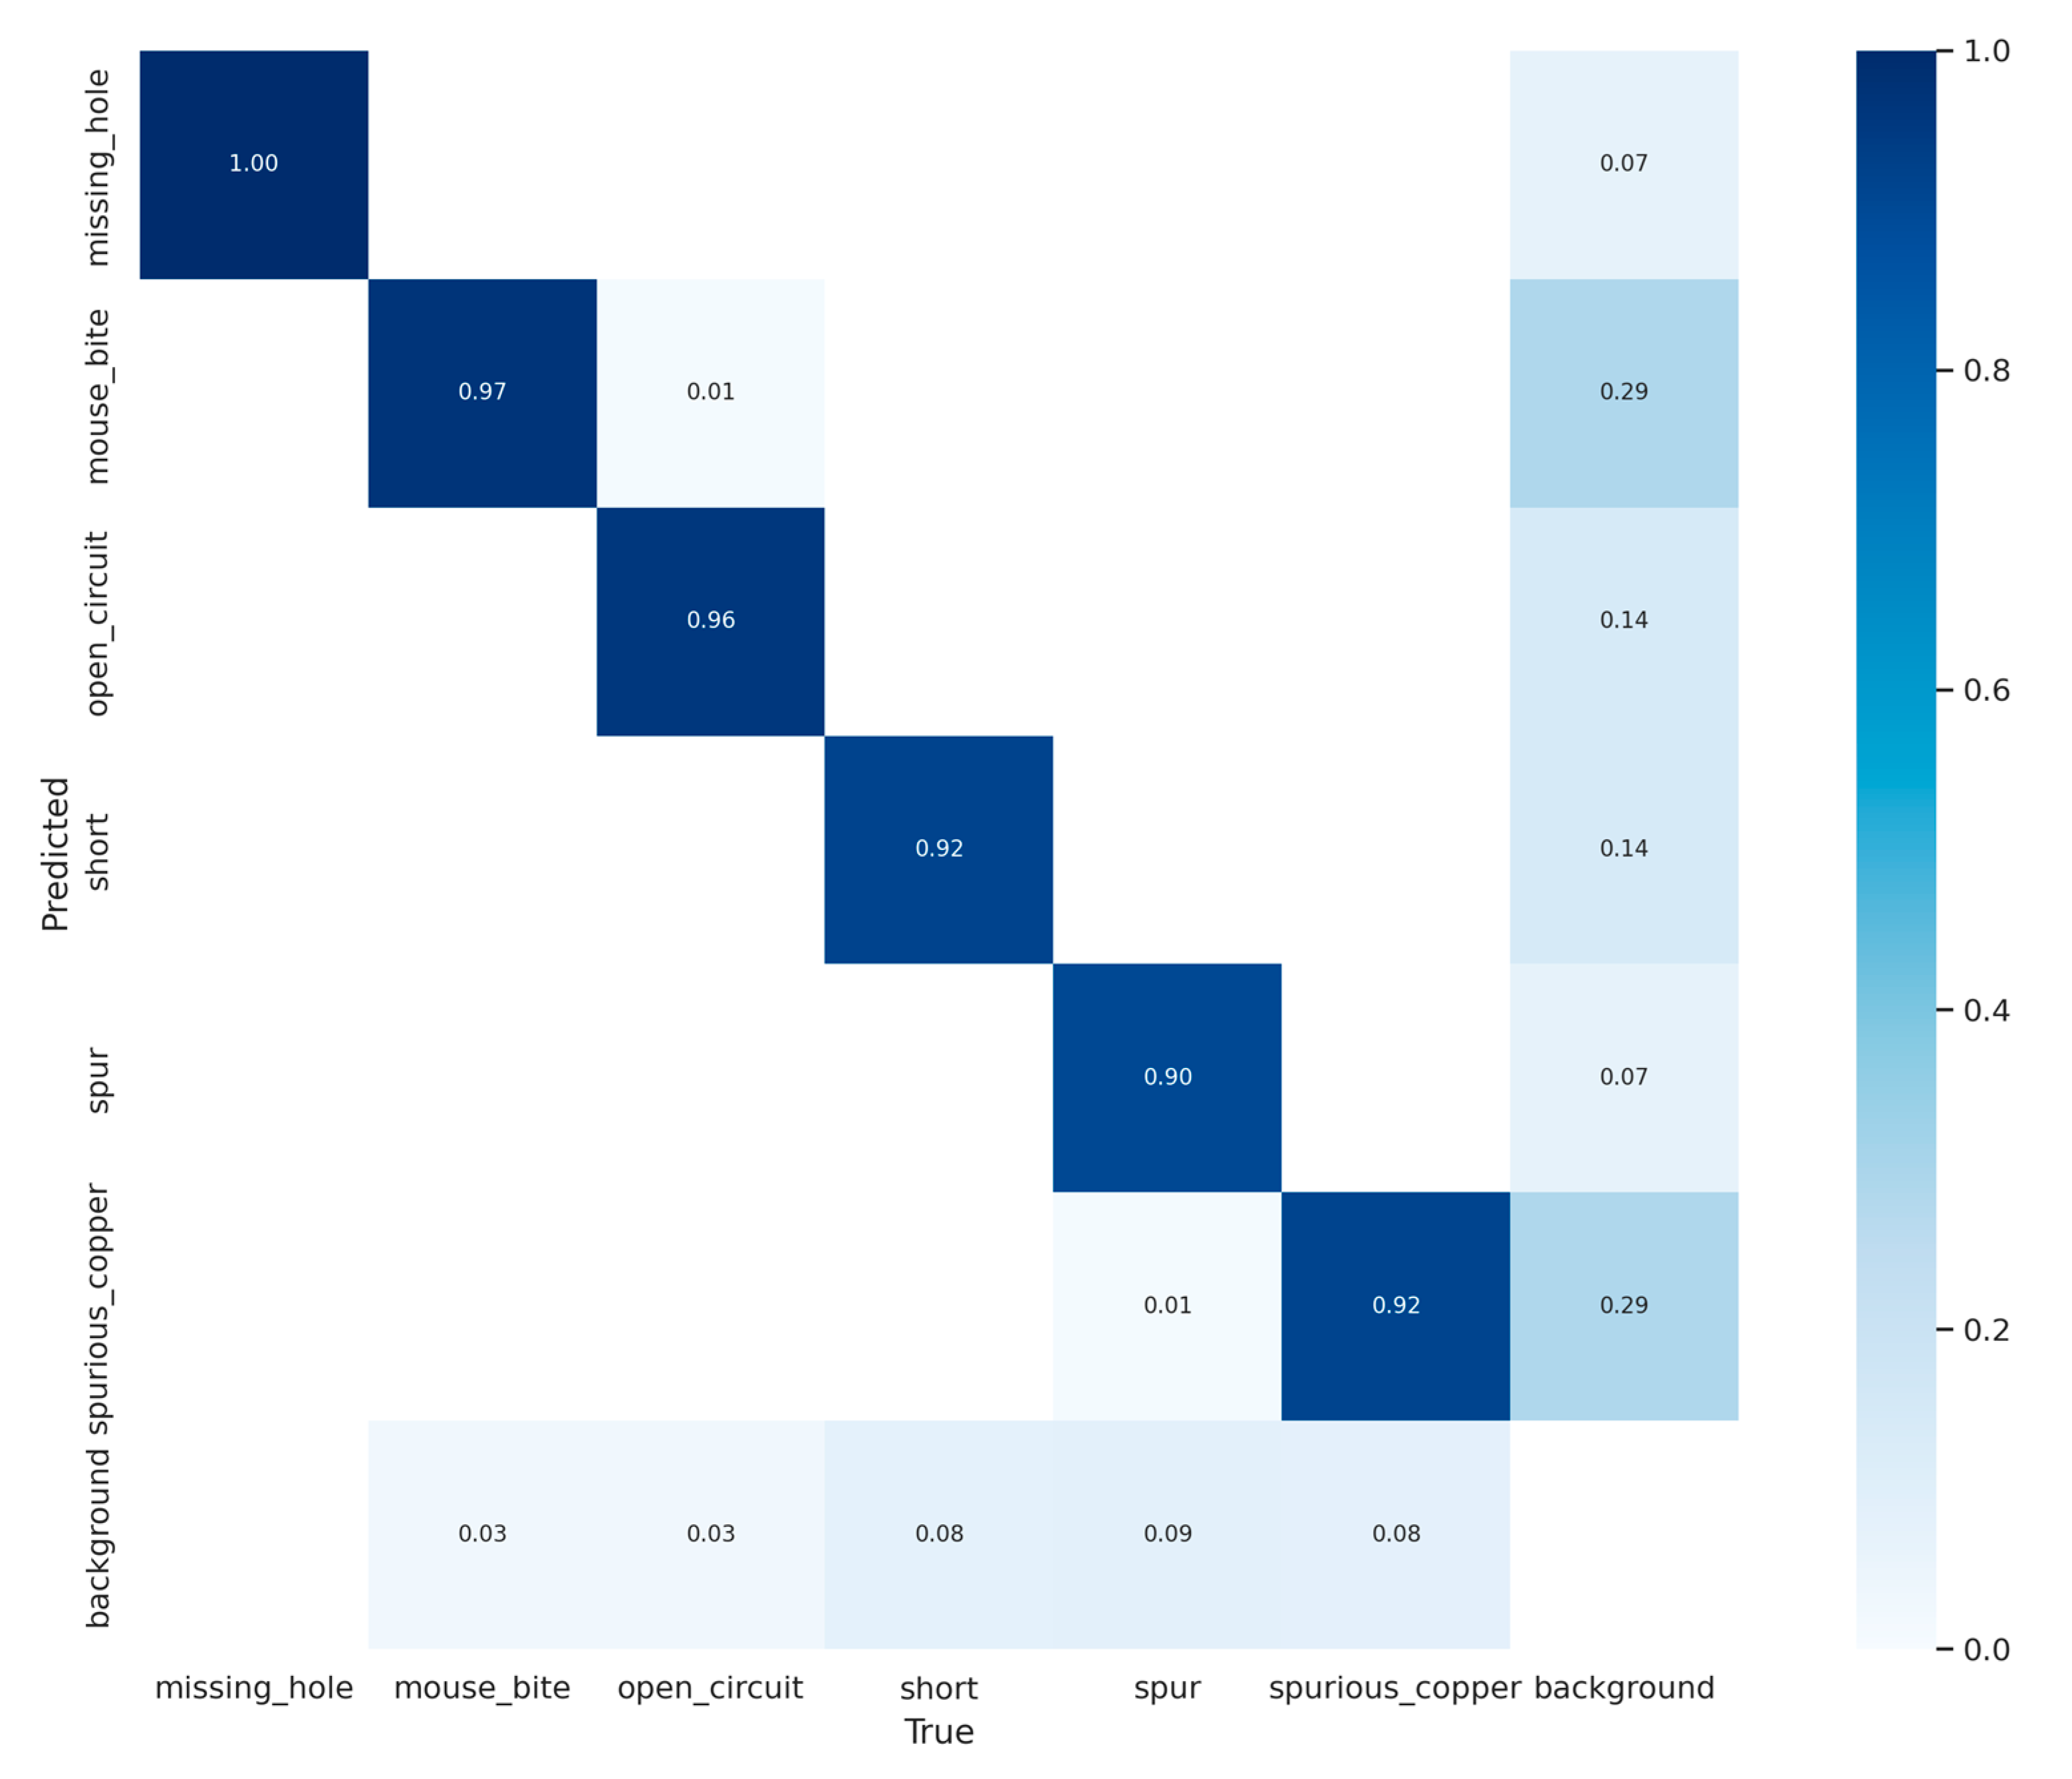
The confusion matrix in Figure 12 shows that the accuracy of the model exceeds 90% for each type, indicating that the model has better performance in small target defect detection. The confusion matrix offers a comprehensive overview of classification results in model evaluation, allowing for not only the observation of correctly classified instances but also the clear identification of misclassifications. Through the confusion matrix, several key performance metrics such as accuracy, recall, precision, and F1 score, can be calculated, enabling a more thorough assessment of the model’s performance.
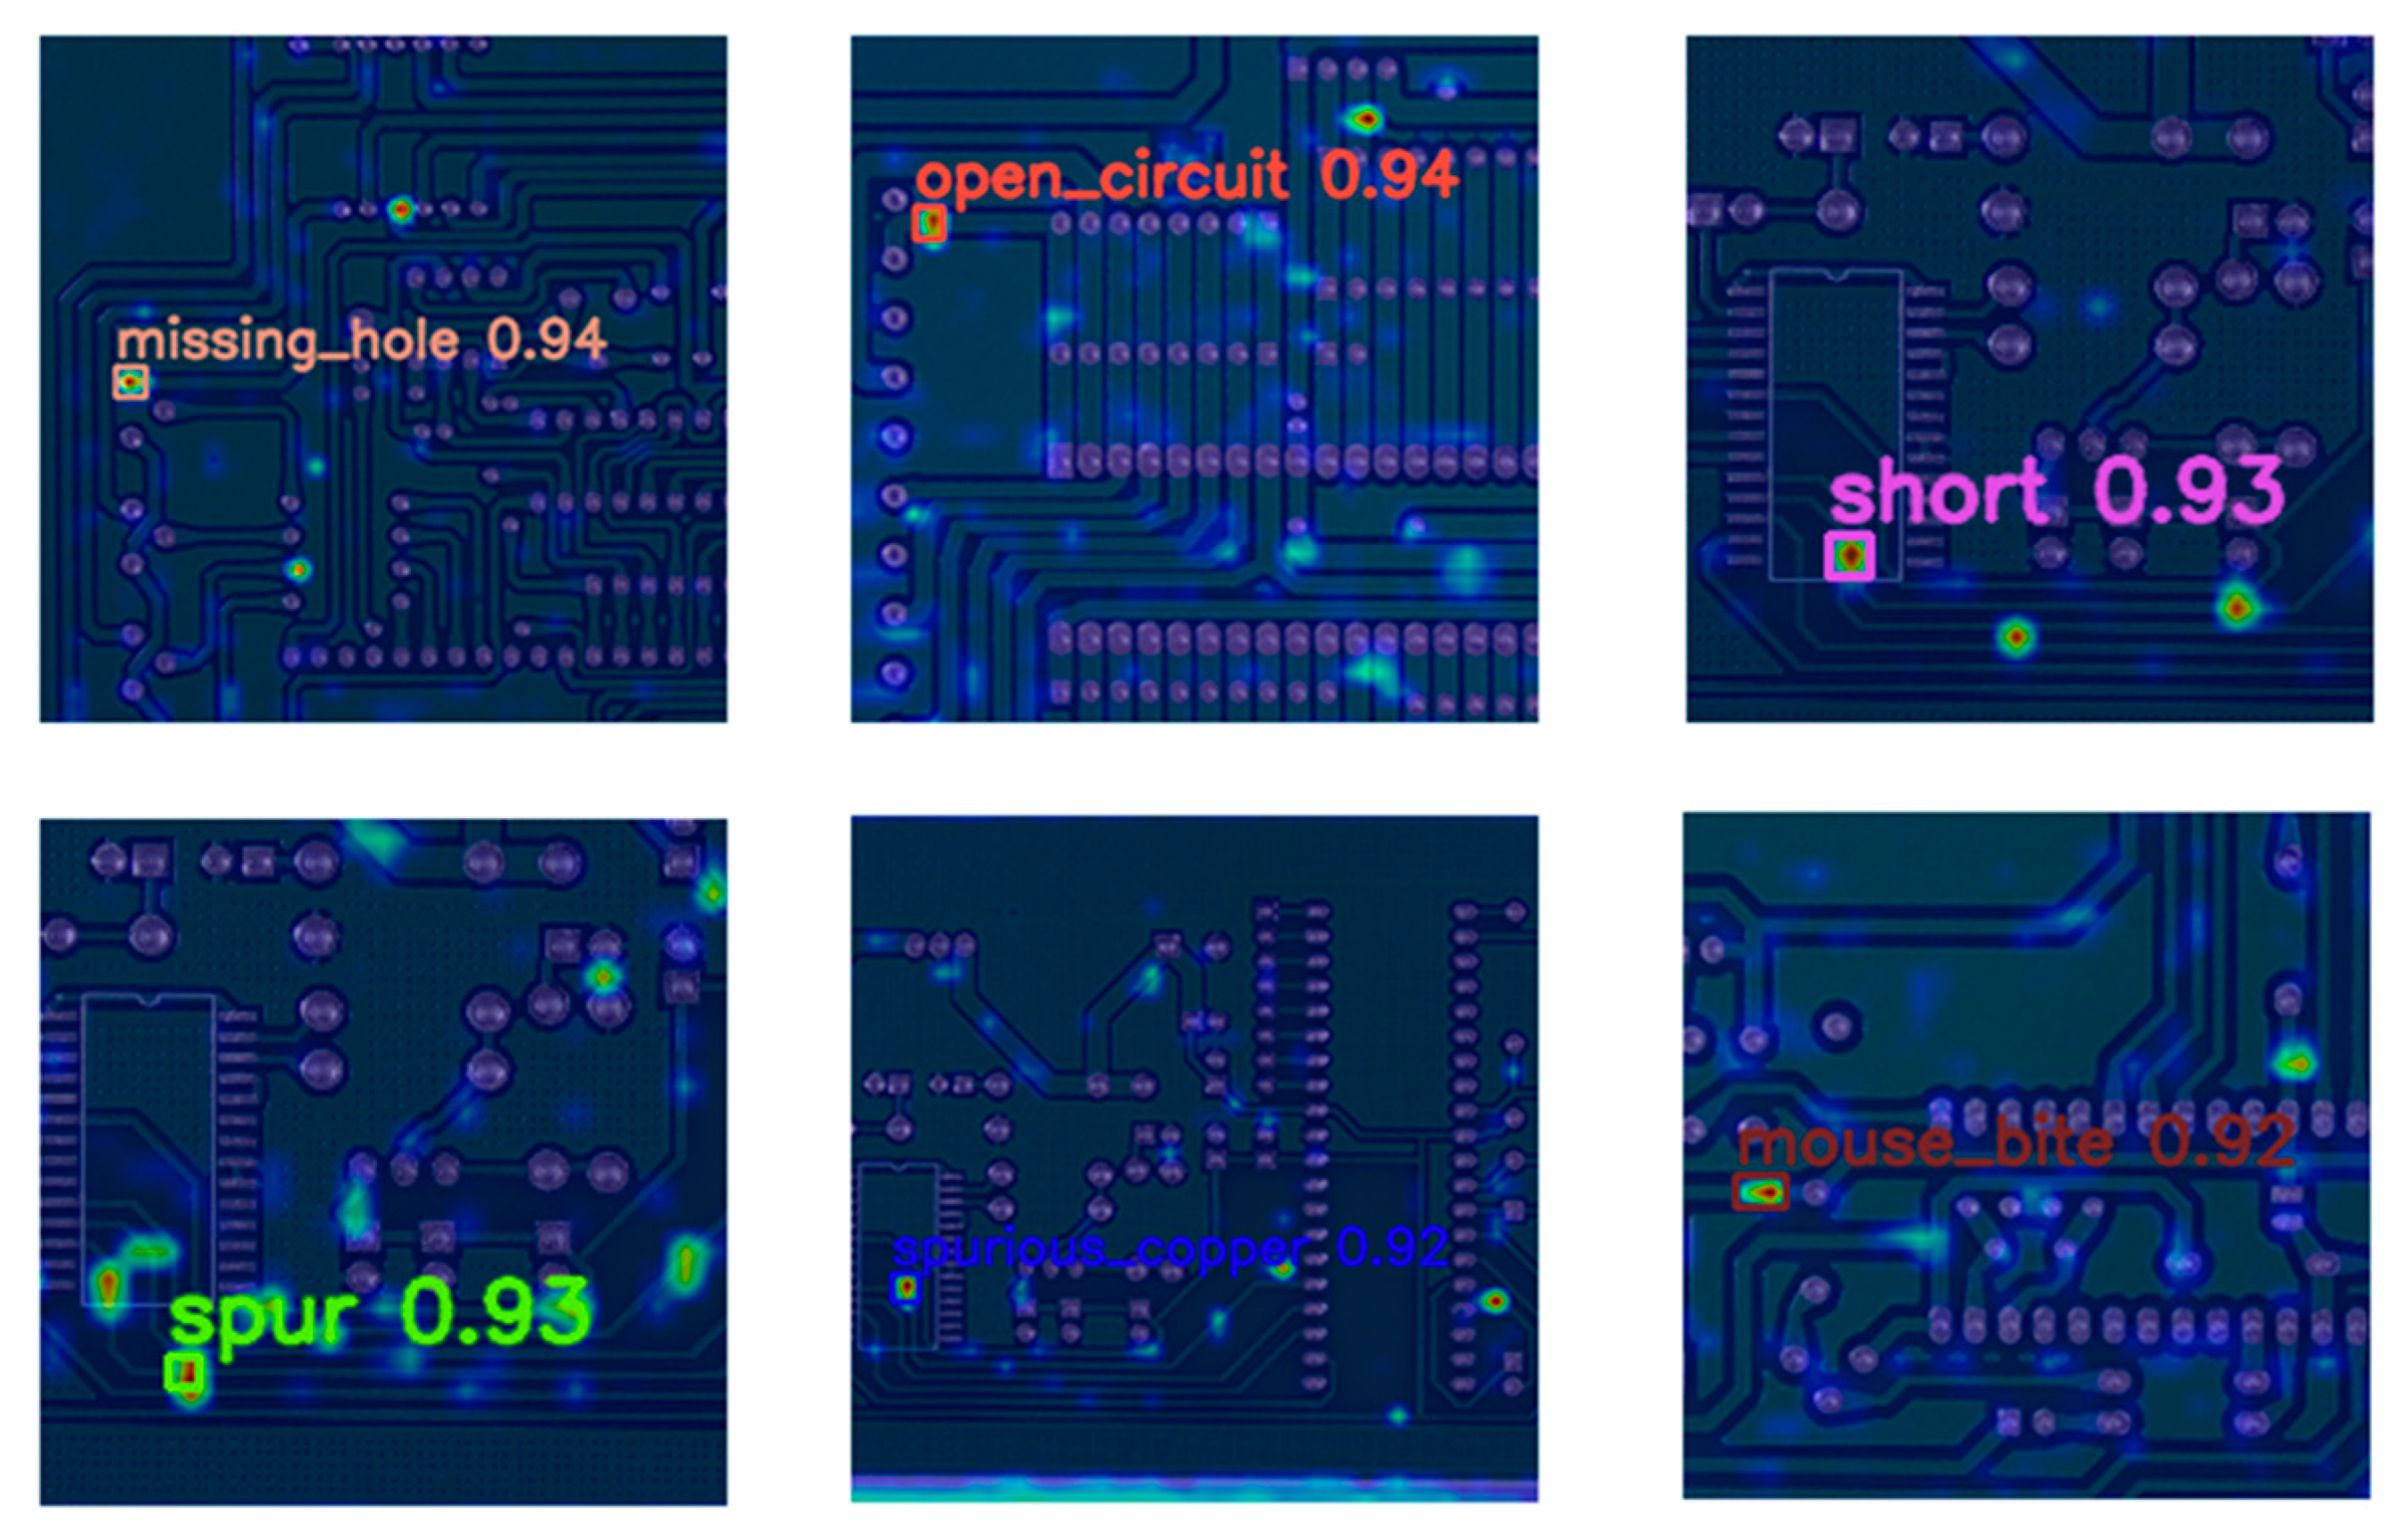
W–YOLOv8 activates the middle output layer of the convolutional network, visualizes the output of each layer of the convolutional network, inputs the original data and repeatedly transforms them, filters irrelevant information, enlarges and refines useful information, and uses a specific output. The category-related two-dimensional score network is calculated for each position of any input image to indicate the importance of each position to the category and finally expresses the visual results of the model in the form of a heat map in terms of feature extraction. Figure 13 shows the results of the W–YOLOv8 output in the 15-layer convolutional network layer. It can be seen from the figure that the focus points of the heat map are all concentrated in the target detection area, indicating that the model is effective in extracting small target features.

4. Conclusions

As crucial components in electronic devices, optical sensors and circuitry convert optical signals into electrical ones. Even minute defects could lead to performance degradation or even complete failure of such circuits. Therefore, defect detection in optical sensors and optical device circuits is of great importance. Under the guidance of the design idea of a one-stage approach based on the latest YOLOv8 algorithm of the current YOLO series, this paper introduces Wise-Iou, optimizes the performance of the model by using the gradient gain allocation strategy of a dynamic non-monotonic focusing mechanism, and proposes to change the W–YOLOv8 model algorithm of YOLOv8 to train the dataset without increasing the dataset material. Through experimental data, it is shown that W–YOLOv8 has better performance in precision, recall, and the mAP value. The mAP50 is 97.3%, which is 1.35% higher than that of YOLOv8, and the mAP50-95 is 55.4%, which is 3.94% higher than that of YOLOv8. The performance of the original YOLOv8 is improved and the real-time detection of six kinds of surface defects, such as missing hole, mouse bite, open-circuit, short, spur, and spurious copper, on printed circuit boards is realized. It provides a new way of thinking and method for defect detection as well as a certain reference for solving the production of PCBs for optical sensors and optical devices.

Author Contributions

Conceptualization, P.C. and F.X.; methodology, P.C. and F.X.; software, P.C.; validation, P.C.; formal analysis, P.C.; investigation, P.C.; resources, P.C.; data curation, P.C.; writing—original draft preparation, P.C.; writing—review and editing, F.X.; visualization, P.C.; supervision, F.X.; project administration, F.X. All authors have read and agreed to the published version of the manuscript.

Funding

This research received no external funding.

Institutional Review Board Statement

Not applicable.

Informed Consent Statement

Not applicable.

Data Availability Statement

The publicly archived PCB defects dataset NEU-DET can be download using the following link: https://robotics.pkusz.edu.cn/resources/dataset/, accessed on 2 March 2023.

Conflicts of Interest

The authors declare no conflict of interest.

References

  1. Fridman, Y.; Rusanovsky, M.; Oren, G. ChangeChip: A Reference-Based Unsupervised Change Detection for PCB Defect Detection. In Proceedings of the 2021 IEEE International Conference on Physical Assurance and Inspection on Electronics, PAINE 2021, Virtual, 30 November–2 December 2021. [Google Scholar]
  2. Ibrahim, I.; Ibrahim, Z.; Khalil, K.; Mokji, M.M.; Abu-Bakar, S.A.R.S. An Algorithm for Classification of Five Types of Defects on Bare Printed Circuit Board. Int. J. Comput. Sci. Eng. Syst. 2018, 13, 57–64. [Google Scholar]
  3. Putera, S.; Ibrahim, Z. In Printed circuit board defect detection using mathematical morphology and MATLAB image processing tools. In Proceedings of the 2010 2nd International Conference on Education Technology and Computer, Shanghai, China, 22–24 June 2010. [Google Scholar]
  4. Xie, L.; Rui, H.; Cao, Z. In Detection and Classification of Defect Patterns in Optical Inspection Using Support Vector Machines. In Proceedings of the 9th International Conference on Intelligent Computing Theories, Nanning, China, 28–31 July 2013. [Google Scholar]
  5. Wan, Y.; Gao, L.; Li, X.; Gao, Y. Semi-Supervised Defect Detection Method with Data-Expanding Strategy for PCB Quality Inspection. Sensors 2022, 22, 7971. [Google Scholar] [CrossRef]
  6. Pham, T.T.A.; Thoi, D.K.T.; Choi, H.; Park, S. Defect Detection in Printed Circuit Boards Using Semi-Supervised Learning. Sensors 2023, 23, 3246. [Google Scholar] [CrossRef] [PubMed]
  7. Park, J.H.; Kim, Y.S.; Seo, H.; Cho, Y.J. Analysis of Training Deep Learning Models for PCB Defect Detection. Sensors 2023, 23, 2766. [Google Scholar] [CrossRef]
  8. Bhattacharya, A.; Cloutier, S.G. End-to-end deep learning framework for printed circuit board manufacturing defect classification. Sci. Rep. 2022, 12, 12559. [Google Scholar] [CrossRef]
  9. Li, J.; Gu, J.; Huang, Z.; Wen, J. Application research of improved YOLO V3 algorithm in PCB electronic component detection. Appl. Sci. 2019, 9, 3750. [Google Scholar] [CrossRef]
  10. Wang, Y.; Guan, Y.; Liu, H.; Jin, L.; Li, X.; Guo, B.; Zhang, Z. VV-YOLO: A Vehicle View Object Detection Model Based on Improved YOLOv4. Sensors 2023, 23, 3385. [Google Scholar] [CrossRef]
  11. Huang, W.; Wei, P. A PCB dataset for defects detection and classification. arXiv 2016, arXiv:1901.08204. [Google Scholar]
  12. Gaidhane, V.H.; Hote, Y.V.; Singh, V. An efficient similarity measure approach for PCB surface defect detection. Pattern Anal. Appl. 2018, 21, 277–289. [Google Scholar] [CrossRef]
  13. Liu, Z.; Qu, B. Machine vision based online detection of PCB defect. Microprocess. Microsyst. 2021, 82, 103807. [Google Scholar] [CrossRef]
  14. Ling, Q.; Isa, N.A.M. Printed Circuit Board Defect Detection Methods Based on Image Processing, Machine Learning and Deep Learning: A Survey. IEEE Access 2023, 11, 15921–15944. [Google Scholar] [CrossRef]
  15. Farhan, A.; Saputra, F.; Suryanto, M.E.; Humayun, F.; Pajimna, R.M.B.; Vasquez, R.D.; Roldan, M.J.M.; Audira, G.; Lai, H.T.; Lai, Y.H.; et al. OpenBloodFlow: A User-Friendly OpenCV-Based Software Package for Blood Flow Velocity and Blood Cell Count Measurement for Fish Embryos. Biology 2022, 11, 1471. [Google Scholar] [CrossRef]
  16. Wahab, F.; Ullah, I.; Shah, A.; Khan, R.A.; Choi, A.; Anwar, M.S. Design and implementation of real-time object detection system based on single-shoot detector and OpenCV. Front. Psychol. 2022, 13, 1039645. [Google Scholar] [CrossRef]
  17. Farhan, A.; Kurnia, K.A.; Saputra, F.; Chen, K.H.; Huang, J.C.; Roldan, M.J.M.; Lai, Y.H.; Hsiao, C.D. An OpenCV-Based Approach for Automated Cardiac Rhythm Measurement in Zebrafish from Video Datasets. Biomolecules 2021, 11, 1476. [Google Scholar] [CrossRef]
  18. Lin, Q.; Li, S.; Wang, R.; Wang, Y.; Zhou, F.; Chen, Z.; Guo, N. Research on Small Target Detection Technology Based on the MPH-SSD Algorithm. Comput. Intell. Neurosci. 2022, 2022, 9654930. [Google Scholar] [CrossRef]
  19. Zhang, Q.; Hu, X.; Yue, Y.; Gu, Y.; Sun, Y. Multi-object detection at night for traffic investigations based on improved SSD framework. Heliyon 2022, 8, e11570. [Google Scholar] [CrossRef] [PubMed]
  20. Wang, D.; He, D. Apple detection and instance segmentation in natural environments using an improved Mask Scoring R-CNN Model. Front. Plant Sci. 2022, 13, 1016470. [Google Scholar] [CrossRef]
  21. Lee, Y.S.; Park, W.H. Diagnosis of Depressive Disorder Model on Facial Expression Based on Fast R-CNN. Diagnostics 2022, 12, 317. [Google Scholar] [CrossRef]
  22. Youssouf, N. Traffic sign classification using CNN and detection using faster-RCNN and YOLOV4. Heliyon 2022, 8, e11792. [Google Scholar] [CrossRef]
  23. Ruiz-Ponce, P.; Ortiz-Perez, D.; Garcia-Rodriguez, J.; Kiefer, B. POSEIDON: A Data Augmentation Tool for Small Object Detection Datasets in Maritime Environments. Sensors 2023, 23, 3691. [Google Scholar] [CrossRef]
  24. Jiang, P.; Ergu, D.; Liu, F.; Cai, Y.; Ma, B. A Review of Yolo algorithm developments. Procedia Comput. Sci. 2022, 199, 1066–1073. [Google Scholar] [CrossRef]
  25. Jiang, X.; Hu, H.; Liu, X.; Ding, R.; Xu, Y.; Shi, J.; Du, Y.; Da, C. A smoking behavior detection method based on the YOLOv5 network. J. Phys. Conf. Ser. 2022, 2232, 012001. [Google Scholar] [CrossRef]
  26. Ren, F.; Zhang, Y.; Liu, X.; Zhang, Y.; Liu, Y.; Zhang, F. Identification of Plant Stomata Based on YOLO v5 Deep Learning Model. In Proceedings of the CSAI 2021: 2021 5th International Conference on Computer Science and Artificial Intelligence, Beijing, China, 4–6 December 2021. [Google Scholar]
  27. Wu, T.H.; Wang, T.W.; Liu, Y.Q. Real-Time Vehicle and Distance Detection Based on Improved Yolo v5 Network. In Proceedings of the 3rd World Symposium on Artificial Intelligence, Guangzhou, China, 18–20 June 2021. [Google Scholar]
  28. Qiu, M.; Huang, L.; Tang, B.-H. Bridge detection method for HSRRSIs based on YOLOv5 with a decoupled head. Int. J. Digit. Earth 2023, 16, 113–129. [Google Scholar] [CrossRef]
  29. Wang, H.; Jin, Y.; Ke, H.; Zhang, X. DDH-YOLOv5: Improved YOLOv5 based on Double IoU-aware Decoupled Head for object detection. J. Real-Time Image Process. 2022, 19, 1023–1033. [Google Scholar] [CrossRef]
  30. Qiu, M.; Huang, L.; Tang, B.-H. ASFF-YOLOv5: Multielement detection method for road traffic in UAV images based on multiscale feature fusion. Remote Sens. 2022, 14, 3498. [Google Scholar] [CrossRef]
  31. Xue, Z.; Lin, H.; Wang, F. A small target forest fire detection model based on YOLOv5 improvement. Forests 2022, 13, 1332. [Google Scholar] [CrossRef]
  32. Tang, H.; Liang, S.; Yao, D.; Qiao, Y. A visual defect detection for optics lens based on the YOLOv5-C3CA-SPPF network model. Opt. Express 2023, 31, 2628–2643. [Google Scholar] [CrossRef] [PubMed]
  33. Rahman, M.A.; Wang, Y. In Optimizing intersection-over-union in deep neural networks for image segmentation. In International Symposium on Visual Computing; Springer: Berlin/Heidelberg, Germany, 2016; pp. 234–244. [Google Scholar]
  34. Jiang, K.; Itoh, H.; Oda, M.; Okumura, T.; Mori, Y.; Misawa, M.; Hayashi, T.; Kudo, S.E.; Mori, K. Gaussian affinity and GIoU-based loss for perforation detection and localization from colonoscopy videos. Int. J. Comput. Assist. Radiol. Surg. 2023, 18, 795–805. [Google Scholar] [CrossRef] [PubMed]
  35. Chen, Y.; Li, H.; Gao, R.; Zhao, D. Boost 3-D Object Detection via Point Clouds Segmentation and Fused 3-D GIoU-L(1) Loss. IEEE Trans. Neural Netw. Learn. Syst. 2022, 33, 762–773. [Google Scholar] [CrossRef] [PubMed]
  36. Xue, J.; Cheng, F.; Li, Y.; Song, Y.; Mao, T. Detection of Farmland Obstacles Based on an Improved YOLOv5s Algorithm by Using CIoU and Anchor Box Scale Clustering. Sensors 2022, 22, 1790. [Google Scholar] [CrossRef] [PubMed]
  37. Gao, J.; Chen, Y.; Wei, Y.; Li, J. Detection of Specific Building in Remote Sensing Images Using a Novel YOLO-S-CIOU Model. Case: Gas Station Identification. Sensors 2021, 21, 1375. [Google Scholar] [CrossRef] [PubMed]
  38. Tong, Z.; Chen, Y.; Xu, Z.; Yu, R. Wise-IoU: Bounding Box Regression Loss with Dynamic Focusing Mechanism. arXiv 2023, arXiv:2301.10051. [Google Scholar]
  39. Cho, Y.-J. Weighted Intersection over Union (wIoU): A New Evaluation Metric for Image Segmentation. arXiv 2021, arXiv:2107.09858. [Google Scholar]
  40. Huang, K.; Li, C.; Zhang, J.; Wang, B. Cascade and fusion: A deep learning approach for camouflaged object sensing. Sensors 2021, 21, 5455. [Google Scholar] [CrossRef] [PubMed]
  41. Zhao, Z.; Liu, X.; Hao, K.; Zheng, T.; Xu, J.; Cui, S. PIS-YOLO: Real-Time Detection for Medical Mask Specification in an Edge Device. Comput. Intell. Neurosci. 2022, 2022, 6170245. [Google Scholar] [CrossRef]
  42. Huang, L.; Huang, W. RD-YOLO: An Effective and Efficient Object Detector for Roadside Perception System. Sensors 2022, 22, 8097. [Google Scholar] [CrossRef]
  43. Wang, Y.; Wang, Y.; Zhao, J. MGA-YOLO: A lightweight one-stage network for apple leaf disease detection. Front. Plant Sci. 2022, 13, 927424. [Google Scholar] [CrossRef] [PubMed]
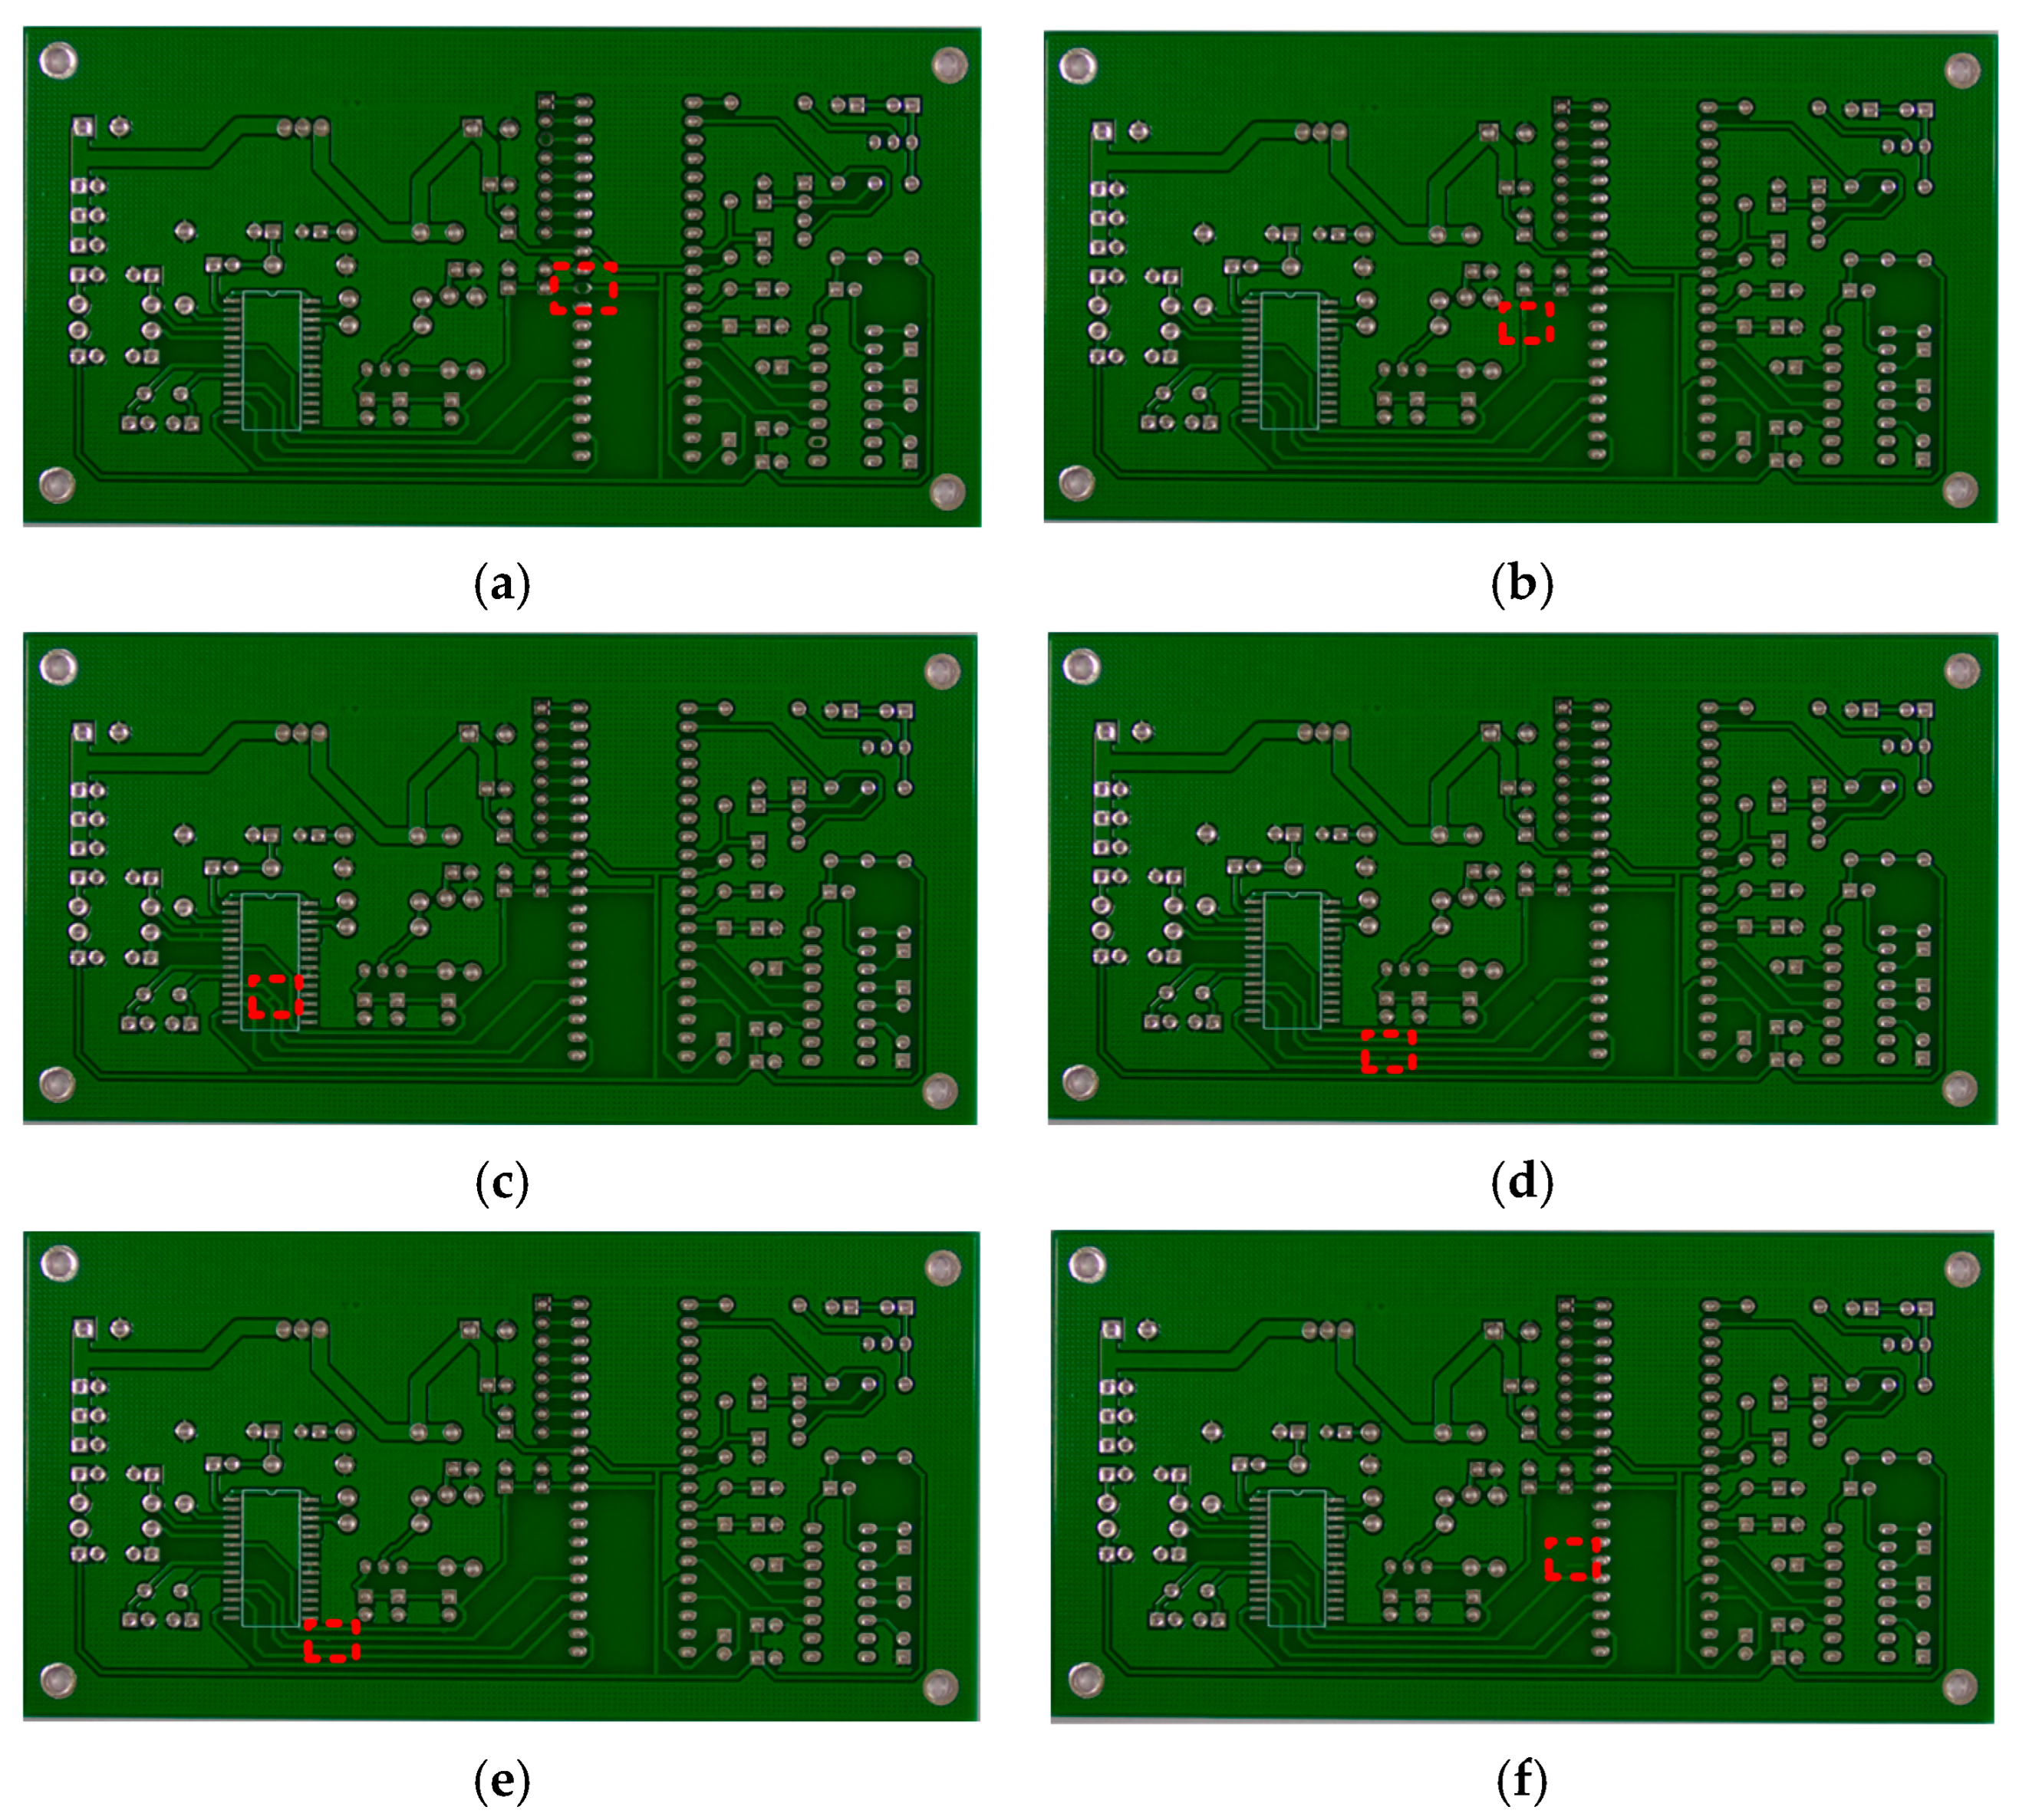
Figure 1. Examples of 6 types of defects. (a) Missing Hole; (b) Mouse Bite; (c) Open-Circuit; (d) Short; (e) Spur; (f) Spurious Copper.
Photonics 10 00984 g001
Figure 2. The flow chart of OpenCV processing.
Photonics 10 00984 g002
Figure 3. The flow chart of two different algorithms. (a) one-stage; (b) two-stage.
Photonics 10 00984 g003
Figure 4. YOLOv8 network structure diagram.
Photonics 10 00984 g004
Figure 5. C2f network structure diagram.
Photonics 10 00984 g005
Figure 6. Decoupled Head network structure diagram.
Photonics 10 00984 g006
Figure 7. SPPF network structure diagram.
Photonics 10 00984 g007
Figure 8. mAP curve of YOLOv8 and W–YOLOv8.
Photonics 10 00984 g008
Figure 9. Test results for six types of defect detection using YOLOv8 and W–YOLOv8. (a) W–YOLOv8; (b) YOLOv8.
Photonics 10 00984 g009
Figure 10. Loss curve during training and val in each epoch.
Photonics 10 00984 g010
Figure 11. mAP curve during training and val in each epoch.
Photonics 10 00984 g011
Figure 12. mAP curve during training and val in each epoch.
Photonics 10 00984 g012
Figure 13. Feature visualization for six types of defect detection.
Photonics 10 00984 g013
Table 1. The overview of the printed circuit board dataset.
CategoryCategoryNumber of Images
Missing Hole497115
Mouse Bite492115
Open-Circuit482116
Short491116
Spur488115
Spurious Copper503116
Total2953693
Table 2. Test result of YOLOv8 and W–YOLOv8 on the dataset.
ClassModelsPrecisionRecallmAP50mAP50-95
Missing holeYOLOv80.98310.9940.622
W–YOLOv80.9910.9920.619
Mouse biteYOLOv80.9640.9150.9450.497
W–YOLOv80.9370.9590.9590.511
Open-circuitYOLOv80.960.9540.9750.538
W–YOLOv80.9740.970.9880.584
ShortYOLOv80.9480.9530.9680.547
W–YOLOv80.9760.9620.9750.566
SpurYOLOv80.9730.8940.9190.473
W–YOLOv80.980.9230.960.497
Spurious copperYOLOv80.9620.9420.960.524
W–YOLOv80.9450.9480.9670.548
Disclaimer/Publisher’s Note: The statements, opinions and data contained in all publications are solely those of the individual author(s) and contributor(s) and not of MDPI and/or the editor(s). MDPI and/or the editor(s) disclaim responsibility for any injury to people or property resulting from any ideas, methods, instructions or products referred to in the content.